

Utilizing RT-DETR Model for Fruit Calorie Estimation from Digital Images


Abstract
:1. Introduction
2. Materials and Methods
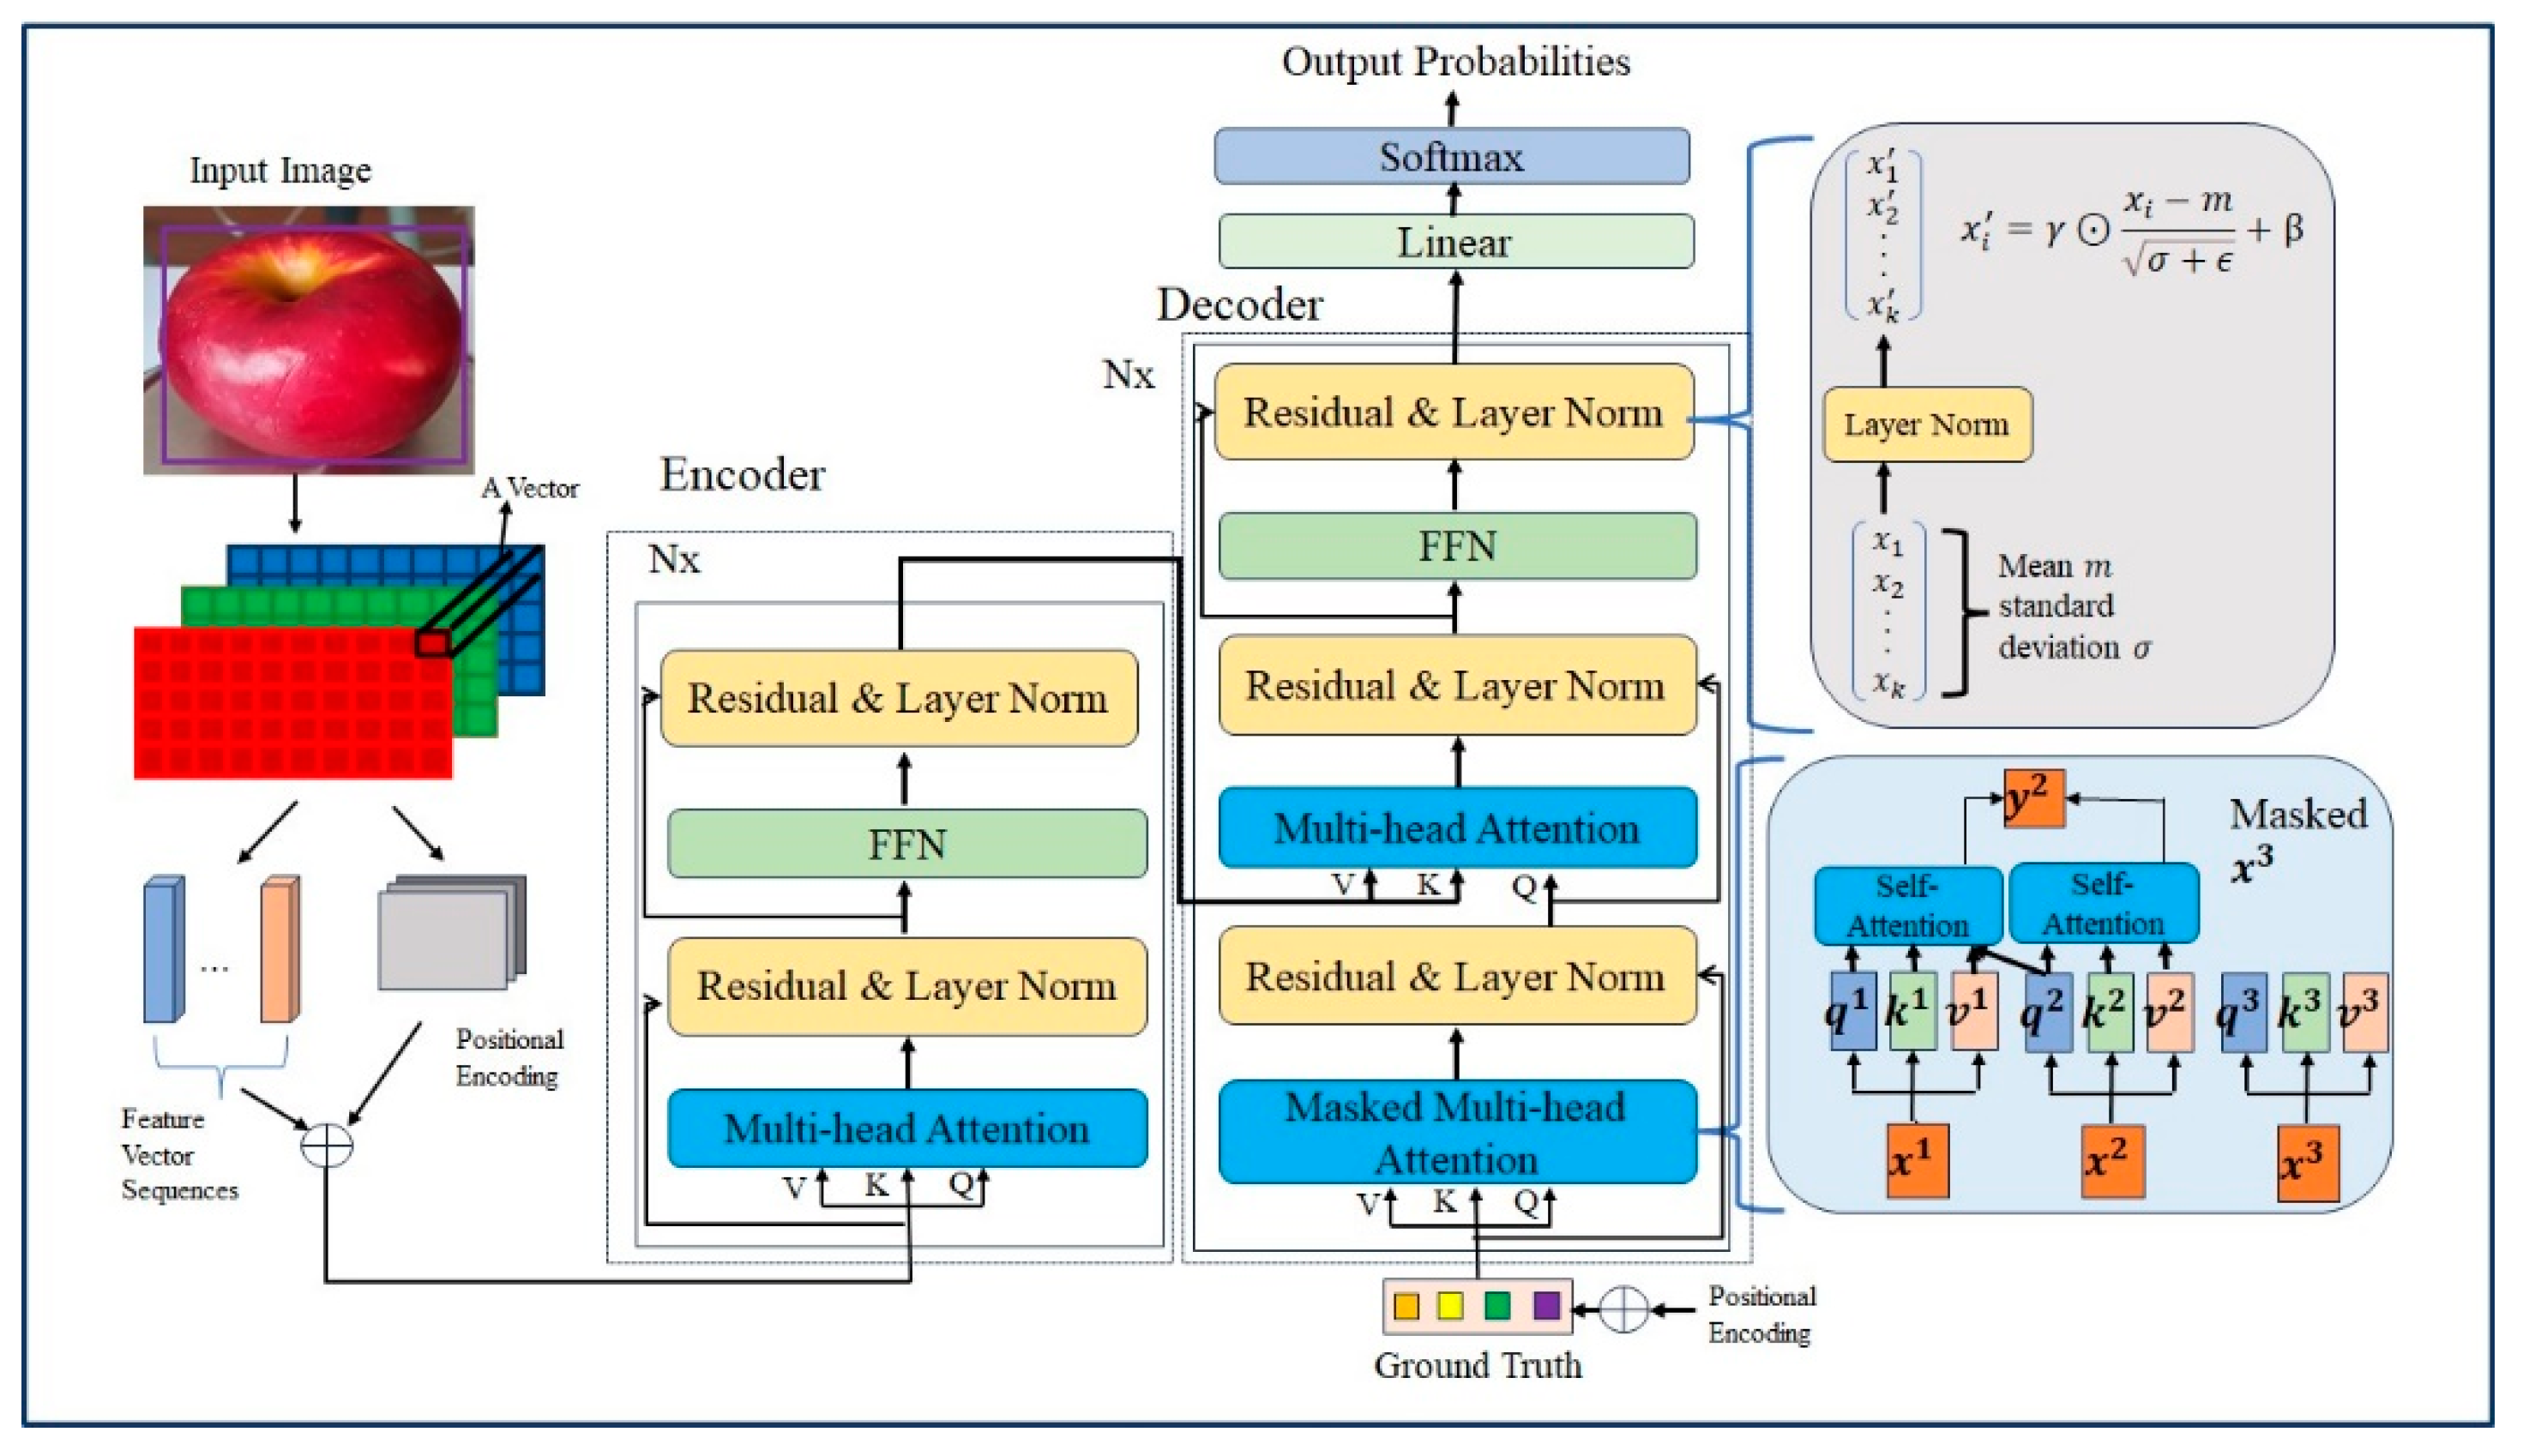
2.1. Transformer
2.2. DETR
2.3. Our Methods
2.3.1. Dataset
Data Collection
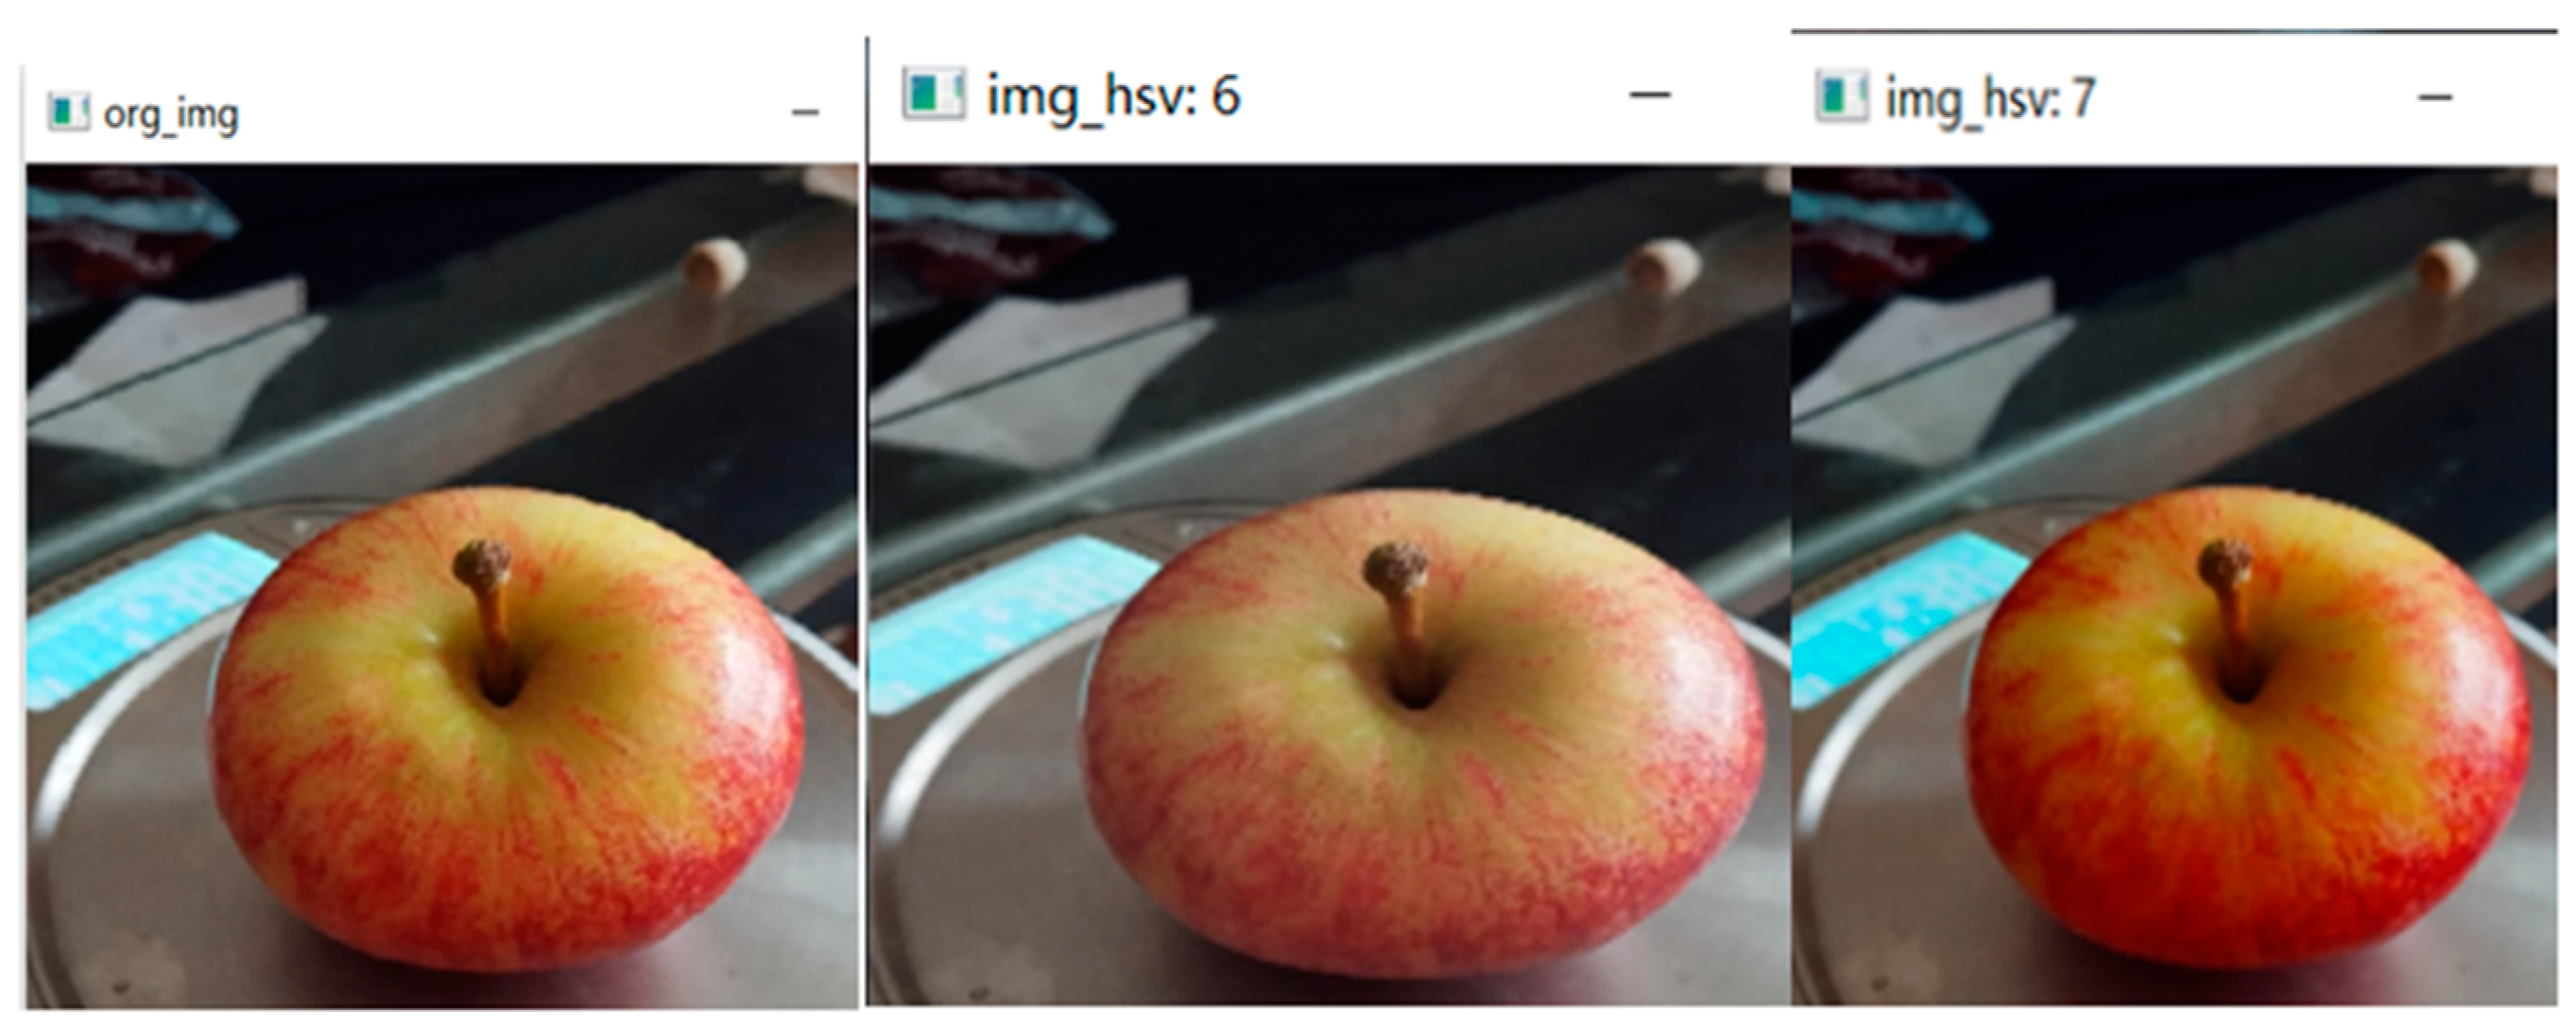
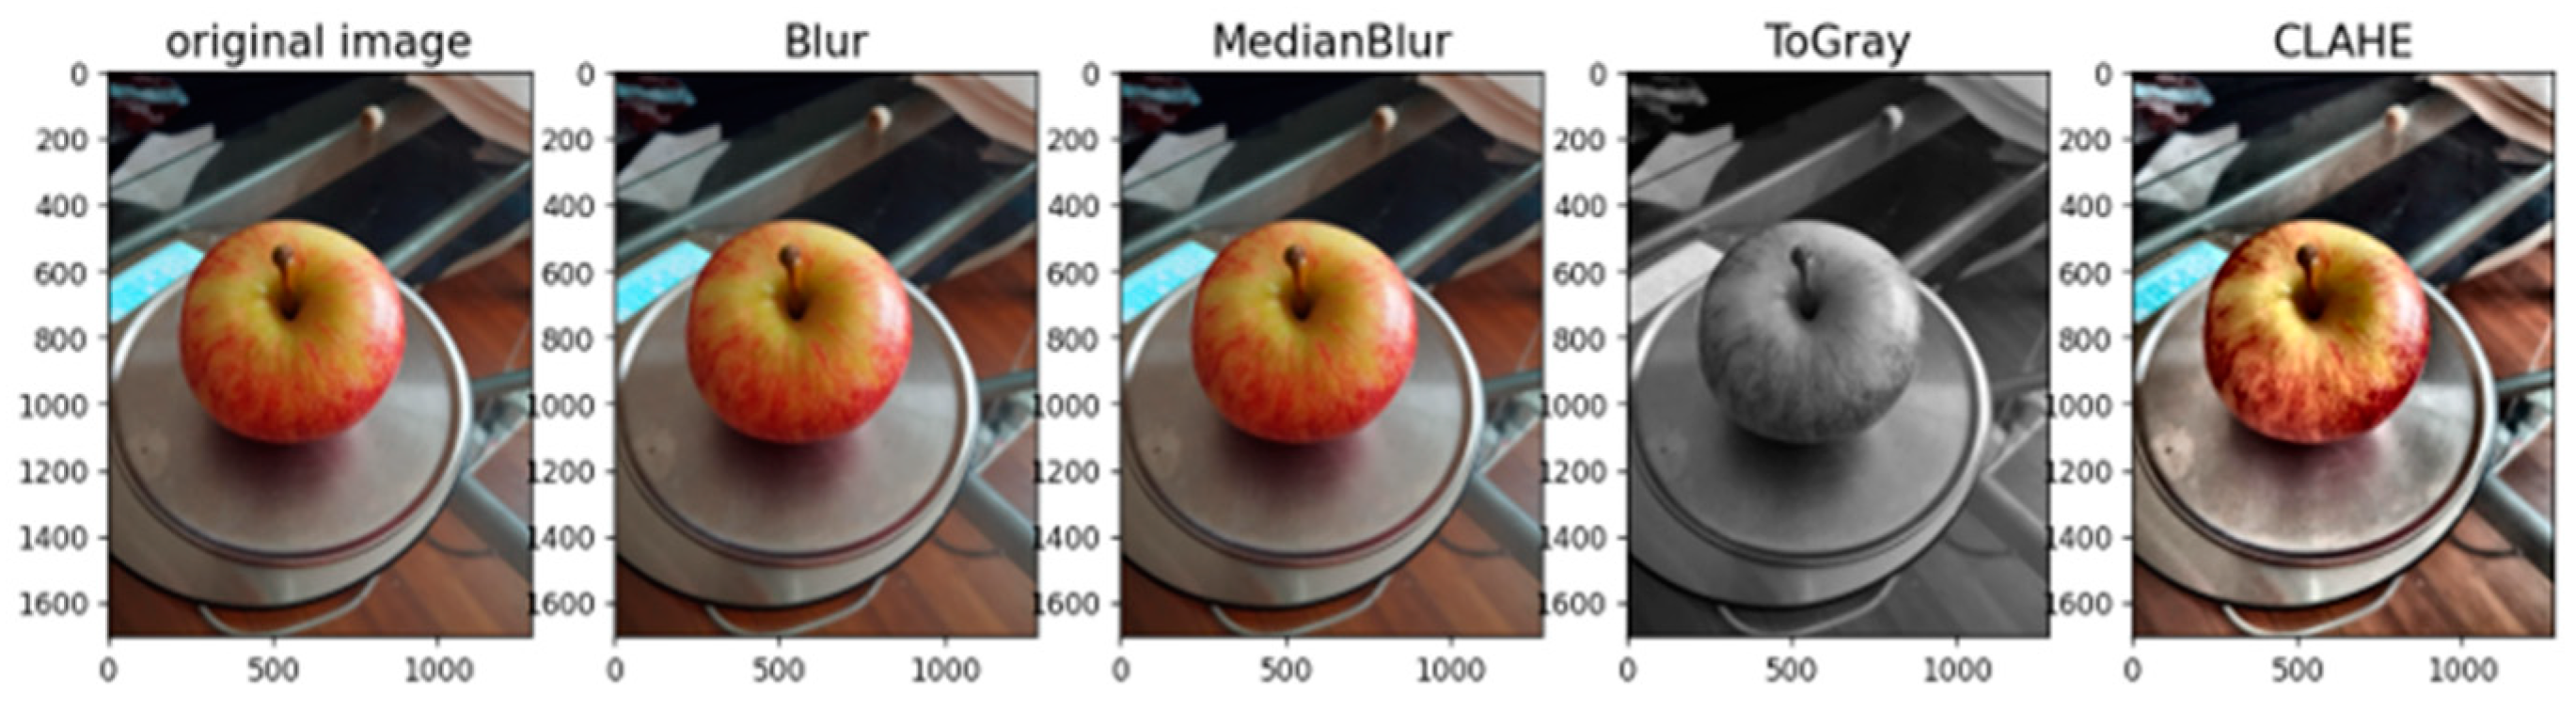
Data Preprocessing
2.3.2. RT-DETR Architecture
2.4. Operating Environment
2.5. Evaluation Method
3. Results
3.1. Benchmark Tests
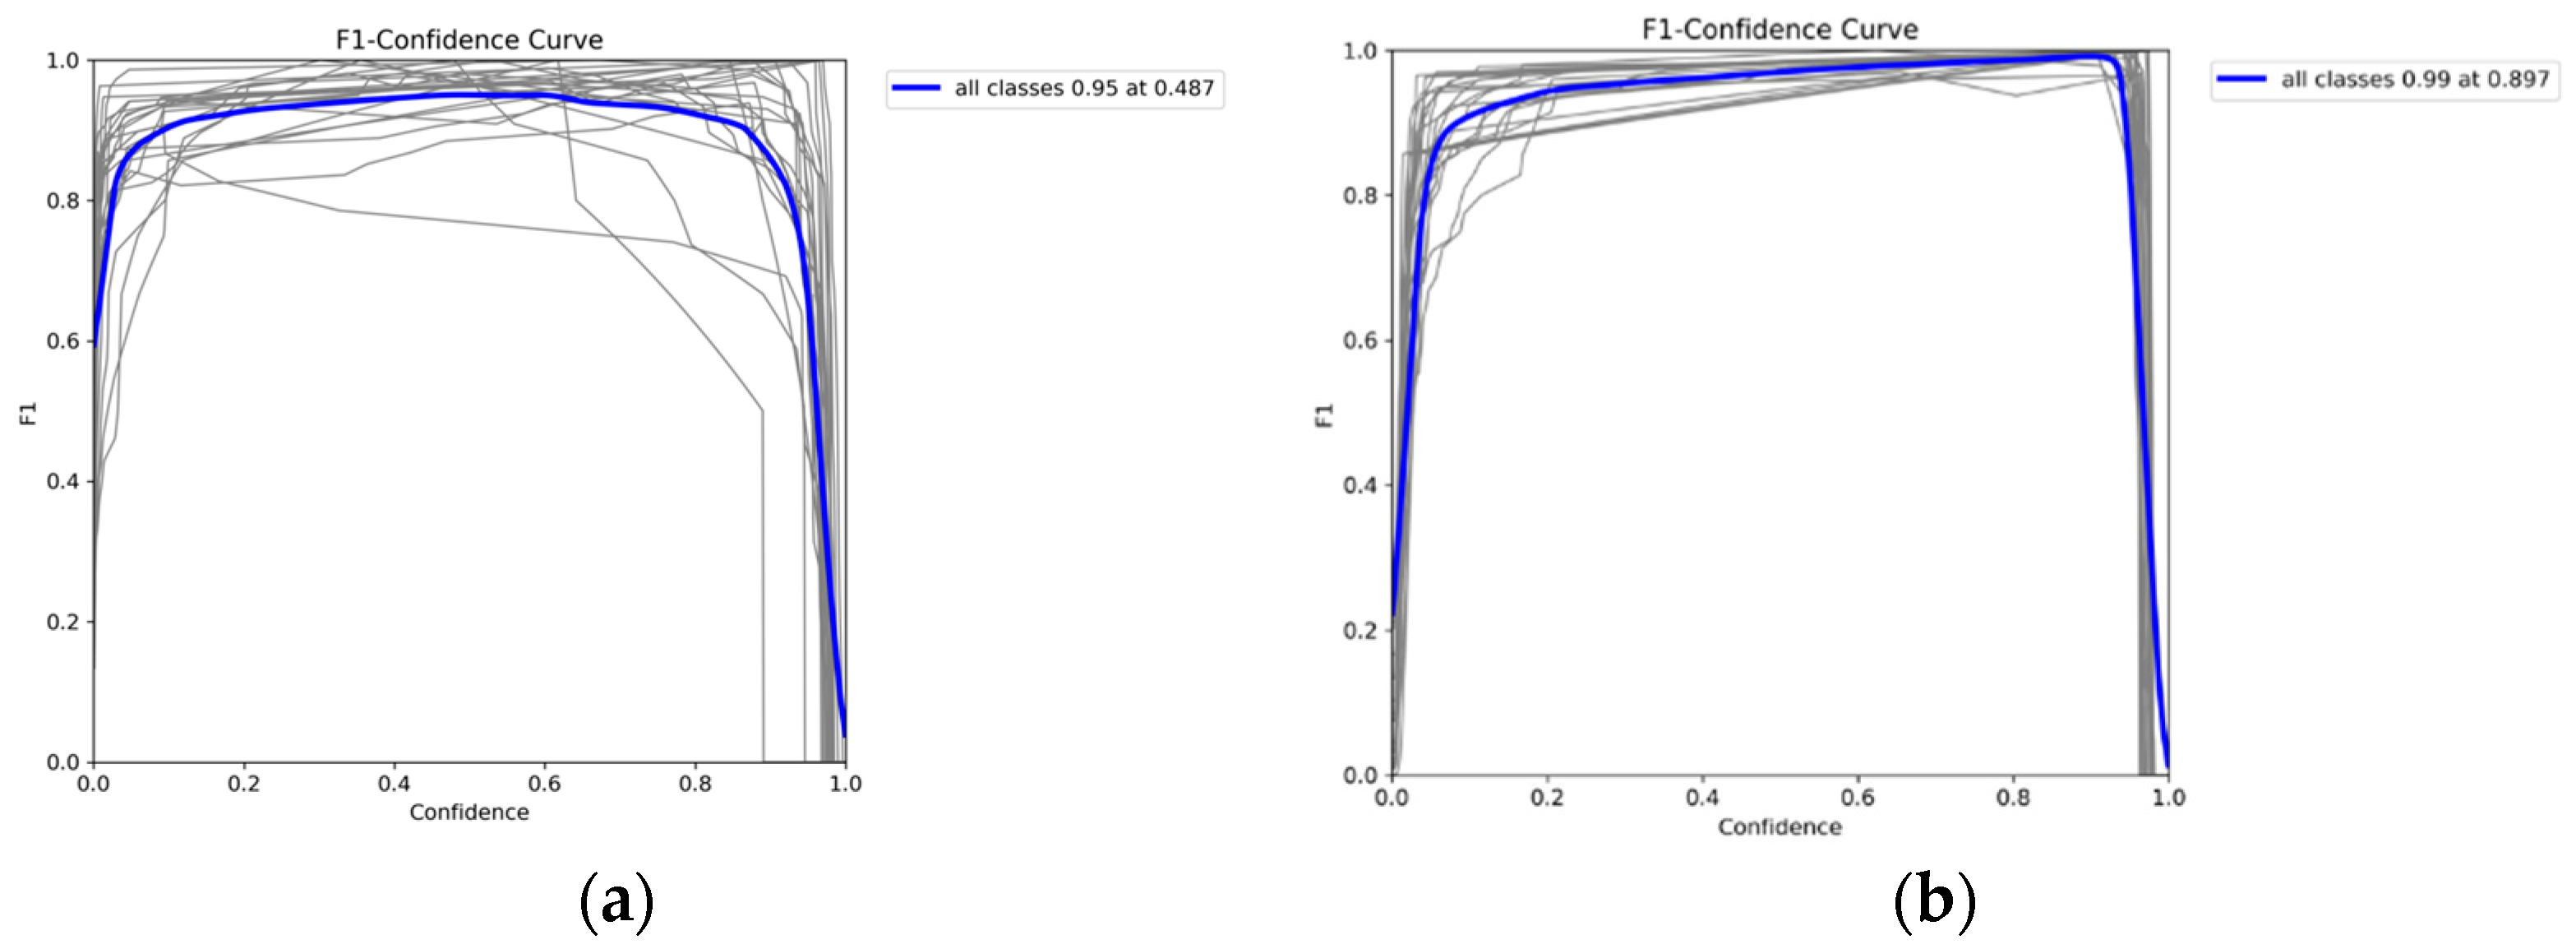
3.2. F1–Confidence Curves
3.3. P-R Curves
3.4. Loss Values
- GIoU loss (Localization Loss)/box_loss: This loss function calculates the difference between predicted bounding boxes and ground truth bounding boxes.
- Cls_loss (Classification loss): The model uses classification loss to measure the accuracy of classification.
- L1 loss (Feature Point Loss): The model utilizes it to directly measure the absolute differences between the predicted and ground truth bounding box coordinates.
- dfl_loss (Distribution Focal Loss): It aims to enhance the model’s accuracy, especially in complex object detection scenarios by focusing more on hard-to-detect objects. Essentially, it adjusts how the model weighs errors differently depending on their difficulty, helping the model to better estimate object categories. It is a loss metric utilized by YOLO models but not applied in RT-DETR.
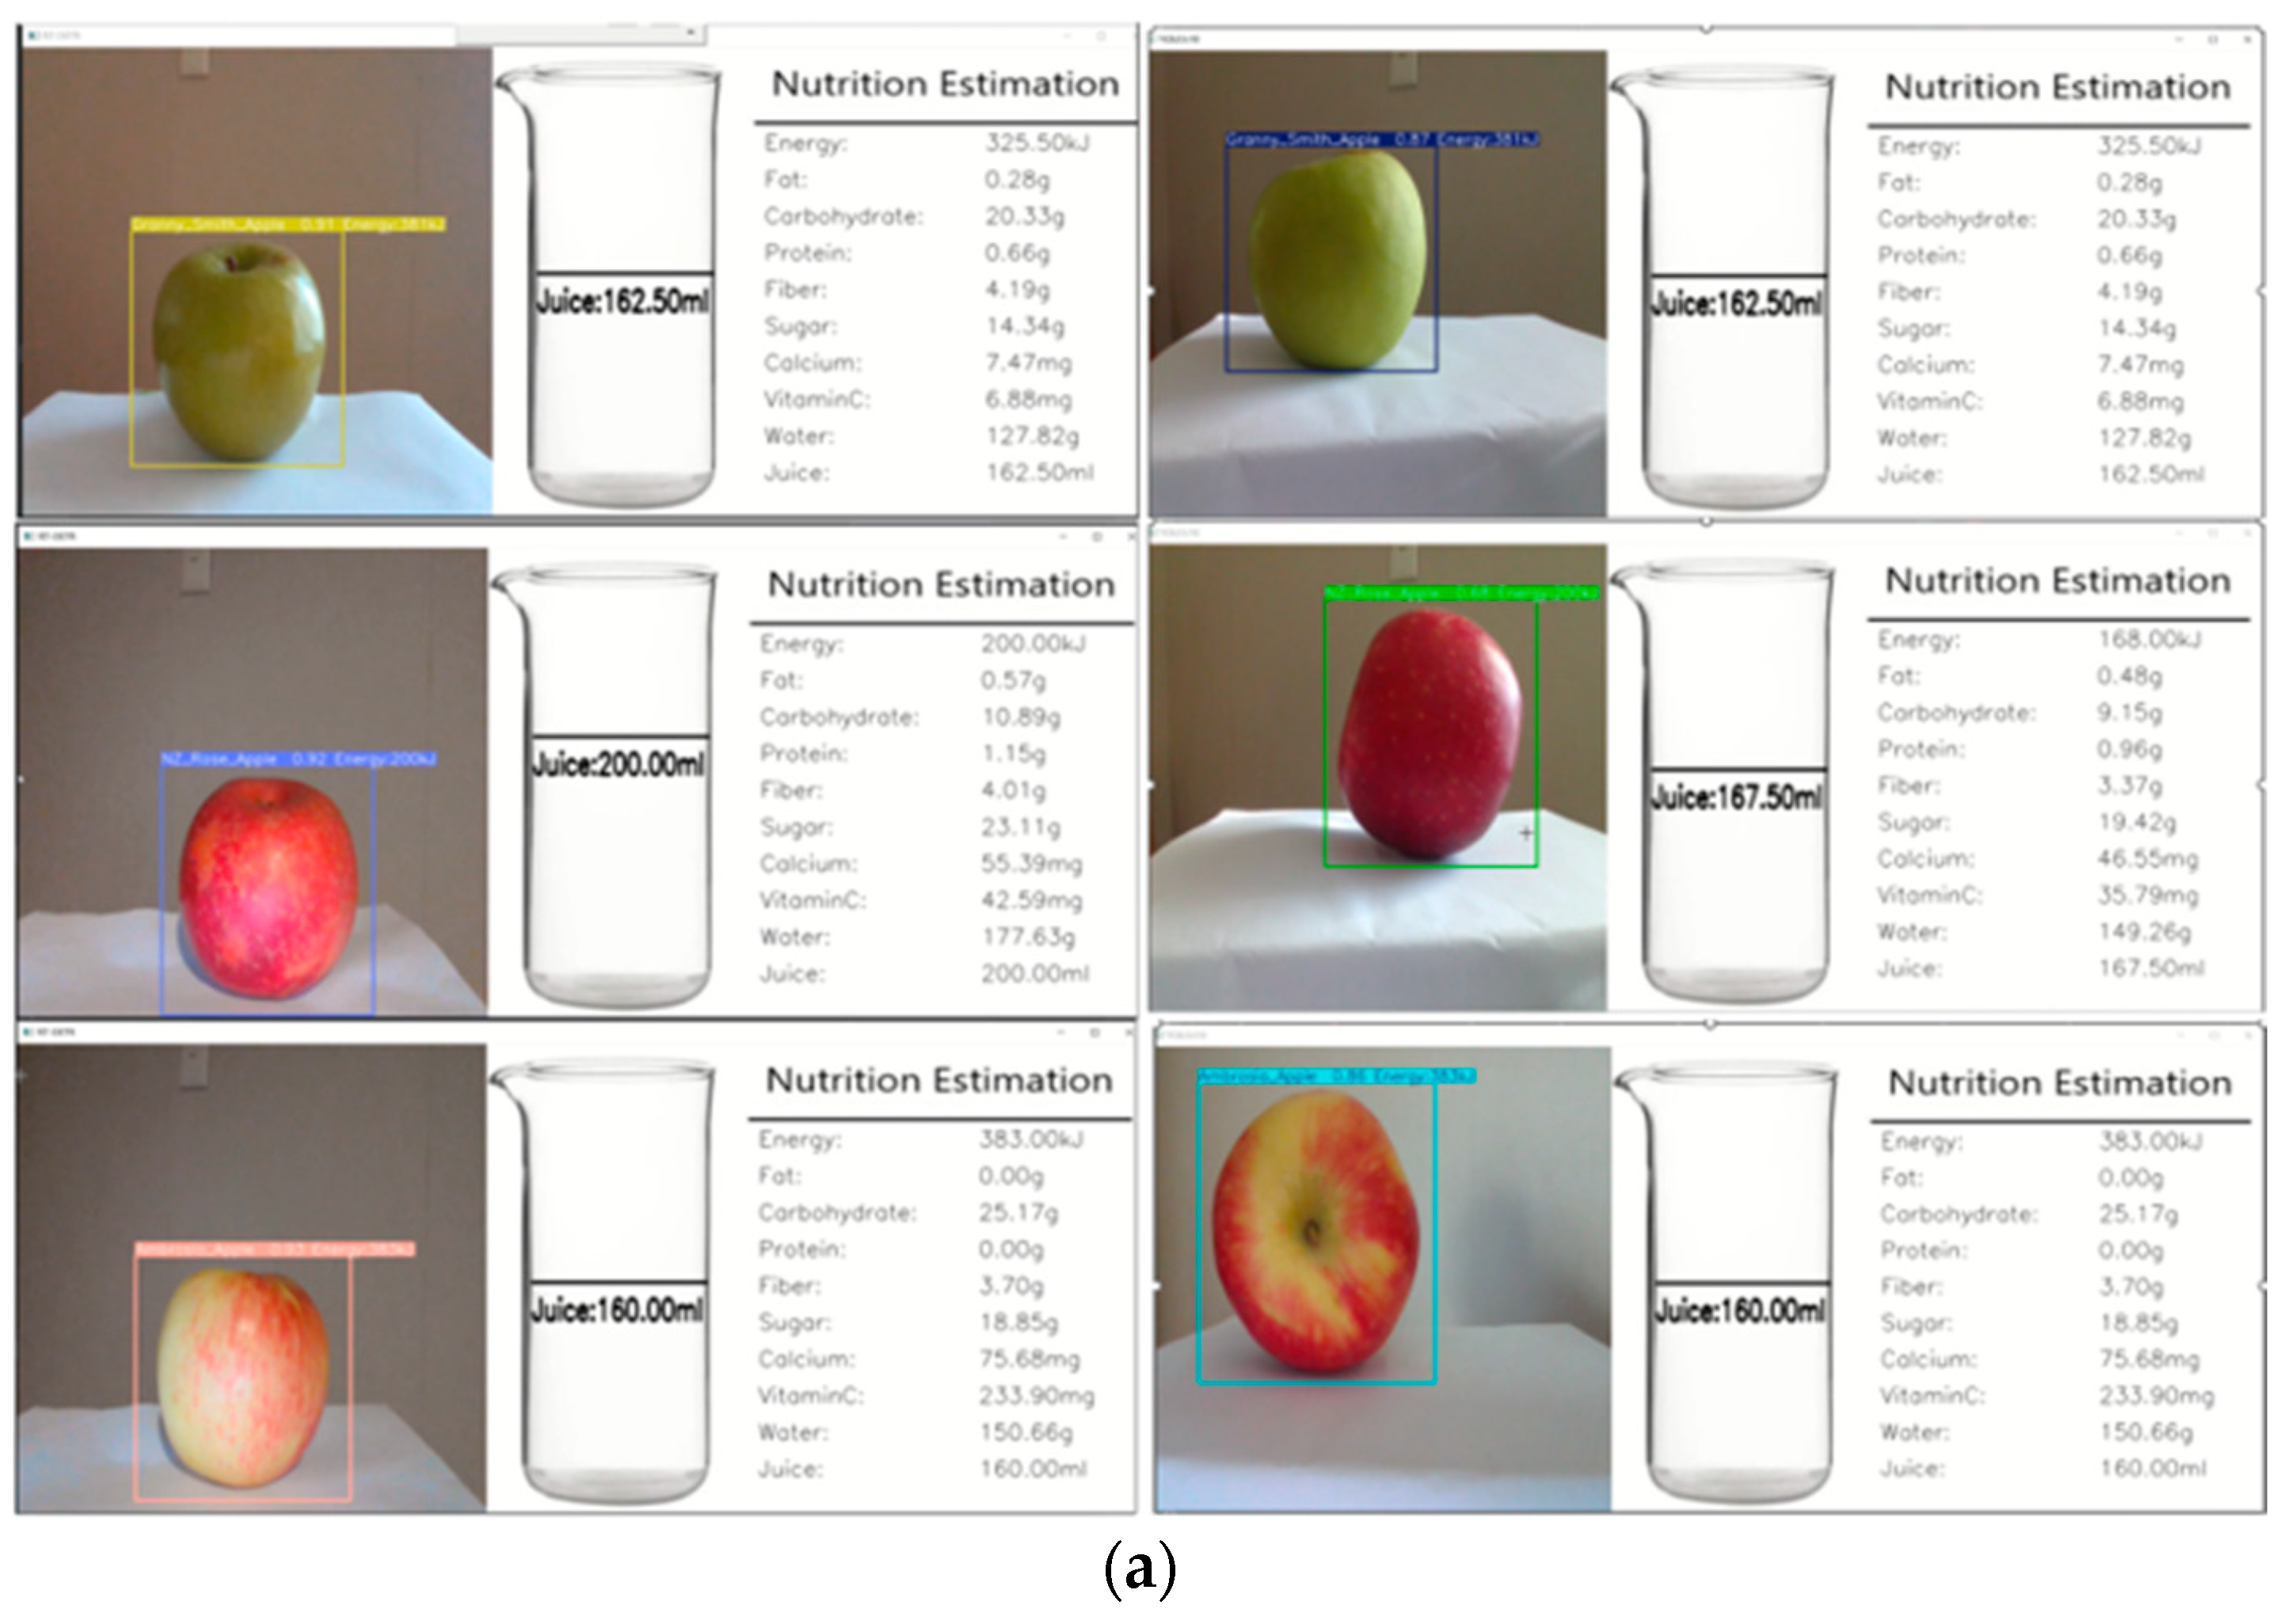
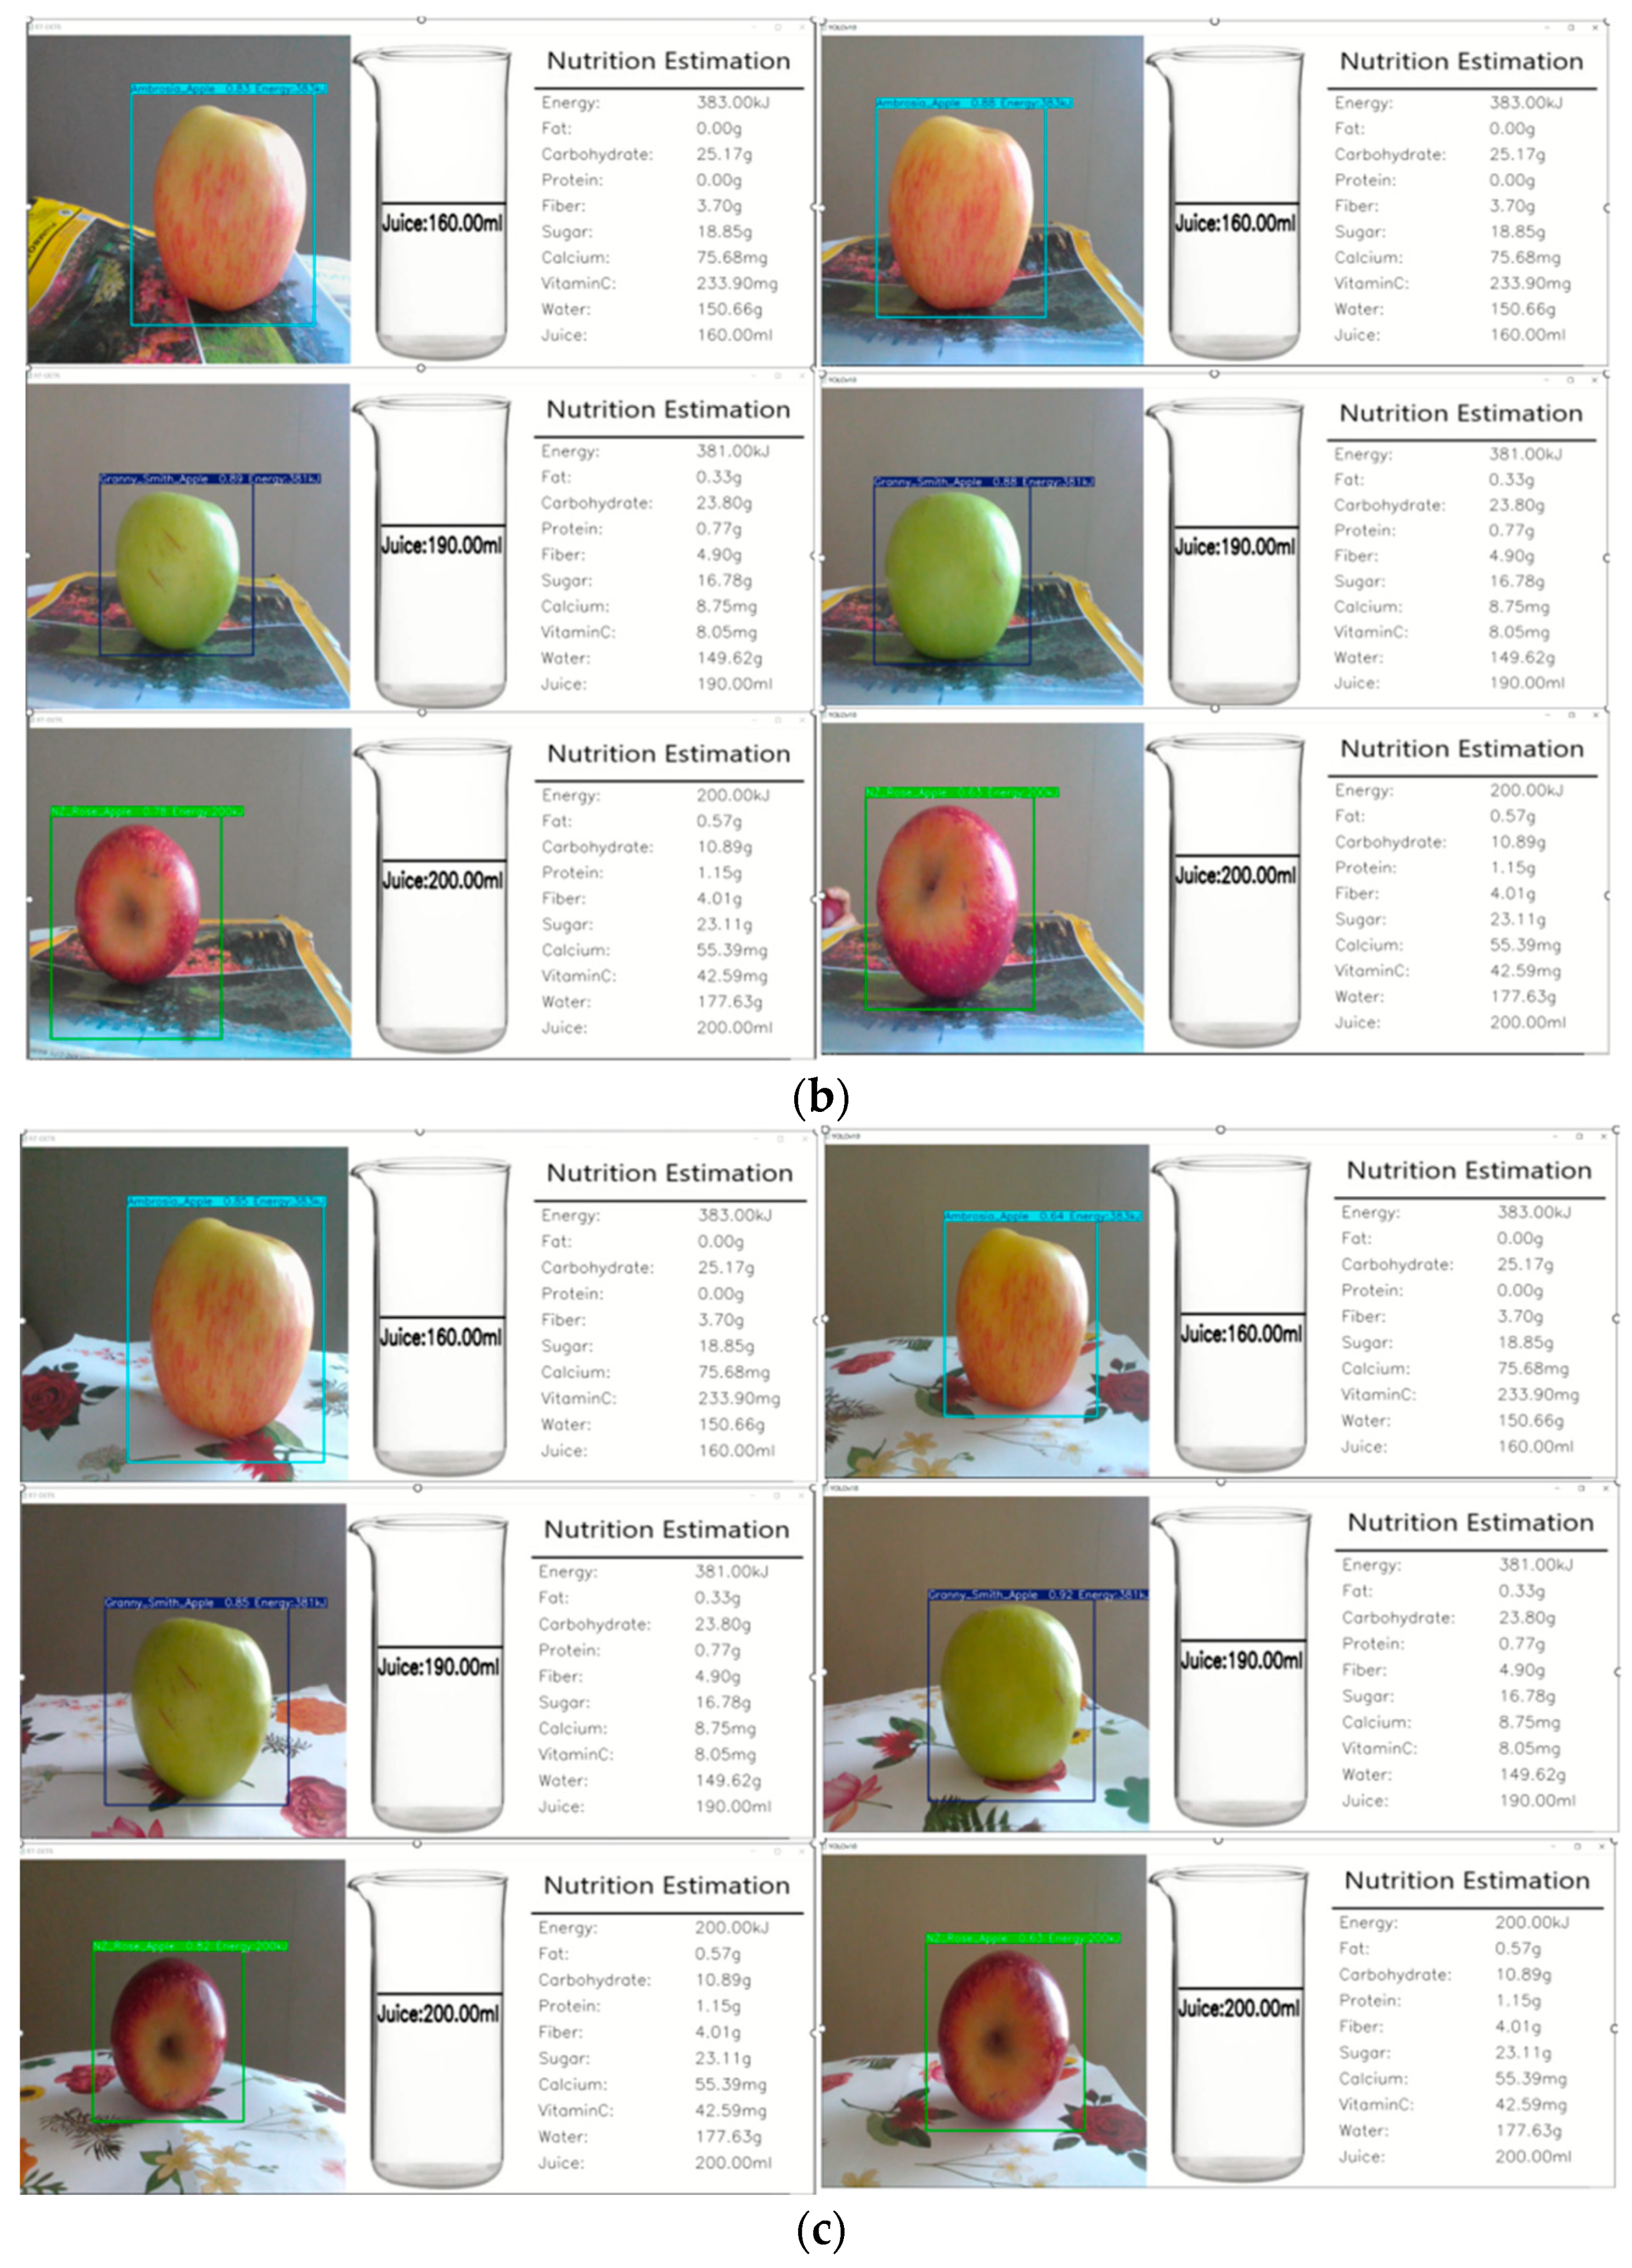
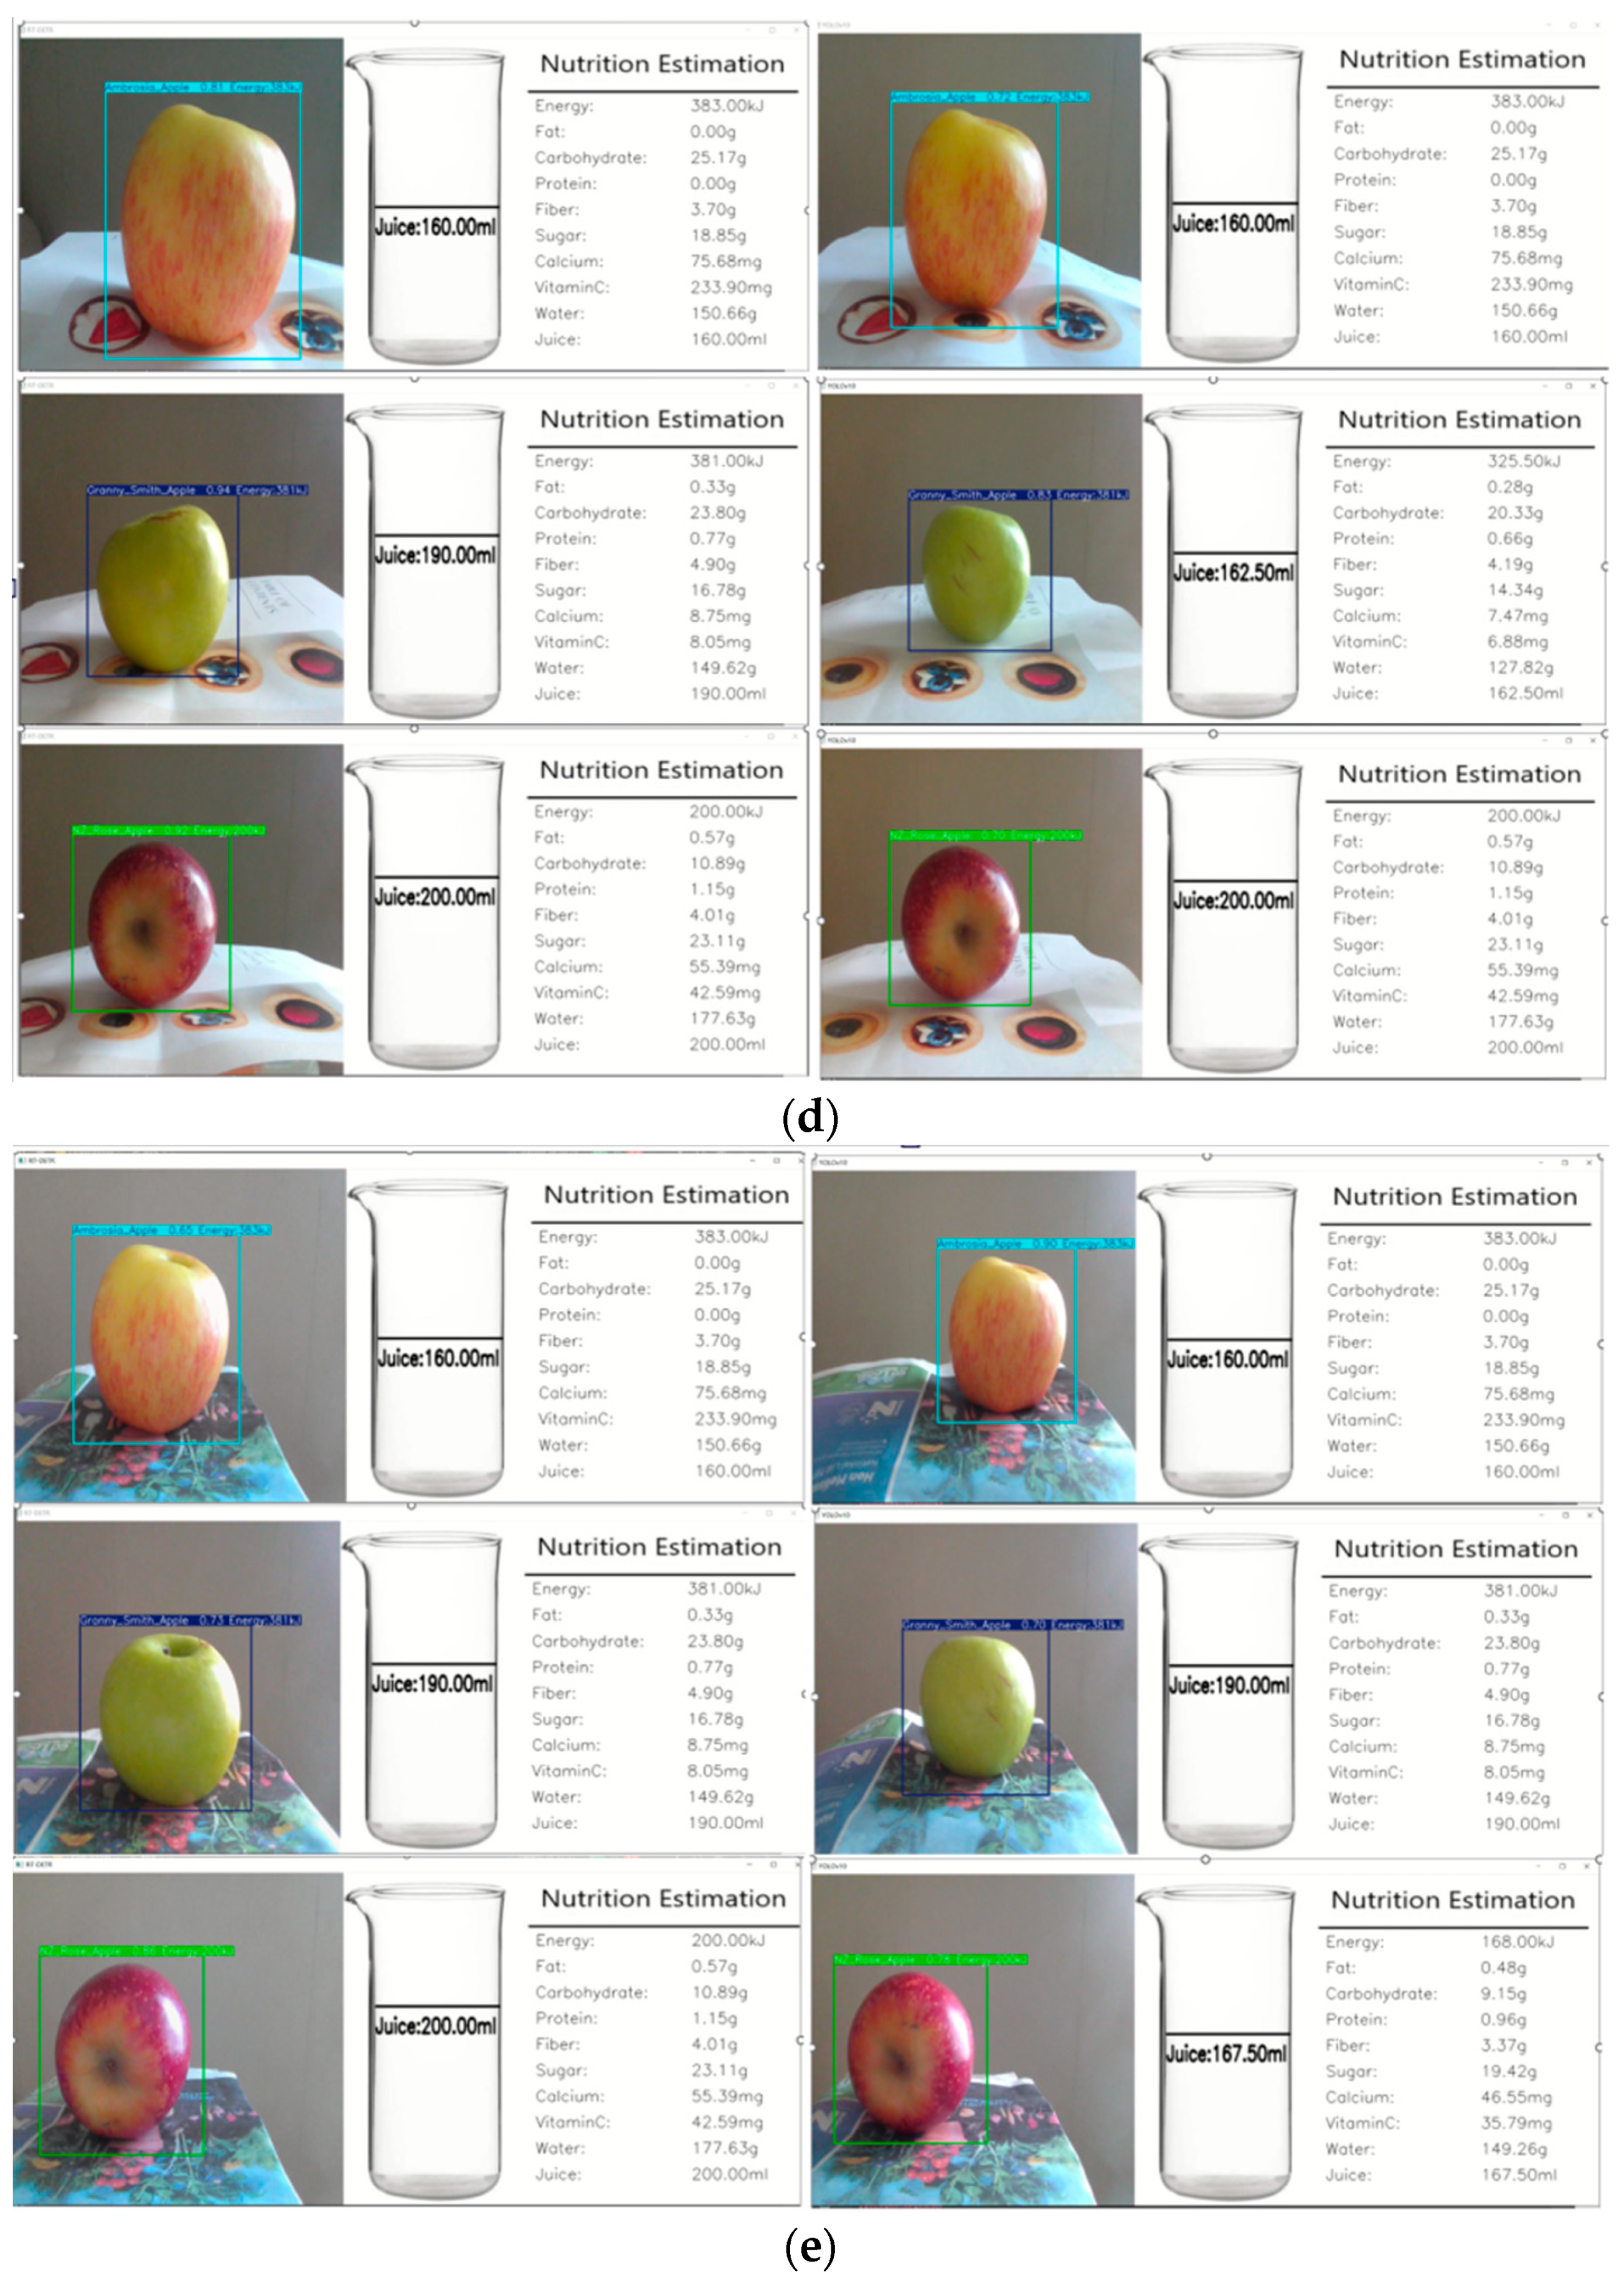
3.5. Real-Time Detection
4. Discussion
4.1. Will the RT-DETR Model Overall Outperform YOLOv10 across Various Performance Metrics?
4.2. Will the RT-DETR Model Produce Lower Loss Values in the Detection of Fruits Compared to the YOLOv10 Model?
4.3. Will the RT-DETR Model Provide a Better User Experience and Effectiveness in Practical Applications Compared to the YOLOv10 Model
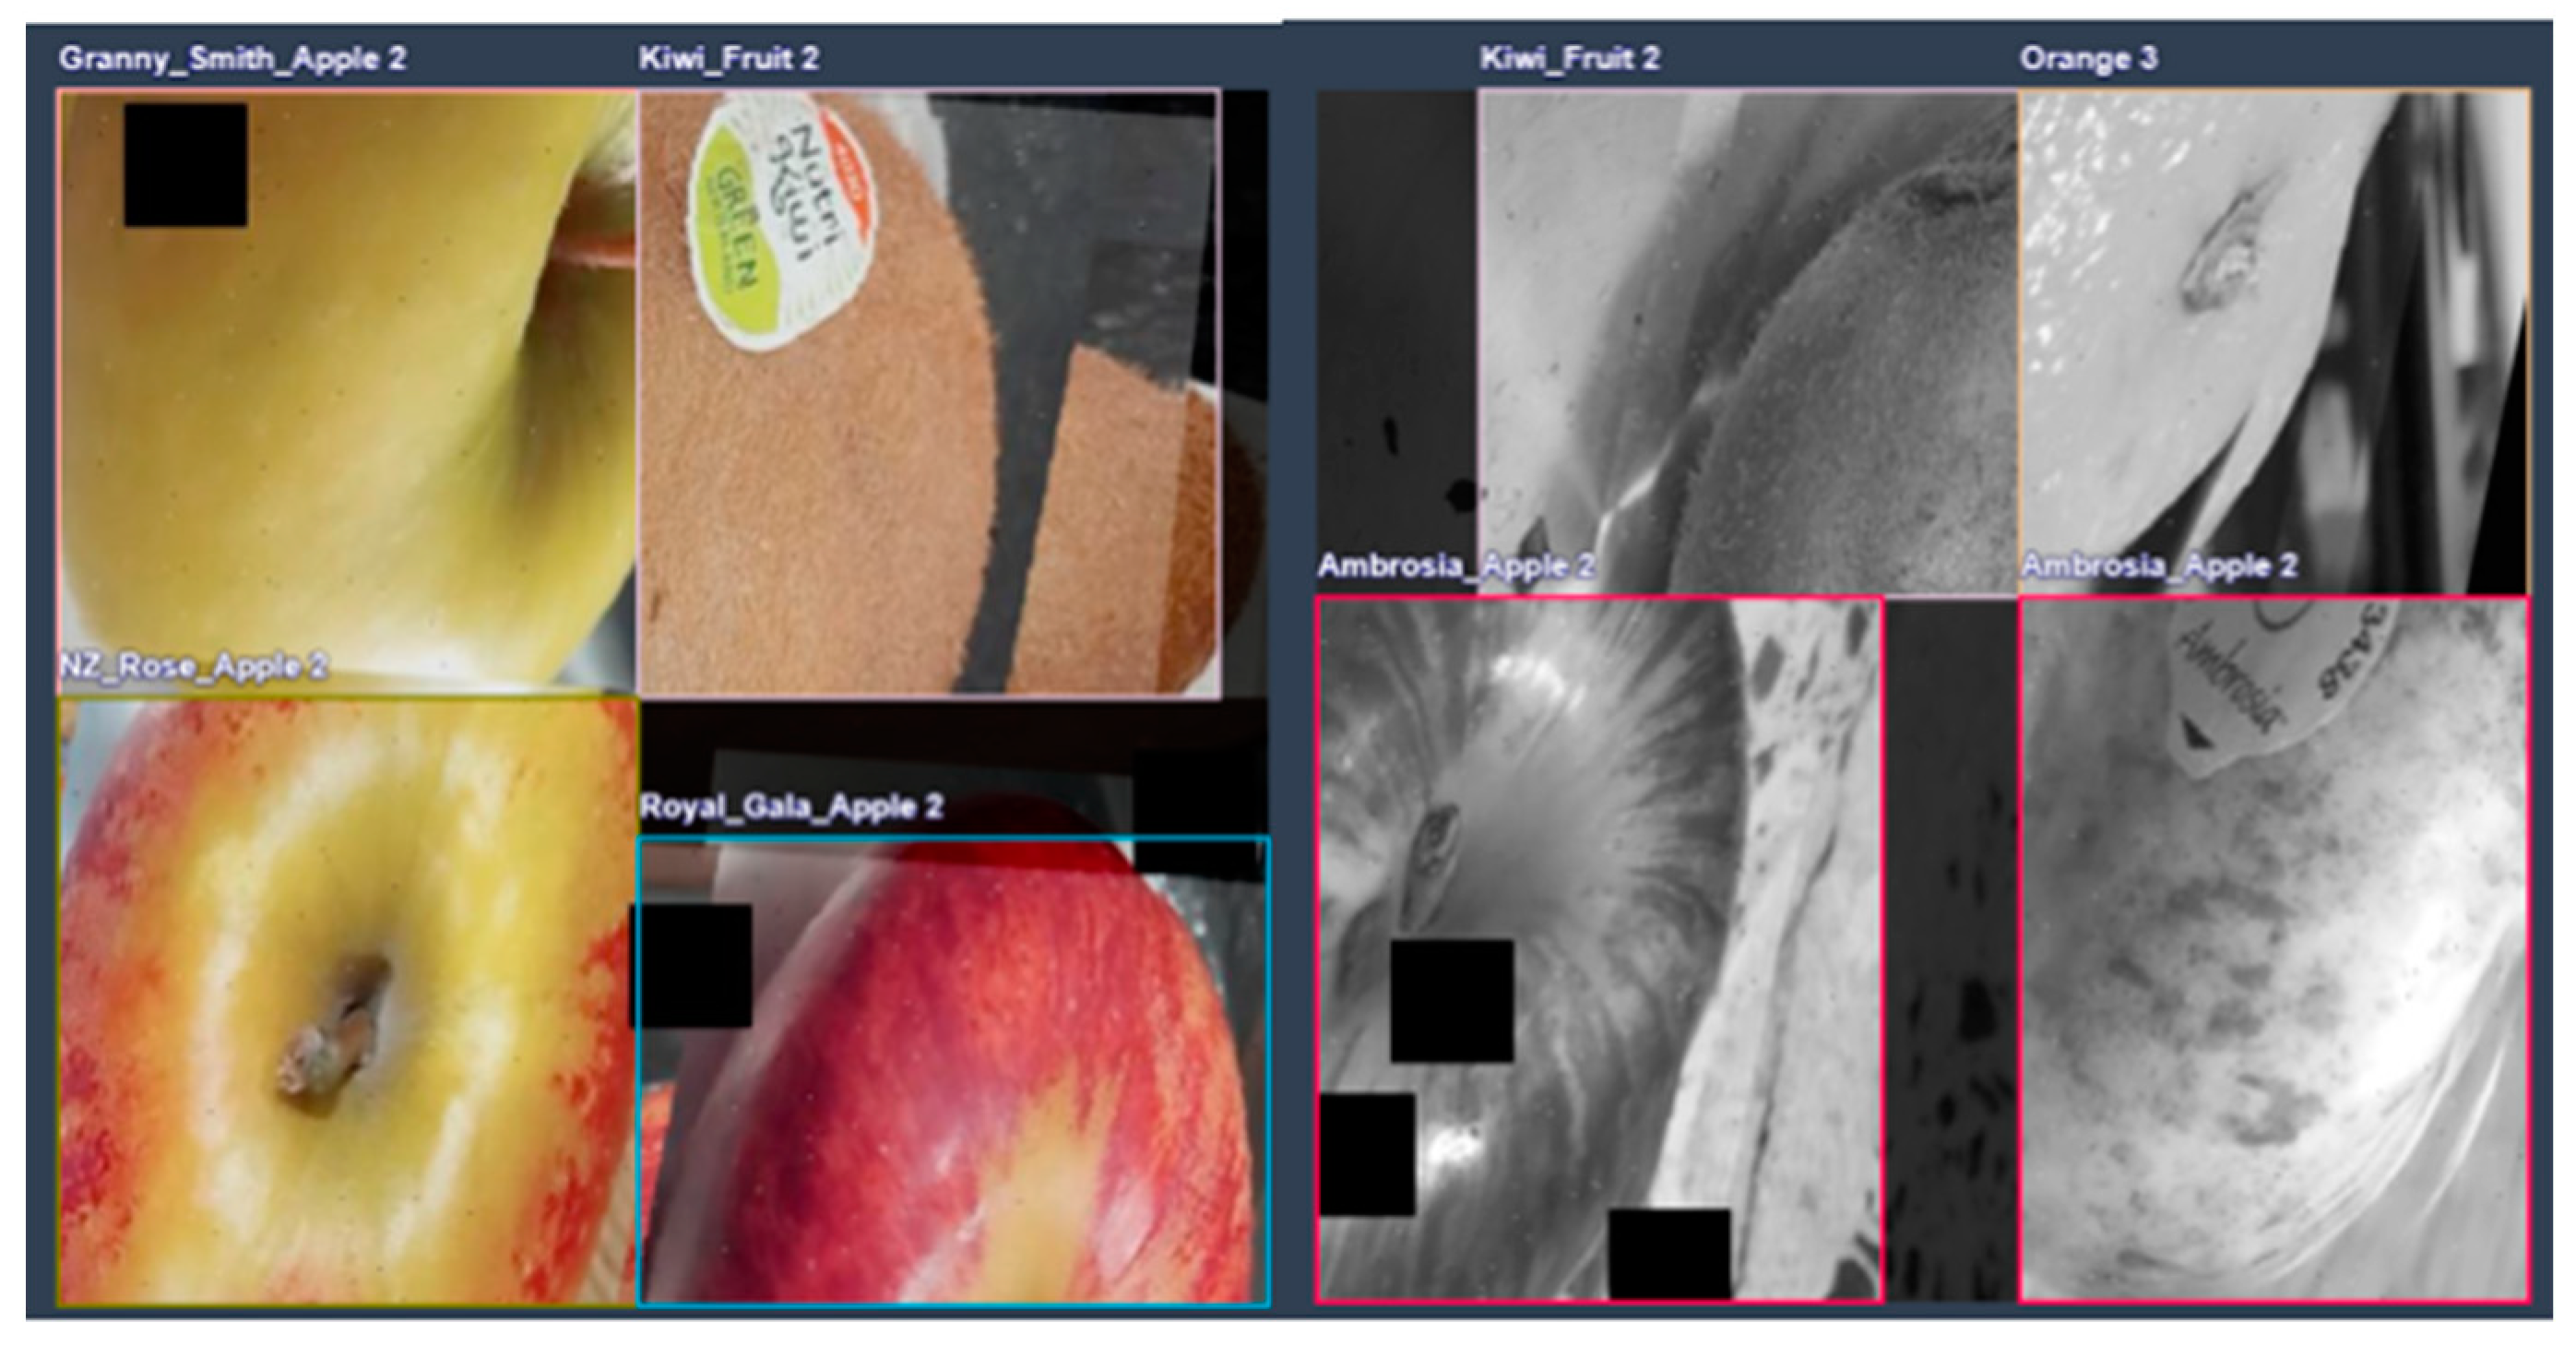
4.4. Detection Errors
4.5. Limitations and Future Work
5. Conclusions
Author Contributions
Funding
Institutional Review Board Statement
Informed Consent Statement
Data Availability Statement
Conflicts of Interest
References
- Mansoor, S.; Jain, P.; Hassan, N.; Farooq, U.; Mirza, M.A.; Pandith, A.A.; Iqbal, Z. Role of Genetic and Dietary Implications in the Pathogenesis of Global Obesity. Food Rev. Int. 2022, 38 (Suppl. S1), 434–455. [Google Scholar] [CrossRef]
- Rolls, E.T. Understanding the Mechanisms of Food Intake and Obesity. Obes. Rev. 2007, 8 (Suppl. S1), 67–72. [Google Scholar] [CrossRef] [PubMed]
- Veni, S.; Krishna Sameera, A.; Samuktha, V.; Anand, R. A Robust Approach Using Fuzzy Logic for the Calories Evaluation of Fruits. In Proceedings of the IEEE International Conference on Signal Processing and Integrated Networks (SPIN), Noida, India, 26–27 August 2021; pp. 1–6. [Google Scholar]
- Begum, N.; Goyal, A.; Sharma, S. Artificial Intelligence-Based Food Calories Estimation Methods in Diet Assessment Research. In Artificial Intelligence Applications in Agriculture and Food Quality Improvement; IGI Global: Hershey, PA, USA, 2022; p. 15. [Google Scholar]
- Vaswani, A.; Shazeer, N.; Parmar, N.; Uszkoreit, J.; Jones, L.; Gomez, A.N.; Kaiser, Ł.; Polosukhin, I. Attention Is All You Need. In Proceedings of the 31st Conference on Neural Information Processing Systems, Long Beach, CA, USA; 2017; pp. 6000–6010. [Google Scholar]
- Li, E.; Wang, Q.; Zhang, J.; Zhang, W.; Mo, H.; Wu, Y. Fish Detection under Occlusion Using Modified You Only Look Once v8 Integrating Real-Time Detection Transformer Features. Appl. Sci. 2023, 13, 12645. [Google Scholar] [CrossRef]
- Manaswi, N.K. RNN and LSTM. Deep Learning with Applications Using Python; Springer: Berlin/Heidelberg, Germany, 2018; pp. 115–126. [Google Scholar]
- He, K.; Zhang, X.; Ren, S.; Sun, J. Deep Residual Learning for Image Recognition. In Proceedings of the IEEE Conference on Computer Vision and Pattern Recognition (CVPR), Las Vegas, NV, USA, 27–30 June 2016; pp. 27–30. [Google Scholar]
- Yu, R.; Wang, Z.; Wang, Y.; Li, K.; Liu, C.; Duan, H.; Ji, X.; Chen, J. LaPE: Layer-adaptive Position Embedding for Vision Transformers with Independent Layer Normalization. In Proceedings of the IEEE/CVF International Conference on Computer Vision, Paris, France, 1–6 October 2023. [Google Scholar]
- Dosovitskiy, A.; Beyer, L.; Kolesnikov, A.; Weissenborn, D.; Zhai, X.; Unterthiner, T.; Dehghani, M.; Minderer, M.; Heigold, G.; Gelly, S.; et al. An Image Is Worth 16 × 16 Words: Transformers for Image Recognition at Scale. In Proceedings of the International Conference on Learning Representations, Virtual Only Conference, 3–7 May 2021. [Google Scholar]
- Carion, N.; Massa, F.; Synnaeve, G.; Usunier, N.; Kirillov, A.; Zagoruyko, S. End-to-End Object Detection with Transformers. In Proceedings of the ECCV 2020, Lecture Notes in Computer Science, Glasgow, UK, 23–28 August 2020. [Google Scholar]
- Wang, Y.; Zhang, X.; Yang, T.; Sun, J. Anchor DETR: Query Design for Transformer-Based Object Detection. In Proceedings of the AAAI Conference on Artificial Intelligence (AAAI-22), Virtual Only Conference, 22 February–1 March 2022. [Google Scholar]
- Zhu, X.; Su, W.; Lu, L.; Li, B.; Wang, X.; Dai, J. Deformable DETR: Deformable Transformers for End-to-End Object Detection. In Proceedings of the International Conference on Learning Representations, Virtual Only Conference, 3–7 May 2021. [Google Scholar]
- Roh, B.; Shin, J.; Shin, W.; Kim, S. Sparse DETR: Efficient End-to-End Object Detection with Learnable Sparsity. In Proceedings of the International Conference on Learning Representations, Virtual Only Conference, 25–29 April 2022. [Google Scholar]
- Meng, D.; Chen, X.; Fan, Z.; Zeng, G.; Li, H.; Yuan, Y.; Sun, L.; Wang, J. Conditional DETR for Fast Training Convergence. In Proceedings of the IEEE/CVF International Conference on Computer Vision (ICCV), Montreal, QC, Canada, 10–17 October 2021; pp. 3631–3640. [Google Scholar]
- Liu, S.; Li, F.; Zhang, H.; Yang, X.; Qi, X.; Su, H.; Zhu, J.; Zhang, L. DAB-DETR: Dynamic Anchor Boxes Are Better Queries for DETR. In Proceedings of the International Conference on Learning Representations, Virtual Only Conference, 25–29 April 2022. [Google Scholar]
- Li, F.; Zhang, H.; Liu, S.; Guo, J.; Ni, L.M.; Zhang, L. DN-DETR: Accelerate DETR Training by Introducing Query DeNoising. IEEE Trans. Pattern Anal. Mach. Intell. 2022, 46, 2239–2251. [Google Scholar] [CrossRef] [PubMed]
- Lister, C. Easily Accessible Food Composition Data: Accessing Strategic Food Information for Product Development and Marketing. Food N. Z. 2018, 18, 17–19. [Google Scholar]
- Shorten, C.; Khoshgoftaar, T.M. A Survey on Image Data Augmentation for Deep Learning. J. Big Data 2019, 6, 60. [Google Scholar] [CrossRef]
- He, T.; Zhang, Z.; Zhang, H.; Zhang, Z.; Xie, J.; Li, M. Bag of Tricks for Image Classification with Convolutional Neural Networks. In Proceedings of the IEEE/CVF Conference on Computer Vision and Pattern Recognition, Long Beach, CA, USA, 15–20 June 2019; pp. 558–567. [Google Scholar]
- Yao, T.; Li, Y.; Pan, Y.; Mei, T. HGNet: Learning Hierarchical Geometry from Points, Edges, and Surfaces. In Proceedings of the IEEE/CVF Conference on Computer Vision and Pattern Recognition (CVPR), Vancouver, BC, Canada, 17–24 June 2023; pp. 21846–21855. [Google Scholar]
- Yan, W.Q. Computational Methods for Deep Learning: Theory, Algorithms, and Implementations; Springer: Berlin/Heidelberg, Germany, 2023. [Google Scholar]
- Jiang, S.; Xu, T.; Li, J.; Huang, B.; Guo, J.; Bian, Z. IdentifyNet for Non-Maximum Suppression. IEEE Access 2019, 7, 148245–148253. [Google Scholar] [CrossRef]
- Redmon, J.; Divvala, S.; Girshick, R.; Farhadi, A. You Only Look Once: Unified, Real-Time Object Detection. In Proceedings of the IEEE Conference on Computer Vision and Pattern Recognition (CVPR), Las Vegas, NV, USA, 27–30 June 2016; pp. 779–788. [Google Scholar]
- Wu, W.; Liu, A.; Hu, J.; Mo, Y.; Xiang, S.; Duan, P.; Liang, Q. EUAVDet: An Efficient and Lightweight Object Detector for UAV Aerial Images with an Edge-Based Computing Platform. Drones 2024, 8, 261. [Google Scholar] [CrossRef]
- Zong, Z.; Song, G.; Liu, Y. Detrs with Collaborative Hybrid Assignments Training. In Proceedings of the IEEE/CVF International Conference on Computer Vision, Paris, France, 1–6 October 2023; pp. 6748–6758. [Google Scholar]
- Padilla, R.; Passos, W.L.; Dias, T.L.B.; Netto, S.L.; da Silva, E.A.B. A Comparative Analysis of Object Detection Metrics with a Companion Open-Source Toolkit. Electronics 2021, 10, 279. [Google Scholar] [CrossRef]


| Precision | Recall | mAP50 | mAP50-95 | Training Time | |
|---|---|---|---|---|---|
| YOLOv8 YOLOv9 YOLOv10 | 94.57% 96.63% 96.27% | 95.17% 91.32% 97.11% | 97.87% 98.56% 99.07% | 93.01% 94.64% 95.35% | 54 min 9 h 23 min 3 h 11 min |
| RT-DETR | 99.01% | 99.20% | 99.17% | 94.45% | 6 h 35 min |
| Train | Val | |||||
|---|---|---|---|---|---|---|
| box_loss | cls_loss | dfl_loss | box_loss | cls_loss | dfl_loss | |
| YOLOV8 | 0.2 | 0.28 | 0.89 | 0.36 | 0.26 | 0.98 |
| YOLOV9 YOLOv10 | 0.36 0.34 | 0.85 0.31 | 1.17 1.75 | 0.42 0.65 | 0.34 0.37 | 1.11 1.79 |
| Train | Val | |||||
|---|---|---|---|---|---|---|
| giou_loss | cls_loss | l1_loss | giou_loss | cls_loss | l1_loss | |
| RT-DETR | 0.04 | 0.1 | 0.05 | 0.09 | 0.21 | 0.18 |
Disclaimer/Publisher’s Note: The statements, opinions and data contained in all publications are solely those of the individual author(s) and contributor(s) and not of MDPI and/or the editor(s). MDPI and/or the editor(s) disclaim responsibility for any injury to people or property resulting from any ideas, methods, instructions or products referred to in the content. |
© 2024 by the authors. Licensee MDPI, Basel, Switzerland. This article is an open access article distributed under the terms and conditions of the Creative Commons Attribution (CC BY) license (https://creativecommons.org/licenses/by/4.0/).
Share and Cite
Tang, S.; Yan, W. Utilizing RT-DETR Model for Fruit Calorie Estimation from Digital Images. Information 2024, 15, 469. https://doi.org/10.3390/info15080469
Tang S, Yan W. Utilizing RT-DETR Model for Fruit Calorie Estimation from Digital Images. Information. 2024; 15(8):469. https://doi.org/10.3390/info15080469
Chicago/Turabian StyleTang, Shaomei, and Weiqi Yan. 2024. "Utilizing RT-DETR Model for Fruit Calorie Estimation from Digital Images" Information 15, no. 8: 469. https://doi.org/10.3390/info15080469
APA StyleTang, S., & Yan, W. (2024). Utilizing RT-DETR Model for Fruit Calorie Estimation from Digital Images. Information, 15(8), 469. https://doi.org/10.3390/info15080469