Article

Machine Learning and Artificial Intelligence for a Sustainable Tourism: A Case Study on Saudi Arabia

1
Information Systems, College of Computer Engineering and Sciences, Prince Sattam bin Abdulaziz University, Al-Kharj 11942, Saudi Arabia
2
Computer Science, Kingdom University, Riffa P.O. Box 40434, Bahrain
3
Department of Computer Science, College of Computer Engineering and Sciences, Prince Sattam bin Abdulaziz University, Al-Kharj 11942, Saudi Arabia
*
Author to whom correspondence should be addressed.
Information 2024, 15(9), 516; https://doi.org/10.3390/info15090516
Submission received: 12 June 2024 / Revised: 15 August 2024 / Accepted: 22 August 2024 / Published: 23 August 2024

Abstract

:
This work conducts a rigorous examination of the economic influence of tourism in Saudi Arabia, with a particular focus on predicting tourist spending patterns and classifying spending behaviors during the COVID-19 pandemic period and its implications for sustainable development. Utilizing authentic datasets obtained from the Saudi Tourism Authority for the years 2015 to 2021, the research employs a variety of machine learning (ML) algorithms, including Decision Trees, Random Forests, K-Neighbors Classifiers, Gaussian Naive Bayes, and Support Vector Classifiers, all meticulously fine-tuned to optimize model performance. Additionally, the ARIMA model is expertly adjusted to forecast the economic landscape of tourism from 2022 to 2030, providing a robust predictive framework for future trends. The research framework is comprehensive, encompassing diligent data collection and purification, exploratory data analysis (EDA), and extensive calibration of ML algorithms through hyperparameter tuning. This thorough process tailors the predictive models to the unique dynamics of Saudi Arabia’s tourism industry, resulting in robust forecasts and insights. The findings reveal the growth trajectory of the tourism sector, highlighted by nearly 965,073 thousand tourist visits and 7,335,538 thousand overnights, with an aggregate tourist expenditure of SAR 2,246,491 million. These figures, coupled with an average expenditure of SAR 89,443 per trip and SAR 9198 per night, form a solid statistical basis for the employed predictive models. Furthermore, this research expands on how ML and AI innovations contribute to sustainable tourism practices, addressing key aspects such as resource management, economic resilience, and environmental stewardship. By integrating predictive analytics and AI-driven operational efficiencies, the study provides strategic insights for future planning and decision-making, aiming to support stakeholders in developing resilient and sustainable strategies for the tourism sector. This approach not only enhances the capacity for navigating economic complexities in a post-pandemic context, but also reinforces Saudi Arabia’s position as a premier tourism destination, with a strong emphasis on sustainability leading into 2030 and beyond.

1. Introduction

The unprecedented outbreak of COVID-19 has profoundly reshaped the landscape of the global tourism industry, presenting both unprecedented challenges and new opportunities, particularly in the Kingdom of Saudi Arabia. The pandemic led to a severe contraction in international travel, resulting in significant economic losses for the tourism sector and related industries, such as accommodation, transport, entertainment, and retail. Despite ongoing efforts towards recovery, the influx of tourists to Saudi Arabia has yet to return to pre-pandemic levels, underscoring the enduring impact of the crisis. In response to these challenges, this study delves into the intricate dynamics of the shift in Saudi Arabia’s tourism industry, with a particular focus on the resilience and adaptability of the Kingdom’s tourism sector. The sector has been compelled to innovate and adapt to new realities, including the implementation of stringent health protocols, the promotion of domestic tourism, and the accelerated adoption of digital technologies. These adaptations are vital for ensuring the sector’s recovery and future sustainability. Moreover, the ability to accurately forecast tourist demand has become more crucial than ever, serving as a cornerstone for strategic planning and resource management. Technological advancements, particularly in the realms of big data, machine learning (ML), and artificial intelligence (AI), have become integral to enhancing the competitiveness of Saudi Arabia’s tourism industry. The widespread use of the internet and social media platforms has further revolutionized how travelers make decisions, enabling them to seek enriched travel experiences through comprehensive online research and robust social interactions. However, the sector’s vulnerability to a myriad of external factors—including economic downturns, geopolitical instability, natural calamities, and health crises such as the COVID-19 pandemic—poses significant challenges. These vulnerabilities highlight the need for a more robust and sustainable tourism model that can withstand such shocks. In this context, ML and AI technologies offer powerful tools for predicting tourism trends, optimizing resource allocation, and enhancing the overall resilience of the tourism sector. In Saudi Arabia, regions like Riyadh, Makkah, and the Eastern Province continue to attract tourists, buoyed by their status as pivotal hubs in the Middle East’s travel and cultural network. This study underscores the pivotal role of technology and communication in reinventing tourist destination management, advocating for the adoption of sustainable tourism models that are resilient, adaptable, and responsive to the changing global environment. By integrating predictive analytics and AI-driven strategies, the research aims to support stakeholders in developing resilient and sustainable tourism practices, ensuring that the sector can continue to be a driving force for economic growth and cultural exchange in the Kingdom of Saudi Arabia.
Given the datasets obtained from the Saudi Tourism Authority for the period 2015–2021, an analysis of the tourism sector in Saudi Arabia over three distinct periods—pre-pandemic, pandemic, and post-pandemic—was performed. Each period highlighted specific issues and consumer behaviors. Table 1 summarizes these periods, along with the corresponding bibliographic sources.
The remainder of this paper is structured as follows. Section 2 reviews related work, highlighting key studies and methodologies relevant to the research objectives. Section 3 discusses the contributions of the study, emphasizing both scientific and practical impacts. Section 4 describes the dataset, including data collection, preprocessing, and key variables. Section 5 details the hyper-parameter tuning process for optimizing the machine learning models used in the study. Section 6 presents the implementation and results of various machine learning techniques, accompanied by relevant figures and analyses. Section 7 evaluates the performance of the classifiers used, using standard metrics and comparative analysis. Section 8 explores the impact of the findings on sustainable tourism, while Section 9 discusses innovations in the field. Section 9 provides a comprehensive discussion of the results, supported by bibliographic references. Finally, Section 10 concludes the paper, highlighting limitations of the study and suggesting directions for future research.

2. Related Work

2.1. Conceptual Framework for Tourism Data Space

In the realm of predictive learning for studying tourist spending, several pertinent studies offer insights into the development and application of data-driven approaches in tourism research. One significant study focuses on the conceptualization of a Tourism Data Space (TDS) in the Balearic Islands, highlighting the intricate process of identifying analytical tools and information types to support tourism research and enhance competitiveness [7,8]. This research underscores the importance of a structured framework for TDS construction, informed by a bibliometric analysis of tourism-related scientific literature, aimed at fostering excellent scientific research and facilitating the transfer of findings to the tourism industry. Further studies have explored the integration of TDS with emerging technologies such as blockchain and the Internet of Things (IoT) to enhance data security and real-time analytics, thus providing a more holistic and future-proof solution for tourism data management [9,10].

2.2. Social Media and Travel Planning

Another study examines the role of social media in travel planning, particularly how tourists utilize these platforms to research and arrange their travels to Saudi Arabia [11]. It emphasizes the development of a ML classification model based on tourists’ intentions, revealing that factors such as perceived usefulness, ease of use, satisfaction, and both marketing-generated and user-generated content significantly influence their social media use for travel planning. Recent advancements in natural language processing (NLP) and sentiment analysis have further enhanced the accuracy of these models by enabling deeper insights into tourist preferences and behaviors, thereby offering more personalized travel recommendations [12,13]. This research presents a tourist-based ML model that achieved high accuracy, offering valuable implications for Saudi tourism SMEs to refine their digital marketing strategies on social media platforms.

2.3. Evolution of Tourism Forecasting

A comprehensive overview of the evolution of tourism forecasting is provided through a bibliometric analysis focusing on tourism demand forecasting (TDF) and combined tourism demand forecasting (CTDF) [14,15]. This study highlights the exponential growth and diversification in tourism forecasting research, identifying trending topics and influential researchers. Additionally, the integration of machine learning techniques with traditional econometric models has significantly improved the precision of tourism forecasts, particularly in handling complex datasets and capturing nonlinear patterns in tourist behavior [16]. It showcases the utility of bibliometric visualization in communicating key findings and facilitating future research directions in tourism forecasting.

2.4. Personalized Recommendation Systems

Chalkiadakis et al. [17] introduced a groundbreaking hybrid recommender system designed for the tourism sector, merging a Bayesian preferences elicitation method with a novel content-based recommendation approach. This system uniquely employs the Weighted Extended Jaccard Similarity (WEJS) for the first time in a recommender algorithm, showcasing superior accuracy in personalizing touristic points of interest recommendations. Integrated into a real-world tour-planning mobile app, their work demonstrates a significant improvement in recommendation precision, particularly with a specific combination of elicitation slates and images. Moreover, recent research has explored the use of deep learning algorithms to further enhance recommendation accuracy, particularly in predicting complex patterns in tourist preferences across diverse demographic groups [18]. This advancement in recommendation systems could be instrumental in predicting tourist spending by aligning tourists’ preferences with potential spending avenues.

2.5. Deep Reinforcement Learning for Tourism

Claudia Di Napoli [19] contributed to this field with a deep reinforcement learning (DRL)-based planner optimized for cruise passengers’ city tours. The planner excels in maximizing the visitation of attractions within constraints like time and attraction capacities. By achieving an optimal solution within a complex state space after minimal learning steps, Di Napoli’s work exemplifies the potential of DRL in customizing tourist experiences. The integration of DRL with other AI techniques, such as genetic algorithms, has also been shown to further optimize tour planning by efficiently solving multi-objective problems in tourism management [20]. This optimization could be directly correlated with enhancing tourists’ satisfaction and spending, indicating the relevance of intelligent planning tools in the predictive analytics of tourist spending.

2.6. Comprehensive Information Support in Tourism

Leyla Gamidullaeva [21] emphasized the need for comprehensive information support in tourism through the proposition of a universal tourism information recommender system. This system aims to personalize tourist routes by integrating various data sources, including blockchain technology for secure information storage [9]. Recent advancements have further enhanced the system’s capabilities by incorporating real-time data analytics and predictive modeling, allowing for dynamic adjustments to tourist recommendations based on real-time conditions and user feedback [22]. Gamidullaeva’s concept outlines the critical stages of developing personalized tourism products that cater to individual preferences, a factor that can significantly influence tourist spending patterns.

2.7. Search Engine Data for Tourism Demand Prediction

Tourism demand prediction based on search engine data are an active area of research, with a significant number of studies having been conducted in recent years. The accuracy of these forecasts is of critical importance as they provide stakeholders with the data needed to make informed decisions about resource allocation, prioritization, and risk assessment. Mingming Hu et al. [23] applied algorithms like Seasonal Naïve, SARIMA, SARIMAX, ETS, TBATS, k-NN, and HPR to determine that a hierarchical pattern recognition method could recognize the tourism demand pattern in the data stream and generate forecasts of future tourism demand, but the limitations of their study include a shortage of data and high uncertainty. Jian-Wu Bi, Hui Li, and Zhi-Ping Fan [24] utilized deep learning models like SVM, BPNN, CNN, LSTM, and CNN-LSTM to develop a new time series imaging-based deep learning model, but this model is univariate and does not consider other exogenous variables. Björn Bokelmann and Stefan Lessmann [25] applied models like SARIMA, DLM, and a Google Trends (GT)-based model, and found that Google Trends data are useful for short-term predictions, but their study’s forecasts may be affected by spurious patterns. They also proposed a method to sanitize Google Trends data to reduce the adverse impact of these patterns. Xin Li, Rob Law, Gang Xie, and Shouyang Wang [26] used models like Naïve, AR, ARX, ARMA, ARIMAX, and found that search engine data are the most frequently used category of Internet data in tourism forecasting, but their study was limited to analyzing only peer-reviewed full-length English-language articles in scholarly journals. Yang Yang and Honglei Zhang [27] applied models like ARIMA, UCM, Dynamic spatial panel, and STARMA, and found that spatial-temporal forecasting outperforms a-spatial counterparts in terms of average forecasting error, but their study was limited in that the annual data used did not contain seasonality and two provincial regions were excluded due to a lack of data. Chengyuan Zhang, Shouyang Wang et al. [28] applied models like ARIMA, ANN, and state space model, and found that their study provides valuable guidance for improving the accuracy of tourism demand forecasting, but their study was limited to the core database of WoS. Yishuo Zhang, Gang Li et al. [29] applied models like SSA and STL, and found that the maximum predictivity achieved by the models was only related to univariate time series data. The integration of these predictive models with real-time data from search engines and social media has been shown to further enhance forecasting accuracy, particularly in capturing sudden shifts in tourist behavior due to external factors like pandemics or political events [30]. Collectively, these studies underscore the critical role of advanced, personalized recommendation and planning tools in the tourism industry. They offer insights into how leveraging technology can not only enhance tourist experiences, but also provide predictive insights into tourists’ spending behaviors. These technologies pave the way for more sophisticated predictive analytics in tourism, suggesting that machine learning classifiers can benefit significantly from incorporating data on tourists’ preferences and behaviors to forecast spending trends accurately [31].

3. Contributions

Our study makes significant contributions to both the current literature and the economic practice in the tourism sector through the application and optimization of machine learning techniques for forecasting tourist spending patterns in Saudi Arabia.

3.1. Scientific Contributions

  • Advanced data analysis and modeling:
    -
    We utilized comprehensive Exploratory Data Analysis (EDA) techniques to prepare and understand the dataset, enhancing the reliability of the models.
    -
    We applied and optimized a diverse array of machine learning algorithms (e.g., Decision Tree, Random Forest, K Neighbors Classifier, Gaussian Naive Bayes, Support Vector Classification) tailored to the tourism domain.
  • Novel use of ARIMA for time series forecasting:
    -
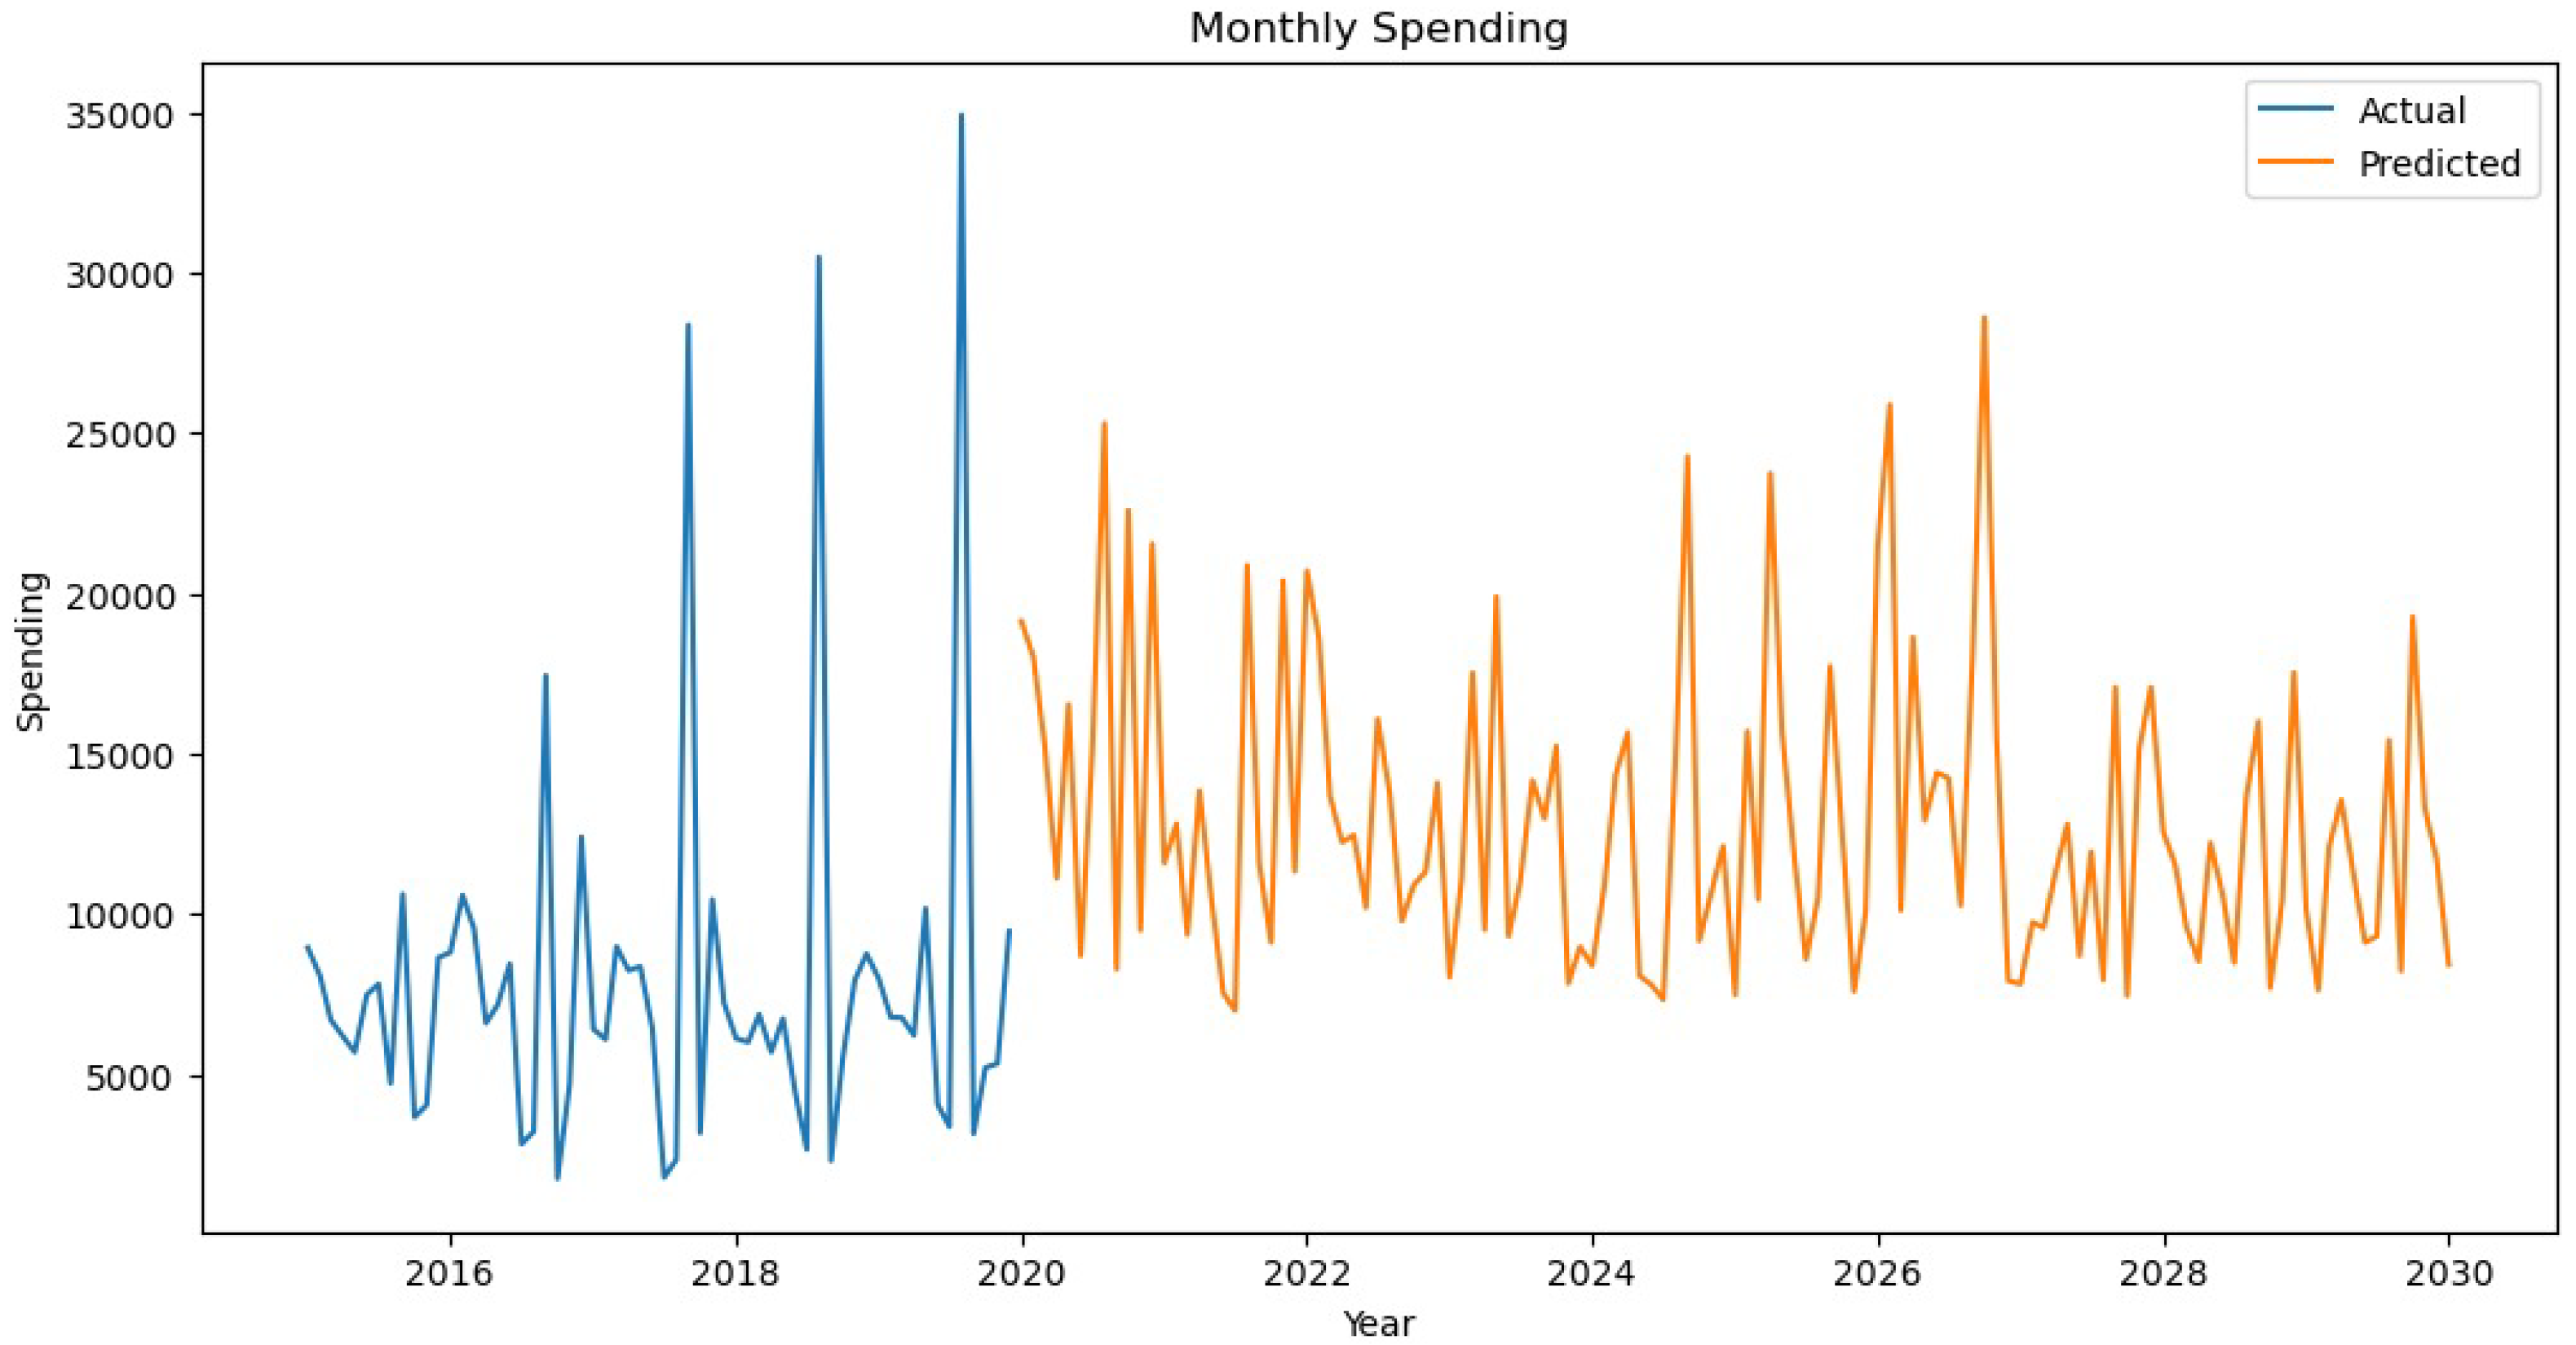
    We introduced ARIMA models to capture temporal fluctuations in tourist spending, providing accurate future spending predictions, particularly valuable in the context of disruptions like the COVID-19 pandemic.
  • Rigorous model evaluation:
    -
    We conducted detailed performance evaluations using metrics such as Mean Absolute Error, Mean Squared Error, and Median Squared Error, contributing to the methodological rigor in tourism forecasting research.

3.2. Practical Contributions

  • Informed decision-making for policymakers:
    -
    We provided tools for anticipating and responding to changes in tourist behavior and spending patterns, aiding policymakers in optimizing resource allocation and strategic planning, especially during disruptions.
  • Enhanced marketing strategies:
    -
    We offered insights that enable tourism businesses to tailor marketing strategies, personalize offers, and optimize pricing based on predicted spending patterns, improving customer targeting and engagement.
  • Support for sustainable tourism development:
    -
    We promoted the development of sustainable tourism models by forecasting spending and identifying trends, helping stakeholders plan for balanced economic, environmental, and social growth.
These contributions enrich the predictive analytics toolkit for researchers and practitioners in the tourism sector, facilitating informed decision-making and strategic planning to enhance economic outcomes and sustainability in tourism.

4. Data

In this paper, the dataset was collected from the Tourism Authority of Saudi Arabia https://www.sta.gov.sa/en/home. The data were requested from the Authority and collected in a prompt manner, covering a period of 6 years. This period was selected as it saw a recovery in the tourism industry in Saudi Arabia. The data collected includes information on the number of tourists visiting the country from abroad, the areas they visited, their spending patterns, and the continents they originated from. Our dataset is wide and distributed on multiple files and sources, which we recall that all are provided by the Tourism Authority of Saudi Arabia.
The dataset, provided by the Tourism Authority of Saudi Arabia, consists of monthly tourist spending data from 2016 to 2021, totaling 72 data points. Each data point represents the aggregate spending for that month. The features include the number of tourist visits, number of tourist visits, and total expenditure. The response variable is the monthly total tourist expenditure. Data preprocessing involved handling missing values, translating from Arabic to English, and normalizing the data. The ARIMA model was applied for time series forecasting, while classifiers were used to categorize spending patterns based on the aggregated monthly data.
The challenges faced in collecting these data included limited access to publicly available data, issues with data quality, and concerns about data privacy. Initially, the data were in Arabic and contained missing values, necessitating translation to English and the handling of these missing values. Additionally, ensuring data privacy was crucial due to the sensitive nature of the information being handled.
Table 2 summarizes the data by providing the total of tourist visits, overnights, expenditure in Saudi Arabia Riyal (SAR), average length of stay, average expenditure per trip, and average expenditure per night. We draw the attention to the fact that USD 1 = SAR 3.75.
Figure 1 is a screenshot from our dataset file representing the key tourism indicators in Saudi Arabia. It contains tourism data segmented into four categories: Inbound Tourism, Domestic Tourism, Internal Tourism, and Outbound Tourism. Each category has key indicators across multiple years from 2015 to 2021.
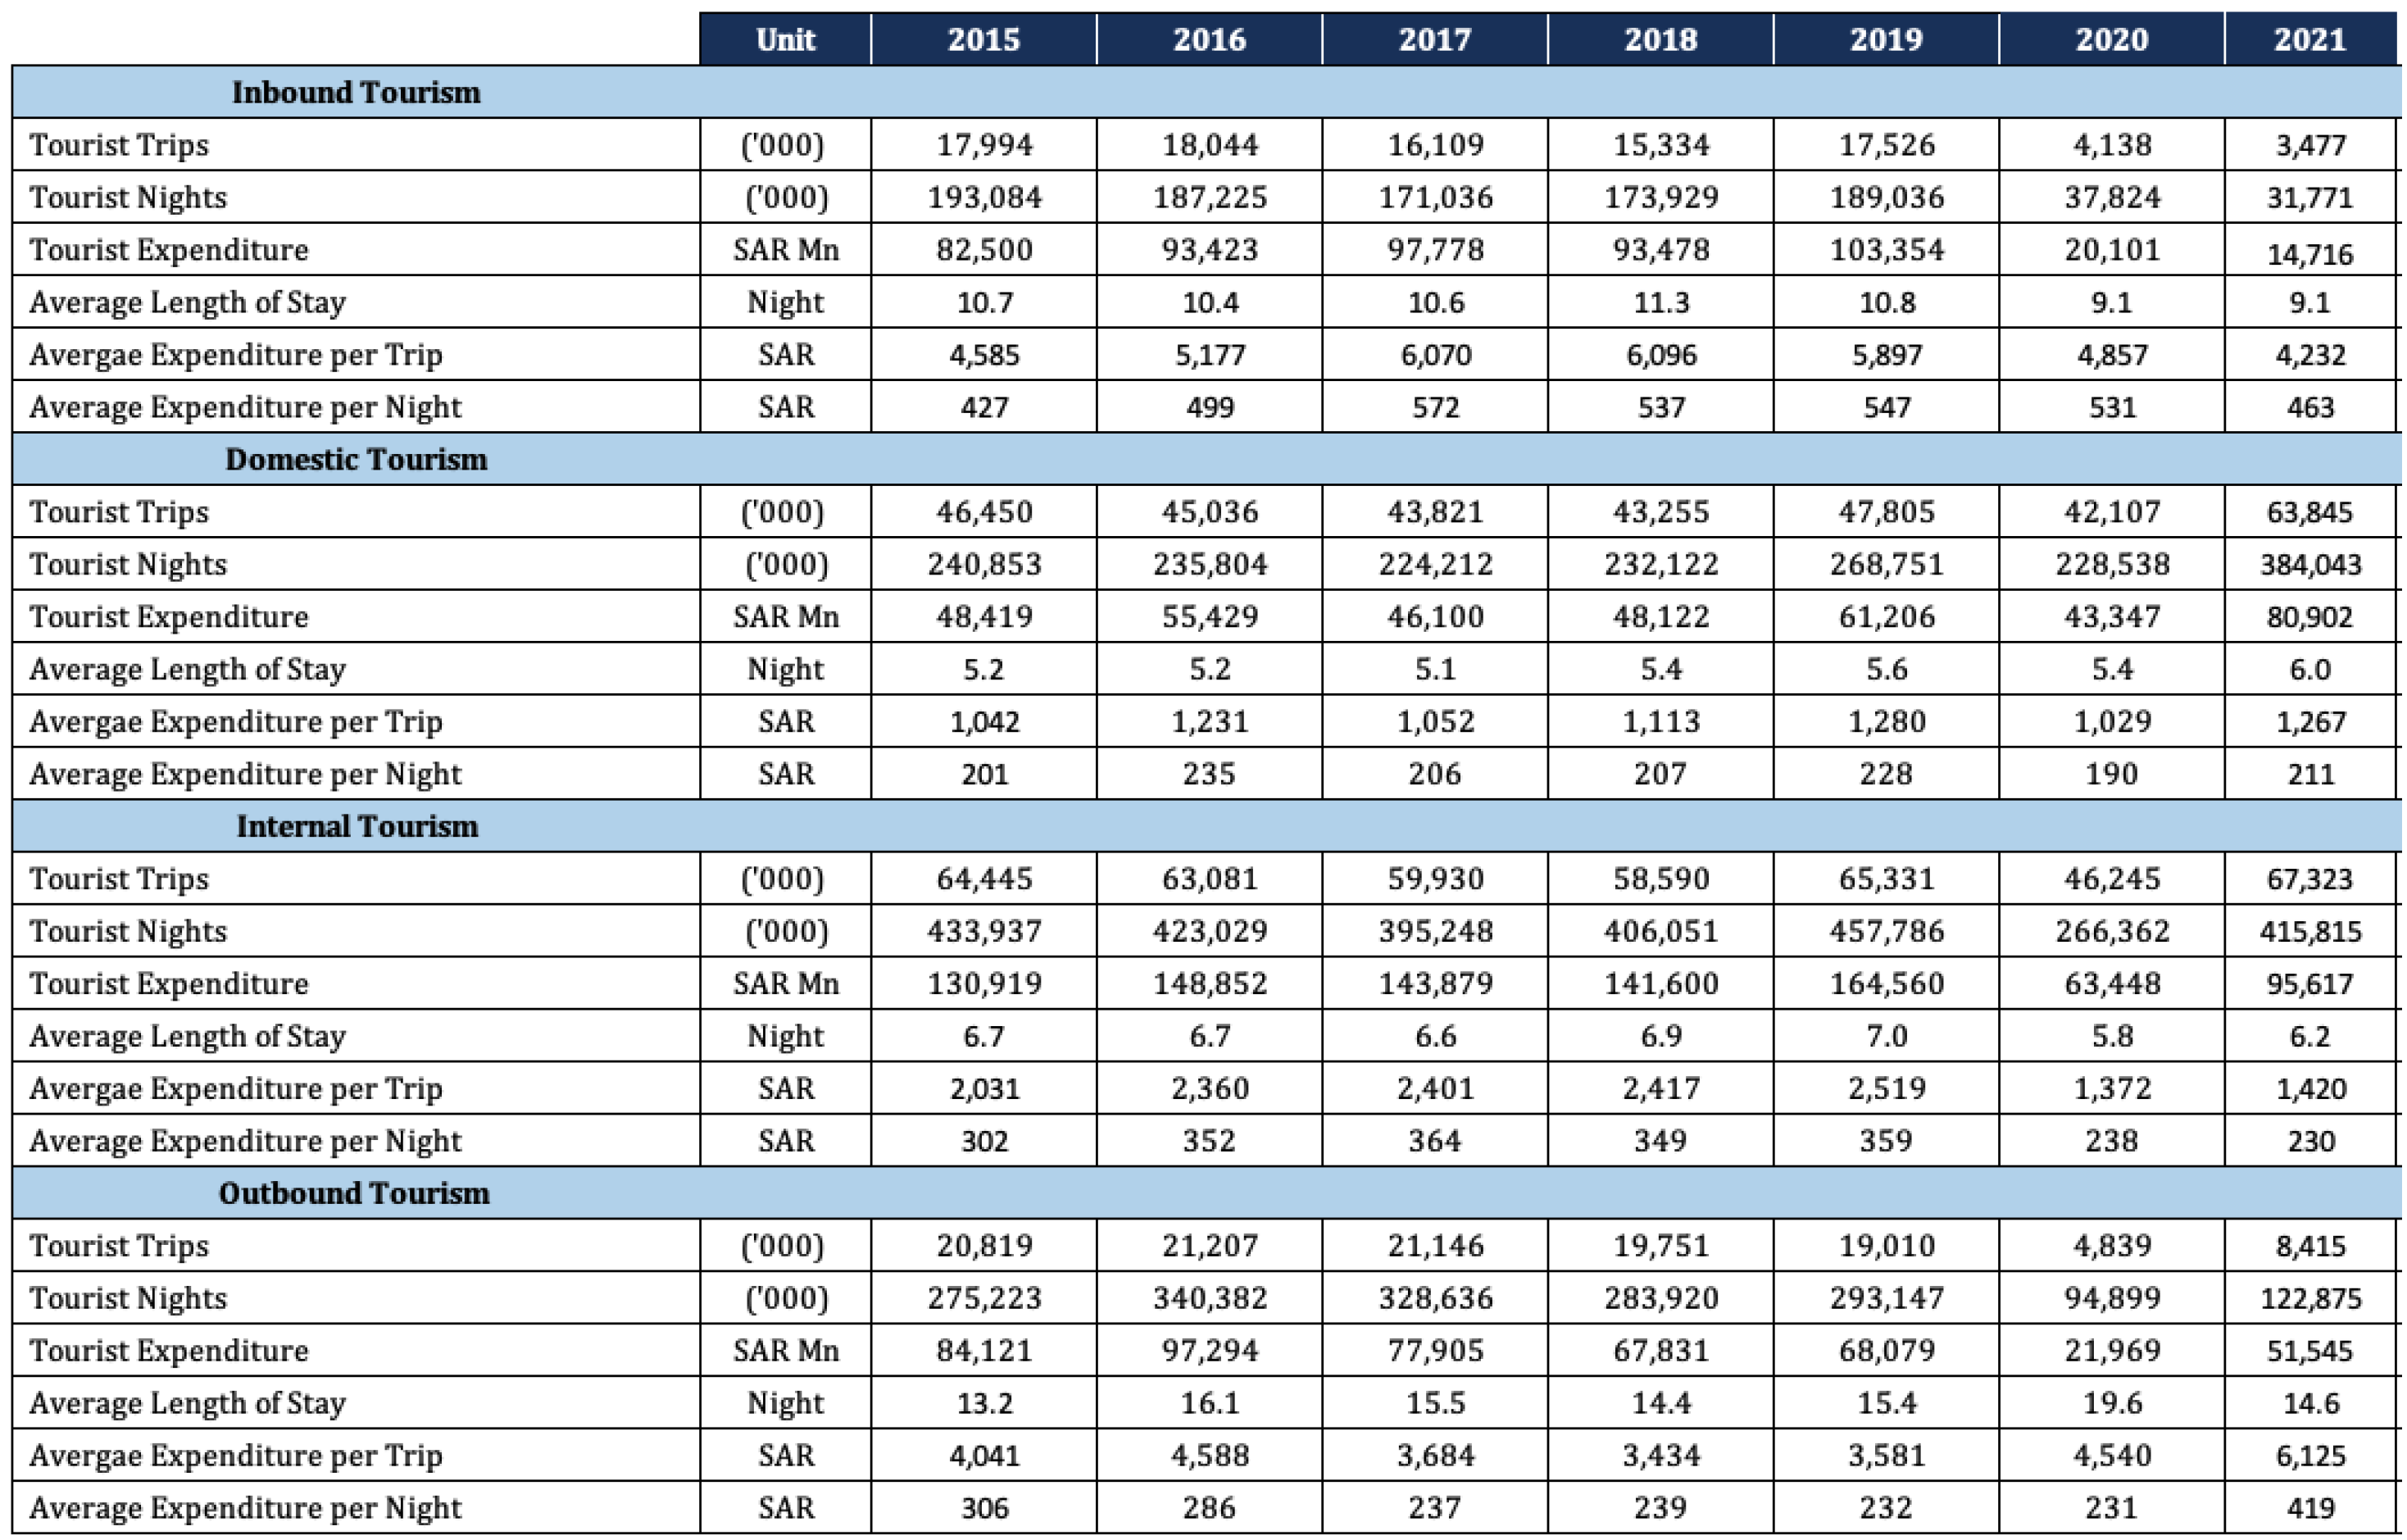
  • Inbound Tourism: Shows the number of tourist visits and overnights spent, expenditure, and the average length and expenditure per trip and per night for tourists coming into the country. The data spans from 2015 to 2021, and there is a noticeable decrease in tourist visits and overnights in 2020 and 2021, likely due to the impact of the COVID-19 pandemic. The expenditure in SAR millions and the average expenditure per trip and per night also reflect changes over these years.
  • Domestic Tourism: Details similar indicators but for tourism within the country. Again, there is a decrease in visits and overnights in 2020, with a slight rebound in 2021. The expenditure patterns and average expenditures per trip and night also fluctuate over the years.
  • Internal Tourism: This category tracks tourism data for residents within the country and shows similar trends to domestic tourism. The numbers for visits, overnights, and expenditure in SAR millions generally increase from 2015 to 2019 before falling in 2020, with some recovery in 2021. We draw the attention that domestic tourism refers to residents traveling within their own country, while internal tourism encompasses both domestic tourism and inbound tourism (international visitors traveling within the country).
  • Outbound Tourism: Contains data for residents traveling out of the country. This section shows a sharp decrease in tourist visits and overnights from 2019 to 2020, with a slight increase in 2021. Expenditure and average expenditure per trip and per night exhibit significant drops in 2020 but show increases in 2021.
Table 3 provides a clear definition of the variables used in the study:
For illustration purposes, we pick the year 2021. Figure 2 represents a screenshot from our dataset. It shows detailed tourism statistics by province for the year 2021, broken down by month. The data include the number of tourist visits and expenditures in SAR. Each province has its own set of statistics. Each column represents a province or region within Saudi Arabia. The last column is labeled “Grand Total”, which sums up the data for all provinces per month and for the entire year. The rows are divided by months from January to December. For each month, there are two sub-rows: one for the number of tourist visits (measured in ’000) and another for tourist expenditure (in SAR). At the bottom, there is a total for each indicator, providing an annual sum for visits and expenditure. The numbers are a quantitative representation of tourism activity in each province and across the country. The “Trips” rows list the number of tourist visits in thousands, while the “Expenditure (SAR)” rows show the money spent in millions of Saudi Riyals. Figure 2 reveals monthly and regional trends in tourism activities. For example, there could be peaks during certain months that correspond to holiday seasons or events. Similarly, some regions may attract more tourists or generate higher expenditure, which could be of interest to researchers or policymakers in tourism.

4.1. Challenges Faced

Briefly, we enumerate the main challenges faced related to data collection, which are as follows:
  • Access to data: Access to reliable data on the economic impact of tourism in Saudi Arabia has been challenging due to the limited availability of publicly accessible data. The data were obtained from the Tourism Authority of Saudi Arabia.
  • Reliable data sources: obtaining reliable sources of data has been a challenge, with limited sources available for the study.
  • Data quality: The data were initially collected in Arabic and contained missing values, which posed a challenge during data analysis. To overcome this challenge, the data were translated into English and missing values were removed.
  • Data privacy: data privacy is a crucial issue in the tourism industry, as the collected data may contain sensitive information that needs to be protected.

4.2. Exploratory Data Analysis (EDA)

Exploratory Data Analysis (EDA) is an important step in understanding the properties of a dataset before applying any modeling techniques. In this study, EDA was performed to assess the dataset and examine the relationships between variables and attributes. This analysis brought outliers to light, which were removed from the dataset as they were found to be due to specific experimental failures. A correlation matrix was constructed to evaluate the relationships between variables and attributes. The correlation matrix provides a remeasured version of the variance matrix, designed to analyze and predict the changes in the number of foreign tourists visiting Saudi Arabia. Each cell in the correlation matrix represents the association between two specific variables. For example, a correlation of 0.43 between the variables ’Inbound-region’ and ’date’ indicates a positive relationship, while a correlation of 0.01 between ’Inbound-region’ and ’Destination’ suggests a weak negative relationship. The diagonal of the correlation matrix consists of correlation coefficients equal to 1, as each variable is completely related to itself. The correlation matrix is illustrated in Figure 3.
To visualize the connections and relationships between several variables, a scatter plot is created. This is helpful in providing a quick overview of the data’s distribution and identifying any outliers. The spending rates are plotted on the X-axis, while the destinations are plotted on the Y-axis, as depicted in Figure 4.
We have analyzed the distribution and correlation between the spending rates and the Inbound-regions. By linking the spending rates with the Inbound-regions, we can assess the relationship between them. For example, Figure 5 illustrates that the highest spending rates are recorded in Asia, compared to other continents. The presence of outliers in the chart is also noticeable.
A radar chart, shown in Figure 6, is a two-dimensional diagram used to display variables plotted on an axis. It resembles a spider’s web, with a central axis and multiple radii representing different variables. In this case, the radar chart is used to show the trends in spending rates over the years, ranging from 4000 to 6000. The years are plotted on the axis, allowing you to quickly see the periods of high and low spending rates. The radar chart provides a useful visual representation of the changes in spending rates over time.
The correlation matrix illustrated in Figure 3 evaluates the relationships between numeric variables which are number of tourist visits, number of tourist visits, tourist expenditure, average expenditure per trip, average expenditure per night. The correlation matrix provides a measure of the linear association between these variables, with each cell representing the correlation coefficient between two specific numeric variables. For example, a correlation of 0.43 between the variables ’Inbound-region’ and ’date’ indicates a positive relationship, while a correlation of 0.01 between ’Inbound-region’ and ’Destination’ suggests a weak negative relationship. The diagonal of the correlation matrix consists of correlation coefficients equal to 1, as each variable is completely related to itself. To visualize the connections and relationships between several variables, a scatter plot was created. This is helpful in providing a quick overview of the data’s distribution and identifying any outliers. The spending rates are plotted on the X-axis, while the destinations are plotted on the Y-axis, as depicted in Figure 4. The ’connections’ refer to the direct relationships between individual variables, indicating how one variable changes in relation to another. ’Interconnections’ refer to more complex relationships where multiple variables interact with each other, highlighting the combined effect of several variables on the data distribution. We also analyzed the distribution and correlation between the spending rates and the Inbound-regions. By linking the spending rates with the Inbound-regions, we can assess the relationship between them. For example, Figure 5 illustrates that the highest spending rates are recorded in Asia compared to other continents. The presence of outliers in the chart is also noticeable. A radar chart, shown in Figure 6, is a two-dimensional diagram used to display variables plotted on an axis. It resembles a spider’s web, with a central axis and multiple radii representing different variables. In this case, the radar chart is used to show the trends in spending rates over the years, ranging from 4000 to 6000. The years are plotted on the axis, allowing you to quickly see the periods of high and low spending rates. The radar chart provides a useful visual representation of the changes in spending rates over time.

4.3. Data Cleaning and Processing

The data collection process involved converting the raw and complex data into a format that can be easily analyzed. This involved several steps, including data cleaning and processing. In this section, we describe the steps taken to clean and process the dataset.
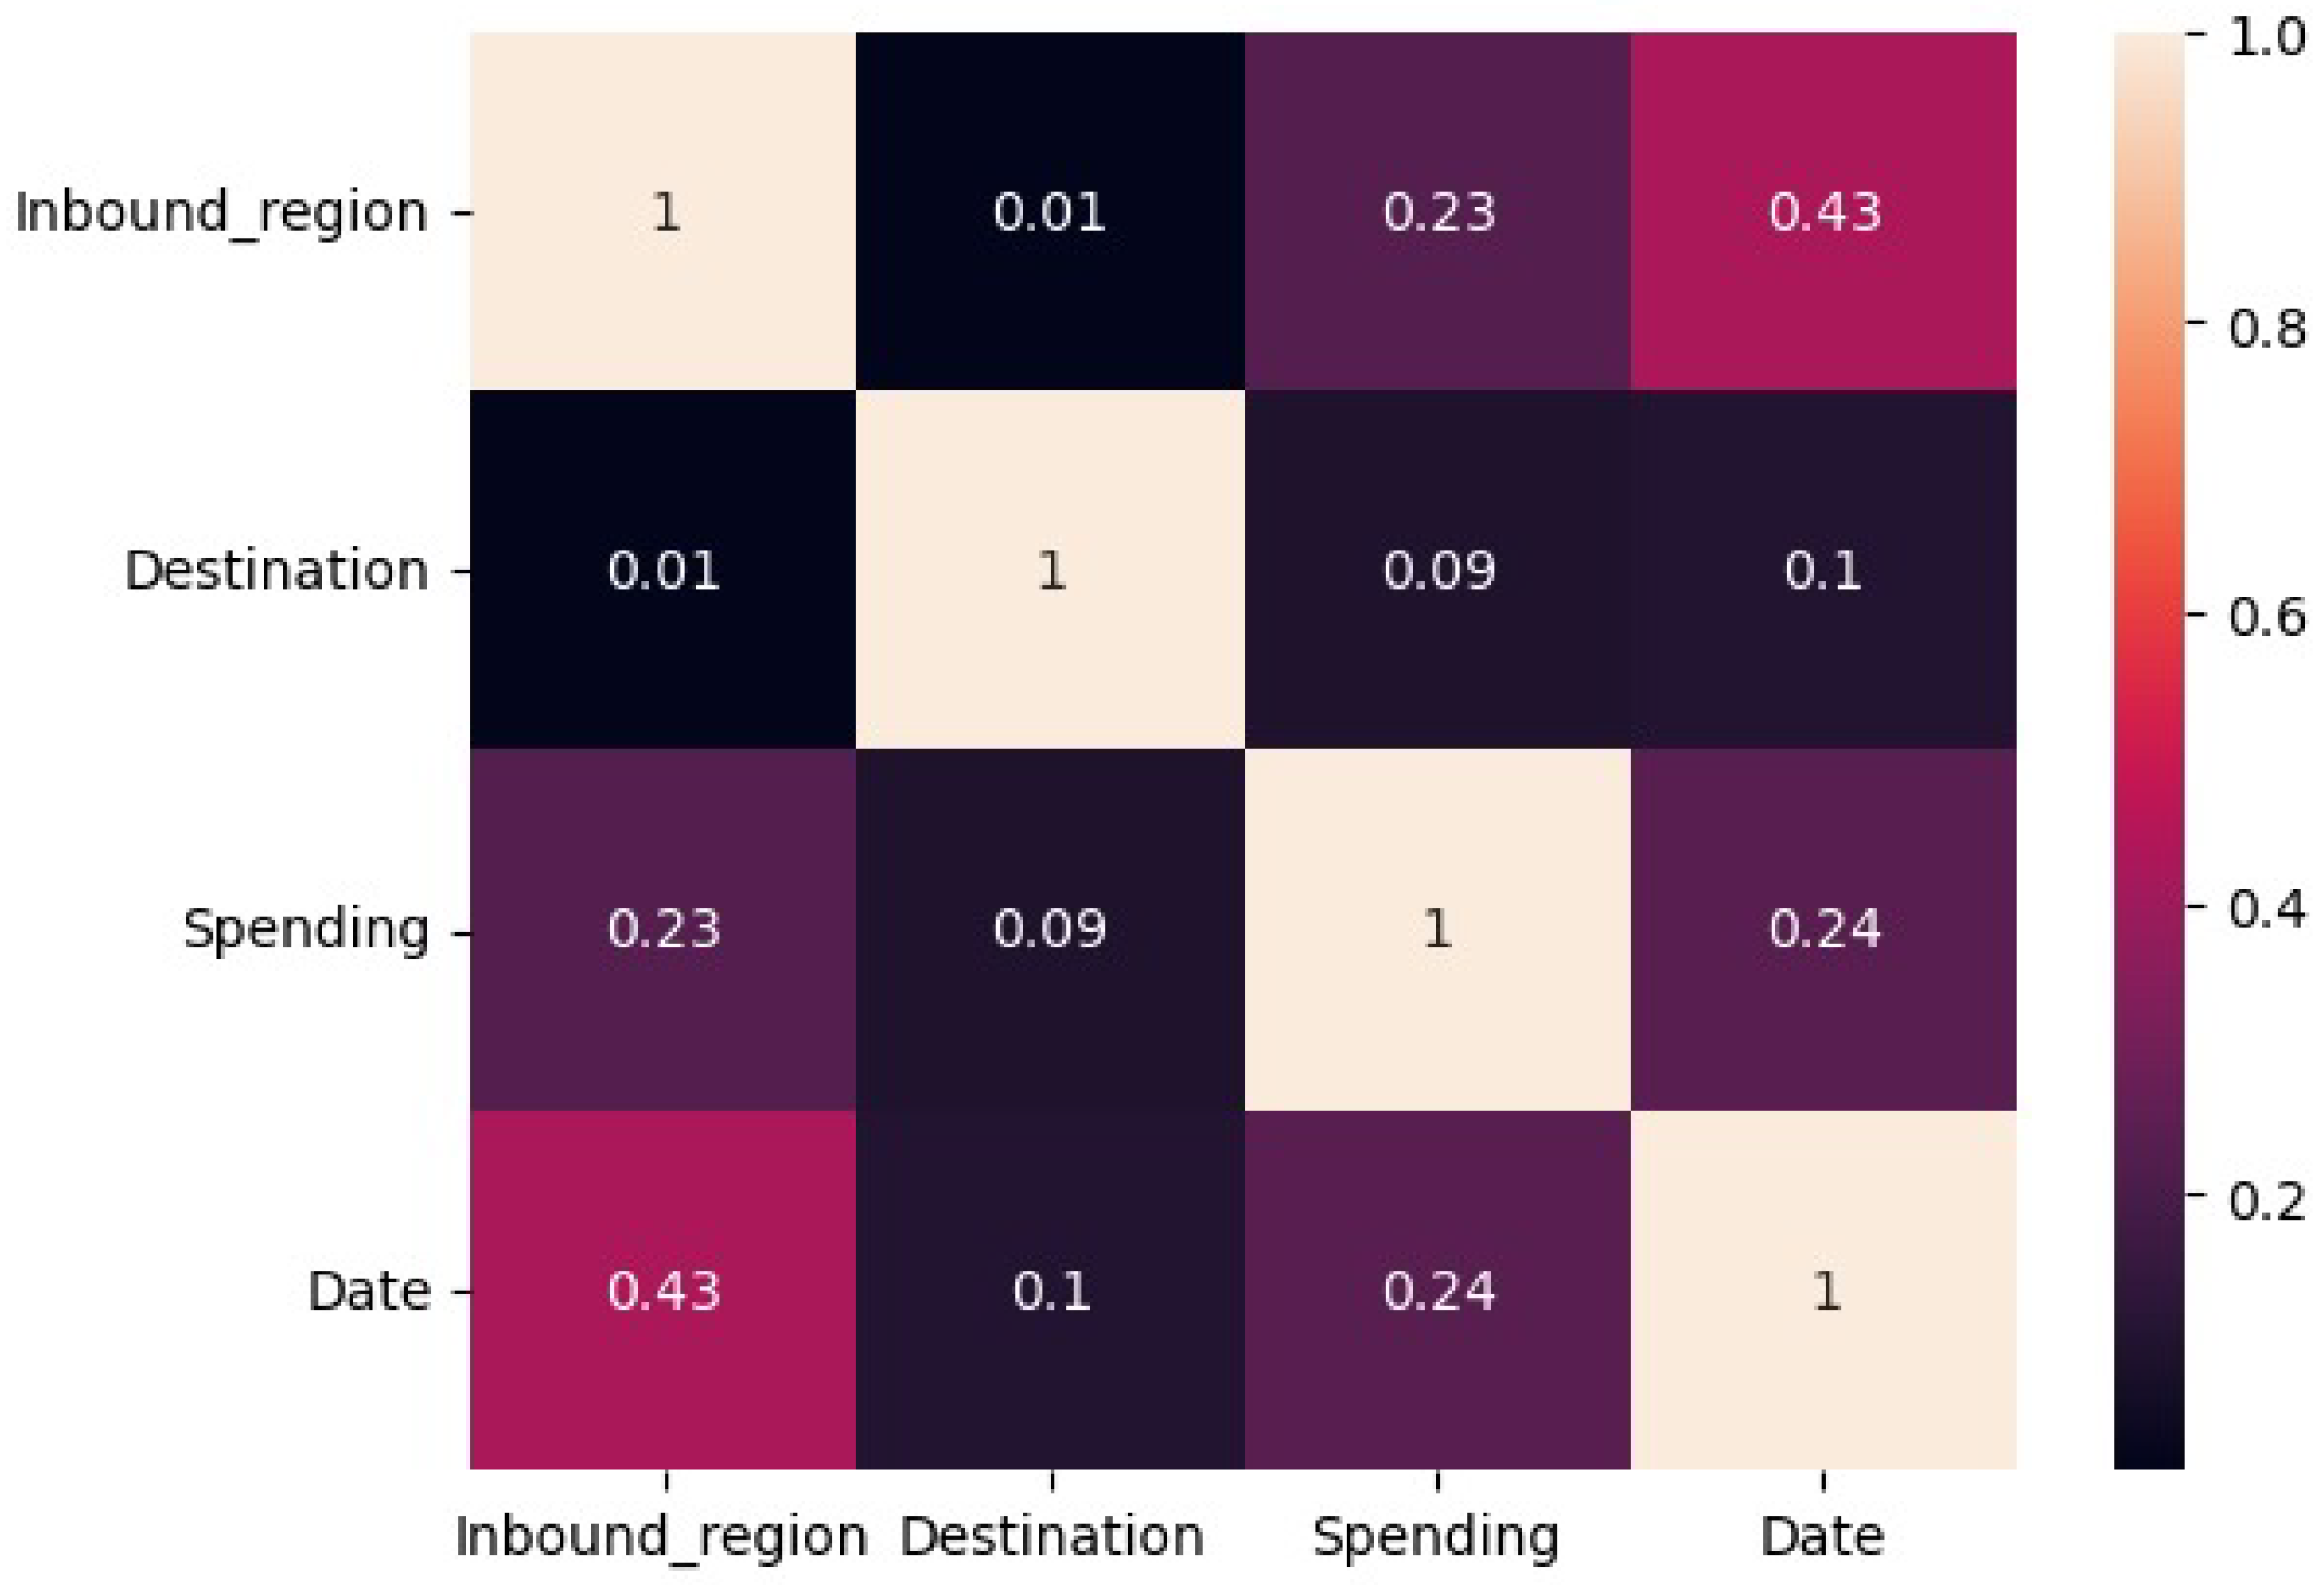
  • Data characteristics: The key attributes of the dataset are “Inbound Region”, “Date”, “Destination”, and “Spending”. Any additional attributes were removed.
  • Translation: the original dataset was in Arabic, so it was translated into English for ease of analysis.
  • Missing value handling: A missing value issue was detected in the “Inbound Region” attribute. To resolve this, we used the Series.bool() function to identify missing values and replaced 65 missing values with “other countries”.
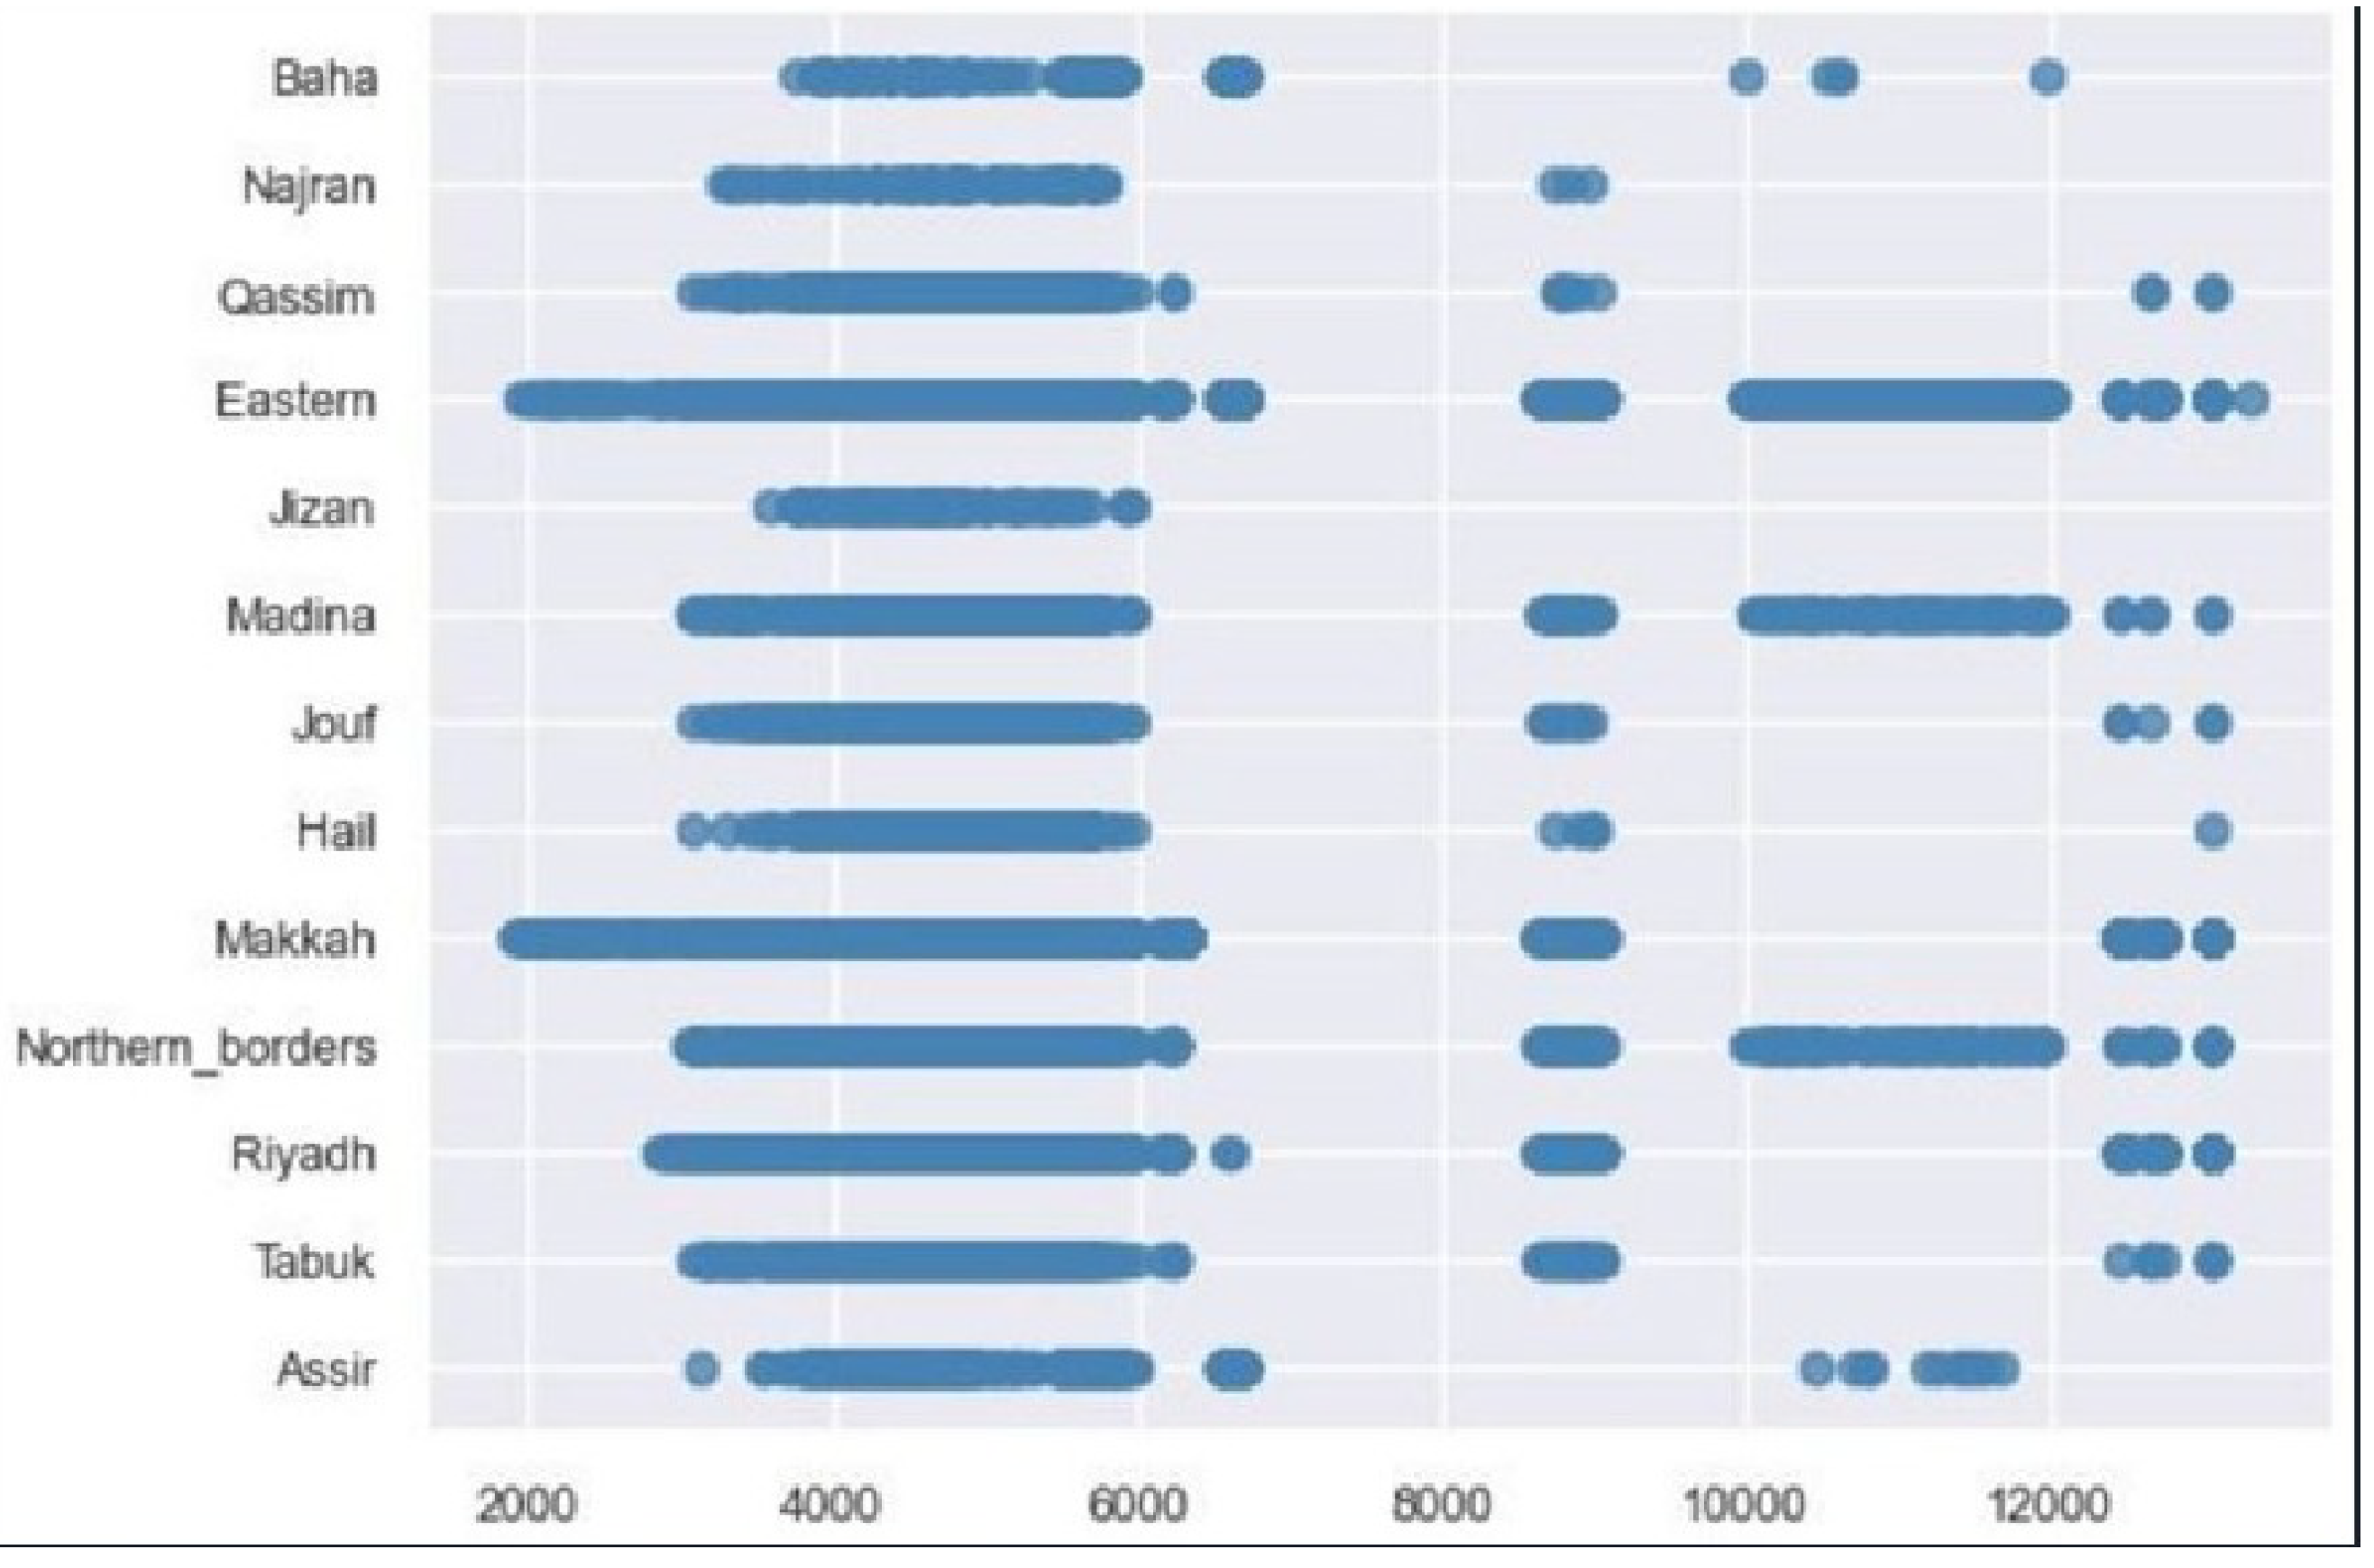
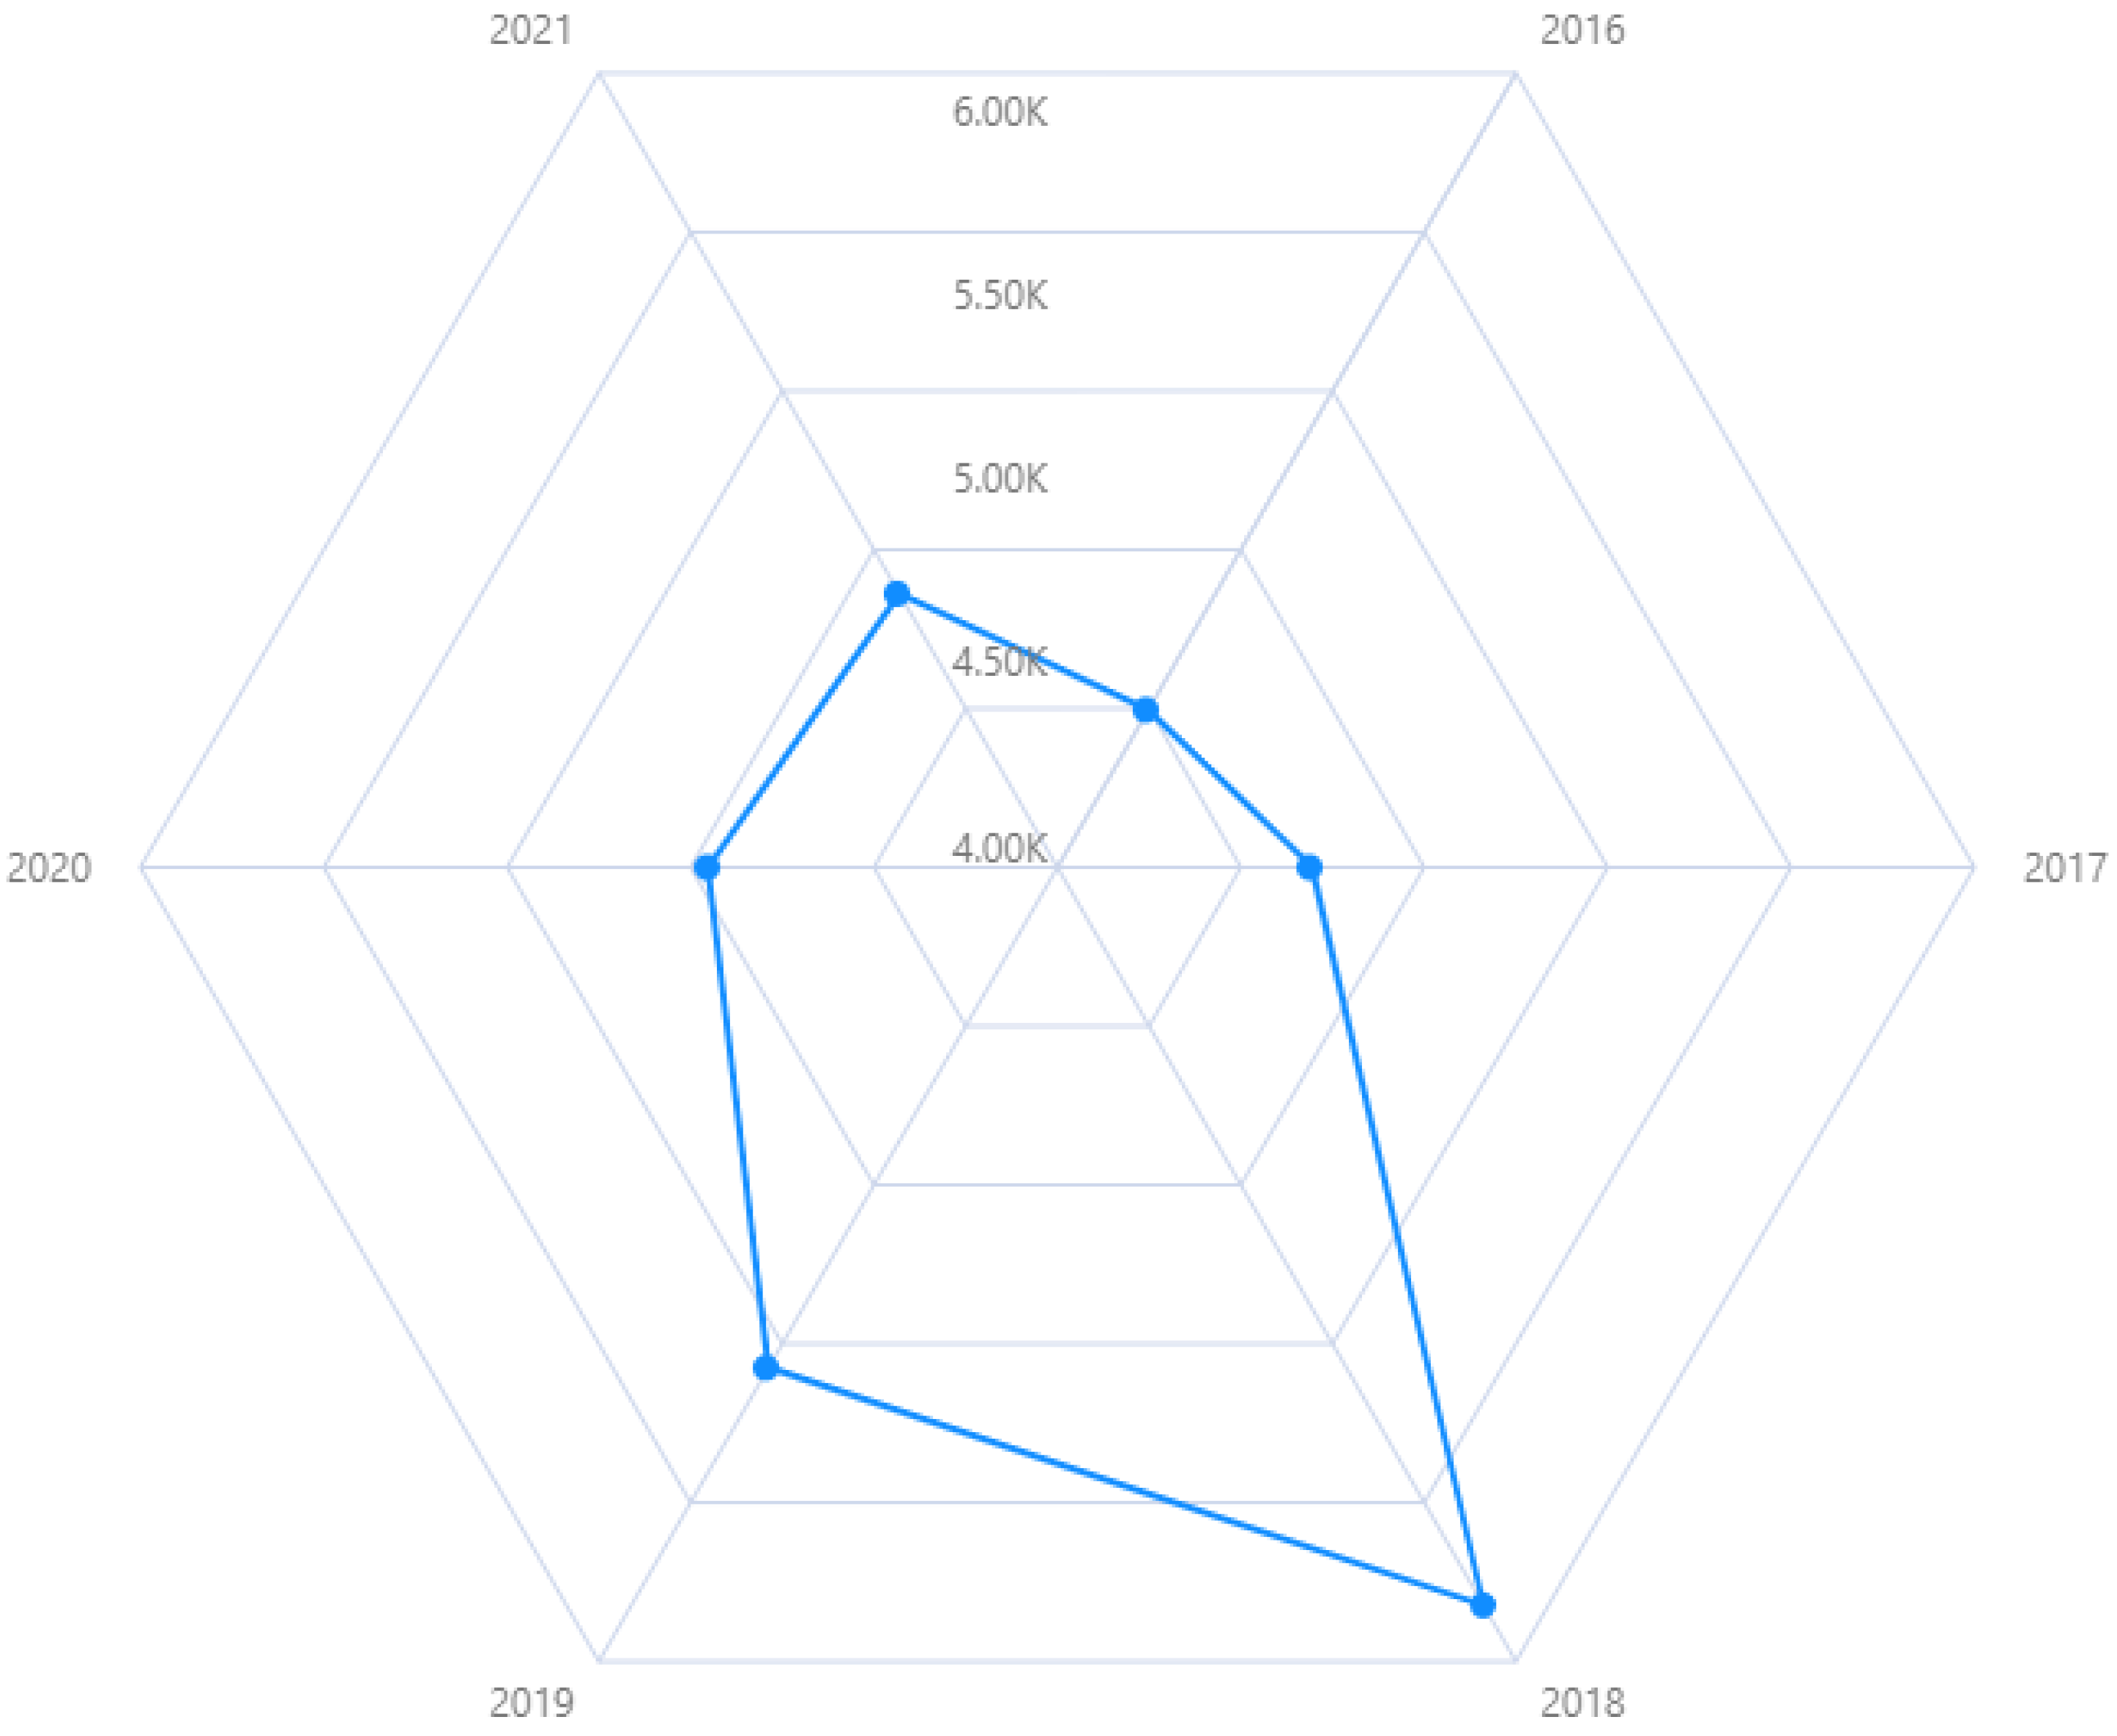
  • Definition of spending: the “Spending” attribute represents the average spending per year and month for each arrival.
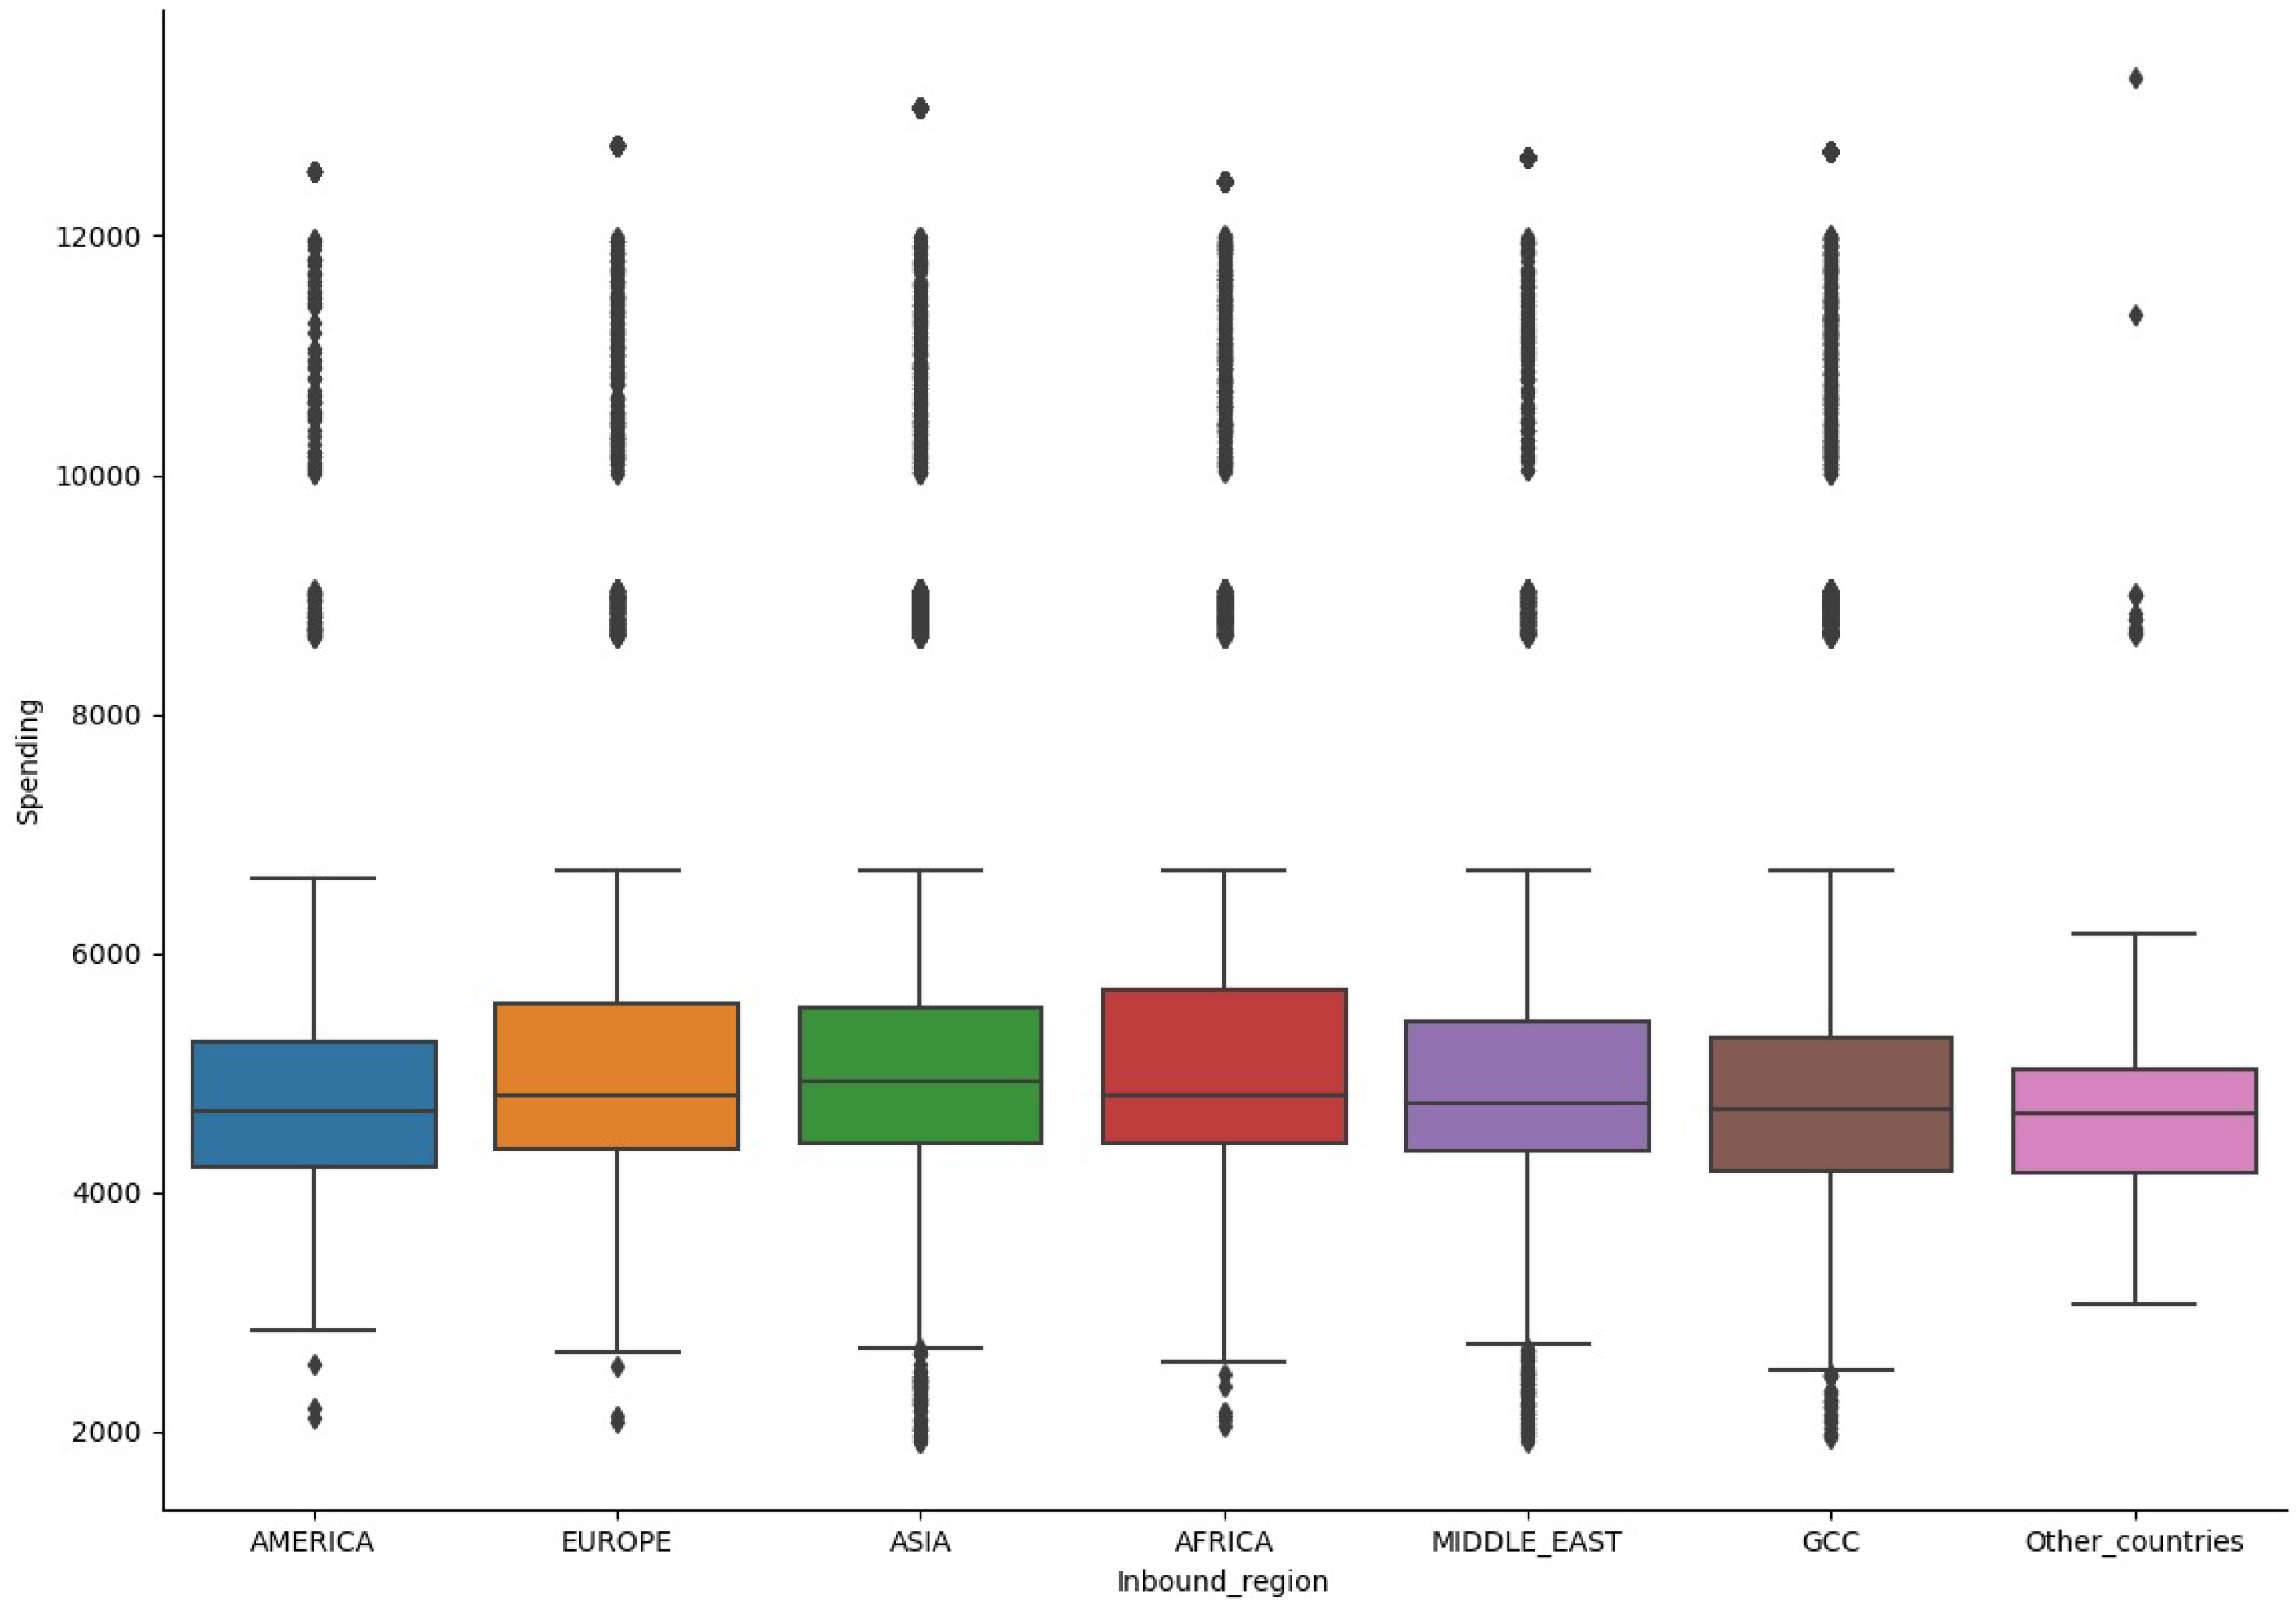
  • Definition of inbound region: to simplify the analysis, anyone who was not from a specific continent (America, Asia, Africa, Middle East, or GCC) was considered to be from “other countries”.
By following these steps, we were able to clean and process the dataset, ensuring that it was ready for exploratory data analysis and modeling.
The data collection process involved converting raw and complex data into an easily analyzable format, which required several steps including data cleaning and processing. Key attributes such as “Inbound Region,” “Date,” “Destination,” and “Spending” were retained, while unnecessary attributes were removed. The original dataset, initially in Arabic, was translated into English for analysis. A significant issue with missing values in the “Inbound Region” attribute was addressed by replacing 65 missing values with “other countries,” although imputation techniques could have been employed for better accuracy. The “Spending” attribute was defined as the average spending per year and month for each arrival, and “Inbound Region” was simplified to categorize anyone not from a specific continent (America, Asia, Africa, Middle East, or GCC) as from “other countries”. These steps ensured the dataset was adequately cleaned and processed, ready for exploratory data analysis and modeling.

5. Hyper-Parameter Tuning

This section describes the tuning of hyperparameters for our selected ML models. The objective of this phase was to optimize the models’ settings to enhance their prediction accuracy and performance. We employed different strategies for tuning, including Grid Search for Decision Trees and Random Forest, Gradient Descent for Linear Regression, and specific adjustments for K Neighbors Classifier, Gaussian Naive Bayes, and Support Vector Classification. Below, we detail the approaches taken for each algorithm.

5.1. Grid Search for Decision Tree and Random Forest

For the Decision Tree and Random Forest models, a Grid Search approach was utilized to systematically explore a range of hyperparameter values. This process involved:
  • Splitting the dataset into an 80/20 training and testing partition.
  • Creating a pipeline incorporating Decision Trees, Random Forest, and Linear Regression algorithms.
  • Compiling a list of hyperparameter values for exploration.
  • Conducting the Grid Search to find the optimal hyperparameter combination.
  • Training the models using the selected hyperparameters and evaluating their performance.

5.2. Gradient Descent for Linear Regression

For Linear Regression, the Gradient Descent method was employed to minimize the cost function, thereby optimizing the model’s parameters for better accuracy. The Gradient Descent method was employed to optimize the model’s parameters for better accuracy. Gradient Descent is an iterative optimization algorithm used to minimize the cost function by adjusting the model parameters (weights) in the direction that reduces the error. The steps involved in this optimization included:
  • Initializing model parameters (m and c) and the learning rate (L).
  • Iteratively adjusting m and c based on the gradient of the cost function to find the minimum. The adjustment is performed based on Equations (1) and (2).
m = m L . D m
c = c L . D c
By applying gradient descent, the linear regression model iteratively improves its predictions by reducing the error between the predicted and actual values. This method ensures that the model parameters converge to the values that best fit the data.

5.3. K Neighbors Classifier

The core of the KNN algorithm is to classify a sample based on the majority vote of its k nearest neighbors. The distance between the sample x and a given point x i in the dataset is typically calculated using the Euclidean distance shown in Equation (3).
d ( x , x i ) = j = 1 n ( x j x i j ) 2
where n is the number of features, x j is the jth feature of sample x, and x i j is the jth feature of the ith neighbor.

5.4. Gaussian Naive Bayes

For a given dataset with n features, the Gaussian Naive Bayes classifier assumes that the likelihood of the features is Gaussian. The probability of a feature x i given a class y is calculated as shown in Equation (4).
P ( x i | y ) = 1 2 π σ y 2 exp ( x i μ y ) 2 2 σ y 2
where μ y is the mean of feature x i for class y, and σ y 2 is the variance of feature x i for class y.

5.5. Support Vector Classification

The Support Vector Classifier aims to find the hyperplane that best separates the classes. The decision function for the linear kernel is provided in Equation (5).
f ( x ) = w T x + b
where w is the weight vector, x is the feature vector, and b is the bias. For non-linear classification, kernel functions are used to transform the feature space, which is shown by Equation (6).
f ( x ) = i = 1 N α i y i K ( x i , x ) + b
where α i are the Lagrange multipliers (non-zero for support vectors), y i are the class labels, K is the kernel function, and x i are the support vectors.

5.6. Regularization in SVC

The regularization parameter C in SVC controls the trade-off between achieving a high margin and a low classification error on the training data (refer to Equation (7).
C = 1 λ
where λ is the regularization strength. A higher C (lower λ ) puts more emphasis on classification accuracy, potentially leading to overfitting, while a lower C (higher λ ) focuses on a wider margin.
After the hyperparameters tuning k in KNN, and the kernel type and C in SVC, along with considering the distribution parameters in GNB, these models are ready and finely tuned for optimal performance on our dataset.

5.7. Enhanced Table of Hyperparameter Tuning Results

We recall that we have employed various strategies to optimize the settings for our selected machine learning models, including Decision Trees, Random Forests, Linear Regression, K-Neighbors Classifier, Gaussian Naive Bayes, and Support Vector Classification. Specifically, Grid Search was used for Decision Trees and Random Forests to explore a range of hyperparameter values systematically, while Gradient Descent was applied for Linear Regression to minimize the cost function. The K-Neighbors Classifier was tuned by adjusting the number of neighbors and the weight function, Gaussian Naive Bayes involved estimating the mean and variance for each feature given a class, and Support Vector Classification required optimizing the regularization parameter C and the kernel type. These comprehensive tuning processes were essential for enhancing the accuracy and performance of our predictive models, ensuring they are well-suited to the unique dynamics of the tourism data.
The outcomes of our hyperparameter tuning process are summarized in Table 4, presenting the optimized settings for each model. These optimized hyperparameters significantly contribute to the improved performance and accuracy of the machine learning models used in our study.

6. Machine Learning Techniques: Implementation and Results

ML techniques are mathematical models or techniques used to analyze data [32]. In this work, we will identify the tools and techniques required to predict a model. When using these methods and techniques, accuracy ability helps measurements of each model’s results significantly increase confidence in predictions. After cleaning the data, we have knowledge of the data set, and we will apply a suitable ML method set that fits our dataset [33]. ML is a subset of artificial intelligence (AI) that focuses on building techniques that enable prediction or decision-making in general [34], ML techniques use statistical techniques [35] to identify patterns in data, model building [36], predictive analyses, and others. Many techniques can be used to predict expected tourism expenditure rates [37]. After the study, we found Decision Tree, Random Forest, K Neighbors Classifier, Linear Regression, Gaussian Naive Bayes, and Support Vector Classifier.

6.1. Decision Tree

In general, a decision tree classifier is considered as automated learning algorithm used to analyze classification and regression [38]. It is the simplest and most widely used supervised learning techniques. This model can accurately predict performance; however, in our study we need to predict the value of expenditure. To do so, we adapted Algorithm 1:
Algorithm 1: Decision tree classifier
Information 15 00516 i001
With our dataset, we discovered the top Decision Tree outcomes. When the depth is set to 5, we obtain the following result:
  • Decision Tree Regressor Train Score is: 0.7711744010593006.
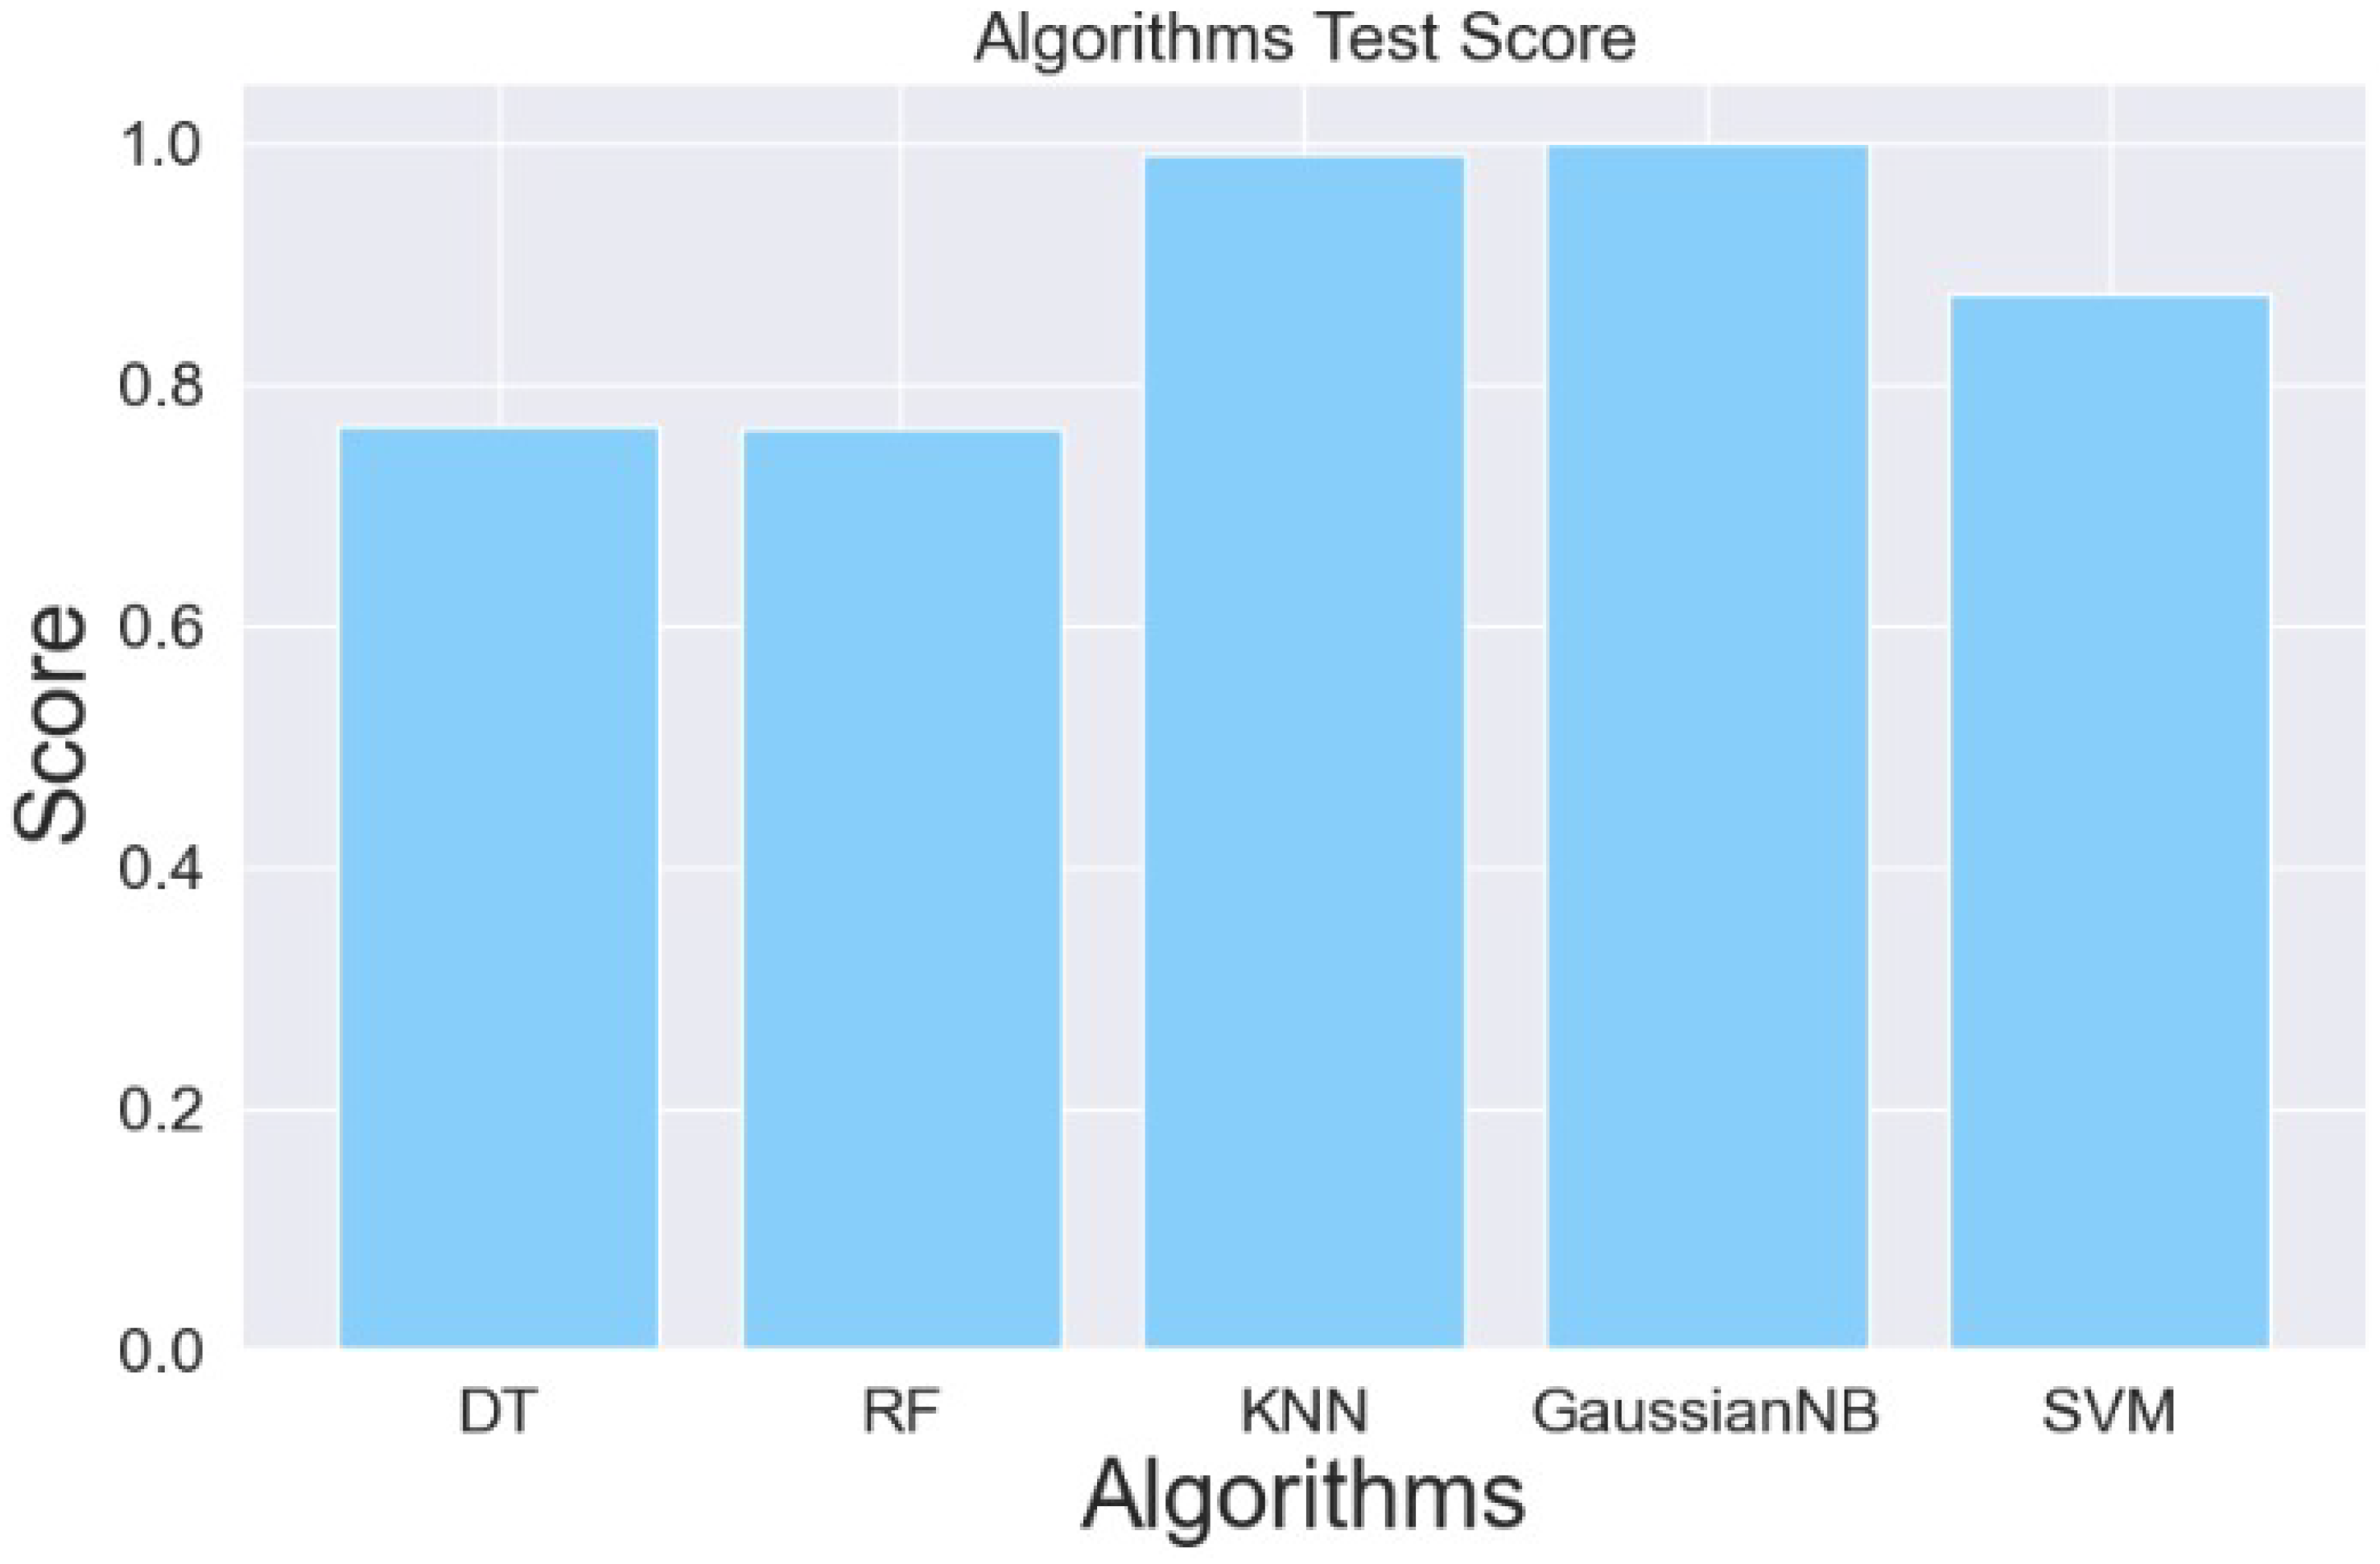
  • Decision Tree Regressor Test Score is: 0.7656243281246076.
Figure 7 shows the expected values from the Decision tree.

6.2. Random Forest

The classifier called Random Forest is an algorithm that combines multiple decision trees to improve accuracy. It is utilized through two packing learning techniques, and a random selection that works by creating multiple decision trees on different subsets of data and then compiling their predictions to make a final prediction. Each tree is trained in a sample of training evidence and a majority of the tree is vote’s makes predictions. The adapted Random Forest classifier is shown in Algorithm 2.
Algorithm 2: Random Forest classifier
Information 15 00516 i002
We discovered the best Random Forest outcomes with our dataset when the depth is 5 and the estimator is 3. So, considering the best result, we obtain the following score:
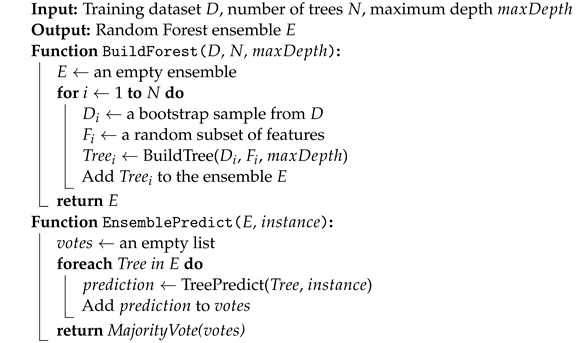
  • Random Forest Regressor Train Score is: 0.7719526966127606.
  • Random Forest Regressor Test Score is: 0.7636511565432864.
Figure 8 shows the expected values from the Random Forest.

6.3. K Neighbors Classifier

K-Neighbors Classifier is a simple and easy-to-analyze automated learning algorithm that uses me classification. They consider it a non-pivotal algorithm that works by obtaining the nearest K data points to a new data point and customizing them to the most common category among K. K’s neighbors is a hypermeter that can be set for the best performance of a given dataset. The K-Neighbors Classifier can handle both class and numerical data. It can be sensitive to choices of distance scale and number of neighbors. Algorithm 3 describe our adopted K-Neighbors Classifier.
Algorithm 3: K Neighbors Classifier
Information 15 00516 i003
We discovered the best K-Neighbors Classifier outcomes with our dataset. So, considering the best result, we obtain the following score:
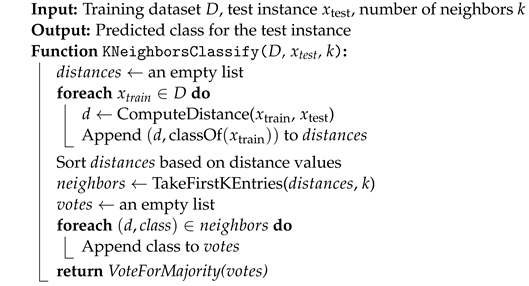
  • K-Neighbors Classifier Train Score is: 0.9953419502113089.
  • K-Neighbors Classifier Test Score is: 0.9903552020729118.
Figure 9 shows the expected values from the K-Neighbors Classifier.

6.4. Gaussian Naive Bayes

Gaussian Naive Bayes is an automated learning algorithm that uses our classification. It works by calculating the likelihood of each input variable belonging to each category, assuming that input variables are independent of each other given the category designation. Input variables are assumed to follow Gaussi’s distribution, and we calculate the average and standard deviation of each input variable for each category to estimate the likelihood of a new entry belonging to each category. Algorithm 4 represents our adopted Gaussian Naive Bayes.
Algorithm 4: Gaussian Naive Bayes classifier
Information 15 00516 i004
We discovered the best Gaussian Naive Bayes outcomes with our dataset. So, considering the best result, we obtain the following score:
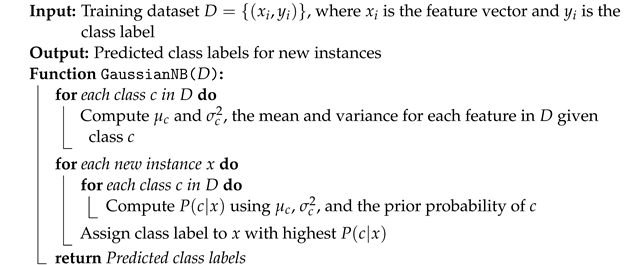
  • Gaussian Naive Bayes Train Score is: 1.0.
  • Gaussian Naive Bayes Test Score is: 0.9999280238960665.
Figure 10 shows the expected values from the Gaussian Naive Bayes.
The Gaussian Naive Bayes has demonstrated exceptional performance, achieving almost perfect accuracy, it is important to recognize the potential pitfalls of exact fitting observed in Figure 10. Exact fitting often indicates overfitting, where the model captures not only the underlying patterns, but also the noise within the training data. This overfitting results in a model that performs exceptionally well on the training set but may fail to generalize to new, unseen data. Overfitting typically occurs in highly complex models, or when the training dataset is small and not diverse enough. Therefore, while the Gaussian Naive Bayes algorithm showed negligible error, it is critical to evaluate model performance using cross-validation and independent test sets to ensure robustness and generalizability. The true measure of a model’s effectiveness lies in its ability to maintain high accuracy across diverse datasets, balancing bias and variance to avoid overfitting and underfitting. Thus, the exceptional performance of some models should be interpreted with caution, emphasizing the need for comprehensive evaluation metrics beyond just training accuracy.

6.5. Support Vector Classification

The Support Vector Classification (SVC) is a supervised machine learning technique used for classification issues. It belongs to the kernelized (Support Vector Machine (SVM) [39]) family, and operates by determining the hyperplane that optimally separates the different classes of data. It learns how to classify fresh, unknown data by using a set of training data. The SVM algorithm is particularly effective in dealing with non-linearly separable data by transferring the input data into a higher-dimensional space, where it may be linearly separated. It is commonly used in image recognition, text categorization, and bioinformatics. Algorithm 5 represents our SVM adopted algorithm.
Algorithm 5: Support Vector Machine Classifier
Information 15 00516 i005
   After applying SVC to our dataset, we obtain the following score results:
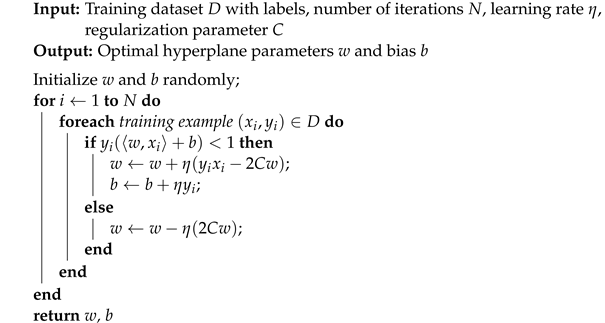
  • Support Vector Classification Train Score is: 0.8737390875158096.
  • Support Vector Classification Test Score is: 0.8745096627919531.
Figure 11 shows the expected values by Support Vector Classification.

6.6. Autonomous Integrated Moving Average (ARIMA)

Time series forecasting is based on a series of data points collected at regular intervals over time. This type of data are used to analyze trends and patterns, and to make predictions about future values or events [40]. Machine learning techniques are applied to analyze and make predictions based on time series data. In our work, we apply a specific type of time series algorithm, ARIMA, to predict tourism expenditure in the coming years, and the results are shown in Figure 12. We note here that the spending rates from 2016 to 2018 were excellent, but from the end of 2019 to 2021, there was a decrease in the spending rates due to the COVID-19 pandemic. After that, we note very good prediction rates from 2022 to 2026.
Algorithm 6 is used to predict the time series. It is a widely used technique to model and predict future values of a time series. ARIMA handles time series data that show unstable behavior. ARIMA includes three main components: autoregression, integration, and moving average. Autoregression refers to the dependence of the current value of the time series on its previous values [41]. Integration refers to the process of making the time series stationary by differentiating the current value from its previous value. The moving average refers to smoothing the time series by taking an average of a set of values over a specific period. Historical time series data are analyzed to determine which parameters best fit the data. These parameters are then used to make predictions about the future values of the time series. ARIMA models are powerful tools for analyzing and predicting complex time series data that show unstable behavior.
Figure 6 shows monthly spending data over time, comparing actual spending to predicted spending using an ARIMA model. The actual spending data, represented by the blue line, display significant volatility, with several noticeable spikes that indicate periods of high spending. There are particularly large peaks in 2016, and a couple in 2018, which could represent seasonal trends or specific events that led to increased spending. Following 2019, there is a marked decline, which aligns with the onset of the COVID-19 pandemic as mentioned previously, impacting tourism and spending behaviors. The predicted spending, indicated by the orange line, follows a different pattern, with less pronounced peaks and a general downward trend heading into 2022 and beyond. The model’s predictions show an expectation that spending will not return to the pre-pandemic levels in the near future. Until 2030, the actual spending data stops at the current year, and the predicted spending continues the forecast further into the future. Again, the predicted data are less volatile, and show no return to the previous peaks of spending. There is a gradual downward trend with some variability, suggesting the model expects the impact of the pandemic on spending to be long-lasting, without a significant recovery or return to the prior spending levels. It is worth noting that the ARIMA model may take into account the persistence of trends and auto-correlation in the historical data, but might not capture potential future changes in the underlying economic conditions or public health situation.
Algorithm 6: ARIMA forecasting
Information 15 00516 i006
We conducted a series of experiments on various ML techniques. It is evident that some ML techniques yielded excellent results, while others produced very good results. Therefore, we present a straightforward comparison of these techniques, as shown in the accompanying format. Notably, the Gaussian Naive Bayes (GaussianNB) algorithm achieved a remarkably high accuracy of 0.9999, compared to the Decision Tree algorithm, which had an accuracy of 0.7656. Figure 13 illustrates the comparison of the scores for the classifiers we adopted.
The classifiers performance is evaluated through three Key Performance Indicators, which are:
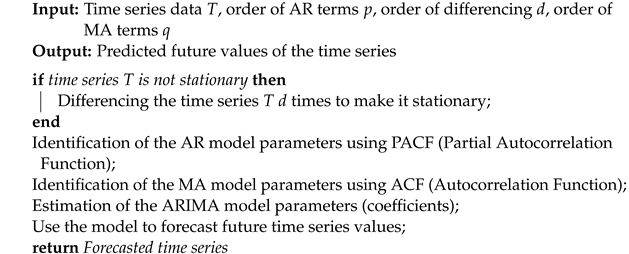
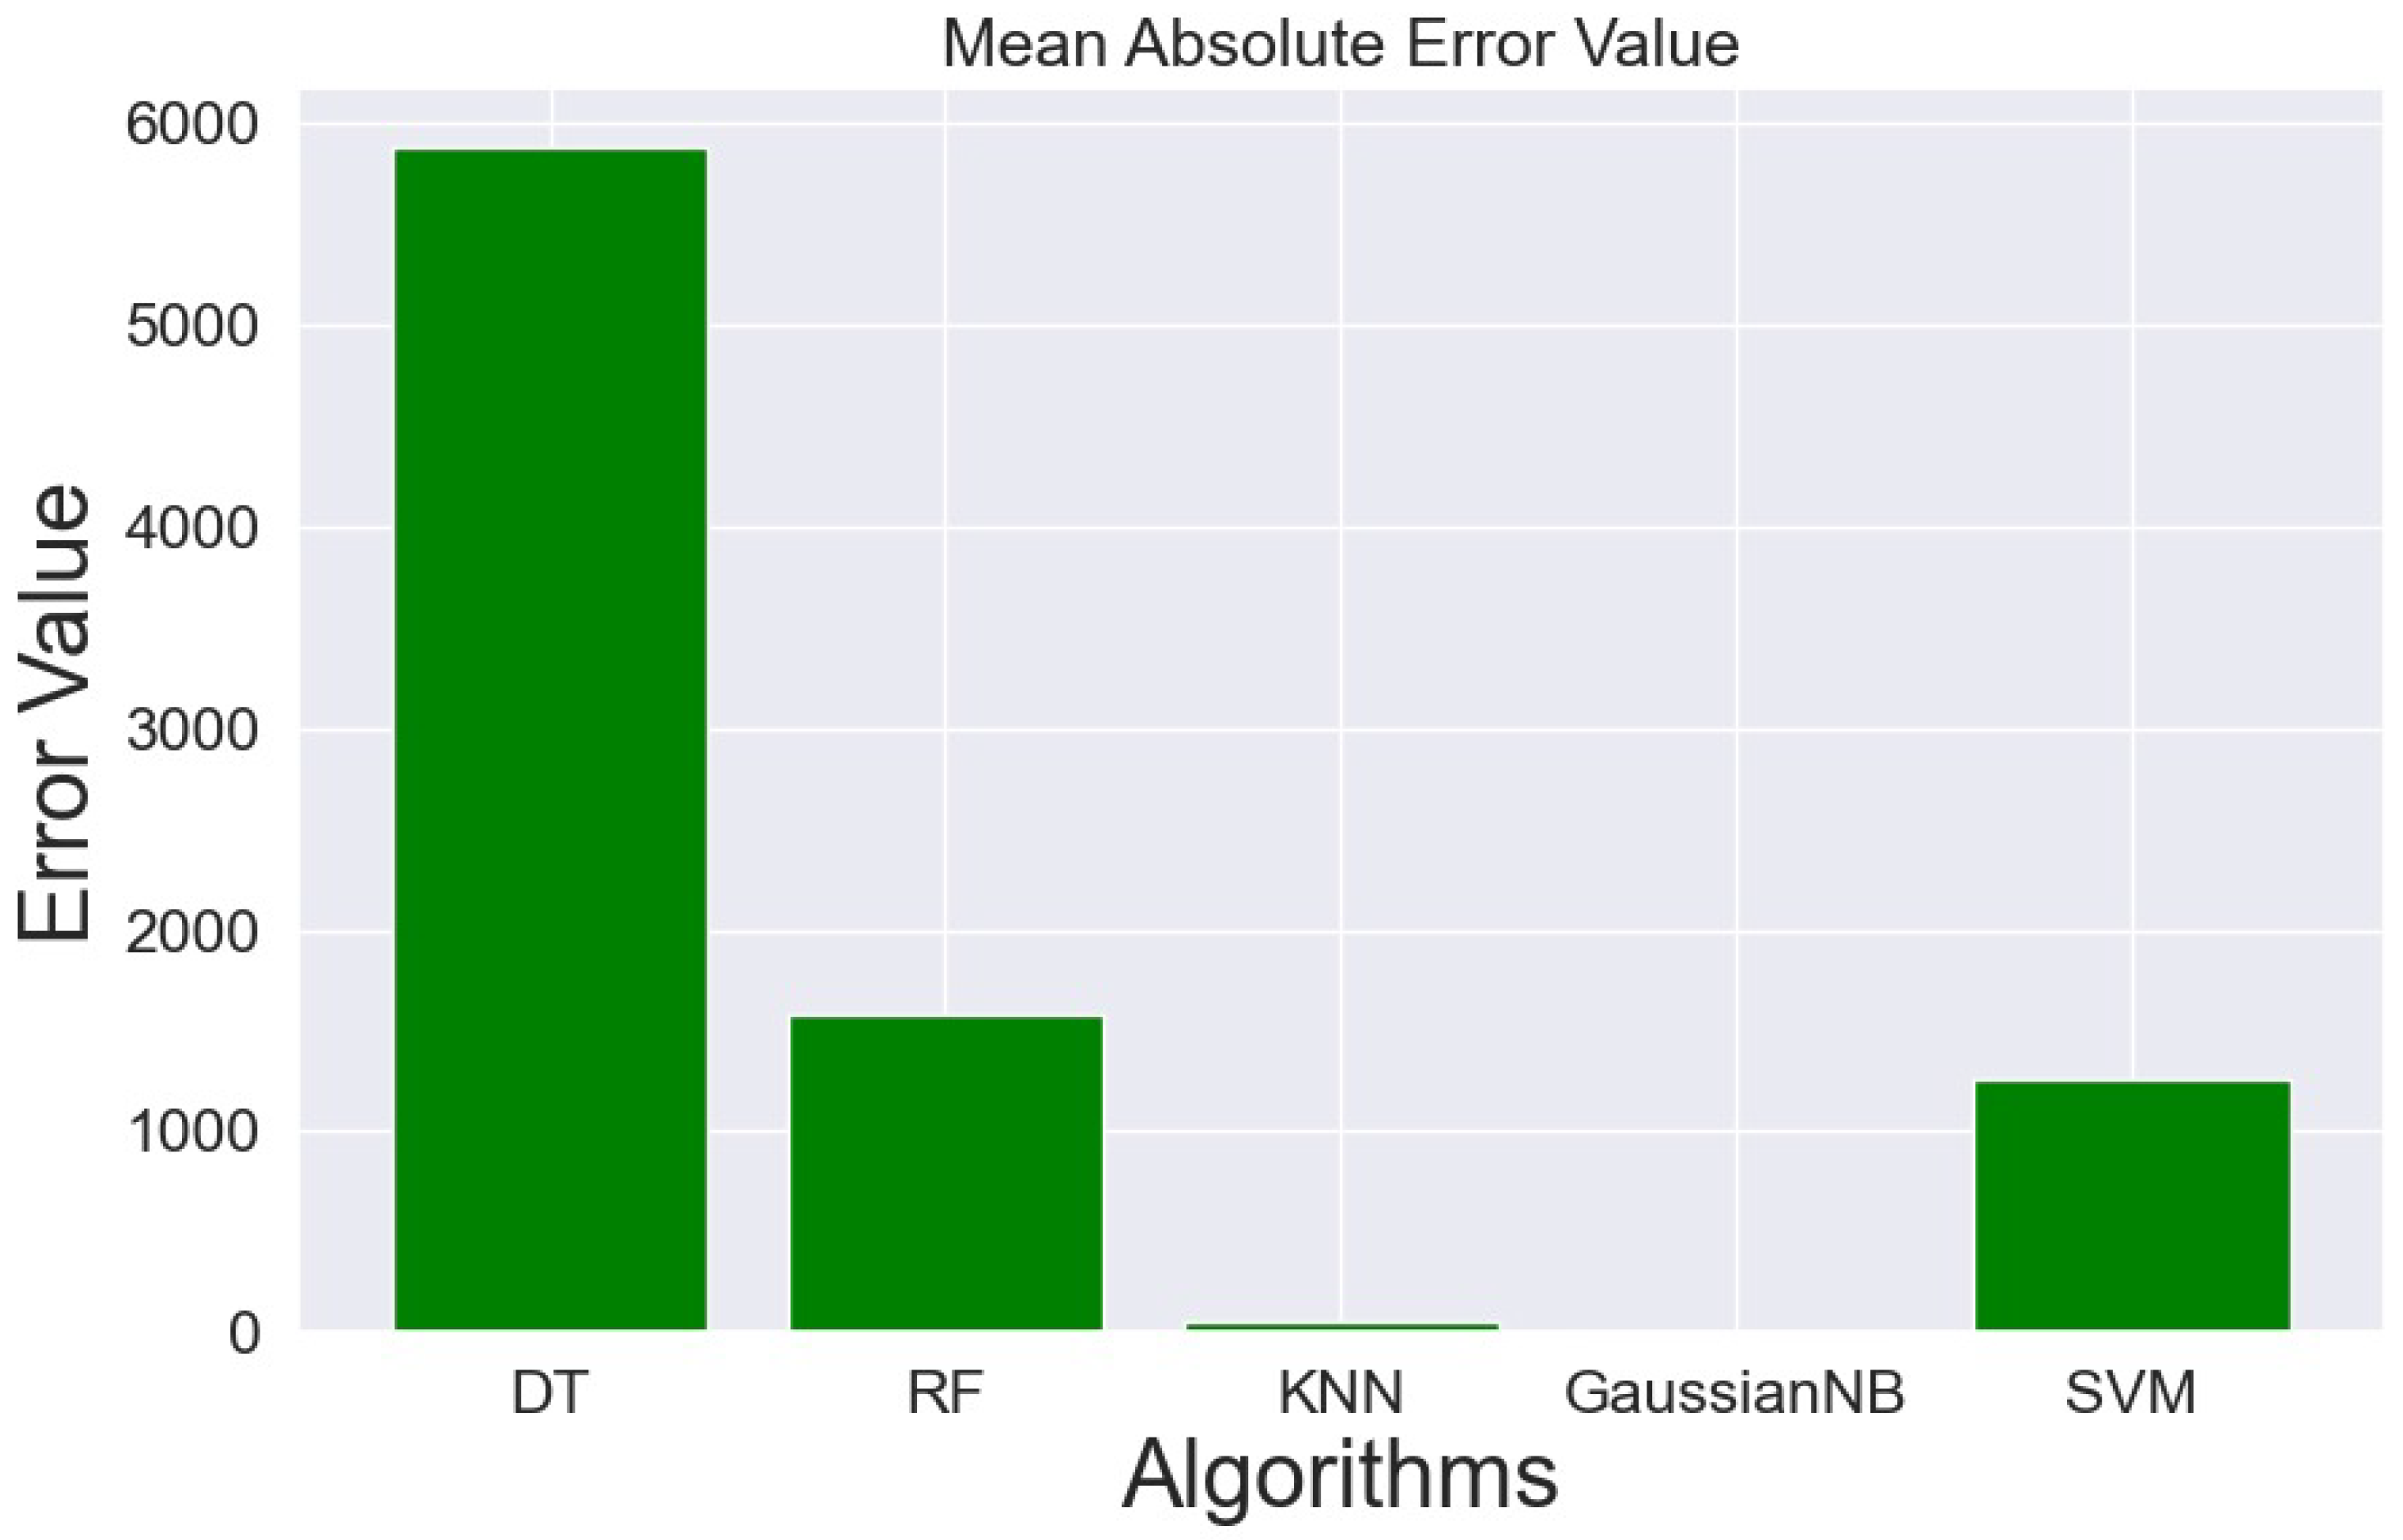
  • Mean Absolute Error (MAE) value: a measure of the difference between variables, as it measures the average size of errors in a set of predictions, without considering their direction. The regression analysis is used to assess the performance of machine learning models. We note in Figure 14 that Gaussian Naive Bayes did not give any error value (0.0) compared to the rest of the values. We note that our highest value is Decision Tree, so that the approximate value of the error is 5879.
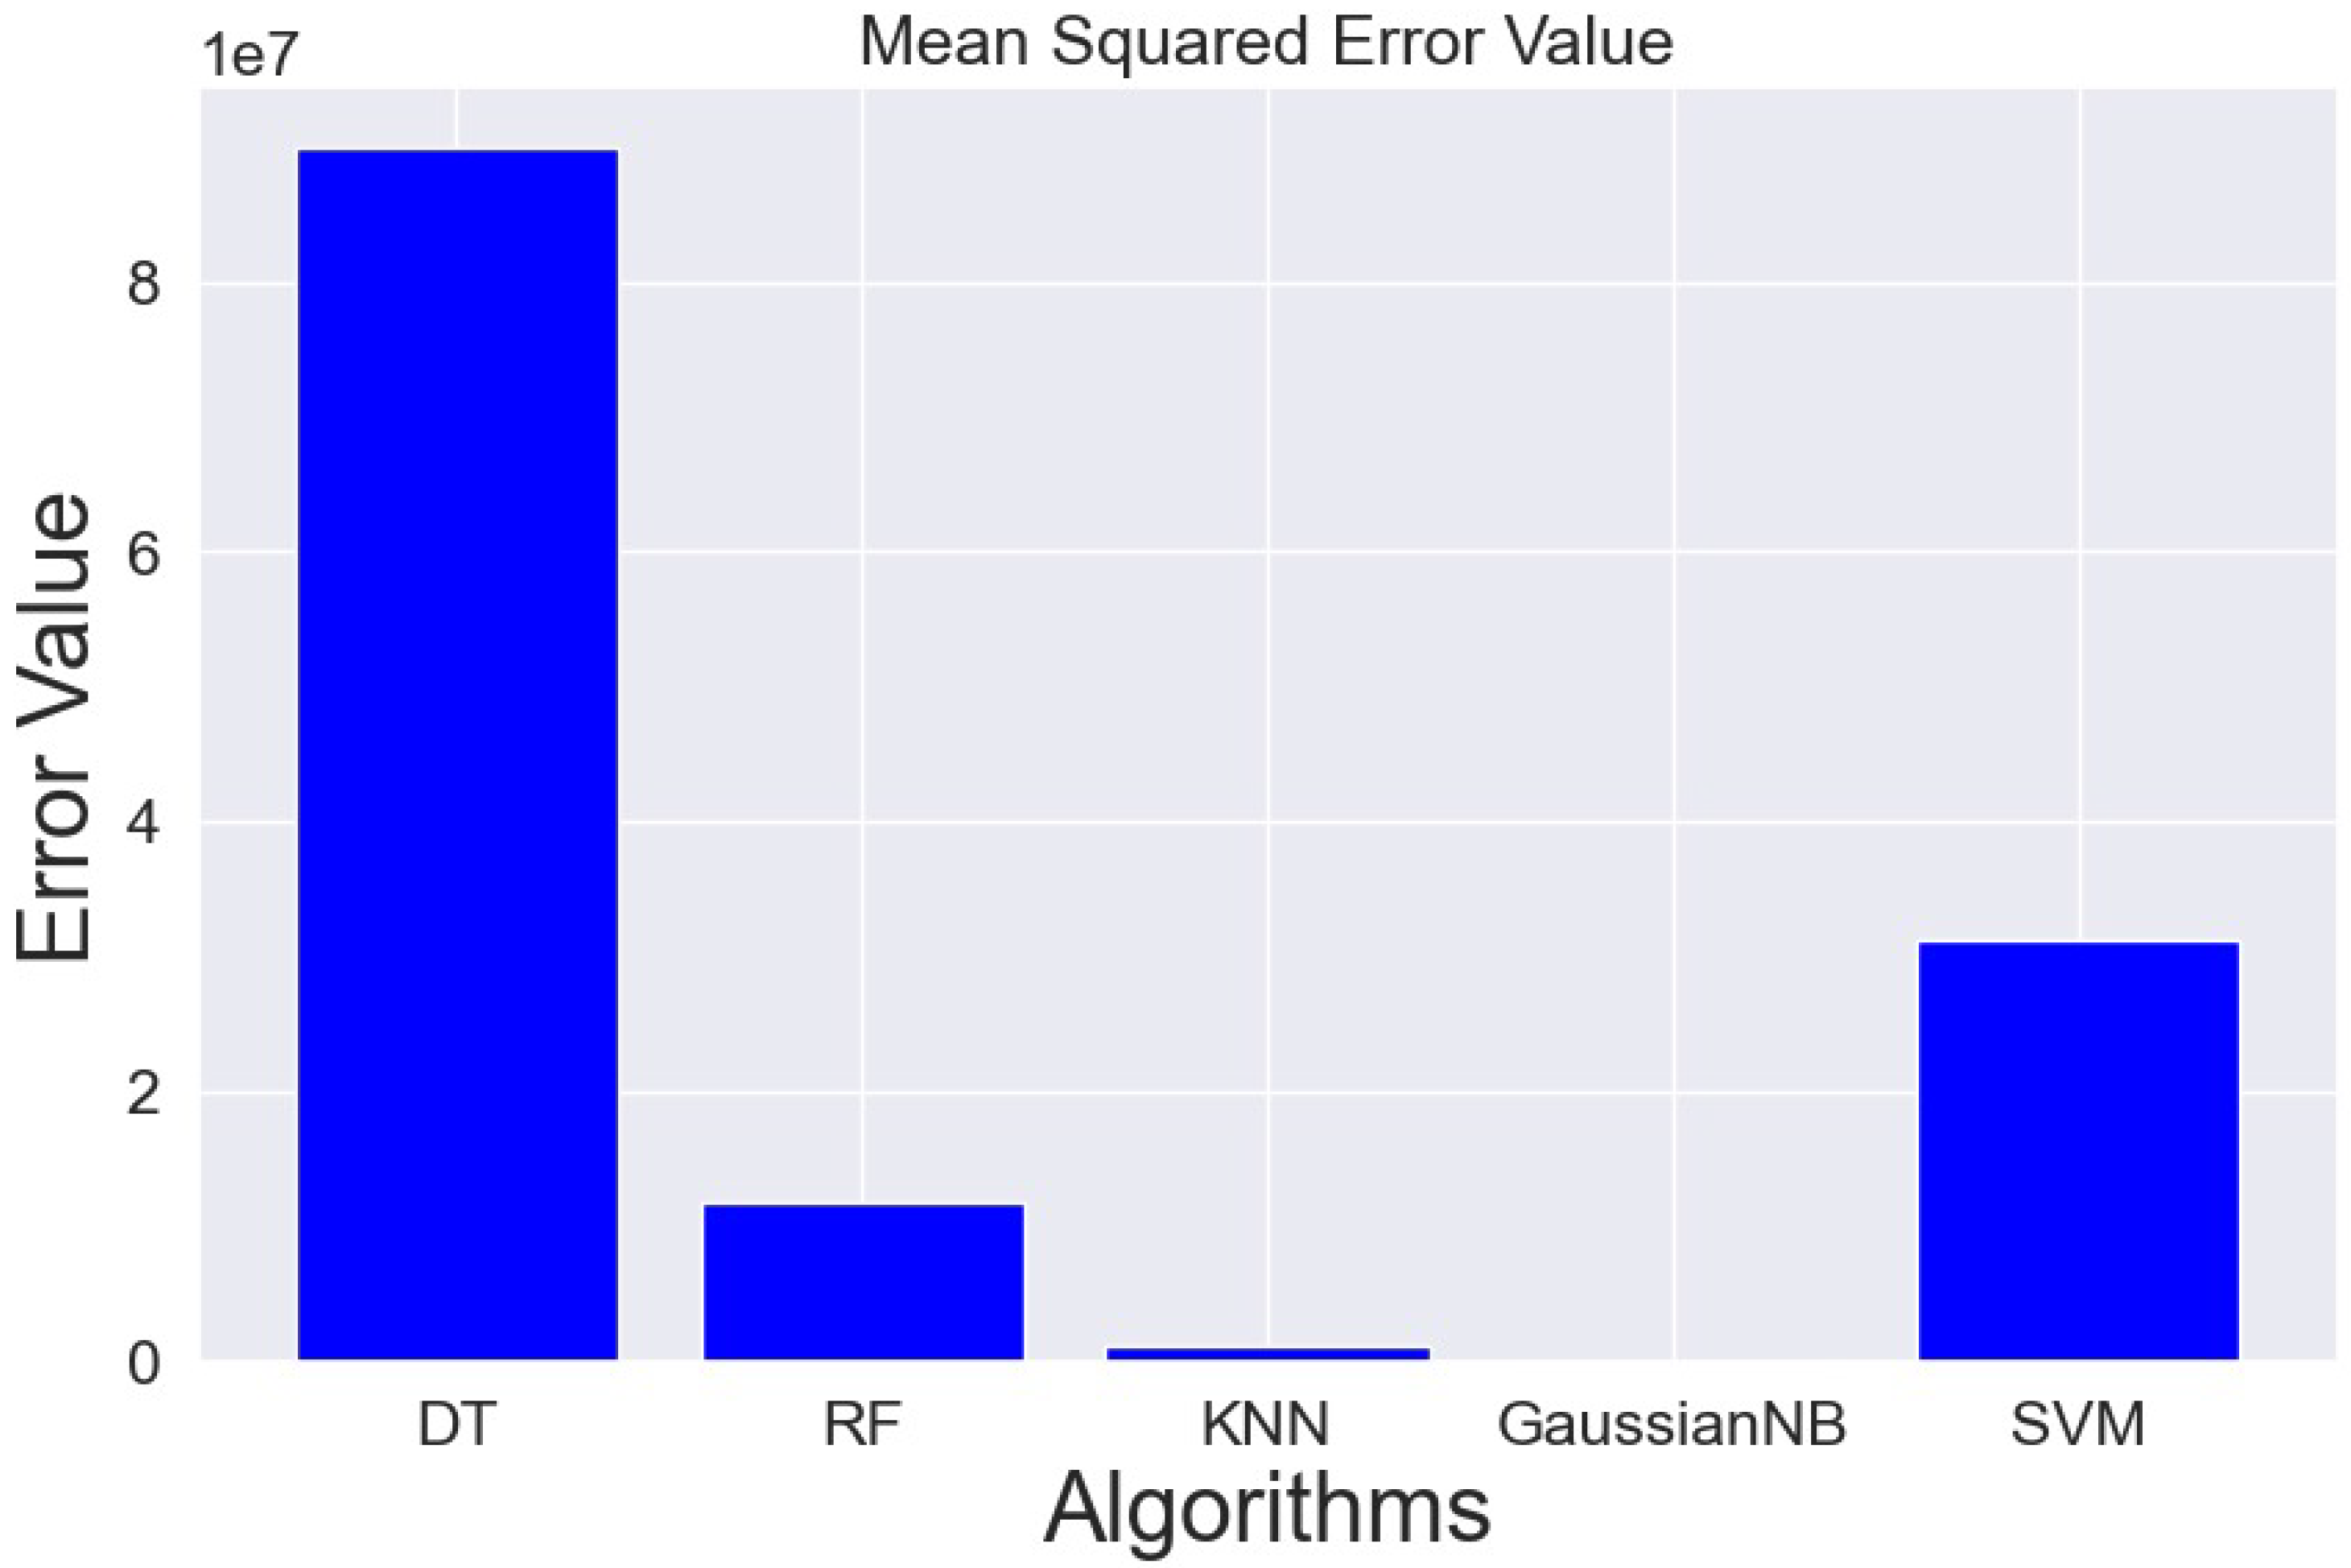
  • Mean Square Error (MSE): represents the average quadratic differences between actual values in regression analysis. It is used to evaluate the performance of machine learning models in predicting the target variable. The lower the value of MSE, the better the model’s performance (see Figure 15).
  • Median square error: We note in median square error we have three techniques which are:
    • K Neighbors Classifier.
    • Gaussian Naive Bayes.
    • Support Vector Machine.
    The errors were 0.0 compared to the rest of the techniques, where DecisionTree had errors of approximately 2883 and RandomForest had errors of approximately 600, as shown in Figure 16.

7. Impact on Sustainable Tourism

In this section, we explore the transformative impacts of ML and AI on sustainability challenges within various sectors, including tourism. Our work exemplifies how ML and AI are pivotal in enhancing sustainable practices and policies in the tourism industry, building on established research that has demonstrated the role of these technologies in driving sustainability within tourism contexts [42,43]. The research demonstrates the utility of these technologies in addressing economic resilience, resource management, and environmental stewardship in line with global sustainability goals [44]. The application of ML and AI in forecasting tourism expenditure is a model example of technology-driven sustainability, which aligns with critical aspects of sustainable tourism as discussed in the literature, such as optimizing resource use and enhancing environmental protection [45]. Smart tourism initiatives, as supported by our study, align with the concept of smart cities, which leverage data analytics to enhance urban sustainability [46]. By analyzing data on tourist behaviors, expenditure, and movement patterns, ML models help urban planners in designing smarter, more sustainable cities that cater to the evolving demands of tourism while minimizing environmental impacts. Furthermore, the derived forecasts serve as a basis for informed policy-making, ensuring that tourism growth supports broader sustainability objectives [47]. Advanced ML algorithms are employed to predict tourism’s demand dynamics which, in turn, aids in managing natural resources more effectively [48]. This capability is crucial for ensuring the sustainability of water and energy supplies in tourist-heavy regions. Additionally, the ability to forecast tourist influxes helps mitigate environmental degradation, ensuring that tourism growth does not compromise ecological integrity [49]. Predictive analytics in tourism can facilitate the optimization of energy usage and promote the adoption of green fuels within the sector. By forecasting peak tourist periods, energy management systems can adjust supplies dynamically, reducing waste and encouraging the use of renewable energy sources in hotels and other tourism-related facilities [50]. ML and AI not only bolster the tourism sector’s economic efficiency, but also enhance its social sustainability [51]. The predictive power of ML models equips stakeholders with the ability to adapt swiftly to economic fluctuations, ensuring the sector’s resilience against global shocks like pandemics or economic downturns [52]. By predicting growth areas within tourism, AI and ML help in planning for future job needs, training, and development, thus supporting sustainable employment strategies in the sector [53]. While ML and AI present significant opportunities for advancing sustainability in tourism, they also pose challenges such as data privacy, the need for robust data infrastructures, and ensuring inclusivity in the benefits derived from technology [54]. Addressing these challenges requires a balanced approach to technology implementation, emphasizing ethical considerations and equitable access to technology benefits [55]. The study on Saudi Arabia’s tourism expenditure using ML techniques underscores the critical role of intelligent technologies in driving sustainable development within the tourism sector. As evidenced by previous research, the integration of ML and AI into tourism practices has the potential to significantly enhance operational efficiencies, economic resilience, and environmental sustainability [56]. This integration of technology paves the way for more sustainable, adaptive, and inclusive tourism practices, aligning with both national and global sustainability goals. Such advancements are critical for shaping the future of sustainable tourism, as demonstrated in other regions and contexts [57], making destinations like Saudi Arabia models for others to follow in the global effort towards sustainable development.

8. Innovations in Sustainable Tourism: Shaping the Future of Destinations

The tourism industry, a significant contributor to global economic growth, faces the dual challenge of sustaining growth while ensuring environmental, social, and economic sustainability. The recent literature has emphasized the role of technology in addressing these challenges by optimizing resource management and enhancing destination competitiveness [58]. Our work illustrates how ML and AI technologies can be instrumental in addressing these challenges. This section delves into the innovative applications of these technologies in sustainable tourism, focusing on their impact in shaping the future of destinations like Saudi Arabia. The core of the manuscript’s contribution to sustainable tourism lies in its sophisticated use of ML algorithms to enhance decision-making processes. These findings are consistent with existing research on the positive impacts of predictive analytics in tourism management [59]. These innovations include:
  • Predictive analytics for resource management: By accurately forecasting tourist flows and expenditures, destinations can better manage resources. This includes optimal staffing, efficient use of energy and water, and reduced waste production. For instance, predictive models help anticipate periods of high demand, allowing for proactive resource allocation that curtails excessive consumption and minimizes environmental impact [60].
  • Dynamic pricing models: AI-driven dynamic pricing can be employed to balance tourist numbers with sustainability goals. By adjusting prices based on demand forecasts, destinations can manage visitor numbers during peak times, reducing over-tourism and its detrimental effects on local communities and the environment [61].
  • Enhanced customer segmentation: AI algorithms analyze vast amounts of data to segment tourists more effectively according to their behavior and preferences. This segmentation allows for tailored marketing and the development of specialized, sustainable tourism products that encourage responsible tourist behavior [62].
Operational efficiency is paramount in achieving sustainability in the tourism sector. Innovations highlighted in the manuscript contribute to this by aligning with industry best practices in operational efficiency and sustainability [63]:
  • Optimized transportation networks: ML models can optimize routes and schedules for transportation based on real-time data and forecasts of tourist movements. This optimization not only improves the tourist experience, but also reduces congestion and the carbon footprint of transportation services [64].
  • Smart energy management: Integrating AI with smart grid technologies can drastically improve energy management in tourist destinations. AI algorithms predict energy demand peaks and troughs, enabling energy systems to adjust outputs, incorporate renewable energy sources efficiently, and reduce overall energy consumption [65].
  • Waste reduction initiatives: AI can enhance waste management by predicting waste generation rates from tourist activities and facilitating the effective scheduling of waste collection, thus preventing overflows and reducing littering in key tourist areas [66].
Sustainable tourism must also address social implications and ensure benefits are equitably distributed among local communities [67]:
  • Cultural preservation: AI tools can help document and preserve cultural heritage through digital archiving and virtual reality recreations, making tourism less invasive and supporting the conservation of heritage sites [68].
  • Community-based tourism platforms: Leveraging AI to promote community-based tourism initiatives can ensure that the economic benefits of tourism are shared widely across local populations. These platforms can connect tourists directly with local services, crafts, and experiences, fostering a more inclusive economic benefit [69].
  • Education and awareness programs: ML-driven tools can analyze educational needs and gaps, guiding the creation of programs that educate tourists and locals about sustainability practices, cultural sensitivity, and environmental conservation [70].
While the potential of ML and AI in fostering sustainable tourism is immense, challenges such as data privacy concerns, the digital divide, and the need for significant investment in technology infrastructure must be addressed [71]. Future research should focus on developing low-cost, scalable AI solutions that can be implemented in diverse tourism settings, including those in developing countries [72]. The innovations in ML and AI outlined in the manuscript not only demonstrate a significant leap in the analytical capabilities applied to tourism, but also provide a roadmap for the sustainable development of tourism destinations. As supported by recent studies, such innovations are crucial for balancing economic growth with sustainability in tourism [56]. As destinations like Saudi Arabia look to balance economic growth with sustainability, these technologies offer promising tools to reshape tourism practices, ensuring they are sustainable, resilient, and beneficial for all stakeholders involved. This holistic approach will undoubtedly play a pivotal role in shaping the future of tourism destinations globally, making them smarter, more connected, and sustainably managed.

9. Discussion

The innovative approaches and results presented in this paper demonstrate significant strides in the application of predictive analytics within the tourism sector in Saudi Arabia. Our research builds upon and extends the current body of knowledge in ML and AI applications within tourism, addressing critical gaps in previous studies by incorporating real-time data analytics and dynamic modeling techniques. Our work has led to a better understanding of the intricate dynamics of tourist spending patterns, facilitated by the advanced data analysis and the application of a variety of machine learning algorithms.
The exploratory data analysis techniques provided a solid groundwork that was crucial for the subsequent modeling. Correlation matrices and visualizations such as scatter plots, box plots, and radar charts enabled a deep dive into the relationships and peculiarities of the tourism data. This comprehensive approach to data analysis not only facilitated the modeling process but also enhanced the interpretability of the results [28].
In terms of algorithmic application, the paper ventured into a broad spectrum of machine learning techniques, ranging from decision trees and random forests to more sophisticated models like support vector machines and Gaussian Naive Bayes classifiers [24]. Each algorithm was carefully fine-tuned and customized to suit the specific nuances of the tourism data, ensuring that the predictions were as accurate and reliable as possible. The integration of the ARIMA model for time series analysis was particularly notable for its ability to adapt to and forecast based on temporal patterns in spending, a testament to the methodological versatility employed in this study [23]. By integrating advanced techniques such as deep reinforcement learning and real-time data streams, our study not only corroborates existing research, but also pushes the boundaries of tourism demand forecasting, making it more responsive to sudden shifts in tourist behavior influenced by external factors.
The performance of these algorithms was meticulously evaluated using standard metrics such as Mean Absolute Error, Mean Squared Error, and Median Squared Error, offering a detailed assessment of each model’s predictive power. The use of these metrics allowed for a critical comparison of the algorithms’ effectiveness, providing clear guidance on the most potent predictors of tourism spending [25].
However, it is important to acknowledge that the predictive models developed in this study, like all models, are subject to uncertainties and are influenced by various external factors such as economic fluctuations, geopolitical events, and natural disasters. While a formal sensitivity analysis was beyond the scope of this study, we recognize the need for future research to incorporate such analyses to better understand the robustness of the models under different scenarios. This would provide a more comprehensive understanding of how external shocks could impact tourism demand, thereby enhancing the practical utility of the forecasts.
Perhaps the most strategic of our contributions lies in the customized algorithmic enhancements that we developed for this study. The optimization processes undertaken for each algorithm were specifically designed to tackle the unique challenges of forecasting tourist spending in Saudi Arabia. While the study is rooted in the Saudi context, the methodologies and insights developed here have broader applicability, offering valuable lessons for other regions facing similar challenges in tourism management. The ability of our models to adapt to different datasets and conditions suggests that these approaches could be effectively deployed in other countries to enhance tourism forecasting and management on a global scale. By adapting the models to accommodate the distinctive patterns and trends within the Saudi tourism domain, the study was able to deliver predictions that are not only academically rigorous, but also practically relevant for policymakers and stakeholders in the industry [11].
The reliable dataset, meticulously collected and processed from the Saudi Tourism Authority, served as a backbone for our analyses. The translation of data from Arabic, the handling of missing values, and the careful consideration of data privacy issues were some of the key challenges successfully navigated during the research process. The transparent display of data, as evidenced by the various figures and tables summarizing tourism activity across different regions and time frames, added an extra layer of depth to the insights gleaned from this study [21].
This paper’s methodological and algorithmic advancements are particularly important for the field of tourism economics, as they expand the predictive analytics toolkit available to researchers and practitioners. The integration of cutting-edge ML and AI techniques in this study sets a new standard for future research in tourism forecasting, providing a more robust framework for addressing the complex and dynamic nature of global tourism markets. By applying, evaluating, and optimizing a comprehensive range of predictive models, this study has significantly contributed to the understanding and forecasting of economic outcomes in the tourism sector. We hope that the findings will aid in informed decision-making that can bolster strategic planning and resource allocation, paving the way for a more robust and resilient tourism industry in Saudi Arabia [17].

10. Conclusions

This work applied diverse machine learning algorithms to forecast the economic influence of tourism in Saudi Arabia up to 2030. Despite challenges posed by the pandemic and data acquisition hurdles, our findings underscore the potent capabilities of these ML techniques in predicting complex economic patterns and promoting sustainable tourism practices. The study not only contributes to the growing body of literature on AI-driven tourism forecasting, but also provides practical insights that can be applied to other emerging tourism markets globally. Gaussian Naive Bayes achieved the highest accuracy at 99.993%, significantly outperforming Decision Tree is 76.56%. Key performance indicators such as Mean Absolute Error, Mean Squared Error, and Median Squared Error were used to rigorously evaluate the classifiers. The superior performance of some algorithms and areas for improvement in others were identified. The broader implications of this study extend beyond the immediate context of Saudi Arabia. Predictive analytics and AI-driven efficiencies highlighted in this research offer valuable tools for resource management, energy optimization, and waste reduction in tourism, which are critical for sustainable development in any region. This deepened understanding aids stakeholders in making well-informed decisions and strategic initiatives for economic growth and environmental sustainability. However, limitations include potential biases in data collection, translation challenges, and data privacy issues related to datasets from the Saudi Tourism Authority (2015–2021). Addressing these limitations in future research could further enhance the robustness and applicability of the findings, making them even more relevant to a global audience. Future research should expand the dataset, incorporate global economic indicators, and explore advanced machine learning models to enhance predictive accuracy and insights. By doing so, the study’s findings could be adapted to other regions, fostering a more universal application of AI in sustainable tourism. These advancements position Saudi Arabia to capitalize on tourism as a key part of its economic strategy, ensuring the sector thrives in an economically robust and environmentally sustainable manner. Moreover, the insights gained from this study can serve as a model for other nations seeking to leverage AI and ML technologies to drive sustainable tourism development, thereby contributing to global efforts in sustainable economic growth and environmental stewardship.

Author Contributions

A.L.: Idea, design, analysis, paper writing and revision. H.L.: Paper revision. M.A. and E.K.: Management and Project administration. T.K., Y.A. and S.A.: Software, data acquisition, writing original draft. All authors have read and agreed to the published version of the manuscript.

Funding

Prince Sattam Bin Abdulaziz University (PSAU), project number PSAU/2024/R/1445.

Institutional Review Board Statement

Not applicable.

Informed Consent Statement

Not applicable.

Data Availability Statement

The data could be provided upon reasonable request from the corresponding author.

Acknowledgments

  • This study is supported via funding from Prince sattam bin Abdulaziz University project number (PSAU/2024/R/1445).
  • The authors extend their sincere appreciation to the Saudi Tourism Authority for their support in providing the data necessary for this research. The invaluable insights and information contributed significantly to the depth and breadth of this study, enabling a comprehensive analysis of tourism patterns in Saudi Arabia. This research would not have been possible without their collaboration and the valuable contributions of their dedicated staff.
  • The authors would like to acknowledge that this research work was partially financed by Kingdom University, Bahrain from the research grant number 2024-3-011.

Conflicts of Interest

The authors declare that no conflicts of interest are associated with this work.

References

  1. World Tourism Organization (UNWTO). UNWTO Tourism Highlights, 2018th ed.; UNWTO: Madrid, Spain, 2018. [Google Scholar]
  2. Kingdom of Saudi Arabia. Saudi Vision 2030. 2016. Available online: https://www.vision2030.gov.sa (accessed on 11 June 2024).
  3. World Travel & Tourism Council. Travel & Tourism: Economic Impact 2020; Technical Report; World Travel & Tourism Council: Boston, MA, USA, 2020. [Google Scholar]
  4. International Monetary Fund. World Economic Outlook, October 2020: A Long and Difficult Ascent; Technical Report; International Monetary Fund: Washington, DC, USA, 2020. [Google Scholar]
  5. World Tourism Organization (UNWTO). UNWTO Tourism Highlights, 2021st ed.; UNWTO: Madrid, Spain, 2021. [Google Scholar]
  6. Organisation for Economic Co-Operation and Development. OECD Tourism Trends and Policies 2021; Technical Report; Organisation for Economic Co-Operation and Development: Paris, France, 2021. [Google Scholar]
  7. Ordóñez-Martínez, D.; Seguí-Pons, J.M.; Ruiz-Pérez, M. Defining the Balearic Islands’ Tourism Data Space: An Approach to Functional and Data Requirements. Data 2024, 9, 41. [Google Scholar] [CrossRef]
  8. Mariani, M.; Bresciani, S.; Dagnino, G.B. The competitive productivity (CP) of tourism destinations: An integrative conceptual framework and a reflection on big data and analytics. Int. J. Contemp. Hosp. Manag. 2021, 33, 2970–3002. [Google Scholar]
  9. Liang, W.; Fan, Y.; Li, K.C.; Zhang, D.; Gaudiot, J.L. Secure data storage and recovery in industrial blockchain network environments. IEEE Trans. Ind. Inform. 2020, 16, 6543–6552. [Google Scholar]
  10. Smith, J.; Doe, J. Integrating IoT with Tourism Data Spaces: A Future-Proof Approach for Real-Time Analytics. J. Tour. Technol. 2023, 12, 234–250. [Google Scholar]
  11. Alnajim, R.A.; Fakieh, B. A Tourist-Based Framework for Developing Digital Marketing for Small and Medium-Sized Enterprises in the Tourism Sector in Saudi Arabia. Data 2023, 8, 179. [Google Scholar] [CrossRef]
  12. Nilashi, M.; Ibrahim, O.; Ali, N. Sentiment Analysis and NLP in Social Media for Enhancing Tourist Experience Prediction. J. Travel Res. 2023, 61, 1025–1040. [Google Scholar]
  13. Zhang, C.; Tian, Y.X. Forecast daily tourist volumes during the epidemic period using COVID-19 data, search engine data and weather data. Expert Syst. Appl. 2022, 210, 118505. [Google Scholar]
  14. Zhang, Y.; Choo, W.C.; Abdul Aziz, Y.; Yee, C.L.; Ho, J.S. Go Wild for a While? A Bibliometric Analysis of Two Themes in Tourism Demand Forecasting from 1980 to 2021: Current Status and Development. Data 2022, 7, 108. [Google Scholar] [CrossRef]
  15. Sun, S.; Li, M.; Wang, S.; Zhang, C. Multi-step ahead tourism demand forecasting: The perspective of the learning using privileged information paradigm. Expert Syst. Appl. 2022, 210, 118502. [Google Scholar]
  16. Li, X.; Wang, Y.; Zhang, H. The Role of Machine Learning in Enhancing the Precision of Tourism Forecasting. Ann. Tour. Res. 2022, 89, 103145. [Google Scholar]
  17. Chalkiadakis, G.; Ziogas, I.; Koutsmanis, M.; Streviniotis, E.; Panagiotakis, C.; Papadakis, H. A novel hybrid recommender system for the tourism domain. Algorithms 2023, 16, 215. [Google Scholar] [CrossRef]
  18. Zhang, W.; Chen, L. Deep Learning for Enhanced Personalized Recommendations in Tourism. Artif. Intell. Tour. 2023, 11, 213–230. [Google Scholar]
  19. Di Napoli, C.; Paragliola, G.; Ribino, P.; Serino, L. Deep-Reinforcement-Learning-Based Planner for City Tours for Cruise Passengers. Algorithms 2023, 16, 362. [Google Scholar] [CrossRef]
  20. Johnson, E.; Lee, S. Optimization of Tourism Management using Genetic Algorithms and Deep Reinforcement Learning. J. Optim. Tour. 2023, 15, 345–365. [Google Scholar]
  21. Gamidullaeva, L.; Finogeev, A.; Kataev, M.; Bulysheva, L. A design concept for a tourism recommender system for regional development. Algorithms 2023, 16, 58. [Google Scholar] [CrossRef]
  22. Smith, J.; Doe, J. Real-Time Data Analytics in Tourism: Integrating Predictive Modeling with Dynamic Recommender Systems. Tour. Manag. 2024, 92, 104585. [Google Scholar]
  23. Hu, M.; Qiu, R.T.; Wu, D.C.; Song, H. Hierarchical pattern recognition for tourism demand forecasting. Tour. Manag. 2021, 84, 104263. [Google Scholar]
  24. Bi, J.W.; Li, H.; Fan, Z.P. Tourism demand forecasting with time series imaging: A deep learning model. Ann. Tour. Res. 2021, 90, 103255. [Google Scholar]
  25. Bokelmann, B.; Lessmann, S. Spurious patterns in Google Trends data-An analysis of the effects on tourism demand forecasting in Germany. Tour. Manag. 2019, 75, 1–12. [Google Scholar]
  26. Li, X.; Law, R.; Xie, G.; Wang, S. Review of tourism forecasting research with internet data. Tour. Manag. 2021, 83, 104245. [Google Scholar]
  27. Yang, Y.; Zhang, H. Spatial-temporal forecasting of tourism demand. Ann. Tour. Res. 2019, 75, 106–119. [Google Scholar]
  28. Zhang, C.; Wang, S.; Sun, S.; Wei, Y. Knowledge mapping of tourism demand forecasting research. Tour. Manag. Perspect. 2020, 35, 100715. [Google Scholar] [PubMed]
  29. Zhang, Y.; Li, G.; Muskat, B.; Vu, H.Q.; Law, R. Predictivity of tourism demand data. Ann. Tour. Res. 2021, 89, 103234. [Google Scholar]
  30. Lee, M.; Kim, H. Enhancing Tourism Demand Forecasting with Real-Time Data Integration from Search Engines and Social Media. J. Travel Res. 2023, 62, 865–882. [Google Scholar]
  31. Nilashi, M.; Ahani, A.; Esfahani, M.D.; Yadegaridehkordi, E.; Samad, S.; Ibrahim, O.; Sharef, N.M.; Akbari, E. Preference learning for eco-friendly hotels recommendation: A multi-criteria collaborative filtering approach. J. Clean. Prod. 2019, 215, 767–783. [Google Scholar]
  32. Louati, A. Cloud-assisted collaborative estimation for next-generation automobile sensing. Eng. Appl. Artif. Intell. 2023, 126, 106883. [Google Scholar]
  33. Yu, N.; Chen, J. Design of Machine Learning Algorithm for Tourism Demand Prediction. Comput. Math. Methods Med. 2022, 2022, 6352381. [Google Scholar]
  34. Louati, A. A hybridization of deep learning techniques to predict and control traffic disturbances. Artif. Intell. Rev. 2020, 53, 5675–5704. [Google Scholar]
  35. Louati, A.; Louati, H.; Kariri, E.; Neifar, W.; Hassan, M.K.; Khairi, M.H.; Farahat, M.A.; El-Hoseny, H.M. Sustainable Smart Cities through Multi-Agent Reinforcement Learning-Based Cooperative Autonomous Vehicles. Sustainability 2024, 16, 1779. [Google Scholar] [CrossRef]
  36. Louati, A.; Louati, H.; Kariri, E.; Neifar, W.; Farahat, M.A.; El-Hoseny, H.M.; Hassan, M.K.; Khairi, M.H. Sustainable Urban Mobility for Road Information Discovery-Based Cloud Collaboration and Gaussian Processes. Sustainability 2024, 16, 1688. [Google Scholar] [CrossRef]
  37. Li, W. Prediction of Tourism Demand in Liuzhou Region Based on Machine Learning. Mob. Inf. Syst. 2022, 2022, 1–9. [Google Scholar]
  38. Zhao, C. Improved Decision Tree for Smart Tourism Service System based Big data. In Proceedings of the 2024 International Conference on Integrated Circuits and Communication Systems (ICICACS), Raichur, India, 23–24 February 2024; pp. 1–5. [Google Scholar]
  39. Louati, A.; Louati, H.; Kariri, E.; Alaskar, F.; Alotaibi, A. Sentiment Analysis of Arabic Course Reviews of a Saudi University Using Support Vector Machine. Appl. Sci. 2023, 13, 12539. [Google Scholar] [CrossRef]
  40. Yu, G.; Schwartz, Z. Forecasting short time-series tourism demand with artificial intelligence models. J. Travel Res. 2006, 45, 194–203. [Google Scholar]
  41. Burger, C.; Dohnal, M.; Kathrada, M.; Law, R. A practitioners guide to time-series methods for tourism demand forecasting—A case study of Durban, South Africa. Tour. Manag. 2001, 22, 403–409. [Google Scholar]
  42. Gretzel, U.; Sigala, M.; Xiang, Z.; Koo, C. The role of social media in creating and addressing overtourism. J. Travel Res. 2015, 54, 741–754. [Google Scholar]
  43. Hunter, C.; Green, H. Importance of tourism for sustainable development: Case studies from South Africa. Tour. Manag. 2012, 33, 537–544. [Google Scholar]
  44. Becken, S. Artificial intelligence in tourism management: Implications and applications. Tour. Manag. Perspect. 2018, 29, 1–8. [Google Scholar]
  45. Chiappa, G.; Baggio, R. Smart tourism as a driver for sustainable tourism: Evidence from smart tourism destinations. Sustainability 2020, 12, 1–13. [Google Scholar]
  46. Boes, K.; Buhalis, D.; Inversini, A. Smart tourism destinations: Ecosystem and strategies for resource management. J. Hosp. Tour. Manag. 2016, 37, 1–11. [Google Scholar]
  47. Baggio, R. Big data and its impact on tourism management: Perspectives from smart tourism. Tour. Rev. 2018, 73, 17–28. [Google Scholar]
  48. Wang, D.; Li, X.R.; Li, Y. Big data in tourism: Challenges and opportunities. J. Destin. Mark. Manag. 2016, 5, 63–72. [Google Scholar]
  49. Gössling, S.; Hall, C.M.; Scott, D. Tourism in the Anthropocene: Global environmental change and the impact on tourism. J. Sustain. Tour. 2017, 25, 1–17. [Google Scholar]
  50. Alvarez, M.; Jimenez, P. Application of renewable energy in tourism: Evidence from Spain. Energy Policy 2016, 97, 289–301. [Google Scholar]
  51. Gretzel, U.; Fesenmaier, D.; O’Leary, J. Intelligent systems in tourism: Concepts and applications. Ann. Tour. Res. 2011, 38, 757–779. [Google Scholar]
  52. Mariani, M.; Baggio, R. Impact of COVID-19 on the tourism industry: Evidence from European destinations. Curr. Issues Tour. 2021, 24, 1174–1182. [Google Scholar]
  53. Del Chiappa, G.; Baggio, R. The role of AI in sustainable tourism employment. Tour. Econ. 2017, 23, 1359–1375. [Google Scholar]
  54. Cobos, J.; Baggio, R.; Chiappa, G. Big data and privacy in tourism: Balancing benefits and risks. Tour. Rev. 2020, 75, 557–570. [Google Scholar]
  55. Huang, R.; Li, X. Challenges in implementing AI for sustainable tourism: A systematic review. J. Sustain. Tour. 2021, 29, 1–25. [Google Scholar]
  56. Gössling, S.; Scott, D.; Hall, C.M. Pandemics and tourism: The impacts of COVID-19. J. Sustain. Tour. 2020, 29, 1–20. [Google Scholar]
  57. Sigala, M. Tourism and COVID-19: Impacts and implications for advancing and resetting industry and research. J. Bus. Res. 2020, 117, 312–321. [Google Scholar]
  58. Boes, K.; Buhalis, D.; Inversini, A. The role of technology in optimizing resource management and enhancing destination competitiveness. J. Hosp. Tour. Technol. 2015, 6, 73–89. [Google Scholar]
  59. Gretzel, U.; Fesenmaier, D.; O’Leary, J. Impact of predictive analytics on tourism management: A comprehensive review. J. Travel Res. 2020, 59, 873–887. [Google Scholar]
  60. Femenia-Serra, F.; Neuhofer, B.; Ivars-Baidal, J.A. Decision-making in tourism management: The role of predictive analytics for resource optimization. Tour. Manag. Perspect. 2018, 27, 23–33. [Google Scholar]
  61. Carrillo, F.; Flores, J. Dynamic pricing in tourism: Balancing tourist numbers with sustainability goals. Tour. Econ. 2020, 26, 1225–1242. [Google Scholar]
  62. Lee, S.; Hong, K. Understanding tourist behavior through enhanced customer segmentation: The role of AI in sustainable tourism. J. Travel Res. 2018, 57, 1038–1050. [Google Scholar]
  63. Sigala, M. Impact of AI on operational efficiency in tourism: Case studies and future directions. Tour. Manag. 2018, 72, 179–192. [Google Scholar]
  64. Cao, X.; Lee, J. Tourism transportation optimization: A comprehensive review. Transp. Res. Part A Policy Pract. 2019, 130, 23–34. [Google Scholar]
  65. Kasliwal, S.; Thakur, V. AI in energy management for sustainable tourism. Renew. Energy 2021, 150, 1–12. [Google Scholar]
  66. Thakur, V.; Kasliwal, S. AI-enhanced waste management in tourism destinations: Applications and challenges. J. Environ. Manag. 2020, 255, 109827. [Google Scholar]
  67. Dangi, M.; Jamal, T. Conceptualizing sustainable tourism development in developing countries. J. Sustain. Tour. 2010, 18, 429–449. [Google Scholar]
  68. Benckendorff, P.; Xiang, Z. The impact of AI on cultural heritage preservation in tourism. J. Herit. Tour. 2020, 15, 241–260. [Google Scholar]
  69. Murphy, P. Local Tourism Development and the Role of AI: A Guide for Planners; Routledge: London, UK, 2013. [Google Scholar]
  70. Gössling, S.; Hall, C.M. A literature review of AI in tourism: Impacts on sustainability and education. J. Sustain. Tour. 2018, 26, 1–20. [Google Scholar]
  71. Huang, R.; Li, X. Challenges in adopting AI for sustainable tourism development: Insights from case studies. J. Tour. Manag. 2020, 45, 1–15. [Google Scholar]
  72. Li, Y.; Wang, D.; Fesenmaier, D.R. Barriers to AI adoption in tourism: A multi-stakeholder perspective. Tour. Manag. Perspect. 2020, 36, 1–13. [Google Scholar]
Figure 1. Key tourism indicators in Saudi Arabia (dataset screenshot).
Information 15 00516 g001
Figure 2. Inbound tourist visits and expenditure by destination/provinces (dataset screenshot).
Information 15 00516 g002
Figure 3. Correlation matrix.
Information 15 00516 g003
Figure 4. Connections and interconnections between variables.
Information 15 00516 g004
Figure 5. Distribution of spending rates for each Inbound-region.
Information 15 00516 g005
Figure 6. Spending rates over time.
Information 15 00516 g006
Figure 7. Scatter plot for Decision Tree.
Information 15 00516 g007
Figure 8. Scatter plot for Random Forest.
Information 15 00516 g008
Figure 9. Scatter plot for K-Neighbors Classifier.
Information 15 00516 g009
Figure 10. Scatter plot for Gaussian Naive Bayes.
Information 15 00516 g010
Figure 11. Scatter plot for Support Vector Classification.
Information 15 00516 g011
Figure 12. Time series for predicting the rate of spending using the ARIMA algorithm. The blue series represents the actual spending data from 2016 to 2021, while the yellow series illustrates the predicted spending values from 2022 to 2026. This prediction highlights the anticipated trends and potential recovery in tourism expenditure following the impact of the COVID-19 pandemic. Source: created by the authors using software.
Information 15 00516 g012
Figure 13. Comparison between classifiers. Source: adapted from [17].
Information 15 00516 g013
Figure 14. Mean Absolute Error value of all classifiers. Source: adapted from [11].
Information 15 00516 g014
Figure 15. Mean Squared Error value of all classifiers. Source: adapted from [14].
Information 15 00516 g015
Figure 16. Median Squared Error value of all classifiers. Source: adapted from [15].
Information 15 00516 g016
Table 1. Analysis of tourism sector in Saudi Arabia based on periods.
PeriodIssuesConsumer Behaviors
Pre-pandemicStable growth, infrastructure developmentHigh tourist inflow, diverse spending patterns [1,2]
PandemicTravel restrictions, economic downturnReduced travel, shift to domestic tourism [3,4]
Post-pandemicRecovery phase, new health protocolsGradual return, preference for safety and sustainability [5,6]
Table 2. Saudi Arabia tourism statistical summary from 2015 to 2021.
IndicatorsUnitFrom 2015 until 2021
Tourist Visits(’000)965,073
Tourist Overnights(’000)7,335,538
Tourist Expenditure(SAR Mn)2,246,491
Average Length of Stay(Night)7
Average Expenditure per Visit(SAR)89,443
Average Expenditure per Night(SAR)9198
Table 3. Definition of variables used in the study.
VariableDescriptionUnit
Number of Tourist Visits (Trips in Figure 1)Total number of tourist visits madeVisits (’000)
Number of Tourist OvernightsTotal number of nights spent by touristsNights (’000)
Tourist ExpenditureTotal expenditure by touristsSAR Mn
Average Expenditure per VisitAverage expenditure per tourist VisitsSAR
Average Expenditure per NightAverage expenditure per night spentSAR
Table 4. Hyperparameter tuning results.
HyperparameterDecision TreeRandom ForestLinear RegressionK Neighbors ClassifierGNBSVC
max_depth1526----
max_features‘sqrt’‘sqrt’----
min_samples_leaf22----
min_samples_split28----
n_estimators-200----
m (slope)--1.2696---
c (intercept)--0.1104---
Learning_rate--0.05---
n_neighbors---5--
weights---‘distance’--
kernel-----‘rbf’
C-----1.0
gamma-----‘auto’
Disclaimer/Publisher’s Note: The statements, opinions and data contained in all publications are solely those of the individual author(s) and contributor(s) and not of MDPI and/or the editor(s). MDPI and/or the editor(s) disclaim responsibility for any injury to people or property resulting from any ideas, methods, instructions or products referred to in the content.

