Article

Toward Ensuring Data Quality in Multi-Site Cancer Imaging Repositories

by
Alexandra Kosvyra
*,
Dimitrios T. Filos
,
Dimitris Th. Fotopoulos
,
Olga Tsave
and
Ioanna Chouvarda
*
Laboratory of Computing, Medical Informatics and Biomedical Imaging Technologies, School of Medicine, Aristotle University of Thessaloniki, 541 24 Thessaloniki, Greece
*
Authors to whom correspondence should be addressed.
Information 2024, 15(9), 533; https://doi.org/10.3390/info15090533
Submission received: 29 July 2024 / Revised: 26 August 2024 / Accepted: 28 August 2024 / Published: 2 September 2024
(This article belongs to the Special Issue Artificial Intelligence and Data Science for Health)

Abstract

:
Cancer remains a major global health challenge, affecting diverse populations across various demographics. Integrating Artificial Intelligence (AI) into clinical settings to enhance disease outcome prediction presents notable challenges. This study addresses the limitations of AI-driven cancer care due to low-quality datasets by proposing a comprehensive three-step methodology to ensure high data quality in large-scale cancer-imaging repositories. Our methodology encompasses (i) developing a Data Quality Conceptual Model with specific metrics for assessment, (ii) creating a detailed data-collection protocol and a rule set to ensure data homogeneity and proper integration of multi-source data, and (iii) implementing a Data Integration Quality Check Tool (DIQCT) to verify adherence to quality requirements and suggest corrective actions. These steps are designed to mitigate biases, enhance data integrity, and ensure that integrated data meets high-quality standards. We applied this methodology within the INCISIVE project, an EU-funded initiative aimed at a pan-European cancer-imaging repository. The use-case demonstrated the effectiveness of our approach in defining quality rules and assessing compliance, resulting in improved data integration and higher data quality. The proposed methodology can assist the deployment of big data centralized or distributed repositories with data from diverse data sources, thus facilitating the development of AI tools.

1. Introduction

Cancer continues to pose a substantial global health challenge, impacting individuals from diverse age groups, racial backgrounds, and socioeconomic strata [1,2]. Screening initiatives for breast [3], prostate [4], colorectal [5], or lung cancer [6] have demonstrated their efficacy in facilitating early diagnosis and reducing mortality rates. In addition to the data generated through screening programs, cancer patients undergo numerous imaging and laboratory tests, enabling clinical experts to enhance their diagnostic accuracy and treatment strategies. The growing wealth of data has paved the way for the development of Artificial Intelligence (AI) and Machine-Learning (ML) models, which hold immense potential in revolutionizing cancer detection, classification, and patient management. By harnessing these cutting-edge technologies, healthcare professionals aspire to further improve cancer care outcomes and make significant strides toward combating this formidable disease [7].
In the medical field, machine learning (ML) and deep learning (DL) are widely used for addressing clinical challenges in disease diagnosis and treatment through the development of clinical decision support systems [8] and predictive modeling [9,10]. Cancer diagnosis is based on imaging examinations such as X-ray mammography (breast cancer), MRI (prostate cancers), CT scans (lung cancer), and PET scans (lung and colorectal cancers). Manual analysis of these images can delay the development due to the large volume and rapid production rate of data. It can also be time-consuming due to manual processing. This has led to the development of tools and pipelines that can quantify image characteristics (radiomics) and identify or annotate lesions, therefore assisting medical experts’ decisions. The advantages of this approach have been demonstrated in various cases [11,12]. In [13], an AI-based system was found promising in accurately diagnosing lung cancer. AI’s role in enhancing colorectal cancer screening through endoscopy is explored in [14]. AI medical imaging applications for cancer detection and tumor characterization have shown promise in improving detection efficiency and accuracy.
AI is significantly transforming cancer research and clinical practice by enhancing diagnostic accuracy, personalizing treatment plans, and accelerating the discovery of novel therapies. In clinical routines, the development of robust AI models relies heavily on access to large, diverse, and high-quality datasets. Data repositories play a crucial role in this context, providing the necessary resources for training and validating AI algorithms. These repositories enable researchers to develop models that are generalizable and effective across different populations, driving advancements in cancer care and improving patient outcomes.
While AI undeniably holds immense potential to revolutionize cancer patient care, its seamless integration into clinical settings remains questionable. One of the primary concerns lies in the implementation of AI tools, which often rely on data collected from a limited number of specific regions, introducing inherent biases. For instance, datasets like TCGA cohorts consist of patients with European ancestry [15], leading to potential disparities in AI-driven diagnoses and treatments. Even when attempts are made to mitigate bias by incorporating data from other sources, challenges arise due to the heterogeneity of the collected data since different acquisition protocols are used. Moreover, most AI algorithms focus on image and -omics data, neglecting the wealth of valuable information available in Electronic Health Records (EHR). Leveraging EHR data can offer supplementary insights, enhance accuracy, and reduce bias in AI applications. Consequently, addressing the issue of data homogenization and ensuring high data quality becomes crucial to ensure the success and ethical implementation of AI technologies in cancer care.
Data quality is defined as the measurement of how well a dataset serves its intended purpose. However, defining data quality in a generalized way is difficult as it is related to the nature of the examined data set. In a simplified way of description, data quality is measured by comparing the existing dataset’s state with a desirable state. The data quality dimensions are not yet strictly defined but the literature provides wide information on the metrics used for data quality assessment and their explanations [16,17]. The metrics should be selected based on the needs and requirements of each specific use-case. Many approaches have been developed to define and assess data quality, including Data Quality Measurement Models [18] and Data Quality Frameworks [17] that aim to formulate a concept/terminology for assessing quality in EHR data. Other works focus on developing data quality analysis tools, such as Achilles Heel [19]. However, most approaches focus on one type of data, clinical or imaging, creating a gap in the quality checking of a complete dataset. Moreover, most approaches present the results of the quality assessment as dataset scoring, not providing information on the actual errors. Finally, these approaches are built to be used on specific datasets and cannot be adapted for use in other use cases.
Bearing these gaps in mind, in this work, we propose a NOVEL three-step methodology for ensuring high data quality in a large-scale cancer-imaging repository that combines the building of a conceptual model, the definition of quality rules, and the development of a quality assessment tool. The novelty and merit of the proposed methodology are based on (a) the comprehensive end-to-end approach for ensuring data quality, (b) the integrated view that combines both imaging and clinical data as part of the problem and proposes a detailed quantification of the quality, (c) the data quality tool that applies customizable domain knowledge to rigorously check the quality issues and propose corrections.
As an application of the proposed methodology, to better present its virtue in a practical setting, a use-case is presented in which the whole procedure was applied in the data integration of an EU-funded project, INCISIVE (https://incisive-project.eu/, accessed on 27 August 2024.). The INCISIVE project has a dual goal: to create a pan-European cancer-imaging repository and to develop and validate an AI-based toolbox that enhances the performance, interpretability, and cost-effectiveness of existing cancer-imaging methods. To that end, the proposed procedure was used in the data management pipeline: the data integration procedure was applied to create the rules and requirements for the integration of multi-site data and the data quality assessment procedure was used to assist the high-quality data provision.

2. Materials and Methods

The proposed methodology consists of the following three steps:
  • The first step is to create the Data Quality Conceptual Model which consists of the set of data quality metrics that will be assessed by this methodology.
  • The second step is to create a well-defined data-collection protocol, which is the product of a data integration procedure. This protocol constitutes a set of requirements that data should follow to be properly integrated into a multi-center repository and is designed to ensure data homogeneity among multiple-source data. The procedure is briefly described in previous work [20], but this article is extended to describe the steps in detail, as well as all the resulting requirements and data quality rules that ensure that the data are compliant with the metrics set through the conceptual model.
  • The third step is the quality assessment of the data provided through a Data Integration Quality Check Tool (DIQCT), which, based on the rules provided by step 2, checks if the quality requirements are met. The tool informs the user of corrective actions that need to be taken prior to the data provision to ensure that the data provided is of high quality. The tool was described in a previous publication [21], but in this article, an extended version is presented along with the evaluation results of 3 rounds of user experience assessment.
Figure 1 depicts the overall methodology.

2.1. Data

The methodology was developed, focusing on clinical and imaging data datasets. Integrating and ensuring high data quality in multi-source data collection presents significant challenges. Referring to clinical data, some key issues include data heterogeneity, where diverse formats (e.g., the way that data are stored), terminologies (e.g., the terminologies used to define each variable), and standards (e.g., medical standards used for the entries) across sources impede data harmonization. Moreover, inconsistent data, with variable accuracy and missing values, hinder the reliability of aggregated datasets. Referring to imaging data, the heterogeneity of imaging modalities, formats, and resolutions across diverse sources complicates the integration process. Moreover, variations in imaging protocols and equipment, as well as metadata and annotation inconsistencies, can lead to great heterogeneity in multi-source data collection. In both cases, managing large data volumes from various sources often necessitates sophisticated infrastructure and tools. Addressing these challenges requires robust data integration procedures that ensure data homogeneity, advanced data quality control techniques to make sure that data follow the requirements (standards, terminologies, acquisition protocols, etc.), and comprehensive metadata management to ensure the integrity and usability of integrated clinical data.

2.2. Data Quality Conceptual Model

The choice of the dimensions to be examined depends on the problem to be solved and the type of data examined. For this specific health data repository and after examining the nature of data, the following six dimensions were decided to be examined, as they were considered the most suitable in this study case: (i) Consistency refers to the process of keeping information uniform and homogeneous across different sites, (ii) Accuracy refers to the degree to which data represent real-world things, events, or an agreed-upon source, (iii) Completeness refers to the comprehensiveness or wholeness of the data, (iv) Uniqueness ensures there are no duplications or overlapping of values across all data sets, (v) Validity, refers to how well data conforms to required value attributes, and (vi) Integrity refers to the extent to which all data references have been joined accurately.

2.3. Data Quality Requirements and Rules Definition Procedure

To define the data quality rules to which the data will have to conform, a methodology was followed, separately for clinical and imaging data. With this methodology, all requirements for the quality check were extracted.

2.3.1. Clinical Metadata and Structure

To facilitate the integration of data deriving from different data sources and define the requirements for the data provision, an iterative integration workflow was implemented to ensure that all data collectors followed the same principles when it came to data collection and preparation. The workflow consists of the following steps, described also in Figure 2:
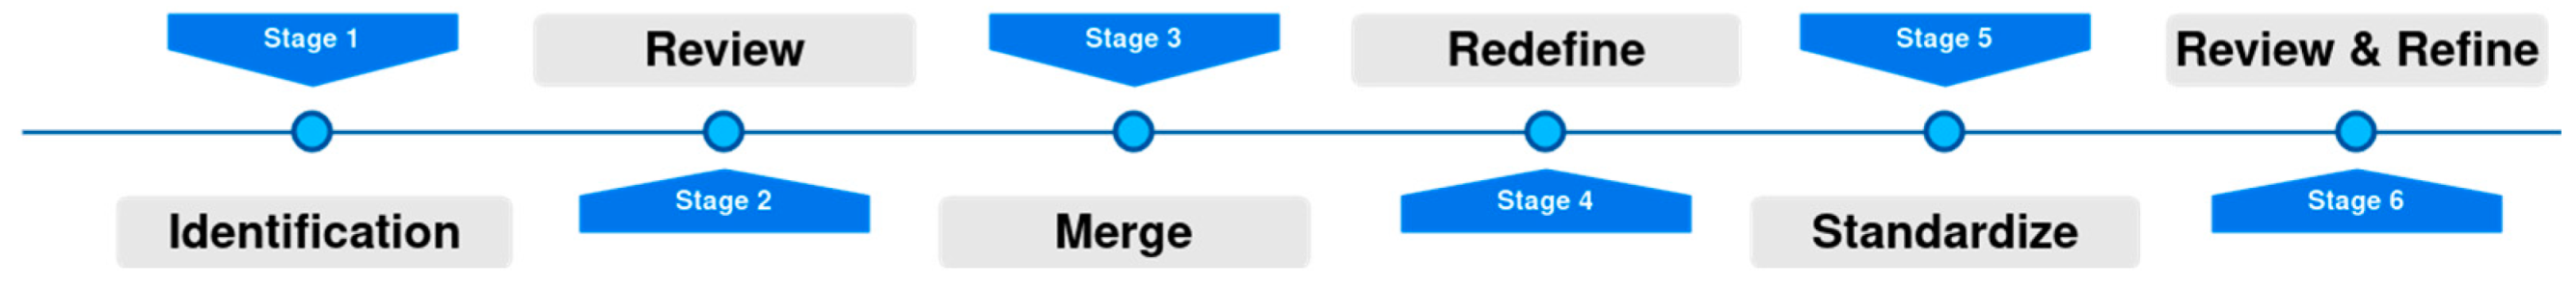
  • Identification: As a first step, an initial template was created for each cancer type—breast, colorectal, lung, prostate—incorporating domain knowledge from medical experts and the related literature. This first template included the methodology for separating collected data in different time points, as well as associating related imaging, laboratory, and histopathological examinations with each time point.
  • Review: These initial templates were circulated to the medical experts and reviewed. The medical experts shared their comments on the proposed protocol and an asynchronous discussion took place to debate on controversial topics. In this step, fields were added, removed, or modified to fit the needs of the specific study.
  • Merge: After the review and the received comments, a consensus on each template was extracted and discussed thoroughly in a meeting with the medical experts to resolve homogenization issues.
  • Redefine: The data providers were asked to provide an example case for each cancer type. These example cases were reviewed for consistency between the entries deriving from different sites. Based on the inputs received, the allowable value sets were defined. The pre-final version of the templates was extracted in a homogenized way.
  • Standardize: At this point, the standardization of the fields’ content took place. Each one of the value sets was standardized to follow categorical values or medical standards. In applicable cases, terminologies based on medical standards, such as ICD-11 and ATC, were adopted.
  • Review and Refine: The templates were circulated again for verification.
Referring to the first step in more detail, the type of clinical data was based on the intrinsic nature of each cancer type (breast, prostate, lung, and colorectal), the (patho)physiology of each cancer type, the current treatment pathways followed at the medical centers involved in the studies (existing available data, measurements and examinations that currently occur) and the medical/clinical guidance, HCPs gave their input on what data are considered mandatory to accompany a medical exam whereas also nice-to have type of data to enhance the efficiency and effectiveness and novelty of the forthcoming AI-services. The selection of each data type was also based on literature and related scientific works so that the corresponding data collections meet the demanding criteria of the scientific field (repository and AI-services development). Moreover, the combined use of data (e.g., genetic markers combined with histopathological data and/or tumor staging) can lead to a service that manages more efficiently the clinical question and guidance (e.g., the response to a specific treatment). A consensus was reached regarding the values and ranges of the collected data leading to the formation of structured data templates for each cancer type.
During this procedure, other aspects of the data-collection procedure were also defined, such as the specific timing of each one of the defined time points, the unique patient identification number (id) format, and the study naming convention and folder structure. Moreover, since the templates were built to collect a wide variety of clinical metadata, it was clear that not all data providers could provide all the information. Thus, we proceeded to define a minimum set of variables, named mandatory, that each data provider should include in the dataset. This decision was taken based on what clinical experts (radiologists and oncologists) typically use in clinical practice for patient evaluation and considering that they should be available in every case and on the needs of the data analysts and AI developers that develop AI models to address clinical challenges, such as prediction of cancer stage, tumor localization or prediction of metastasis risk in a given timeframe.

2.3.2. Imaging Data

Imaging data are a main source of information used to evaluate patients’ health, especially in cancer cases. Imaging is performed by expertized radiologists with the support of a technician, while the acquisition protocol is based on clinical guidelines. A variety of imaging modalities are available, such as computed tomography (CT), positron emission tomography (PET), magnetic resonance imaging (MRI), X-rays, or mammography, and they are used to examine different tissues in different cancer types, while they can also be combined to provide complementary information. Imaging data are stored in the Picture Archiving and Communication System (PACS) of the medical center whereas different file formats can be used, such as DICOM or NIFTI.
Interestingly, those file formats do not only include information related to the intensity of each image pixel, but complementary information is also stored. This information is crucial for the proper interpretation of the images. It is worth mentioning that the DICOM standard describes a list of more than 2000 attributes that can be used to describe an image. These attributes include, among others, information related to the patient’s personal information, the acquisition protocol, or the technical specifications of the imaging.
Thus, the main data quality requirement is related to the anonymization policy to comply with the legal and privacy norms. In this respect, each imaging protocol, including DICOM, provides a detailed description of actions that can be adapted to create different security profiles. In addition, the GDPR mandates that only essential data for a given task should be processed, and thus, hospitals must eliminate any information that is not necessary. On the other hand, data analysts expect as much information as possible and expect only information that can cause legal issues to be removed. As a result, a balance between anonymization and analysis needs was reached, and the data quality should check whether all data follow the anonymization protocol.
In addition, from the analysis point of view, data must share similar characteristics to compare different data providers. Given that the acquisition protocol may be slightly altered based on the experts’ needs and the case under evaluation, a consensus regarding the analysis requirements was reached during cancer-specific workshops by combining clinical expert and data analyst experience.
Finally, regarding the imaging modalities that are used for the development of AI algorithms, it is important to remain adherent to clinical protocols and best practices while avoiding modifications to standard clinical procedures. However, to define the minimum set of imaging modalities that different clinical sites from various European countries can offer, a set of requirements must be defined. Those requirements were related to the type of imaging modalities that all involved partners are using as well as the minimum set of data quality that the images must have. To achieve this, a series of workshops was organized, with each focusing on a specific cancer type. During the workshops, every clinical site presented their image acquisition protocols. Through collaborative discussions, a consensus was reached on the minimum data requirements such as those data can be used for the implementation of AI algorithms addressing clinical questions highlighted by radiologists.

2.4. Data Integration Quality Check Tool

To assess the quality of the data, a tool was developed, the Data Integration Quality Check Tool (DICQT). This tool’s aim is to check if the requirements set in the integration procedure to ensure data quality in the six dimensions described above are met. This tool is a rule-based tool that compares the input data with the predefined rule set and produces a series of reports. The tool was developed to check rules that are not hard-coded, meaning that the rules are inserted in the form of a knowledge base, and thus, the tool is easily extensible. It consists of a total of 9 components divided into 3 categories: (i) Clinical metadata, (ii) Connection between clinical metadata and images, and (iii) DICOM images. The whole application is structured to be user-friendly and easily understood by the user, so the checking of the data quality dimensions is spread among various components. The tool is used in the data preparation process and prior to the data upload. The reports are presented to the user as a proposition for corrective actions. The user is asked to proceed to the data refinement and then continue with the data upload.
Referring to the reports presented by the user, they relate to each component of the tool and are connected with each quality metric related to this component. The reports present in detail the errors found and the actual point of the dataset that they were found, e.g., in which tab/field of the template for clinical metadata or in which DICOM image, along with the image’s path. Moreover, in each component and for each quality metric, a quantification takes place, either with visualization methods presenting the number of errors found or by presenting the percentage of entries that comply with the quality metric requirements. Of note, these requirements were not conceived to cover the needs of a specific AI algorithm but rather to ensure more generically and flexibly that the data can be usable in this direction, and only a small part of the requirements addresses more specific analysis requirements, implementation details, and versions. The various components of the DIQCT were developed in two programming languages, R and Python, and were integrated in one pipeline. This tool is related to prior to uploading work, so it runs on the client side. The tool was developed and released in three versions:
  • Version 1: In this version, the tool was implemented in two ways: (i) as an executable file (.exe): the pipeline along with all the dependencies was built as a directly executable file (ii) as Docker Image: the pipeline along with all the dependencies was built in a docker container publicly available to all members of the consortium.
  • Version 2: To improve the usability of DIQCT, in the second version, a web application was implemented using R programming language and R Studio Shiny server, allowing the interactive execution of specific scripts through HTML pages. This application includes 5 components, and the execution of each of them is controlled by the user.
  • Version 3: The third release contains four additional components and some improvements in terms of efficiency and visualization.

2.5. Evaluation Methodology for the Quality Tool

For the evaluation of the tool, 3 different rounds of evaluation took place. These rounds were repeated for each release of the tool. In the first round, internal validation was conducted as a testing procedure by the development team. The team created mock datasets with various induced errors and tested the components for bugs and oversights. The team corrected the components based on the results of the testing procedure. In the second round, external validation was conducted in collaboration with a small number of data providers. This testing’s feedback included bugs and comments by the users, and the team incorporated the findings in the components before the release of the version to the consortium. After the release of the tool, a third round of evaluation took place. In this round, the user experience evaluation, a questionnaire was circulated among the users. The questionnaire consists of 4 parts. The first part consists of some general information on the background of the user (technical partner or medical expert) and the operating system used (Windows, Mac, Linux), while on personal information of the participant is asked, so the survey is completely anonymous. The second part consists of questions about the most reported errors or issues that came up when the tool was used. The third part refers to the user experience evaluation. For this part, 4 categories of the User Experience Questionnaire [22] were adapted: Attractiveness, Perspicuity, Efficiency, and Dependability. For each one of these categories, 4 pairs of aspects were examined. For the Attractiveness category, the pairs are annoying—enjoyable, good—bad, unlikable—pleasing, friendly—unfriendly. For the Perspicuity Category, the pairs are not understandable—understandable, easy to learn—difficult to learn, complicated—easy, clear—confusing. For the Efficiency category, the pairs are impractical—practical, organized—cluttered, inefficient—efficient, fast—slow, and for the Dependability category, the pairs are valuable—inferior, obstructive—supportive, secure—not secure, meets expectations—does not meet expectations. The fourth and final part includes questions asking for feedback for improvements by the user. After each round of version release and evaluation of the tool, the development team adjusted the tool based on the feedback from the users. These adjustments included a clearer error reporting presentation with more detailed explanations and visual summaries of the results.

3. Results—The INCISIVE Case

3.1. Data

The data used for implementing and validating the methodology comes from 5 different countries and 9 data providers. Data are related to the 4 cancer types already mentioned—lung, breast, colorectal, and prostate. Data is available in the INCISIVE repository, which contains data for more than 11,000 and almost 5.5 million images. The collection of both clinical and imaging data took place in four distinct studies—retrospective, prospective, observational, and feasibility. The datasets include clinical, biological data, and imaging data. Clinical and biological data include a variety of properties described in detail below. The imaging data includes body scans in different modalities (MRI, CT, PET, US, MMG), DICOM format, and histopathological images in PNG format. Imaging data in DICOM includes, as well as the imaging, also metadata related, among other things, to the screening protocol and patient information and segmentation/annotation files in NIFTI (Neuroimaging Informatics Technology Initiative) format.

3.2. Data Quality Ruleset

The ruleset that is derived from the requirements and rules definition procedure and is followed by the DICQT to perform the quality assessment of the data is described in Table 1 below for each aspect of the check. These rules constitute the knowledge base and can be altered to adapt to the needs of other applications. Regarding the clinical metadata collection, the structure of the templates resulting from the same procedure is shown in Figure 3.

3.3. The DIQCT

The components and their connection with the data quality dimensions are described in detail below and depicted in Figure 4:
The components of the first category are:
  • Clinical metadata Integrity
    • Structure and codification: In this component, errors related to the template structure and patient codification are reported. Specifically, this component checks and reports (i) The structure of the provided template. The provided template structure, in terms of tabs and columns, is compared to the one initially defined and circulated for use, and alterations are reported to the user for correction. This check is related to the second dimension, Accuracy. (ii) The patient’s ids. The inserted patient unique identification numbers are checked to ensure they follow the proper encoding and for duplicate entries in the template. The user must correct the reported errors and continue. This check is related to both Accuracy and Uniqueness and Rules 1 and 3.
    • Content Validity: In this component, errors related to the template content are reported. Specifically, this component checks if the standards and terminologies proposed for the allowable values of all fields of the templates are followed. It reports, for each patient separately in a different row, the fields of each tab that do not comply with the proposed value range. This component also checks if the time points provided are within the boundaries proposed in the collection protocol definition and if all time points provided are in the correct chronological order. The user must review erroneous entries. This check is related to Validity and Accuracy quality dimensions and Rules 2 and 4.
  • Case Completeness: This component presents an overview of the data provided. It depicts a summary for each patient in terms of what modalities are available at each time point, as well as the percentage of mandatory fields that are present for each patient and a list of the absent fields so the user can review the missing values and provide more information if possible. This report is related to Completeness and Rule 5.
    The components of the second category are:
  • Template-image Consistency: This component has a dual role: (i) For each patient, the imaging modalities provided are inserted in the template to a corresponding time point. This component checks for each entry the agreement between the template and the images provided. (ii) If the provided images are compliant with the template, it performs a proper renaming of the studies’ folders to a predefined naming convention so they can be stored in a unified way. In case of inconsistency between the template and the folders, a message appears for the specific patient. The user must correct the reported errors and continue. This component is related to Integrity and Rules 1 and 3.
    The components of the third category are:
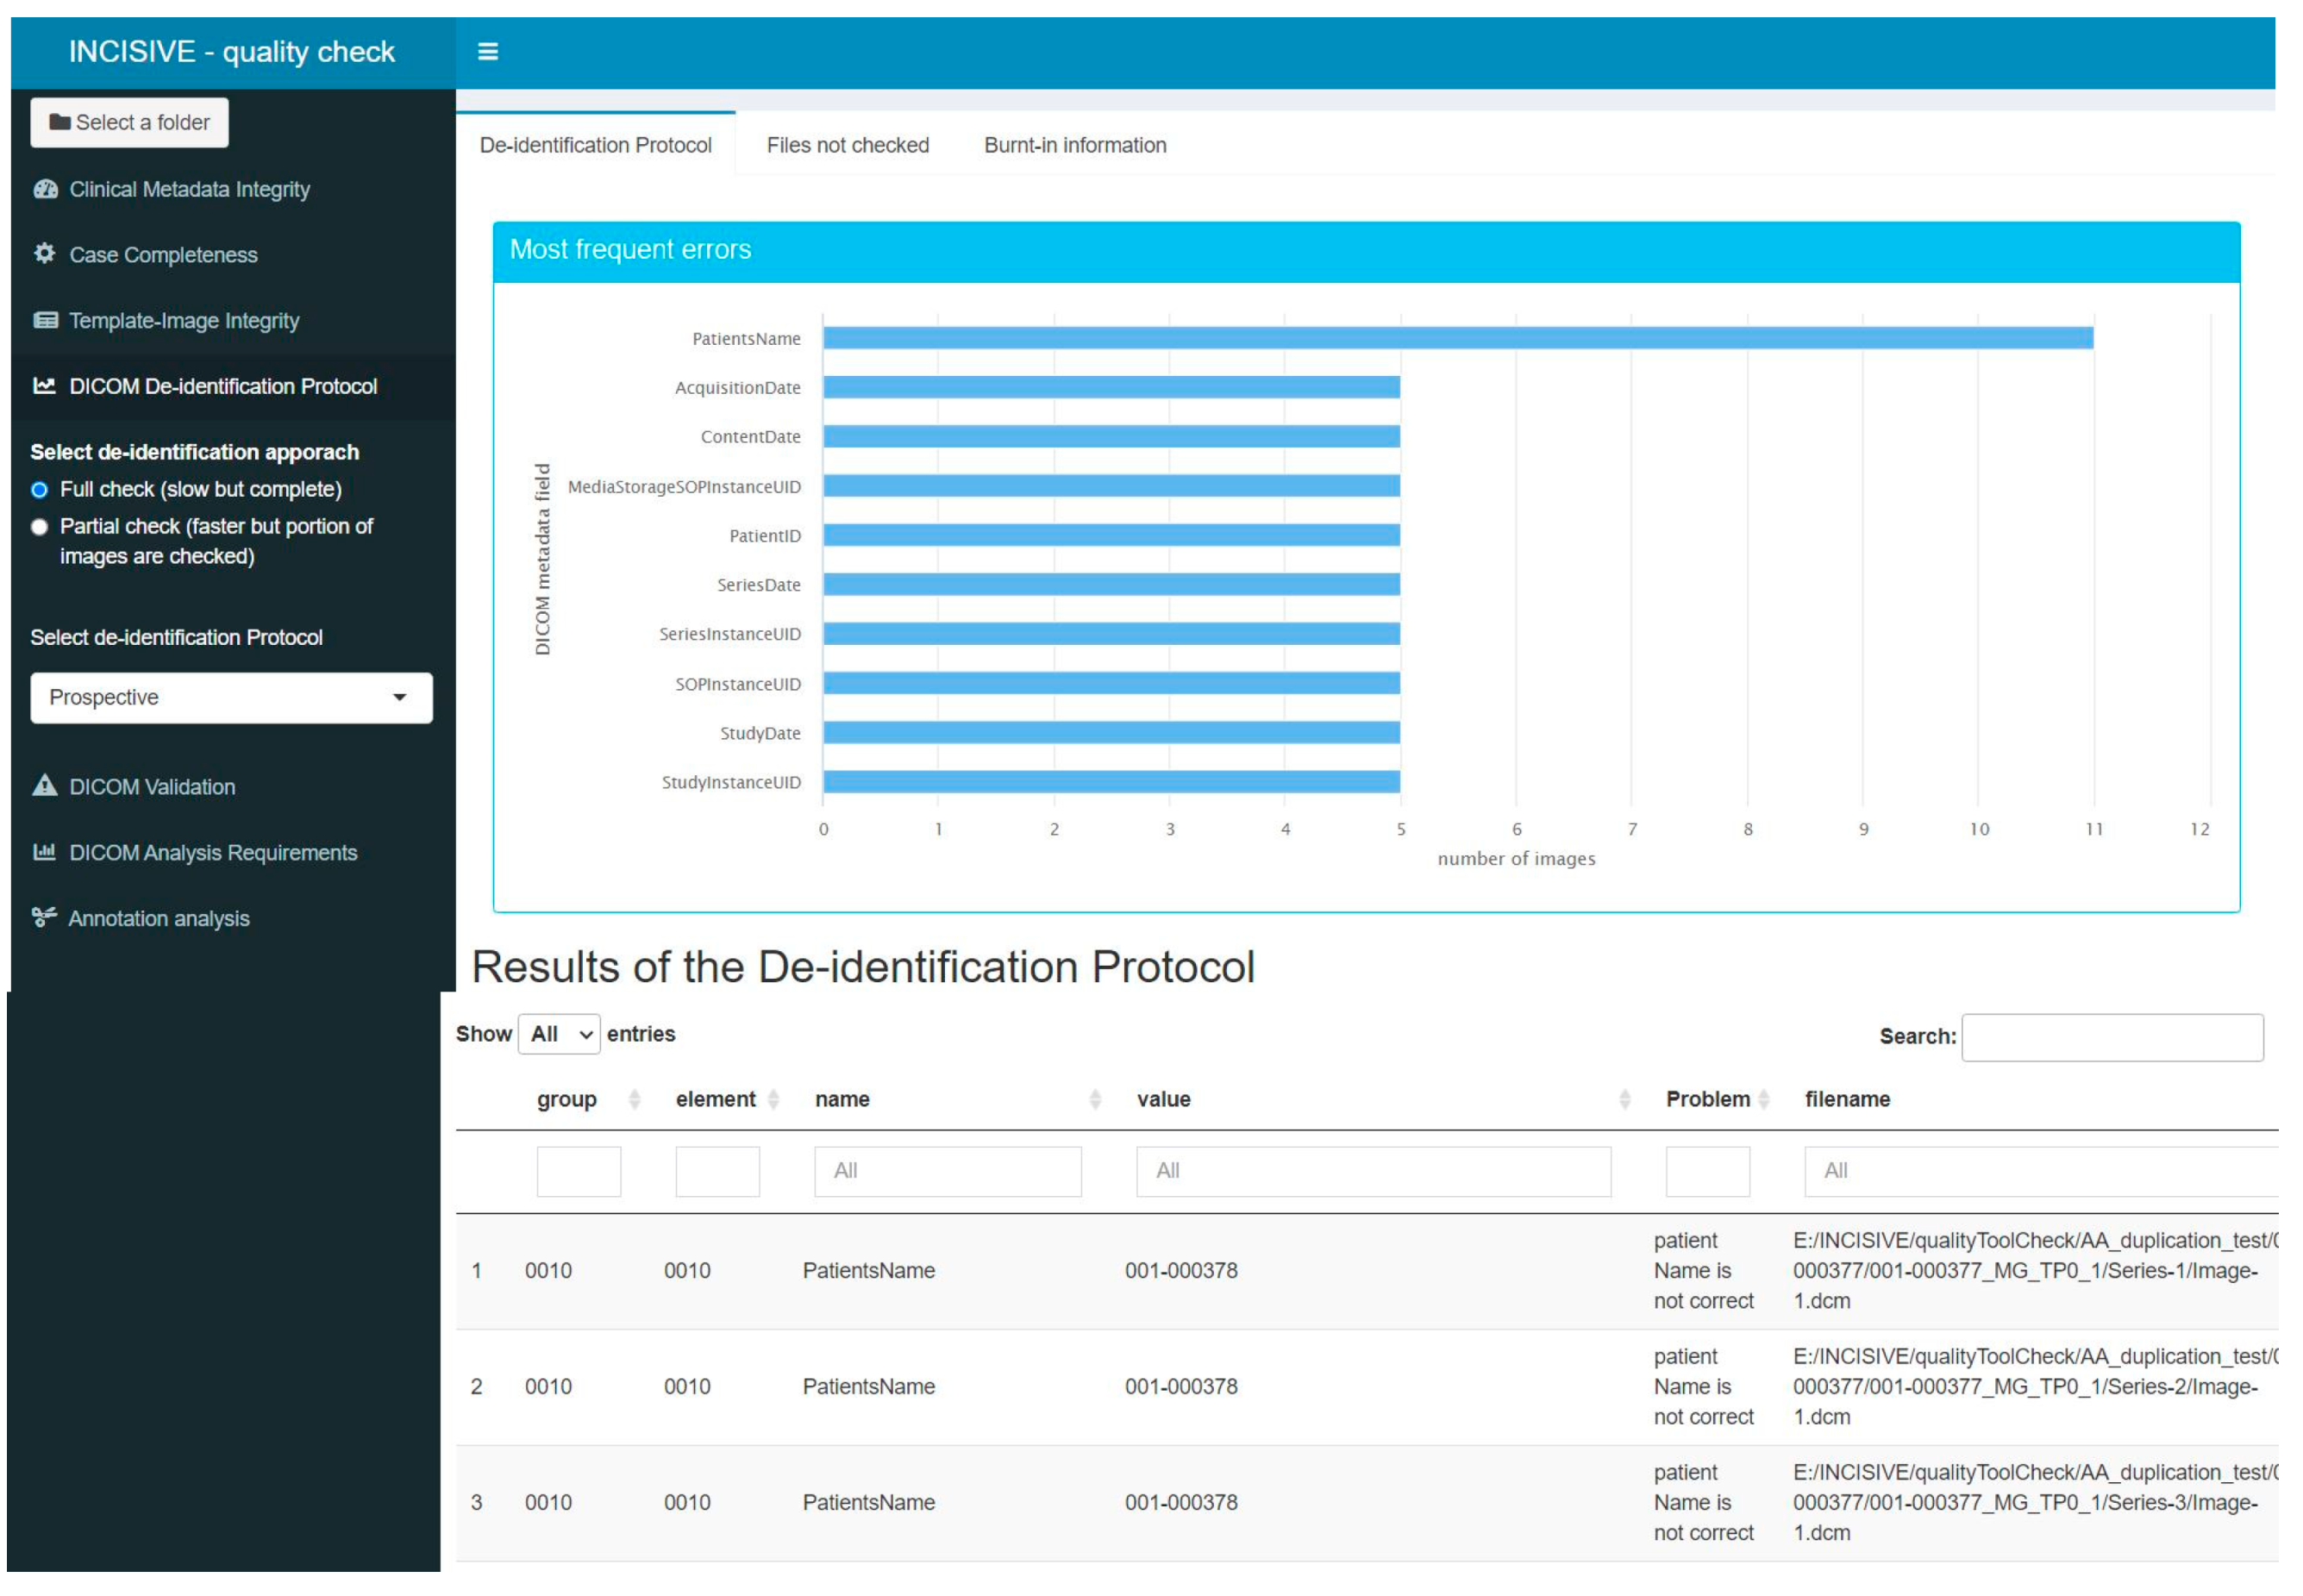
  • DICOM De-identification Protocol: DICOM files contain not only imaging information, such as intensity for each pixel, but also several valuable metadata crucial for the proper interpretation of the images. These metadata are stored in specific DICOM tags, each characterized by a group of two hexadecimal values. The de-identification protocol is defined by a list of tags and their respective actions, which could involve removing the value or replacing it with a new one. The main goal of this component is to verify whether a specific de-identification protocol has been correctly applied to the imaging data. To achieve this, the tool checks the metadata in all the DICOM files and suggests appropriate actions to ensure compliance with the protocol. Users can interact with the tool and choose among different protocols, making it highly versatile. The tool generates an output in a tabular format, listing the metadata that does not comply with the protocol, along with the path to the corresponding image and the corrective action that needs to be applied. Additionally, the tool provides a graphical representation of the most common errors using a bar chart. It is important to note that this component does not assess whether personal data are overlaid in the image as burned-in information. Its primary focus is on the proper handling of DICOM metadata to maintain data consistency and privacy. It is related to Consistency and Rule 7.
  • DICOM Validation: As mentioned earlier, DICOM metadata contains valuable information related to the acquisition protocol. The cornerstone of this component is the dciodvfy tool (https://dclunie.com/dicom3tools/dciodvfy.html, accessed on 27 August 2024), which provides comprehensive functionality by performing various checks on DICOM files. First, it verifies attributes against the requirements of Information Object Definitions (IODs) and Modules as defined in DICOM PS 3.3 Information Object Definition. Second, it ensures that the encoding of data elements and values aligns with the encoding rules specified in DICOM PS 3.5 Data Structures and Encoding. Third, the tool validates data element value representations and multiplicity using the data dictionary from DICOM PS 3.6 Data Dictionary. Lastly, it checks the consistency of attributes across multiple files that are expected to be identical for the same entity in all instances. Through these checks, the tool ensures the integrity and conformity of the DICOM data, promoting accurate and standardized medical image management. However, it is important to note that the DICOM Standard Committee does not provide any official tool to ensure complete DICOM compliance. As a result, this tool does not guarantee that the DICOM file is entirely compliant with DICOM, even if no errors are found during the validation process. Nevertheless, the tool does report major errors, such as missing mandatory attributes, the presence of invalid values in DICOM tags, encoding issues, or errors in the unique identifiers. Similar to the de-identification component, the outcome of the validation component is provided both in a tabular format listing the errors found for each DICOM file and in a graphical format where the most common issues in all the DICOM files are visualized as bar charts. This user-friendly presentation aids in identifying and addressing potential problems in the DICOM data, contributing to enhanced data quality and reliability. This component integrates rule 6 and Validity.
  • DICOM Analysis Requirements: DICOM Analysis Requirements: This component aims to assess whether the DICOM files can be used for analysis purposes. In this regard, AI developers need to define specific requirements that a file must meet to be suitable for analysis. Three types of requirements can be distinguished:
    • Image Requirements: These are related to the data quality used for analysis and training of the algorithms. Quality factors may include pixel size, slice thickness, field of view, etc. The analysis of DICOM files ensures that the data have similar quality. The component produces an outcome table listing the images that do not fulfill each requirement. This component relates to Rule 9 and Consistency.
    • Required imaging modalities: These requirements are related to the imaging modalities expected for each cancer type. AI developers collaborate with clinical experts to define these modalities, which are specific to each type of cancer. The component checks whether at least one of the imaging modalities defined for each cancer type is provided. For instance, if data from lung cancer patients are provided, the AI developers expect to access CT images or X-rays, as the implemented models rely on these types of images. This component incorporates rule 8 and Completeness.
    • Annotations: This requirement relates to the availability of annotation files in the correct series folder. Some AI tools may need segmentation files, so this component checks whether an annotation file of a specified format, such as a NIFTI file, is present in a folder. Additionally, the tool verifies whether the annotation file has the same number of pixels across the X and Y planes as the DICOM files located in the same folder. It also checks whether the number of slices in the annotation file coincides with the number of DICOM images in the folder. If more than one annotation file is found in the same folder or if the annotation file is not in the series folder, an appropriate message is provided. The tool generates an outcome table listing all the annotation files found, along with any issues that may have been identified and relate to Rule 10 and Consistency.
  • DICOM Overall Patient Evaluation: This component summarizes the findings from the previous component and presents a table containing all the patients and the extent to which the quality requirements are met. Additionally, this component checks for any duplicate images that may exist for each patient and across the whole repository. Each requirement is included in a separate column of the table. If a requirement is fully met for a patient, the respective cell is colored green. In cases where a requirement is only partially covered, for example, not all the expected imaging modalities are provided, the cell is colored in beige. However, if the requirement is not met at all, the cell is colored red. This component relates to Uniqueness and Completeness.
Figure 5 and Figure 6 depict two components of the quality tool as an example of this work’s actual product. In the left part of the image, all the components are listed, while in the main part, we can see the header of the results presented as well as an explanation of what the tool checks and what are the expected outcomes. In some cases, different colorization was used to depict the ‘right’ and ‘wrong’ examined properties.

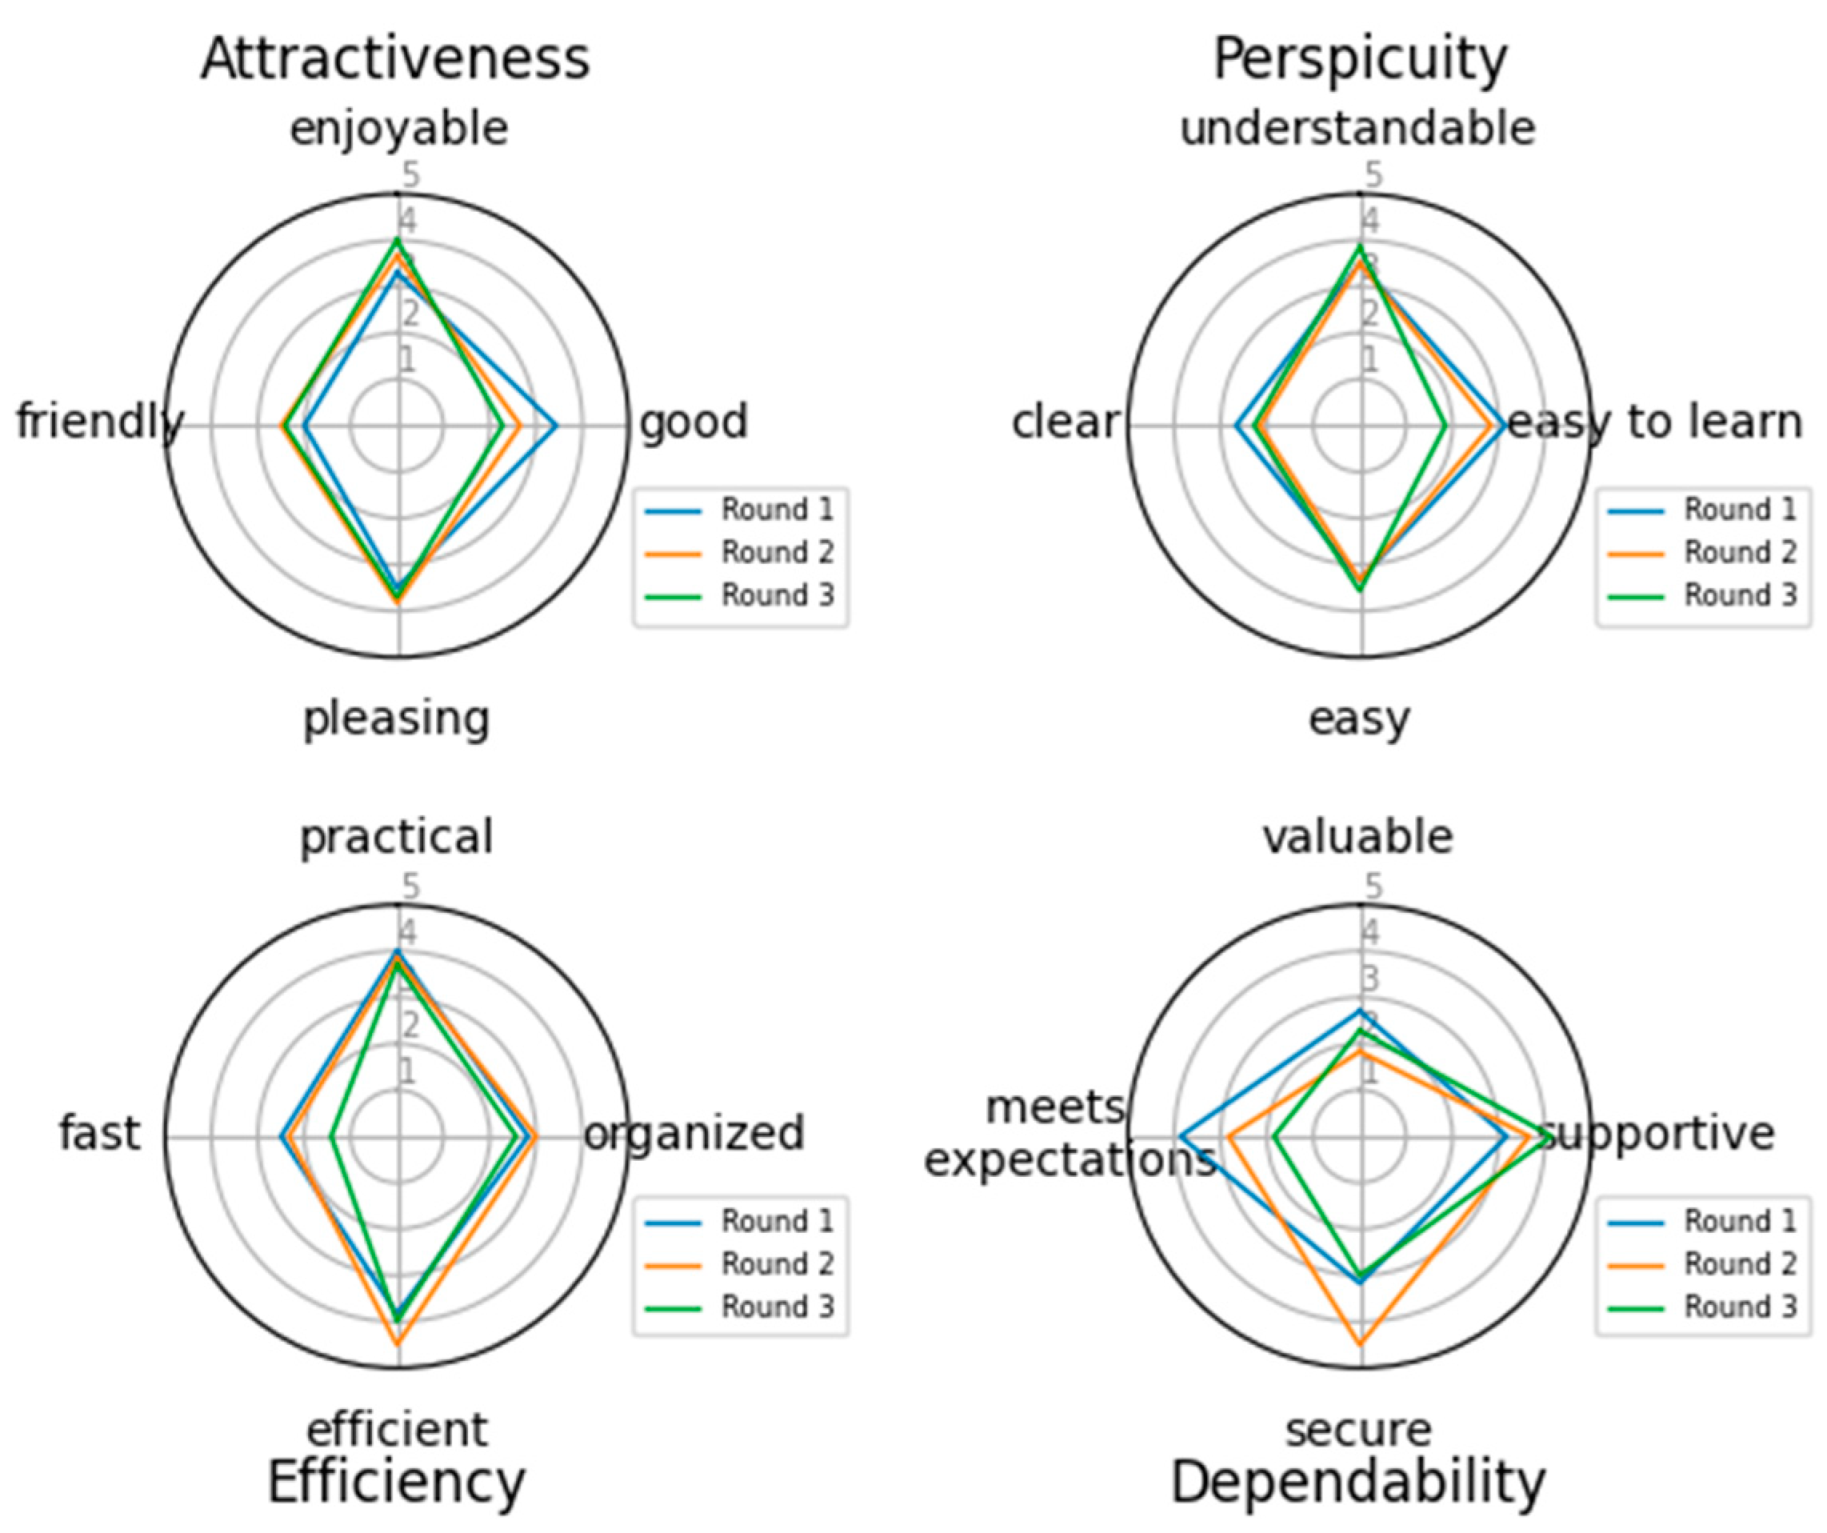
3.4. Evaluation of the Tool

The questionnaire results are presented in this section for all three rounds of the evaluation, one for each release of the tool. Regarding the general information of the participants, referring to the user’s background and type of operating system, they are presented in Table 2.
For the second part of the questionnaire referring to the most common issues that users encountered during the use of the tool, meaning errors identified in the data, the responses are clustered in 3 categories referring to the clinical metadata, the connection between clinical metadata, and images, and the DICOM images issues. These issues were also identified through the external validation process. In the first category of errors, a common issue refers to missing values that are important for the proper execution of the tool, such as dates and labels of time points. Other errors refer to wrongly imported entries, meaning entries that do not follow the proposed value ranges and improper patient codification. Another issue identified relates to the timepoint boundaries. Each time point was defined to refer to a certain period after the initial diagnosis. In many cases, the provided time points were outside these boundaries. Moreover, at the time points level, some partners did not use proper labeling to match the treatment, histopathological, and laboratory examinations with the time points (e.g., two biopsies were imported to match the baseline timepoint), resulting in identifying these entries as duplicates. Regarding the second category, the template—image integrity, two major errors were mentioned. The first one was that the number of studies provided in the images folder did not match the studies imported in the template. The second error was that the modality provided as a DICOM image did not match with the modality mentioned in the template. In the third category related to the DICOM images, the most common error was the presence in the DICOM header of some fields that should have been removed in advance. This was caused using an improper de-identification protocol or by some specific characteristics of some DICOM images. Other errors refer to not following the analysis requirements, such as the slice thickness being greater than the one expected for the specific imaging modality.
Specifically for the user experience evaluation, Figure 7 depicts the values for each pair for all 4 categories as they were formed in the 3 rounds of the questionnaire circulation. Each category is examined separately. In the first category, Attractiveness, 3 of the 4 aspects examined showed an increase in the second and third versions, indicating that the addition of the user interface made the tool more enjoyable, friendly, and pleasing. On the contrary, a decrease in the fourth aspect is noticed, indicating that the users do not find the tool good. In the second category, Perspicuity, the results indicate that with each version the tool becomes easier and more understandable, but it appears difficult to learn and not so clear. In the third category, Efficiency, it is reported that the tool becomes slow and less efficient in the new versions and less organized and practical. In the fourth category, Dependability, the tool has great votes on supportiveness, but it seems that the users do not consider it valuable or what they expected.
The final category focuses on the suggestions made by the users for improving the tool. The issues pointed out by the users were different during the three rounds of evaluation. In the first version the users asked for a “More human-readable and understandable output of the tool” as well as the tool to correct some of the simple errors. For the second version, when the user interface was introduced, and the user had to run each component separately, a suggestion was that the tool should run as a whole pipeline and not as different components. Another suggestion was to better describe each error to facilitate the user to identify and correct it. In the final round, the issues identified and needed improvement were the size of the docker image and the execution time of the tool.
The most common errors identified in each category are discussed in detail in the following sections.
Typical errors in clinical metadata. One of the most common errors noticed in the clinical metadata was that the date provided for a certain time point was not inside the initially agreed time range. This is acceptable since not all patients follow the same treatment schemas, so the follow-up examinations may not be in specified time periods. It was noticed that to be compliant with the rule, clinicians skipped one time point resulting in inconsistency of data provided. After noticing this, the team extended the ranges for the time points date to avoid this confusion in data insertion. Other common errors were that the content value ranges were not followed. For example, in a yes/no field, data should be inserted as numeric values 1/0. In some cases, the patient ID, which is produced by defining some parameters during the de-identification procedure, did not follow the initial convention, and these datasets should be re-de-identified to comply with the convention.
Typical integrity errors. With regards to the dataset integrity, many inconsistencies between the information inserted in the template and the imaging modalities were identified, mostly in cases where patient data included many time points and modalities in each time point. Regarding the imaging data itself, the most common error identified by the tool, both in the de-identification protocol check and in the analysis requirements check, was the absence of some fields in the DICOM headers, which were deleted prior to the de-identification, due to the various hospital policies. One major issue was also the placement of the segmentation/annotation file in the proper series.

4. Discussion

Building accurate and generalizable predictive models in cancer not only requires the availability of huge data but, most importantly, high-quality data. However, even in cases where a well-defined data-collection protocol is established, prospective data-collection processes, especially in multicentric studies, are prone to errors and inconsistencies. This problem is more apparent in retrospective studies, where data already collected via different protocols introduce further variability. Therefore, creating large repositories that can effectively be used for AI development necessitates a rigorous evaluation of data quality.
In this study, we propose a comprehensive three-step approach aimed at ensuring optimal data quality within a large-scale cancer-imaging repository. The methodology comprises establishing a conceptual model, forming quality rules, and developing a dedicated quality assessment tool. The steps of this methodology are summarized in (i) Data Quality Conceptual Model: We first develop a model that includes metrics essential for evaluating data quality. This model categorizes potential issues into six areas: consistency, accuracy, completeness, uniqueness, validity, and integrity. (ii) Quality Rules Development: A multistage process involving both clinical experts and AI developers is then employed to create well-defined data quality rules. These rules are designed to enhance both prospective and retrospective data collection and are crucial for AI developers in building models that address specific clinical challenges. The rules cover not only imaging data but also related clinical data, therefore adding context and increasing the value of the images. (iii) Data Integration Quality Check Tool (DIQCT): Finally, we developed DIQCT to facilitate data integration for four different cancer types. This tool assesses data against the established quality rules, provides guidance, and generates structured reports. It helps data providers address discrepancies promptly, ensuring seamless integration and enhancing the efficacy of cancer research efforts.
This work focuses on improving the data quality of the cancer-imaging repository, laying a foundation for developing robust AI methods. By addressing concrete and quantifiable criteria for data consistency, accuracy, completeness, uniqueness, validity, and integrity through a structured framework and quality assessment tool, we aim to mitigate common issues in cancer data repositories and support effective AI development in cancer research.
The DIQCT was adopted by the data-collection process of the INCISIVE project. The DIQCT was developed from scratch for the project’s purposes, and different releases of the tool were provided to the data providers during the distinct stages of data collection and evaluation. User feedback mechanisms played a crucial role in this improvement process, providing valuable insights for refining features, addressing main points, and ensuring the tool evolves in accordance with user expectations. Thus, the evaluation of the tool that was used during different rounds reflects improvements both in the tool’s functionality and the interface. The final tool, the DIQCT, has been successfully deployed and evaluated, proving useful in solving numerous problems and leading to valuable experience in the field.
Data errors over time and user learning. Apart from the prevention of insertion in the database of low-quality data, the quality tool also served as a training tool for the data providers. It was noticed that between each iteration of data preparation, most errors the tool was identifying were gradually reduced. This means that the data collectors learned to avoid some common mistakes and tried to comply better with the rules of data preparation. Moreover, it became clear that a more thorough training period was necessary prior to the data collection to avoid some of the aforementioned human-induced errors.
Referring to these errors, two options could be investigated. The first option, the one implemented in this work, reports the identified errors to the user, giving the user the opportunity to recheck the data and provide more accurate information in a human-controlled manner. This option can also serve as a user re-train methodology. The second option is the automated curation of the dataset. In some cases, where the errors are self-explained and simple to be identifiable by the tool, curation mechanisms can be applied to facilitate the dataset refinement. However, there are cases where the errors cannot be directly mapped to a correct value, or the errors refer to structural issues. In these cases, automated curation cannot be applied, and the user’s involvement is necessary for the data correction. Moreover, in this option, and referring to the clinical data, the rules for automated correction must be very strict as, for example, an extreme value may be of clinical relevance and not an actual out-of-range insertion.
Communication with the user, Reporting, and Automation. After each round of version release and evaluation of the tool, the development team adjusted the tool based on the feedback from the users. These adjustments included a clearer error reporting presentation with more detailed explanations and visual summaries of the results. User feedback mechanisms play a crucial role in this improvement process, providing valuable insights for refining features, addressing pain points, and ensuring the tool evolves in accordance with user expectations.
User Experience. Finally, during the evaluation process, according to user feedback, the tool became more complex and less efficient in terms of speed. This observation could be attributed to the addition of numerous rules and functionalities, resulting in the incorporation of more components with each version, which, in turn, led to user dissatisfaction. Some partners suggested exploring a more automated approach, where the tool operates as a seamless pipeline rather than disparate components. To address the observed complexities and user frustrations, leveraging the existing tool could involve implementing a structured user training program, provision of more detailed user tutorials, or organizing hands-on workshops and interactive sessions aimed at familiarizing users with the tool’s functionalities and workflows. By adopting such approaches, participants would gain proficiency in navigating the tool, interpreting results, and troubleshooting common issues.
As mentioned above, the tool offers guidance on error identification during data collection but refrains from automatically correcting them. This intentional decision stems from the principle that the data provider bears sole responsibility for the accuracy and integrity of the data, with any automated corrections deemed unacceptable. However, recognizing that this approach may contribute to user dissatisfaction, we aim to enhance the reporting of results in future versions and offer more comprehensive guidance on potential corrective actions.
During this work, several significant challenges were encountered, with the most critical being the completion of the data integration procedure. In the presented use-case, this procedure involved achieving data homogenization across datasets originating from five different countries and nine data providers and prepared by many more data collectors. Reaching a consensus on the standardization of all variables and data entries in such a diverse and complex context proved to be a challenging task. Nevertheless, through applying an iterative procedure, a consensus was achieved, resulting in the development of a unified data schema accepted by all contributing data collectors. Another critical challenge was the compliance of data collectors to the rules and requirements, as discussed above, but using the DIQCT, users seemed to grow used to the specific value ranges and gradually comply with the data schema.
A notable limitation of the work presented in this article is that it was specifically designed and implemented for a particular use-case—the INCISIVE project. Within this context, the resulting data schema and requirements are constrained by the design of the clinical study conducted as part of the project. Consequently, the entire methodology—data integration, quality conceptual model, and the Data Integration and Quality Control Tool (DIQCT)—is deployed for specific clinical data, imaging modalities, and cancer types. However, this methodology is flexible and can be readily adapted to other data schemas, including different clinical variables, imaging modalities, or cancer types, by appropriately adjusting the rules.
The area of data quality checking for medical and not only data presents a scarcity of robust tools that can ensure the reliability and accuracy of patient information. Although various methodologies and control products have been proposed, they sporadically address the issue of data quality. There are limited efforts in the area that focus on the quality assessment of clinical data [17,18,19], while the newest attempt focuses on both quality assessment and data curation [23,24]. Others focus on only imaging data cleaning [25,26]. Recognizing and aiming to fill these gaps, we have developed a novel, holistic data quality approach that goes beyond existing methodologies. Our methodology performs a comprehensive check on a complete dataset that comprises clinical and imaging data, both separately and in an integrated manner, by also checking the consistency between the distinct types of data. This unified methodology not only supports the creation of big cancer data repositories but also facilitates decentralized solutions as it can be applied in distributed repositories or datasets. This way, the utility and reliability of medical data are significantly enhanced. By addressing both clinical and imaging data cohesively, our work represents a significant advancement in the field, offering a more robust and complete solution to the challenge of ensuring data quality in medical repositories.

5. Future Work

Regarding the continuation of this work, the tool is being constantly updated with new components addressing the needs that arise using the tool and the expansion of the repository. Moreover, a major effort is given to the optimization of the tool to improve its efficiency and execution time. By introducing modular architecture and flexible configurations, as well as a knowledge base, the tool will allow users to customize it according to specific requirements, promoting adaptability to diverse workflows and use cases. Some parts can benefit from AI-based detection of problems, which is also a direction for extension and improvement.
An adaptation of the tool has also been developed, in which the quality dimensions are measured in the repository, providing a comprehensive view of the quality level of the data for each dimension regarding the clinical and imaging data. At the moment, a generic way of concretely characterizing the dataset quality and reliability was proposed, with a small expansion focusing on analysis requirements. The functionality mostly addresses the needs of data providers to improve their data. As a future step, a comprehensive scoring will be created, combining the measurement results of all metrics to help data users decide on the use of a dataset. In addition, there are plans to introduce an additional component that will check in more detail the suitability of the dataset for specific analytical tasks. This component will evaluate the dataset against specific criteria designed to ensure it meets the precise requirements necessary for addressing clinical questions in medical diagnosis and prognosis model development.
Moreover, the tool is planned to incorporate some minor curation actions where it is feasible and not threatening to the data validity. Finally, the tool is currently being deployed with some adaptations in EUCAIM, an EU-funded project, federated repository.

6. Conclusions

The methodology presented in this article for data homogenization aims to ensure that the data available in a centralized or federated repository share the same principles and follow the requirements set during the study protocol definition. The integration of data coming from multiple centers is a great challenge and a big necessity for creating a repository that will facilitate the work of AI developers and produce reliable outcomes. Through this procedure, it was noticed that the human-induced errors in the datasets decreased, resulting in a higher-than-expected quality repository.

Author Contributions

Conceptualization, I.C., D.T.F. (Dimitrios T. Filos), A.K. and O.T.; methodology, I.C., D.T.F. (Dimitrios T. Filos), A.K. and O.T.; software, I.C., D.T.F. (Dimitrios T. Filos), A.K. and D.T.F. (Dimitris Th. Fotopoulos); validation, A.K.; writing—original draft preparation, A.K.; writing—review and editing, D.T.F. (Dimitrios T. Filos), O.T., D.T.F. (Dimitris Th. Fotopoulos) and I.C.; visualization, A.K.; supervision, I.C.; project administration, I.C.; funding acquisition, I.C. All authors have read and agreed to the published version of the manuscript.

Funding

This research was funded by INCISIVE, grant number 952179, and EUCAIM, grant number 101100633.

Institutional Review Board Statement

In this study, there are two kinds of human data used. Regarding the patient data used for testing and evaluation of the tool, the study did not require ethical approval. However, data used for this part of the study are part of the INCISIVE repository. The INCISIVE consortium has committed to conducting all research activities within the project in compliance with ethical principles and applicable international, EU, and national laws. All relevant ethical approval actions were acquired in advance before conducting relevant research activities within the project and are available upon request. The second type of data is the data collected during the questionnaire circulation, and since it is completely anonymous, no ethical approval was required.

Informed Consent Statement

Informed consent was obtained from all subjects involved in the study, referring to the patient data used for testing and evaluation of the tool. Referring to the questionnaire data, participants had to consent to the process of the submitted data (no personal information) prior to the study submission.

Data Availability Statement

Data used to support this research is part of the INCISIVE repository and can be accessed after application in the INCISIVE Data Sharing portal (https://share.incisive-project.eu/, accessed on 27 August 2024) and approved by the Data Access Committee.

Acknowledgments

We thank the 9 Data Providers participating in the INCISIVE project for participating in the validation and evaluation process: Aristotle University of Thessaloniki, University of Novisad, Visaris D.O.O, University of Naples Federico II, Hellenic Cancer Society, University of Rome Tor Vergata, University of Athens, Consorci Institut D’Investigacions Biomediques August Pi i Sunyer, Linac Pet-scan Onco limited.

Conflicts of Interest

The authors declare no conflicts of interest.

References

  1. Kocarnik, J.M.; Compton, K.; Dean, F.E.; Fu, W.; Gaw, B.L.; Harvey, J.D.; Henrikson, H.J.; Lu, D.; Pennini, A.; Xu, R.; et al. Cancer Incidence, Mortality, Years of Life Lost, Years Lived with Disability, and Disability-Adjusted Life Years for 29 Cancer Groups From 2010 to 2019 A Systematic Analysis for the Global Burden of Disease Study 2019. JAMA Oncol. 2022, 8, 420–444. [Google Scholar] [CrossRef]
  2. Ferlay, J.; Colombet, M.; Soerjomataram, I.; Parkin, D.M.; Piñeros, M.; Znaor, A.; Bray, F. Cancer statistics for the year 2020: An overview. Int. J. Cancer 2021, 149, 778–789. [Google Scholar] [CrossRef] [PubMed]
  3. Saslow, D.; Boetes, C.; Burke, W.; Harms, S.; Leach, M.O.; Lehman, C.D.; Morris, E.; Pisano, E.; Schnall, M.; Sener, S.; et al. American Cancer Society Guidelines for Breast Screening with MRI as an Adjunct to Mammography. CA Cancer J. Clin. 2007, 57, 75–89. [Google Scholar] [CrossRef] [PubMed]
  4. Wang, L.; Lu, B.; He, M.; Wang, Y.; Wang, Z.; Du, L. Prostate Cancer Incidence and Mortality: Global Status and Temporal Trends in 89 Countries From 2000 to 2019. Front. Public Health 2022, 10, 811044. [Google Scholar] [CrossRef] [PubMed]
  5. Siegel, R.L.; Miller, K.D.; Sauer, A.G.; Fedewa, S.A.; Butterly, L.F.; Anderson, J.C.; Cercek, A.; Smith, R.A.; Jemal, A. Colorectal cancer statistics, 2020. CA Cancer J. Clin. 2020, 70, 145–164. [Google Scholar] [CrossRef] [PubMed]
  6. Aberle, D.R.; Black, W.C.; Chiles, C.; Church, T.R.; Gareen, I.F.; Gierada, D.S.; Mahon, I.; Miller, E.A.; Pinsky, P.F.; Sicks, J.D. Lung Cancer Incidence and Mortality with Extended Follow-up in the National Lung Screening Trial. J. Thorac. Oncol. 2019, 14, 1732–1742. [Google Scholar] [CrossRef]
  7. Bhinder, B.; Gilvary, C.; Madhukar, N.S.; Elemento, O. Artifi Cial intelligence in cancer research and precision medicine. Cancer Discov. 2021, 11, 900–915. [Google Scholar] [CrossRef]
  8. Bizzo, B.C.; Almeida, R.R.; Michalski, M.H.; Alkasab, T.K. Artificial Intelligence and Clinical Decision Support for Radiologists and Referring Providers. J. Am. Coll. Radiol. 2019, 16, 1351–1356. [Google Scholar] [CrossRef]
  9. Yin, J.; Ngiam, K.Y.; Teo, H.H. Role of Artificial Intelligence Applications in Real-Life Clinical Practice: Systematic Review. J. Med. Internet Res. 2021, 23, e25759. [Google Scholar] [CrossRef]
  10. Martinez-Millana, A.; Saez-Saez, A.; Tornero-Costa, R.; Azzopardi-Muscat, N.; Traver, V.; Novillo-Ortiz, D. Artificial intelligence and its impact on the domains of universal health coverage, health emergencies and health promotion: An overview of systematic reviews. Int. J. Med. Inform. 2022, 166, 104855. [Google Scholar] [CrossRef]
  11. Gillies, R.J.; Schabath, M.B. Radiomics improves cancer screening and early detection. Cancer Epidemiol. Biomark. Prev. 2020, 29, 2556–2567. [Google Scholar] [CrossRef] [PubMed]
  12. Chen, Z.H.; Lin, L.; Wu, C.F.; Li, C.F.; Xu, R.H.; Sun, Y. Artificial intelligence for assisting cancer diagnosis and treatment in the era of precision medicine. Cancer Commun. 2021, 41, 1100–1115. [Google Scholar] [CrossRef] [PubMed]
  13. Liu, M.; Wu, J.; Wang, N.; Zhang, X.; Bai, Y.; Guo, J.; Zhang, L.; Liu, S.; Tao, K. The value of artificial intelligence in the diagnosis of lung cancer: A systematic review and meta-analysis. PLoS ONE 2023, 18, e0273445. [Google Scholar] [CrossRef] [PubMed]
  14. Spadaccini, M.; Troya, J.; Khalaf, K.; Facciorusso, A.; Maselli, R.; Hann, A.; Repici, A. Artificial Intelligence-assisted colonoscopy and colorectal cancer screening: Where are we going? Dig. Liver Dis. 2024, 56, 1148–1155. [Google Scholar] [CrossRef] [PubMed]
  15. Yuan, J.; Hu, Z.; Mahal, B.A.; Zhao, S.D.; Kensler, K.H.; Pi, J.; Hu, X.; Zhang, Y.; Wang, Y.; Jiang, J.; et al. Integrated Analysis of Genetic Ancestry and Genomic Alterations across Cancers. Cancer Cell. 2018, 34, 549–560.e9. [Google Scholar] [CrossRef]
  16. Carle, F.; Di Minco, L.; Skrami, E.; Gesuita, R.; Palmieri, L.; Giampaoli, S.; Corrao, G. Quality assessment of healthcare databases. Epidemiol. Biostat. Public Health 2017, 14, 1–11. [Google Scholar] [CrossRef]
  17. Kahn, M.G.; Callahan, T.J.; Barnard, J.; Bauck, A.E.; Brown, J.; Davidson, B.N.; Estiri, H.; Goerg, C.; Holve, E.; Johnson, S.G.; et al. A Harmonized Data Quality Assessment Terminology and Framework for the Secondary Use of Electronic Health Record Data. eGEMs 2016, 4, 18. [Google Scholar] [CrossRef]
  18. Kim, K.-H.; Choi, W.; Ko, S.-J.; Chang, D.-J.; Chung, Y.-W.; Chang, S.-H.; Kim, J.-K.; Kim, D.-J.; Choi, I.-Y. Multi-center healthcare data quality measurement model and assessment using omop cdm. Appl. Sci. 2021, 11, 9188. [Google Scholar] [CrossRef]
  19. Huser, V.; DeFalco, F.J.; Schuemie, M.; Ryan, P.B.; Shang, N.; Velez, M.; Park, R.W.; Boyce, R.D.; Duke, J.; Khare, R.; et al. Multisite Evaluation of a Data Quality Tool for Patient-Level Clinical Datasets. eGEMs 2016, 4, 24. [Google Scholar] [CrossRef]
  20. Kosvyra, A.; Filos, D.; Fotopoulos, D.; Tsave, T.; Chouvarda, I. Towards Data Integration for AI in Cancer Research. In Proceedings of the 2021 43rd Annual International Conference of the IEEE Engineering in Medicine & Biology Society (EMBC), Mexico, 1–5 November 2021; pp. 2054–2057. [Google Scholar] [CrossRef]
  21. Kosvyra, A.; Filos, D.; Fotopoulos, D.; Tsave, O.; Chouvarda, I. Data Quality Check in Cancer Imaging Research: Deploying and Evaluating the DIQCT Tool. In Proceedings of the Annual International Conference of the IEEE Engineering in Medicine and Biology Society, EMBC, Scotland, UK, 11–15 July 2022; Institute of Electrical and Electronics Engineers Inc.: Piscataway, NJ, USA, 2022; pp. 1053–1057. [Google Scholar] [CrossRef]
  22. Laugwitz, B.; Held, T.; Schrepp, M. LNCS 5298—Construction and Evaluation of a User Experience Questionnaire; Springer: Berlin/Heidelberg, Germany, 2008; Volume 5298. [Google Scholar]
  23. Pezoulas, V.C.; Kourou, K.D.; Kalatzis, F.; Exarchos, T.P.; Venetsanopoulou, A.; Zampeli, E.; Gandolfo, S.; Skopouli, F.; De Vita, S.; Tzioufas, A.G.; et al. Medical data quality assessment: On the development of an automated framework for medical data curation. Comput. Biol. Med. 2019, 107, 270–283. [Google Scholar] [CrossRef]
  24. Wada, S.; Tsuda, S.; Abe, M.; Nakazawa, T.; Urushihara, H. A quality management system aiming to ensure regulatory-grade data quality in a glaucoma registry. PLoS ONE 2023, 18, e0286669. [Google Scholar] [CrossRef] [PubMed]
  25. Zaridis, D.I.; Mylona, E.; Tachos, N.; Pezoulas, V.C.; Grigoriadis, G.; Tsiknakis, N.; Marias, K.; Tsiknakis, M.; Fotiadis, D.I. Region-adaptive magnetic resonance image enhancement for improving CNN-based segmentation of the prostate and prostatic zones. Sci. Rep. 2023, 13, 714. [Google Scholar] [CrossRef] [PubMed]
  26. Dovrou, A.; Nikiforaki, K.; Zaridis, D.; Manikis, G.C.; Mylona, E.; Tachos, N.; Tsiknakis, M.; Fotiadis, D.I.; Marias, K. A segmentation-based method improving the performance of N4 bias field correction on T2weighted MR imaging data of the prostate. Magn. Reson. Imaging 2023, 101, 1–12. [Google Scholar] [CrossRef] [PubMed]
Figure 1. The Overall Methodology for ensuring data quality.
Information 15 00533 g001
Figure 2. The Data Integration workflow.
Information 15 00533 g002
Figure 3. The Clinical Metadata Collection Structure.
Information 15 00533 g003
Figure 4. The DIQCT workflow, including the multiple dimensions examined for the clinical and imaging data.
Information 15 00533 g004
Figure 5. Error Report of the Case Completeness component in the user interface. Information on the percentage of present mandatory fields is depicted on the right side of the report.
Information 15 00533 g005
Figure 6. Error Report of the DICOM De-identification protocol check component in the user interface.
Information 15 00533 g006
Figure 7. User Experience evaluation of the tool.
Information 15 00533 g007
Table 1. Rules for data quality.
RuleNameBrief Description
1Naming Conventions(a) PatientId: XXX-YYYYYY (b) Imaging Examinations: PatientId_Modality_timepoint
2TimepointsDefinition of 4 Time points: Baseline, After 1st Treatment, 1st and 2nd Follow-Up and their period
3Structure(a) Clinical Metadata—Template, (b) Folder Structure
4Value Ranges(a)Allowable Type, (b) Actual Value Range
5Mandatory fieldsDefinition of the minimum fields that should be present in the template
6DICOM ValidationAttributes Verification, Encoding Validation, Value Representation and Multiplicity Check, Attributes Consistency
7De-identification protocolDefinition of the de-identification profile
8Expected imaging modalitiesDefinition of the list of imaging modalities per cancer type
9Analysis requirementsDefinition of the expected values that each imaging modality should have to be used for analysis
10Annotation mismatch(a) the number of DICOM images is the same as the number of slices in the annotation file, (b) The number of rows and the number of columns for both the annotation file and the images are identical
Table 2. General Information of the evaluation survey participants.
No of ParticipantsClinical ExpertsTechnical ExpertsWindowsLinuxMac
Round 1936711
Round 26425-1
Round 3743511
Disclaimer/Publisher’s Note: The statements, opinions and data contained in all publications are solely those of the individual author(s) and contributor(s) and not of MDPI and/or the editor(s). MDPI and/or the editor(s) disclaim responsibility for any injury to people or property resulting from any ideas, methods, instructions or products referred to in the content.

