Abstract
Statistics modules are included in most university degrees, independent of the degree area, and this means that many students face these modules underprepared and struggle because of a lack of statistics knowledge. The Maths Support Centre (MSC) in the University College Dublin (UCD) provides support for various mathematics-related subjects, with statistics students being the second-largest cohort of visitors. The overall goal of this paper is to identify the common statistical issues students face during the transition from secondary education to tertiary education. The main data set for this study is the data from UCD students who have accessed the UCD MSC since 2015/16 for statistics support; the categorization of statistical concepts has been made with the statistics module description for each statistics subject at the Universidad Rey Juan Carlos (URJC). First, we conducted a categorization of statistical concepts taught in university (based on URJC’s catergorization); after that, UCD MSC tutor comments were categorized and validated, and subsequently descriptive analyses and text mining were used on the UCD MSC comments to achieve a deeper understanding of the statistical issues. The statistical issues presented were categorized as descriptive statistics (22.8%), probability (44%), statistical inference (29.2%), and statistical software (4%). Students struggled with material that was introduced at university level rather than material seen at secondary level. Our findings on students’ main statistical issues contribute to the development of a suite of evidence-based educational applications and games to support undergraduate students internationally in first- and second-year statistical modules.
1. Introduction
The development of an information society, the growth of technology, and the need to face, interpretate, and analyze information from different sources makes the knowledge of statistics essential in making and communicating decisions, both in private life and professionally [1]. This knowledge of statistics, which may be referred to as the concept of “statistical literacy”, refers to the minimum statistics knowledge required to understand the world [1]. One of the pillars of acquiring “statistical literacy” is education, and therefore, statistics as a subject is present in the majority of university degrees, independent of the degree area or discipline. Based on one of the main goals of third-level education, which is to prepare individuals to be able to face the real world, statistical education should focus, in the first instance, on enriching students’ base of statistical knowledge, and should continue promoting its growth through reasoning and statistical thinking and then converting that competence into knowledge that can be put into practice in real-life situations [2]. An educator may improve the effectiveness of the teaching-learning process by adapting the content and material used in the classroom. In this context, the negative attitude of the student facing statistics and the adaption of the teaching-learning process require the identification of what are the main statistical issues faced by students, e.g., basic concepts, statistics formulas, probability, hypothesis testing, etc.
In this study, in order to identify students’ statistical issues, a sustainable approach is taken whereby data are drawn from two international universities (University College Dublin (UCD) in Ireland and University Rey Juan Carlos (URJC) from Spain). These universities involve differences in cultures, in the ways of facing education, and in general, different points of view related to statistics and university education. UCD is one of Europe’s leading research-intensive universities where undergraduate education, master’s and PhD training, research, innovation, and community engagement form a dynamic spectrum of activity. UCD is also Ireland’s most globally engaged university, with over 38,000 students drawn from 152 countries, including over 5000 students based at locations outside of Ireland. The UCD data are sourced from the UCD Maths Support Centre (MSC). This opened in 2004 and is a free tutoring support service for all UCD students studying a mathematics- or statistics-related modules. University Rey Juan Carlos (URJC) is the second-biggest public university in the community of Madrid. It offers a wide range of degrees including 88 bachelor’s degrees, 9 English degrees, 9 online bachelor’s degrees, and 75 dual degrees, as well as a wide range of official master’s degrees and PhD programs. Bachelor’s degrees are organized in five knowledge areas (Social Sciences and Law, Sciences, Health Sciences, Engineering and Architecture, and Art and Humanities), with statistics modules present across the five areas. Ottaviani [3] suggests that statistics research cannot be carried out in isolation and interdisciplinary work needs to be applied, with this being even more beneficial if it is cross border and creates international community.
To identify the statistical topics taught in the entry levels of university, and for international appeal, in this study we analyze the statistical topics taught across the URJC curriculum and create URJC categories of statistical concepts. In order to identify what are the main statistics problems for students in the transition between secondary-level and third-level education, we have collected, used, and analyzed data from the students who have visited the UCD MSC—a free tutoring service for UCD students. When a tutor finishes a session with a student, the tutor records the main statistical topics taught from a drop-down menu (UCD MSC categories of statistics concepts), and they also record an open-text comment on the issues/areas that the student struggled with. This categorization process in the UCD Maths Support is a manual activity completed by tutors. The categorization for statistical issues has not been validated before, and therefore, it could have errors. For example, tutors may not have enough information about the student problem to identify the category, categories are subjective as tutors may consider different categories for the same student issue, and tutors may be under time pressure and select a random category. Also, there is a standard category called Other and it may be used in cases where the tutor does not know what category to assign the issue to. We manually categorized the open-text comments according to the defined URJC categories and then conducted a comment-specific evaluation of the statistical challenges to determine which issues are common across the two universities (UCD and URJC). Additionally, we have applied text mining to the open-ended tutor comments to identify the statistical topics that students struggle with. Building on this study, we plan to develop a suite of sustainable educational applications and games to support undergraduate students in first- and second-year statistical modules. This analysis will contribute to the cultivation of lasting statistical literacy among students. Combining the structure of the MSC data and the URJC categories, we address the following research questions:
- (1)
- What are the recurring statistical issues posing challenges to students?
- (2)
- What are the similarities between the UCD MSC categories and the URJC categories?
- (3)
- How can text mining extract insights from open-text responses to uncover specific statistical difficulties?
2. Literature Review
2.1. Statistics Education Research
It has been identified that statistics is poorly taught in formal education [4]. Some of the problems detected are as follows: the basic statistical concepts are not understood; the integration of statistics as a subject in school has not yet occurred (in certain countries); in order to go through statistic inference, teachers may need to speed up previous explanations; and students have a short and restricted time to assimilate the concepts [5]. Other issues highlighted by research include the fact that statistical concepts are treated in isolation without considering the relationship that must be established between them or the relationship of the statistics concepts with those of other subjects. This manifests itself as situations in the classroom that may not sufficiently relate to the professional profile of the students or are not related to real-life experiences [6,7,8].
The lack of accurate knowledge in statistics by students of Social Sciences, Sciences of Behavior or Education, among others, is a recurring topic that has been faced by lecturers and researchers for at least thirty years [2]. Additionally, not only are there theorical issues, but there are also negative emotional reactions, attitudes, and beliefs that have been reported towards statistics by some students with little interest in the area [9]. Behar and Grima [10] stated that, when talking about the problems in teaching statistics, the following should be considered: high levels of anxiety in students who face this subject; negative attitudes towards it; the content of the course (excessively focused on probability and mathematics); the lack of motivation in students; frustration by some teachers for not seeing results from their efforts; and the influence of technology on the teaching methods. Subsequently, statistics teaching has become a broad field of research and development [11]. Furthermore, Estrella [12] states that this emerging field provides results on how statistics can be taught in the school classrooms and this can be extended to higher levels such as university in order to promote functional, deep, and sustainable learning.
Most studies, which analyze students’ difficulties with statistical concepts, focus on examining a single area of interest. For example, histograms are highly effective at displaying data distributions, particularly in showing the shape of the distribution and identifying any outliers. They are commonly found in introductory statistics textbooks, research methods guide, and even in popular media. However, students frequently struggle to interpret the information that histograms provide. Kaplan et al. [13] identify and examine four common misconceptions that students have about histograms; those are the differences between bar charts and histograms, the confusion between horizontal and vertical axes, flatter histograms showing less variability, and when time components are introduced into the histograms. Another example is Bayesian methods. These are rising in popularity and expanding on the teaching and learning of statistics. However, the statistics education literature shows that Bayesian concepts are mainly offered in statistics departments [14,15,16,17] rather than broader STEM programs because Bayesian methods have many prerequisites [18] and they require students to understand a number of mathematics concepts which can cause difficulties.
Two studies [19,20] examined students’ difficulties in mathematics and statistics more generally, both analyzing MSC data using text mining. Intepe and Shearman [19], who analyzed MSC data from Western Sydney University in Australia, examined statistical concepts more broadly. To achieve this, they looked at three groups of students (first-year, non-first year, and Other). First-year and non-first year were both composed of queries from students enrolled in the three introductory statistics subjects (Statistics for Business, Statistical Decision Making, and Biometry). However, non-first year included students who took these modules after first year or who repeated these modules. The Other category consisted of queries which came from any other statistics subject, regardless of the year of study. Taking this classification into account, they presented the results for each category, and they concluded that the problems presented by students cover a wide range of statistics topics (from basic statistics to statistics used in research papers). They used several techniques to identify key topics related to the queries of the students, and concluded that the main topics across all statistics subjects are standard deviation calculation, the use of statistical tables, hypothesis testing, and calculator and computer use. In addition, they [19], p. 162 found that “while first-year students are mostly concerned with applying a technique and using the formulation of the method, students who study statistics in the later years are more focused on understanding the method and interpreting the results”.
2.2. Text Mining in Education Research
Data mining and text mining are popular methods across various fields, with their potential as research tools appearing boundless and valuable for numerous domains. Data mining has been applied in educational research, largely due to the growing amount of data produced using teaching tools and learning environments that enhance student learning. In the educational domain, text mining is mainly focused on analyzing the information of educational resources [21], developing the research area of Educational Text Mining (ETM) [22,23]. Text mining methods used in the educational domain include text classification, natural language processing (NLP), information retrieval, text clustering, and text summarization [24]. NLP allows the manipulation of natural language text or speech [25]. Following from NLL and text mining, visualization techniques such as word clouds use word frequencies in the document to discover themes in the data [26]. In the education technology field, the three most popular applications of text mining are as follows: evaluation (27%), student support (13%), and analytics (13%). They are followed by question/content generation, user feedback, and recommendation systems, and the main text mining techniques are text classification and natural language processing [24].
Text mining can be used to investigate the statistics topics that students struggle the most with and to identify problematic topics in statistics [19,20]. Intepe and Shearman [19] used four different methods to interpret the topics: word clouds for representing word frequencies, bigrams for showing tendencies of the words in the same document, topic modeling for discovering topics from a collection of documents, and hierarchical clustering for grouping similar objects into clusters. Similarly, Cronin et al. [20] analyzed data collected from two mathematics support centers at universities in Australia and Ireland with the goal of identifying and comparing mathematical difficulties for students. They also decided to use topic modeling and clustering algorithms to uncover key themes in the data. Following on from the literature, text mining has been suggested to improve our analyses on the UCD MSC comments to achieve a deeper understanding of the statistical issues.
3. Materials and Methods
In this section, we go through the methodology used to develop the URJC categories, explain how the UCD MSC works and how its data are collected, how the MSC tutor comments were classified under the URJC categories, and the techniques applied to analyze the UCD MSC data.
3.1. Methodology for Categorization of URJC Modules
With the goal of the categorization of statistical issues, before working with the UCD Maths Support Centre data, every statistics module description webpage for every degree taught in the URJC was collected and reviewed. Next, the statistics concepts were extracted and analyzed in order to create the URJC categories of statistical issues. Our methodology to create the categories is composed of the following steps:
- Access the URJC website and identified every School:
- a.
- Social Sciences and Law;
- b.
- Sciences;
- c.
- Health Sciences;
- d.
- Engineering and Architecture;
- e.
- Art and Humanities.
- Identify every degree inside every School in which a statistics module is taught.
- Download every module webpage for every statistics module and identify the statistical Lessons for each module.
- Summarize, compare, and match the statistical Lessons across the modules.
- Check what Lessons were consistent across different modules and identify the main Lessons that statistics covers.
- Create a description for each Lesson.
From this review process, we define three Topics and five Lessons (see Table 1). These will be referred to as the URJC categories and represent the main categorization used in this study.

Table 1.
Topics, Lessons, and descriptions of the original URJC categories.
3.2. Description of UCD MSC Data
The main data set for this study is the data from UCD students who have accessed the UCD MSC since semester 2 2015/16 for statistics support and have consented for their data to be used for research purposes. The ethics application was approved by the UCD Office of Research Ethics. Between February 2015 and September 2023, there was approximately 32,000 visits to the MSC. The MSC provides support for various mathematics-related subjects (e.g., mathematics, applied and computational mathematics, physics, and economics), and statistics students are the second largest cohort of visitors.
The UCD MSC uses a session management system to electronically record details of a student’s visit to the MSC, for example, the date of visit and module code that the student is visiting in reference to. Using the system, each MSC tutor can categorize the student’s presenting issue from a drop-down list and record an open-text response for the session. In the open-text response, tutors are asked to identify the mathematical problem the student requested help with and describe how they helped the student. In addition, since COVID-19, students have been able to provide an open-text response describing the issue they are requesting help with when booking a MSC session (if they choose to book an appointment rather than drop into the MSC without booking). The following video link shows how the UCD MSC system works and how a student takes part in it: https://www.youtube.com/watch?v=pbswG50OuCs (accessed on 15 July 2024).
For each MSC visit for statistics support, the following data were provided (see Table 2 for examples):
Table 2.
Sample of UCD MSC data.
- (1)
- Code: the module code that the student sought help for;
- (2)
- Name and Description: the presenting issue as categorized by the tutor for the session;
- (3)
- Time: time stamp of student’s entry to the MSC;
- (4)
- Comment: the tutor’s open-text response outlining the statistical issue that the student needed help with and how they helped the student, or, in some cases, it could also include an open-text response by the student describing the statistical issue they are requesting help with. Students’ comments are indicated by quotation marks, for example, Student Query: “sampling distributions”.
3.3. Classification of Tutor Comments in the UCD MSC Data
The data for the UCD MSC consisted of 3570 data entries collected from student visits to the MSC from February 2015 to September 2023. A key feature of the data is the tutors’ comments (see Comment variable in Table 2) because these provide a rich source of information on statistical issues. As Topics and Lessons were already defined, the next step was to match the tutor comments with the Lessons. This was a manual process which started with a sample of 49 unique comments for which the first author and second author separately analyzed according to the URJC categories. After that, the categorization between the authors was cross-tabulated in order to validate it. There was a high percentage of similarities in the comparison, with the same result in 48 out of 49 comments in total (an agreement of 98%). Disagreements were discussed and classifications agreed upon. Subsequently, the first author and second author continued doing the manual coding, with the first author manually coding the majority of cases. As the coding of the comments progressed, and through discussions between the authors, it became clear that additional Topics and Lessons beyond the initial five Lessons were needed. Therefore, more Lessons were added. The first new category was “High Level”; this was added because of comments related to topics which were not considered related to introductory or service level statistics. The second new Lesson related to Statistics Software problems because there were many students with problems in software. Last but not least was a new category called Other. This was for students whose problems were not related to statistics or there was not enough information to determine Lesson categorization. The categorization of the comments was examined a second time by the first author to ensure consistency.
Once the initial categorization of the UCD MSC tutors’ comments based on the URJC classification was completed, several issues were identified. Students whose comments matched with two or more Lessons (n = 73) were split into as many Lessons as they had matched. This strategy is based on the main goal of the paper: to identify the statistical issues that students present with as opposed to the number of students visits with statistical issues. An important consideration here is that the data set does not include any identifying features, i.e., the student name and number, and students can go into the UCD MSC once, twice, or many more times. As a result, the same student could have multiple entries in the data set, so we consider data entries (visits) instead of the number of students. The strategy mentioned above converted n = 3570 data entries to n = 3674 (n being the number of statistical issues).
Another preprocessing task was to add two new categories:
- Module II for those students who have issues in Lesson 3 and Lesson 4.
- Module I, Module II, and Module III for those students who have issues in all Lessons.
The final URJC categorization is shown in Table 3.
Table 3.
Final Topics, Lessons and descriptions of the URJC categories.
3.4. Statistical Analysis
Once data were collected and the Lessons were defined, the next step was to identify statistical issues or topics that students struggle with. With that goal in mind, data analyses were composed of several data treatments: data wrangling, descriptive analytics, and text mining. RQ1 and RQ2 were addressed using data wrangling, descriptive statistics, and graphical analysis. To achieve this, the R 2024.04.2 ggplot2 package [27] and the R tidyverse package [28] were used. RQ3 was addressed through analyzing the open-response text comments using Natural Language Processing (NLP). Within NPL, word clouds are a method to quickly show visualizations of the most common terms based on the frequency of their appearance in the text [26]. Before implementing word clouds, it was necessary to conduct text cleaning and preprocessing. This consisted of using the tm package in R [29] to remove prepositions, special characters, numbers, whitespace, convert all the words to lowercase, remove punctuation, and remove words that do not give value to this analysis (empty words). The final step before creating the word clouds was to convert the text into a document-feature matrix, which allowed us to calculate the frequencies of any word in the text.
4. Results
4.1. RQ1: Lesson Data Descriptive Analysis
After the data preprocessing, the next step is to respond to the first research question (RQ1) concerning what Lessons students are struggling with. To achieve this, we conducted an analysis of the Lesson categories to identify the recurring statistical themes that pose challenges to students. By applying descriptive statistics to the frequency of these categories, we determined which Lessons present the most difficulties for students (see Table 4).
Table 4.
Frequency of Lessons.
Table 4 shows that the largest number of issues are concentrated in Lesson 5: Statistics Inference (n = 709) and Lesson 4: Random Variables (n = 609), and the lowest number of issues are in Lesson 6: Statistics Software (n = 96). Following the sequential ordering of the Lessons, we can see that the difficulty level goes from the basic to the more advanced level (or complex). In this analysis, the difference between Lesson 1 to Lesson 2 to Lesson 3 does not present as big jumps between each other, but the transition between Lesson 3 to Lesson 4 presents the biggest difference (n = 254). Interestingly, as the level increases, the jumps between the Lessons also increase. It is important to consider the numbers of students with issues in Lesson 3 and 4; all of them face problems in Topic II: Probability. If we include them in Lesson 3 and Lesson 4, we increase the number of issues from n = 355 to n = 459 in Lesson 3 and from n = 609 to n = 713 in Lesson 4. In this case, this means a big jump in the number of statistical issues from Lesson 2 to Lesson 3 as well, and also, Lesson 4 becomes the main challenge for students. Lesson 6 can be viewed as a subset of the rest of the Lessons because statistics software can be used to implement the statistical methods in any Lesson, so Lesson 6 is not directly related to a level of difficulty.
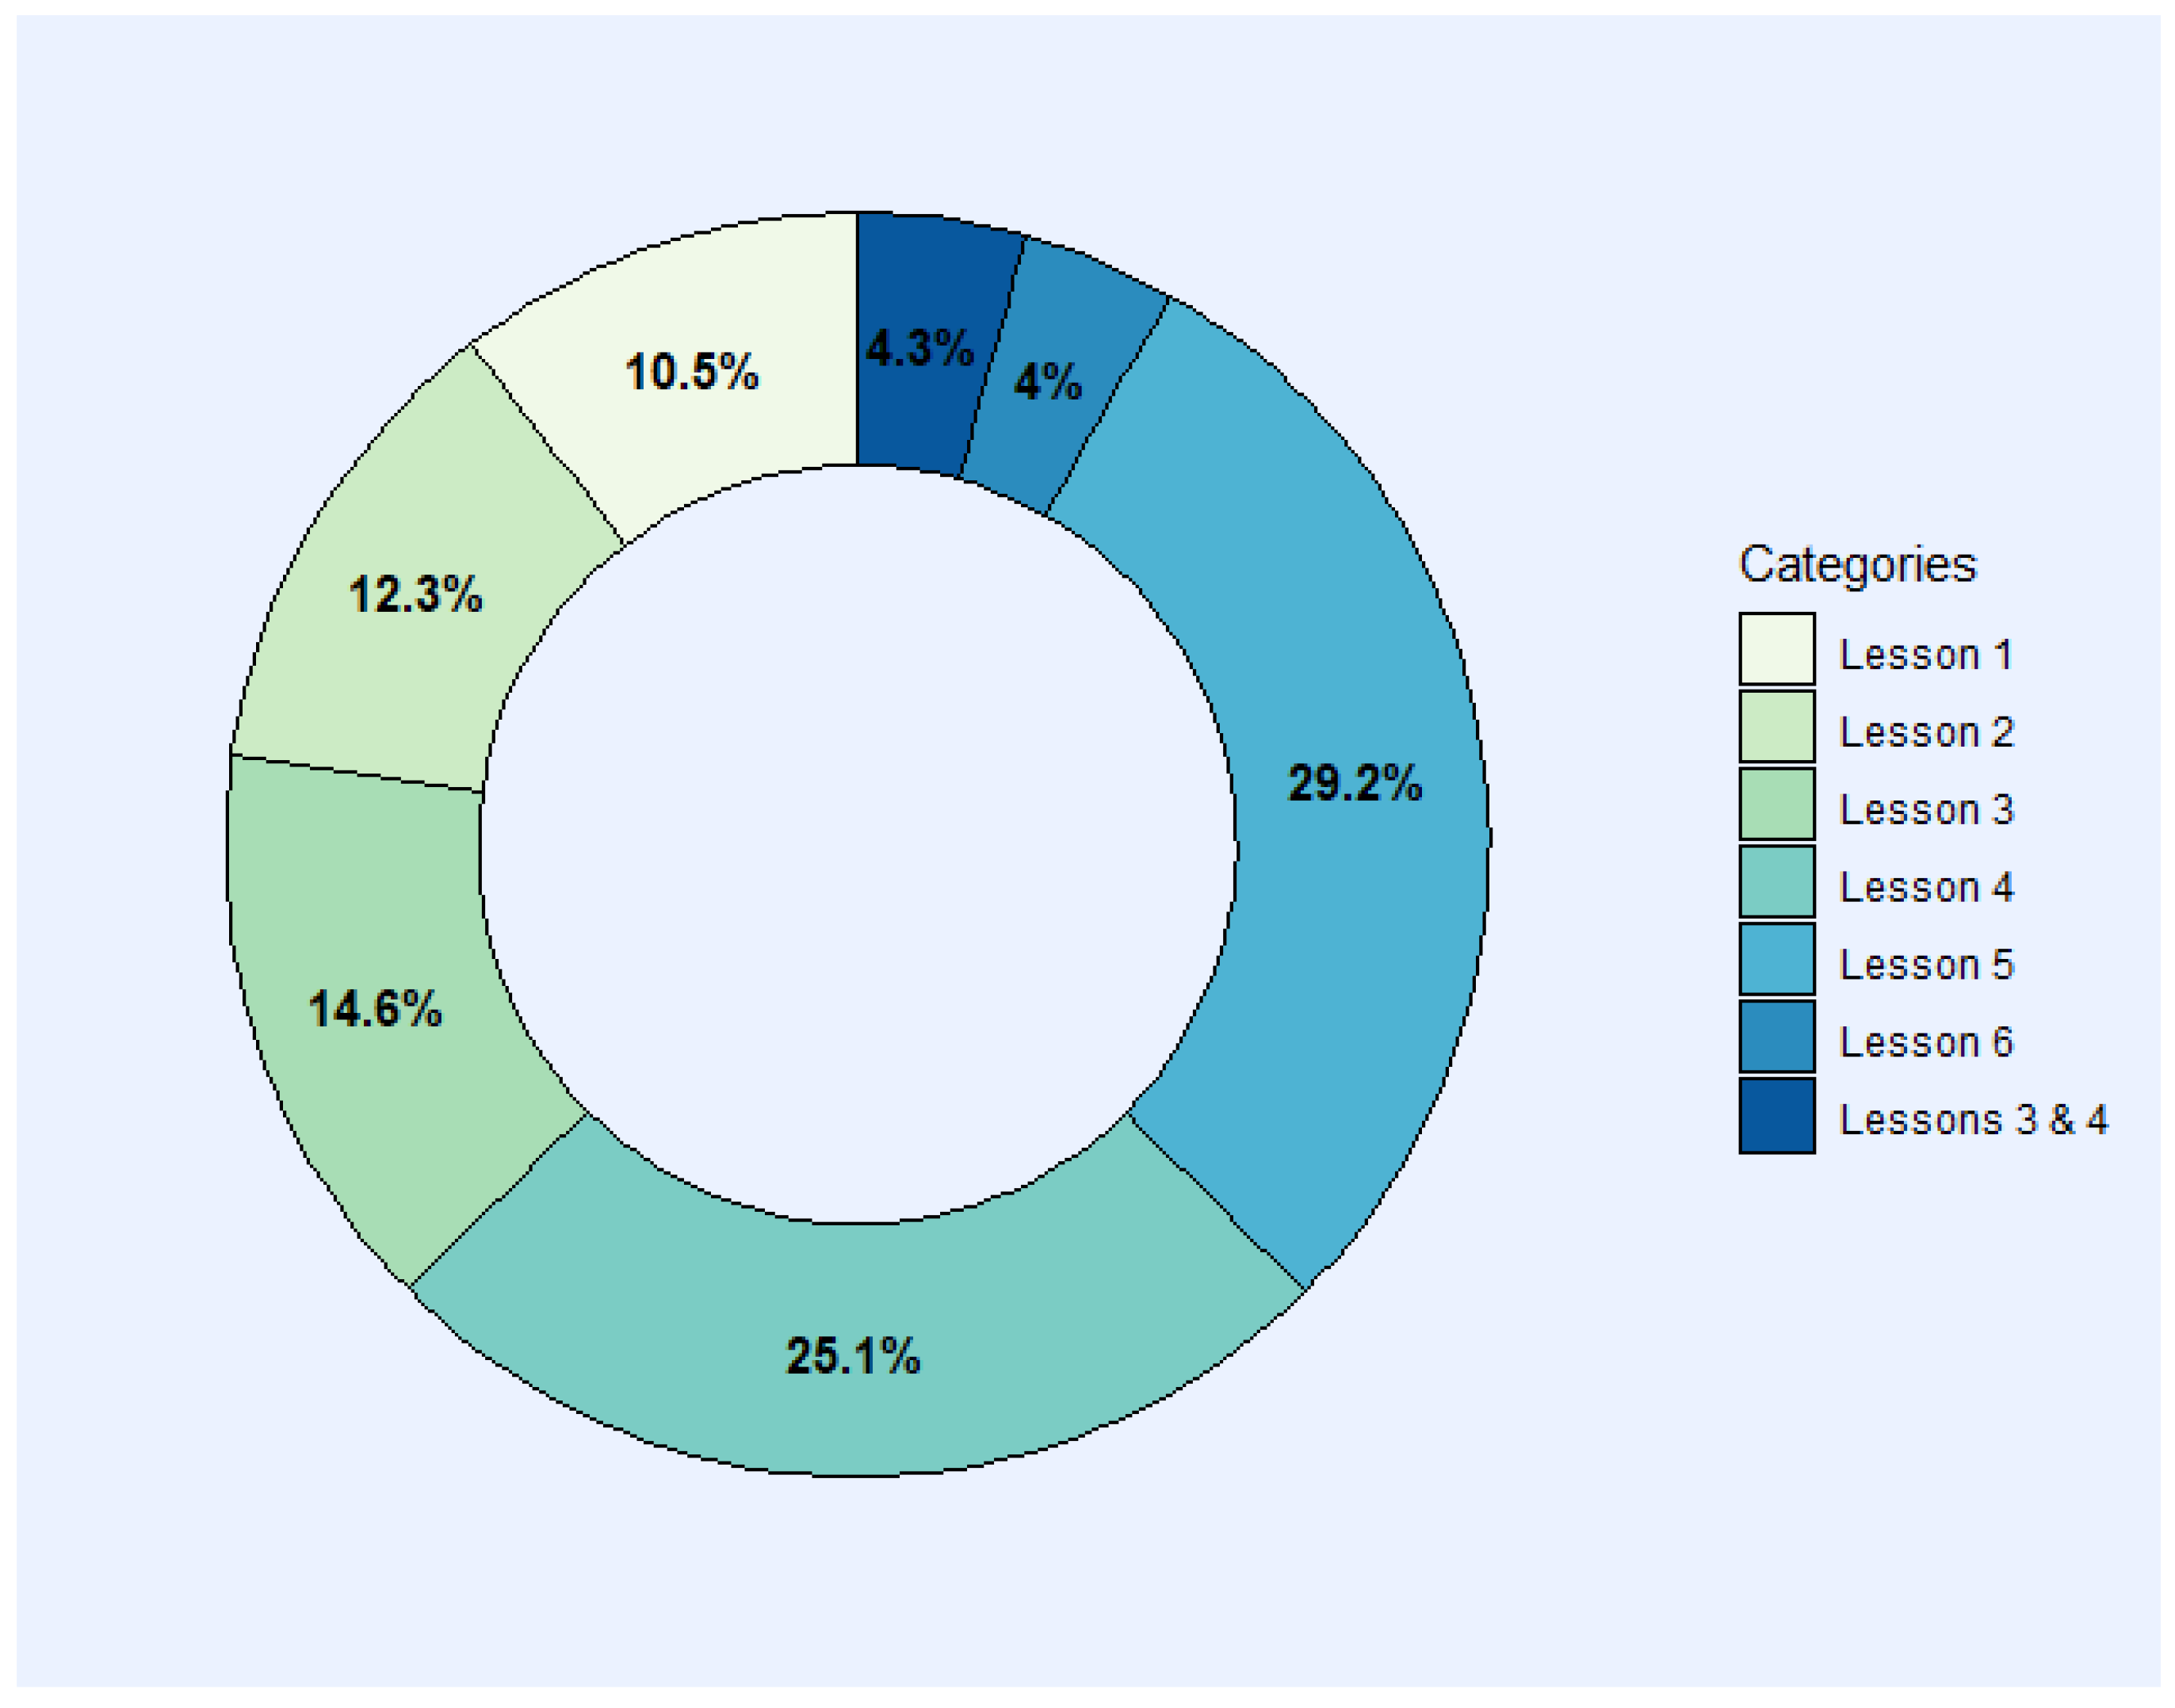
In our analysis, we focus on the categories related to numbered Lessons. The Other category does not provide information about students’ statistical issues, and High Level is not within our level scope, so neither are considered for this research question analysis. Therefore, Figure 1 provides an overview of the proportions only for the Lessons’ categories (without “Other” and “Higher Level”). According to categorization by Topic, the statistical issues presented were categorized as Descriptive Statistics (22.8%), Probability (44%), Statistical Inference (29.2%), and Statistical Software (4%). The percentage of each Lesson in relation to the total is represented to help provide an overview of the proportions. Considering this, we can recognize important statistical issues in Lesson 4 (25.1%) and Lesson 5 (29.2%), and if we merge both of these proportions, it would represent more than half of the statistical issues of our sample.

Figure 1.
Statistical challenges for students according to Lesson categorization.
4.2. RQ2: Similarities between the UCD MSC Categories and the URJC Categories
Once the URJC categorization was completed, it could be validated by comparing the categorization with the categories (see Name and Description in Table 2) that tutors from UCD made for the same comments (the UCD MSC categories). Initial analysis involved analyzing what the UCD MSC categories are and how many times each of them appear. There are 77 categories in total; however, many of them appear only once, for example “Complex Numbers, Vectors and Indices”. Consequently, we consider that the categories which appear less than six times do not have relevance for this validation analysis. Therefore, these categories were deleted, and we have a new subset with 37 categories.
With this preprocessing in UCD MSC categories, there are 9 categories in URJC and in UCD there are 37 categories, so we could witness an inconsistency owing to the differences in the number of categories. In fact, the UCD MSC categorization process has not been validated before and it could have errors (see Section 1). The next step that was undertaken was to merge different UCD MSC categories, which could undergo the same problem (Table 5).
Table 5.
Table to show new UCD MSC categories after merging UCD categories.
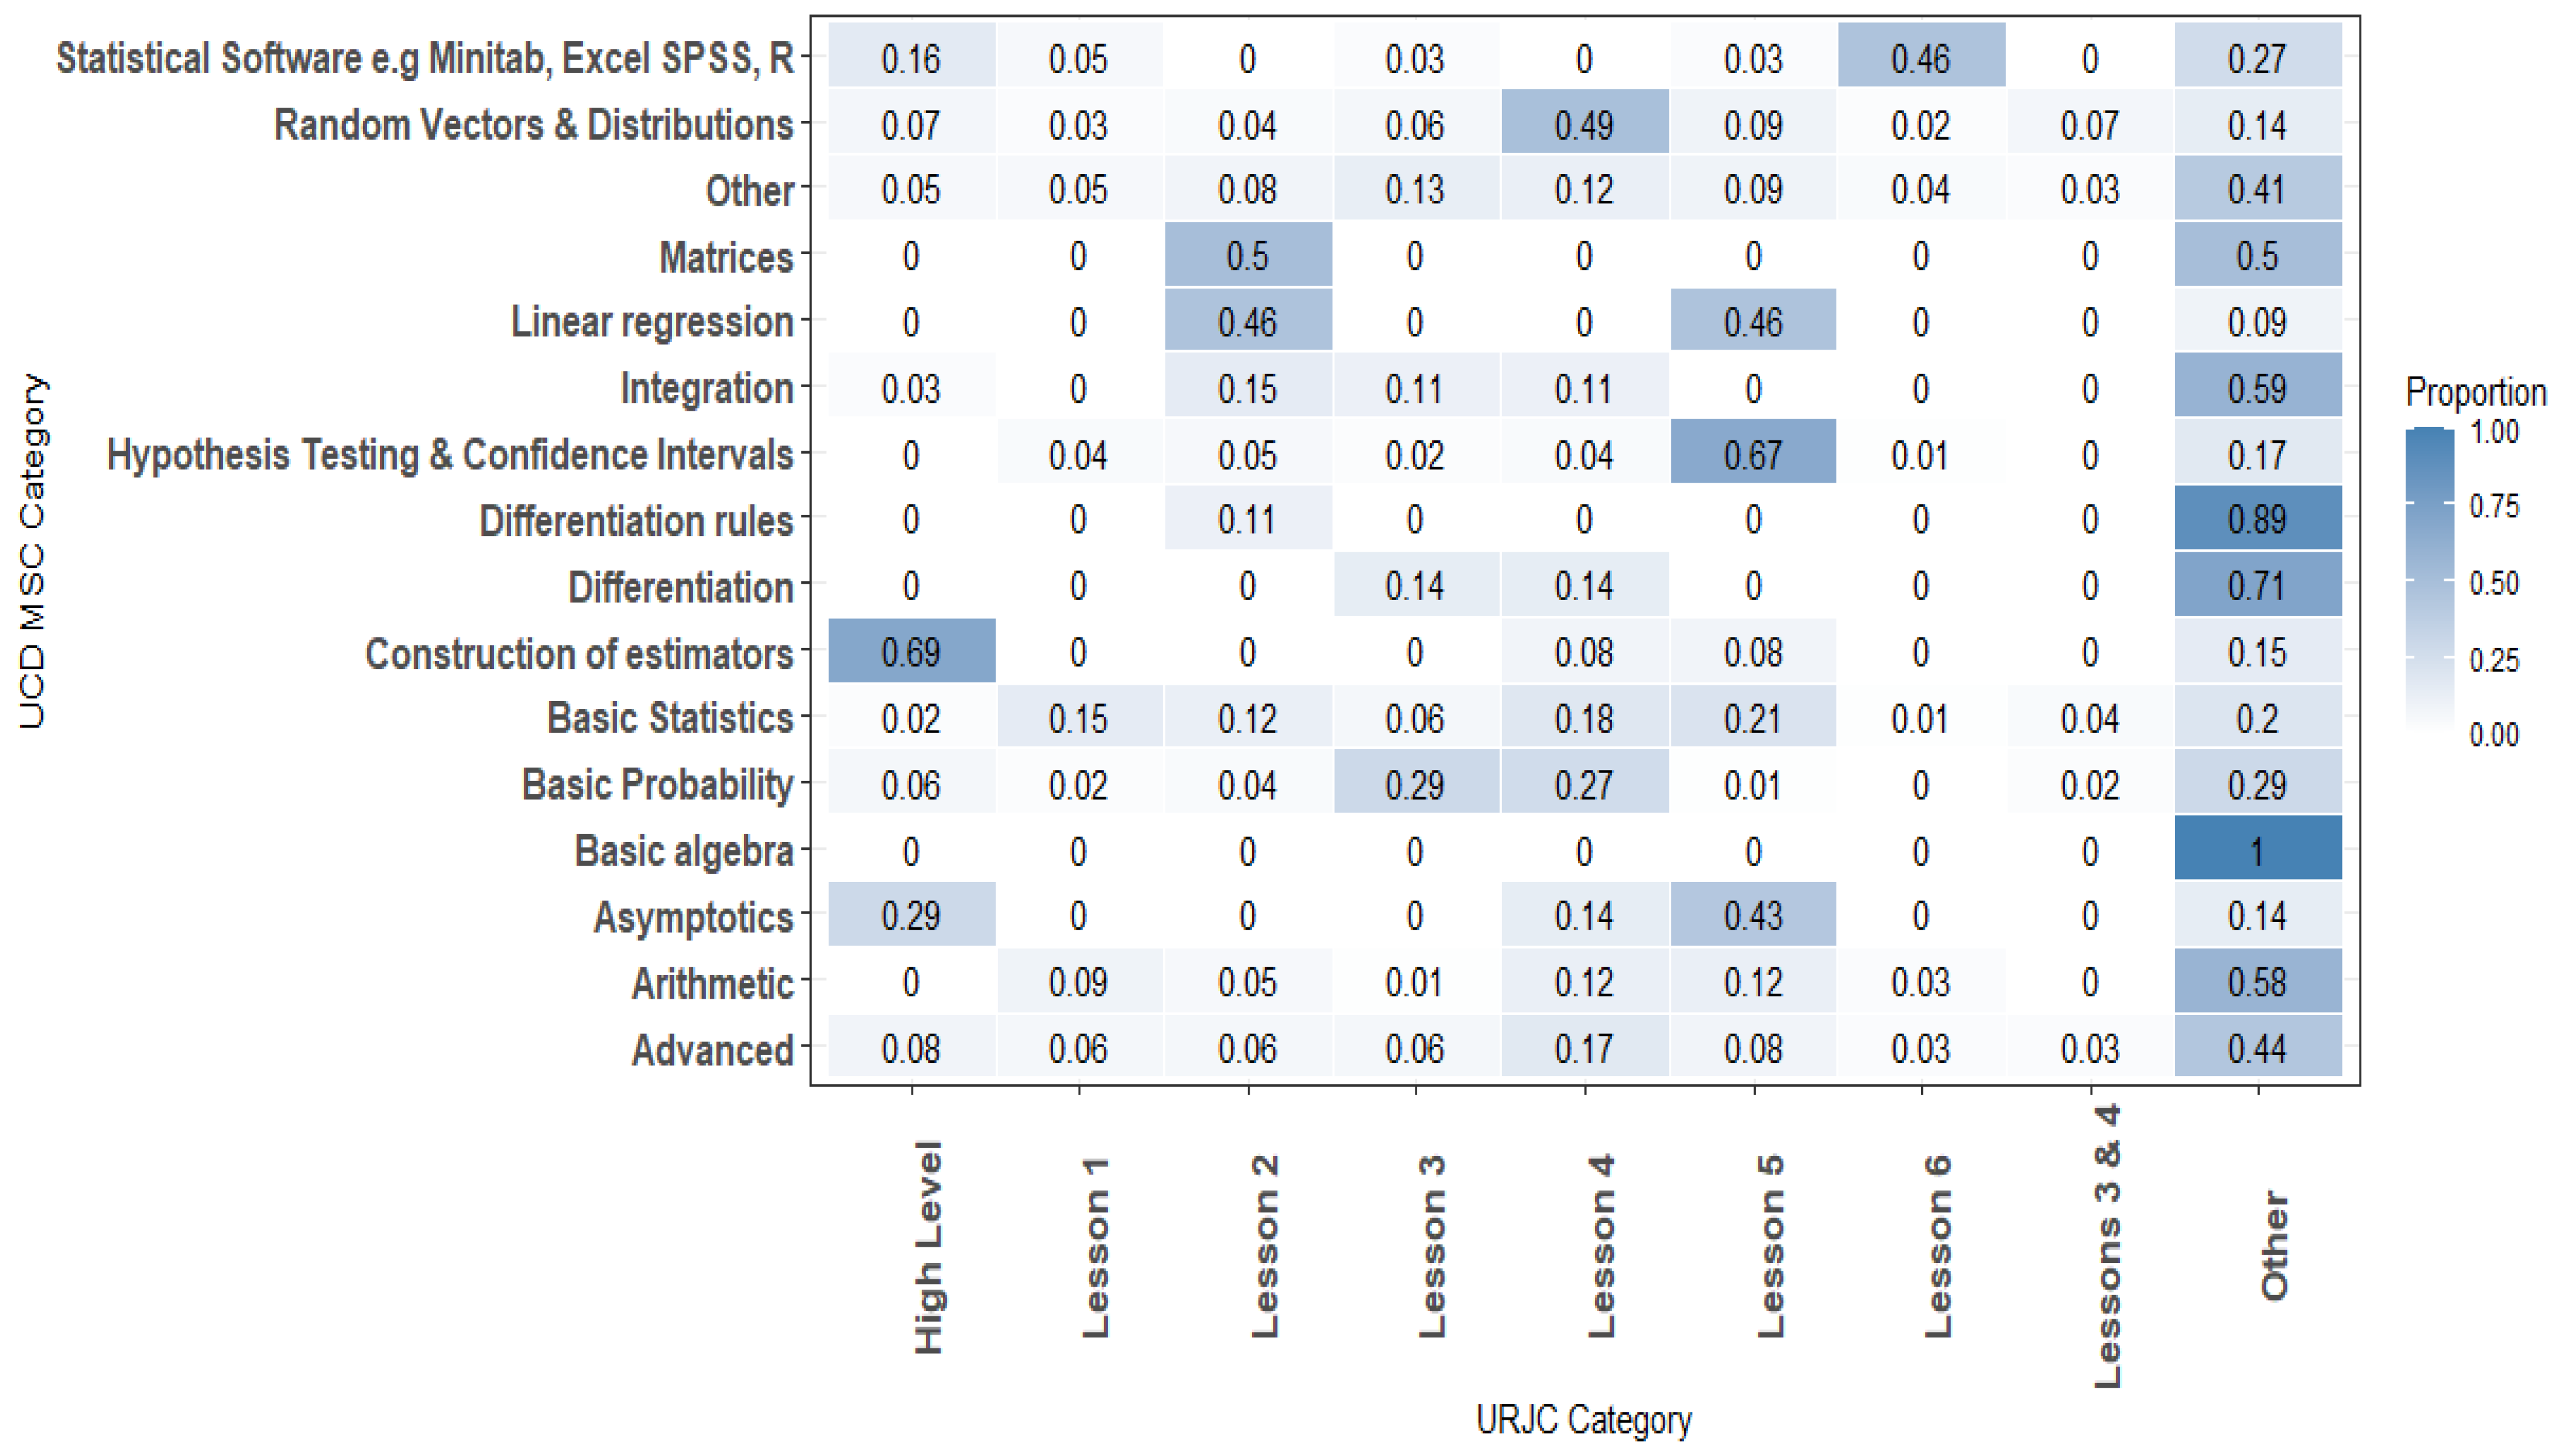
After the merging process, there are 17 UCD MSC categories. The frequency or behavior of the UCD MSC categories can be examined. As a first interpretation and before going deeper into the comparison, Figure 2 shows that the top categories are related to the Topics considered in the URJC categories; for example, “Basic Statistics” could be related to Lesson 1, “Hypothesis Testing and Confidence Intervals” to Lesson 5, and Random Vectors and Distributions” to Lesson 4. On the other hand, the bottom categories are not clearly related to any URJC Lesson. This could be a good indicator since, based on the URJC descriptions, all of those bottom categories should be matched with the Other category in URJC.
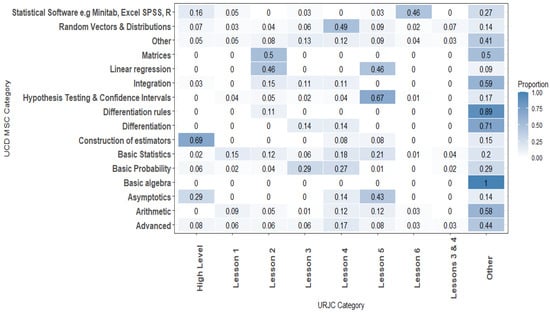
Figure 2.
Heatmap of the UCD MSC categories and the URJC categories.
Having cleaned and preprocessed the UCD MSC categories, we apply the comparison between the categorization of URJC with the categorization of UCD. This match allows us to validate both of the categorizations (see Figure 2).
Delving deeper into the comparison between the UCD MSC categories and the URJC categories, the heatmap allows us to identify data density between categories. It shows that there is a moderately strong agreement between all the URJC Lessons (except Lesson 1), with the same topic category for UCD. For example, we can observe that Lesson 2: Bivariate Data Description matches 46% with Linear Regression and 50% with Matrices and both are a part of the Lesson 2 description. Lesson 3: Probability has a 29% match with Basic Probability; Lesson 4: Random Variables and Special Random Variables has a 49% match with “Linear Regression”; Lesson 5: Statistics Inference has a 67% match with Hypothesis Testing and Confidence Intervals. And last but not least, Lesson 6: Statistical Software, presents a 46% match with Statistical Software, e.g., Minitab, Excel, SPSS, R.
Another example is the match of the “Asymptotics” UCD Category. It matches 29% with “High Level” and 43% with Lesson 5: Inference Statistics. In Statistics, asymptotic theory is a framework for assessing properties of estimators and statistical test, and extrapolating that to this research, issues relating to estimators are considered as Higher Level, and statistical test issues are considered as part of Lesson 5: Statistics Inference. Hence, as a result, it makes sense to present the percentages for both these relations.
But, on the other side, there are also values in Figure 2 which suggest that some of the issues have not been well categorized. Lesson 5: Inference Statistics also has a moderately strong agreement (46%) with Linear Regression, which, considering the URJC categorization, should be in Lesson 2 only. The MSC category of Basic Statistics presents a similar relation with different URJC Lessons (Lesson 1: 15%, Lesson 2: 12%, Lesson 4: 18%, and Lesson 5: 21%). This last point matches a UCD basic concept category with any URJC Lesson level and even with any URJC Lesson topic.
In summary, we can see that the most common UCD categories have the same topic that the Lesson defined in URJC. Regarding data validation between the UCD and URJC categories, Figure 2 shows that each URCJ Lesson presents its highest percentage, with a UCD category making sense. Despite this, we can see that some relationships need to be analyzed on a deeper level to understand the clear meaning of the percentage.
4.3. RQ3: Insights from Open-Text Responses
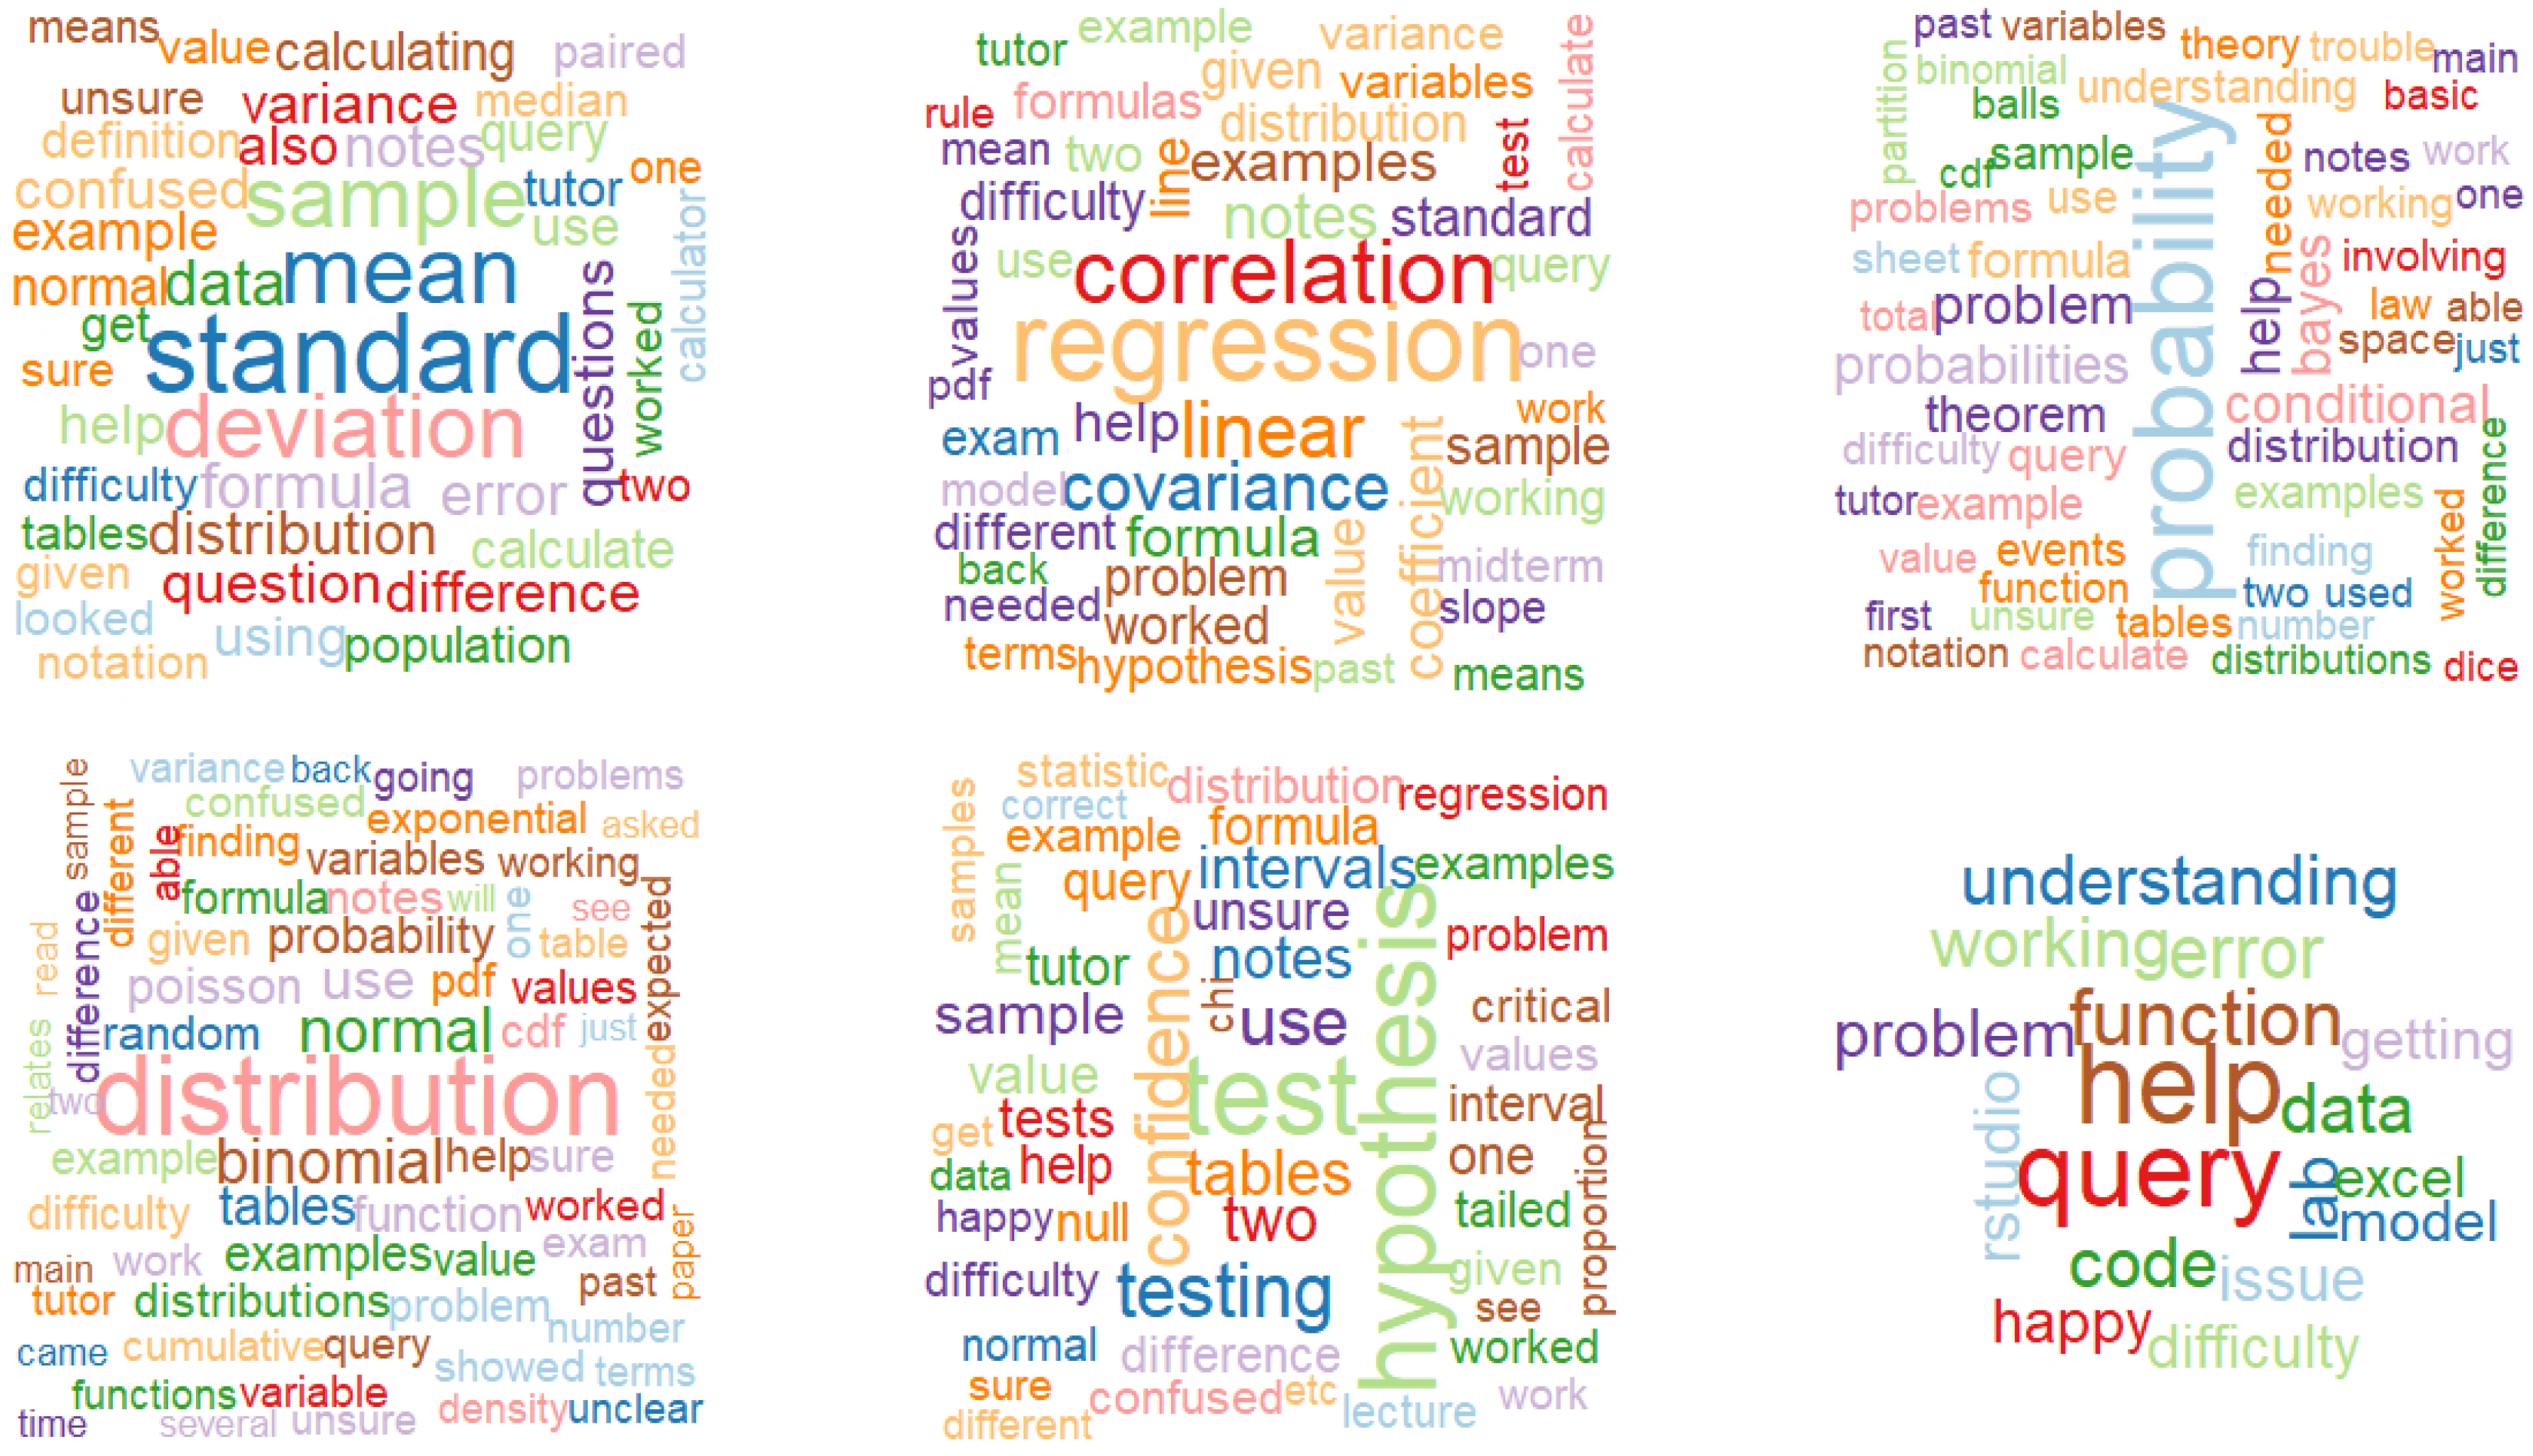
Lesson analysis gives us the category where the issue is, but there are several descriptions inside any one Lesson. Based on this, we can find out in detail what the main issue descriptions are using text mining in the UCD comment text. After the preprocessing of the Comment data (see Section 3.3), word clouds were generated for the UCD MSC Comment data, filtered through each URJC Lesson category (see Figure 3). The word clouds offer a quick snapshot or overview of the most frequently occurring issues across UCD MSC comments (and across Lessons).
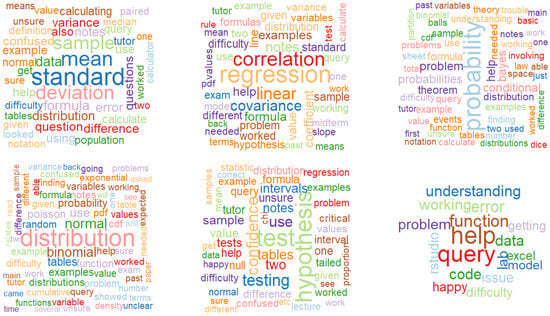
Figure 3.
Word clouds for each Lesson starting with Lesson 1 in the top left.
If we go deeper into any word cloud, we can see that in all of them the biggest word has a strong relation with one of the main descriptors of the Lesson. For example, in the Lesson 1 word cloud, “standard”, “deviation”, and “mean” are the most popular words; in Lesson 2, “regression”, “correlation”, and “covariance”; in Lesson 3, “conditional” and “probability”; Lesson 4, “distribution”; Lesson 5, “hypothesis”, “test”, and “confidence” and Lesson 6, “query”, “help”, “rstudio”, “code”, and “excel”.
Drilling down into the word cloud on Lesson 1 (see Figure 3) provides further detailed information beyond that of the “Description” section in the URJC categorization. The URJC description for Lesson 1 includes “basic concepts”, “variable types”, “summary of graphics data”, and “summary of numerical data”. The word cloud reveals a finer scale within basic concepts, highlighting terms like “standard deviation”, “mean”, “sample”, and “median”. It also offers more detail about graphical issues, mentioning terms such as “histogram”. Similarly, the other word clouds provide information on students’ statistical issues beyond the URJC category descriptions.
As discussed in the introduction, students struggle not only with theoretical issues but also with emotional ones. Across all word clouds, concepts related to feelings and emotions can be viewed, such as “confused”, “unsure”, and “unclear”.
5. Discussion
The overall goal of this paper is to identify the most common issues students face during the transition from secondary education to tertiary education. At the beginning of this paper, it was presented that statistics modules are included in the majority of degrees, independent of degree area [2], and in some cases, statistics has been poorly taught in formal education teaching [4]. Research has aimed to identify what the main problems are in teaching statistics. Batanero [5] confirmed that some of the problems detected are understanding the basic statistical concepts, the integration of statistics as a subject in school, statistical inference, and the limited time to assimilate the concepts [5]. Our descriptive analysis provides an overview of the frequently occurring issues across URJC Lessons and UCD MSC categories. Addressing RQ1, Section 4.1 indicates that probability and statistical inference are areas where students commonly encounter issues. As presented in the introduction, secondary education generally covers basic statistics and descriptive statistics, both related to Lesson 1: Data Description and Lesson 2: Bivariate Data Description. The results align to the prior findings of hypothesis testing, which fall under Lesson 5, posing difficulties for students [20].
Garcia et al. [30] confirmed that the statistics knowledge foundations that were made previous to university attendance, such as descriptive statistics, are associated with more positive attitudes and tend to evoke favorable reactions in students. This suggests that students arrive at tertiary education with fewer issues in these areas but struggle more with the new content taught at university level, e.g., probability distributions and statistical inference. The issues with advanced content could be owed to statistical concepts being treated in isolation without considering the relationship that must be established between them or not enough time being spent on the connections between topics [6,7,8]. The connections between statistical topics have been not examined in this research; it could be an important consideration to take into account for future research, including in the development of educational games or apps.
One of the key highlights of this study is the establishment of international collaboration in the identification of statistical issues and the associated categorization validation (RQ2). This involved reviewing the taught modules at URJC, categorizing the content into different Lessons, and analyzing the UCD data according to the URJC categories. A heatmap provided deeper insights into the relationship between the URJC Lessons and UCD MSC categories. Overall, there is a moderately strong agreement between the two categorizations. On a more granular level, several interpretations can be drawn from the heatmap, such as the case with the UCD MSC category “Basic Statistics”. The highest percentage of relation is 21% with Lesson 5. However, this category is related to all URJC Lessons, which might indicate that the tutor’s categorization is subjective, based on what they consider basic statistics, or that they are uncertain about the appropriate category. We recommend that the UCD MSC categories are further defined and discussed with the MSC tutors. In addition, the number of categories should be reduced, as 40 categories appeared less than six times across the 7-year time period of the data.
Following on from the literature review [19,20], to help address RQ3, word clouds have been chosen to identify specific problems within each Lesson. For each word cloud, the most representative word is the main descriptor inside each Lesson and, as a first picture and overview, it has a positive relation with the categorization. The main “words” for each Lesson match with the problems presented in the literature review; for example, in Lesson 5, the main words are hypothesis and test, and these connect with the main statistical problems in the literature [19], and in Lesson 1, standard deviation appears as a main issue [20]. This comprehensive analysis provides an evidence base for developing statistical support for first- and second-year undergraduate students. To develop educational games or apps that benefit students, this analysis helps to identify the main statistical topics taught and the areas where students struggle.
6. Conclusions and Future Research Directions
In conclusion, the main statistical issues students struggle with are those they encounter initially at university level as opposed to secondary level, i.e., Probability and Statistical Inference. Text mining shows that most students face similar problems in each Lesson. For instance, in Data Description, most of the issues are related with mean and standard deviation or, as in Bivariate Data Description, are in regression and correlation. This paper shows that text mining is an important tool in the identification of statistics issues.
An important gap is the relation between how to teach statistics, the content in the statistics subject, and the knowledge of the lecturers. If quality education is not provided, there will be inequality in students’ knowledge level, and they may have negative emotions when facing this subject. In addition, students will learn statistics just to pass their examinations, and afterwards, they will forget their module knowledge. Hence, they will be unprepared for real life. This can be addressed through strong networking, collaboration, and knowledge sharing of statistics education approaches across universities. In addition, the literature [19] highlights the positive impact of providing learning support outside the classroom environment. Access to support mechanisms enables students to overcome their anxiety, which is hinted at in the MSC data, and offers them an opportunity to enhance their skills in statistics. This is evident from study results, which show that students’ main concerns revolve around the calculation aspects of statistics problems, such as using formulas and applying techniques [19].
One potential avenue of future research is to use the knowledge gained of students’ statistical issues and misconceptions to design an optimal statistics module, taking into consideration what content is taught at the secondary level, what statistics knowledge is required in each degree, the area of the degree, and any mandatory conditions of the degree. This module, apart from optimizing the content, could be designed to optimize the learning process and performance for students. Machine learning could play a role in the identification of the optimal topics using this data set. Another avenue, which we intend to pursue, would be more focused on additional module supports. This would be developing supports (e.g., games, dashboards, and apps) that will be applicable across international borders and will be evidenced-based. Hence, they will reduce the need for repetition in resource creation, reduce redundancy in resource creation (creating resources for topics that are not statistical issues), and therefore reduce resources (time, money, and energy). With these future international resources, we aim to achieve stronger networking between countries and universities, reduce the need for independent work related to the duplication of resources, and, the most important aim, provide attractive statistics resources to make the knowledge sustainable and long-lasting for students.
Author Contributions
A.d.l.H.-R.: Conceptualization, methodology, software, validation, formal analysis, writing—original draft, writing—review and editing, and visualization. E.H.: Conceptualization, methodology, software, validation, writing—review and editing, visualization, supervision, and project administration. R.H.-N.: Conceptualization, methodology, writing—review and editing, supervision, and project administration. All authors have read and agreed to the published version of the manuscript.
Funding
This research was funded by research grants PID2022-137849OB-I00 funded by MICIU/AEI/10.13039/501100011033 and by the ERDF, EU.
Institutional Review Board Statement
The study was conducted in accordance with the Declaration of Helsinki and was approved by the Institutional Review Board (or Ethics Committee) of University College Dublin (protocol code LS-C-23-221-Cronin and date of approval 20 September 2023) for studies involving humans.
Informed Consent Statement
Consent was obtained from all subjects involved in the study.
Data Availability Statement
Restrictions apply to the availability of these data. Data were obtained from Associate Professor Anthony Cronin, manager of the UCD MSC.
Acknowledgments
We would like to thank the manager of the UCD Maths Support Centre, Anthony Cronin, for providing the MSC data and liaising with us on this project. We would also like to thank the students who attended the MSC and consented to having their data analyzed for research purposes.
Conflicts of Interest
The authors declare no conflicts of interest.
References
- López, R. The teaching of Statistics in Latin America Primary Education. REICE Rev. Iberoam. Sobre Calid. Efic. Y Cambio Educ. 2015, 13, 103–121. [Google Scholar]
- Blanco, A. Una revisión crítica de la investigación sobre las actitudes de los estudiantes universitarios hacia la estadística. Rev. Complut. Educ. 2008, 19, 311–330. Available online: https://revistas.ucm.es/index.php/RCED/article/view/RCED0808220311A (accessed on 4 August 2024).
- Ottaviani, M.G. From the past to the future. In Proceedings of the Sixth International Conference on Teaching of Statistics, Ciudad del Cabo, South Africa, 7–12 July 2002; CD ROM. Phillips, E.B., Ed.; IASE: London, UK, 2002. [Google Scholar]
- Cuétara Hernández, Y.; Salcedo Estrada, I.M.; Hernández Díaz, M. La enseñanza de la estadística: Antecedentes y actualidad en el contexto internacional y nacional. Atenas 2016, 3, 125–140. [Google Scholar]
- Batanero, C. Sentido estadístico: Componentes y desarrollo. In Actas de las Jornadas Virtuales en Didáctica de la Estadística, Probabilidad y Combinatoria; Contreras, E.J.M., Cañadas, G.R., Gea, M.M., Arteaga, P., Eds.; Departamento de Didáctica de la Matemática de la Universidad de Granada: Granada, Spain, 2013; pp. 55–61. [Google Scholar]
- Batanero, C.; Godino, J. Análisis de Datos y su Didáctica; Departamento de Didáctica de la Matemática de la Universidad de Granada: Granada, Spain, 2001. [Google Scholar]
- Batanero, C.; Castro, A.; Godino, J. Evolution of students, understanding of statistical association in a computer-based teaching environment. In Material Digital; Universidad de Granada: Granada, Spain, 2002. [Google Scholar]
- Garfield, J.B.; Ben-Zvi, D.; Chance, B.; Medina, E.; Roseth, C.; Zieffler, A. Developing Students’ Statistical Reasoning: Connecting Research and Teaching Practice; Springer: New York, NY, USA, 2008; pp. 57–69. [Google Scholar]
- Blanco, A. Enseñar y aprender Estadística en las titulaciones universitarias de Ciencias Sociales: Apuntes sobre el problema desde una perspectiva pedagógica. In Hacia Una Enseñanza Universitaria Centrada en El Aprendizaje; Torre, J.C., Gil, E., Eds.; Universidad Pontificia Comillas: Madrid, Spain, 2004; pp. 143–190. [Google Scholar]
- Behar, R.; Grima, P. La estadística en la educación superior ¿Formamos pensamiento estadístico? Ing. Compet. 2004, 5, 84–90. [Google Scholar] [CrossRef]
- Ramos, L. La educación estadística en el nivel universitario: Retos y oportunidades. Rev. Digit. Investig. Docencia Univ. 2019, 13, 67–82. [Google Scholar] [CrossRef]
- Estrella, S. Enseñar estadística para alfabetizar estadísticamente y desarrollar el razonamiento estadístico. In Alternativas Pedagógicas Para la Educación Matemática Del Siglo XXI; Salcedo, A., Ed.; Centro de Investigaciones Educativas, Escuela de Educación, Universidad Central de Venezuela: Caracas, Venezuela, 2017; pp. 173–194. Available online: https://goo.gl/tUFF5Y (accessed on 4 August 2024).
- Kaplan, J.J.; Gabrosek, J.G.; Curtiss, P.; Malone, C. Investigating Student Understanding of Histograms. J. Stat. Educ. 2014, 22, 1–30. [Google Scholar] [CrossRef]
- Witmer, J. Bayes and MCMC for Undergraduates. Am. Stat. 2017, 71, 259–264. [Google Scholar] [CrossRef]
- Johnson, A.; Rundel, C.; Hu, J.; Ross, K.; Rossman, A. Teaching an Undergraduate Course in Bayesian Statistics: A Panel Discussion. J. Stat. Educ. 2020, 28, 251–261. [Google Scholar] [CrossRef]
- Hu, J.A. Bayesian Statistics Course for Undergraduates: Bayesian Thinking Computing, and Research. J. Stat. Educ. 2020, 28, 229–235. [Google Scholar] [CrossRef]
- Hoegh, A. Why Bayesian Ideas Should Be Introduced in the Statistics Curricula and How to Do So. J. Stat. Educ. 2020, 28, 222–228. [Google Scholar] [CrossRef]
- Dogucu, M.; Hu, J. The Current State of Undergraduate Bayesian Education and Recommendations for the Future. Am. Stat. 2020, 76, 405–413. [Google Scholar] [CrossRef]
- Intepe, G.; Shearman, D. Developing statistical understanding and overcoming anxiety via drop-in consultations. Stat. Educ. Res. J. 2020, 19, 149–166. [Google Scholar] [CrossRef]
- Cronin, A.; Intepe, G.; Shearman, D.; Sneyd, A. Analysis using natural language processing of feedback data from two mathematics support centres. Int. J. Math. Educ. Sci. Technol. 2019, 50, 1087–1103. [Google Scholar] [CrossRef]
- Kovanovic, V.; Joksimovic, S.; Gasevic, D.; Hatala, M.; Siemens, G. Content analytics: The definition, scope, and an overview of published research. In Handbook of Learning Analytics; Siemens, G., Lang, C., Wise, A., Gašević, D., Eds.; Society for Learning Analytics Research: Beaumont, CA, USA, 2015; pp. 77–92. [Google Scholar]
- Litman, D. Natural language processing for enhancing teaching and learning. In Proceedings of the Thirtieth AAAI Conference on Artificial Intelligence, Phoenix, AZ, USA, 12–17 February 2016; AAAI Press: Washington, DC, USA, 2016; pp. 4170–4176. [Google Scholar]
- Shum, S.B.; Knight, S.; McNamara, D.; Allen, L.; Bektik, D.; Crossley, S. Critical perspectives on writing analytics. In Proceedings of the Sixth International Conference on Learning Analytics & Knowledge, Edinburgh, UK, 25–29 April 2016; ACM: New York, NY, USA, 2016; pp. 481–483. [Google Scholar]
- Mello, R.F.; Andre, M.; Pinheiro, A.G.; Costa, E.; Romero, C. Text mining in education. WIREs Data Min. Knowl. Discov. 2019, 9, e1332. [Google Scholar] [CrossRef]
- Chowdhury, G.G. Natural language processing. Annu. Rev. Inf. Sci. Technol. 2003, 37, 51–89. [Google Scholar] [CrossRef]
- Brooks, B.J.; Gilbuena, D.M.; Krause, S.J.; Koretsky, M.D. Using word clouds for fast, formative assessment of students’ short written responses. Chem. Eng. Educ. 2014, 48, 190–198. [Google Scholar]
- Hadley, W.; Chang, W.; Henry, L.; Pedersen, T.L.; Takahashi, K.; Wilke, C.; Woo, K.; Yutani, H.; Dunnington, D.; ven den Brand, T. GGPLOT2: Create Elegant Data Visualisations Using the Grammar of Graphics. Available online: https://cran.r-project.org/web/packages/ggplot2/index.html (accessed on 4 August 2024).
- Wickham, H. Tidyverse: Easily Install and Load the ‘Tidyverse’. Available online: https://cran.r-project.org/web/packages/tidyverse/index.html (accessed on 4 August 2024).
- Feinerer, I.; Hornik, K.; Artifex Software, Inc. tm: Text Mining Package. Available online: https://cran.r-project.org/web/packages/tm/index.html (accessed on 4 August 2024).
- García, J.A.; Fallas, M.A.; Romero, A. Las actitudes hacia la estadística del estudiantado de orientación. Rev. Electrónica Educ. 2015, 19, 25–41. [Google Scholar]
Disclaimer/Publisher’s Note: The statements, opinions and data contained in all publications are solely those of the individual author(s) and contributor(s) and not of MDPI and/or the editor(s). MDPI and/or the editor(s) disclaim responsibility for any injury to people or property resulting from any ideas, methods, instructions or products referred to in the content. |
© 2024 by the authors. Licensee MDPI, Basel, Switzerland. This article is an open access article distributed under the terms and conditions of the Creative Commons Attribution (CC BY) license (https://creativecommons.org/licenses/by/4.0/).