Evaluation of Academic Stress Employing Network and Time Series Analysis on EEG Data


Abstract
:
1. Introduction
2. Materials and Methods
2.1. Participants
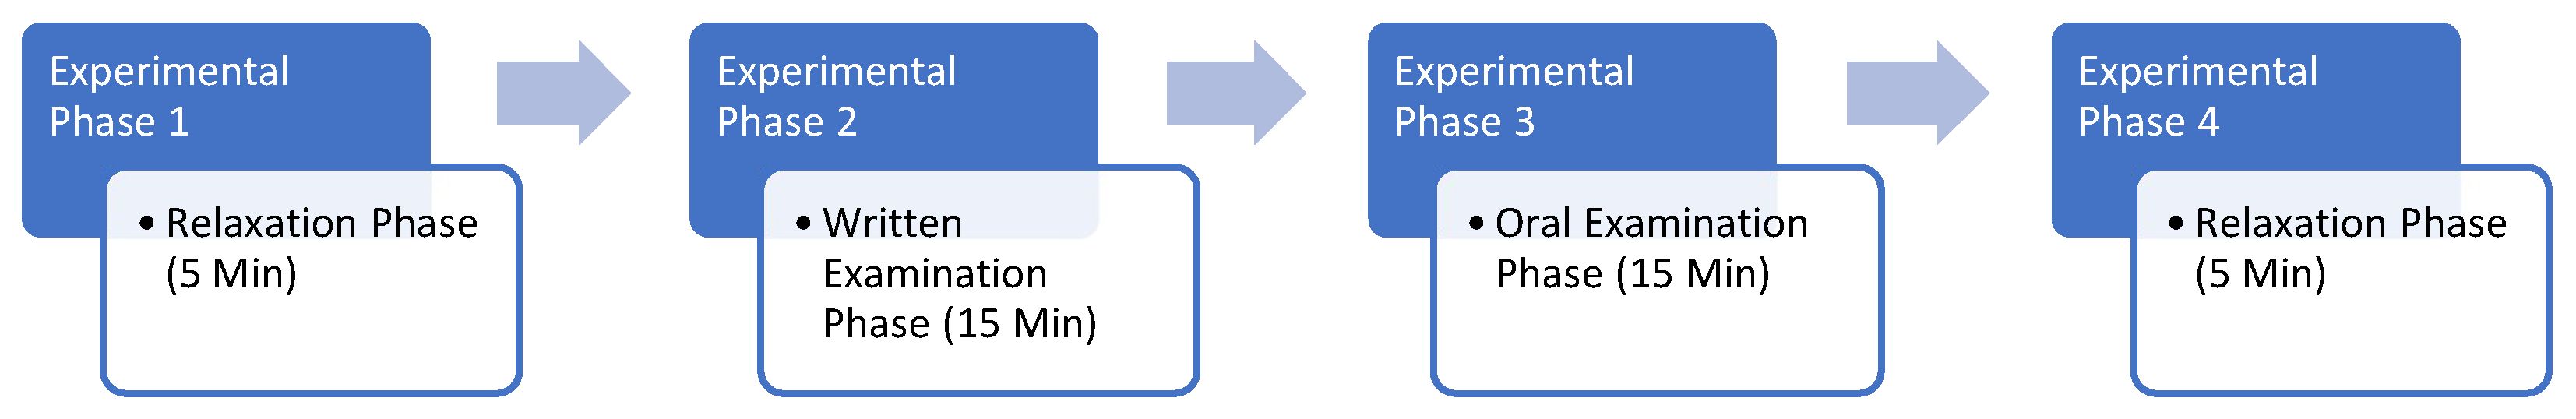
2.2. Experimental Protocol
- (A)
- Phase 1 (RX—relaxation): In this stage, the participants calmed down and prepared for the experimental procedure. In this stage, the baseline measurements were taken from the equipment used.
- (B)
- Phase 2 (WE—written examination): In this stage, participants had to complete the written examination as best as they could in the time given, which was limited for the requested tasks.
- (C)
- Phase 3 (OE—oral examination): In this stage, the participants were subjected to an oral examination by the three-member committee, which asked questions continuously for the entire time available, in order to put as much pressure on each participant as possible.
- (D)
- Phase 4 (RX—relaxation): In this stage, the participants relaxed and calmed down after they had finished the experimental procedure. It was the last stage of the experimental protocol.
2.3. Psychometrics Tests
2.4. Equipment
- -
- F3, F4, AF3, AF4, F7, and F8 for frontal lobe activity;
- -
- T7, T8, FC5, and FC6 for temporal lobes activity;
- -
- P7 and P8 for lobus parietalis activity;
- -
- O1 and O2 for depicting activity in the lobus occipitalis.
- -
- Stress: characterized as a measure of a person’s comfort with the situation they confront. High stress can be caused by an inability to execute tough work, feelings of being overwhelmed, and dread of negative repercussions if the activity is not completed successfully. In general, a low to moderate degree of stress can boost productivity, but a greater level tends to be detrimental and can have long-term consequences for health and well-being.
- -
- Engagement: defined as wakefulness and intentionally focusing attention on task-related inputs. It assesses the amount of absorption at any particular time and is a combination of attention and focus that differs from boredom. Engagement is characterized by higher physiological arousal, more Beta waves, and fewer Alpha waves. The greater the attention, focus, and workload, the higher the value of this element as indicated by EEG software (EmotivPRO v.3.8.0.532).
- -
- Excitement: characterized as a favorable physiological stimulation. It is characterized by sympathetic nervous system activation, which causes a variety of physiological reactions, such as pupil dilation, ocular dilatation, sweat gland stimulation, increased heart rate and muscular tension, blood diversion, and digestive function inhibition. In general, when physiological stimulation increases, so does the value of the component reflected by the EEG software. Excitement detection is designed to offer capture values that indicate short-term fluctuations in excitement across time periods as short as a few seconds, according to Emotiv.
- -
- Focus: a metric for maintaining attention on a certain job over time. Both the intensity and frequency of attentional shift between tasks are measured by focus. Frequently moving between activities and even challenging ones might result in low factor values, which indicate inattention and a lack of focus.
- -
- Interest: the degree of attraction or repulsion to the environment, activity, or stimuli at hand. While mid-range values show neither aversion nor a desire to complete the activity, low interest levels show a significant distaste to the task, and high interest scores show a great desire for the action.
- -
- Relaxation: defined as an indicator of a person’s ability to recover from high levels of concentration.
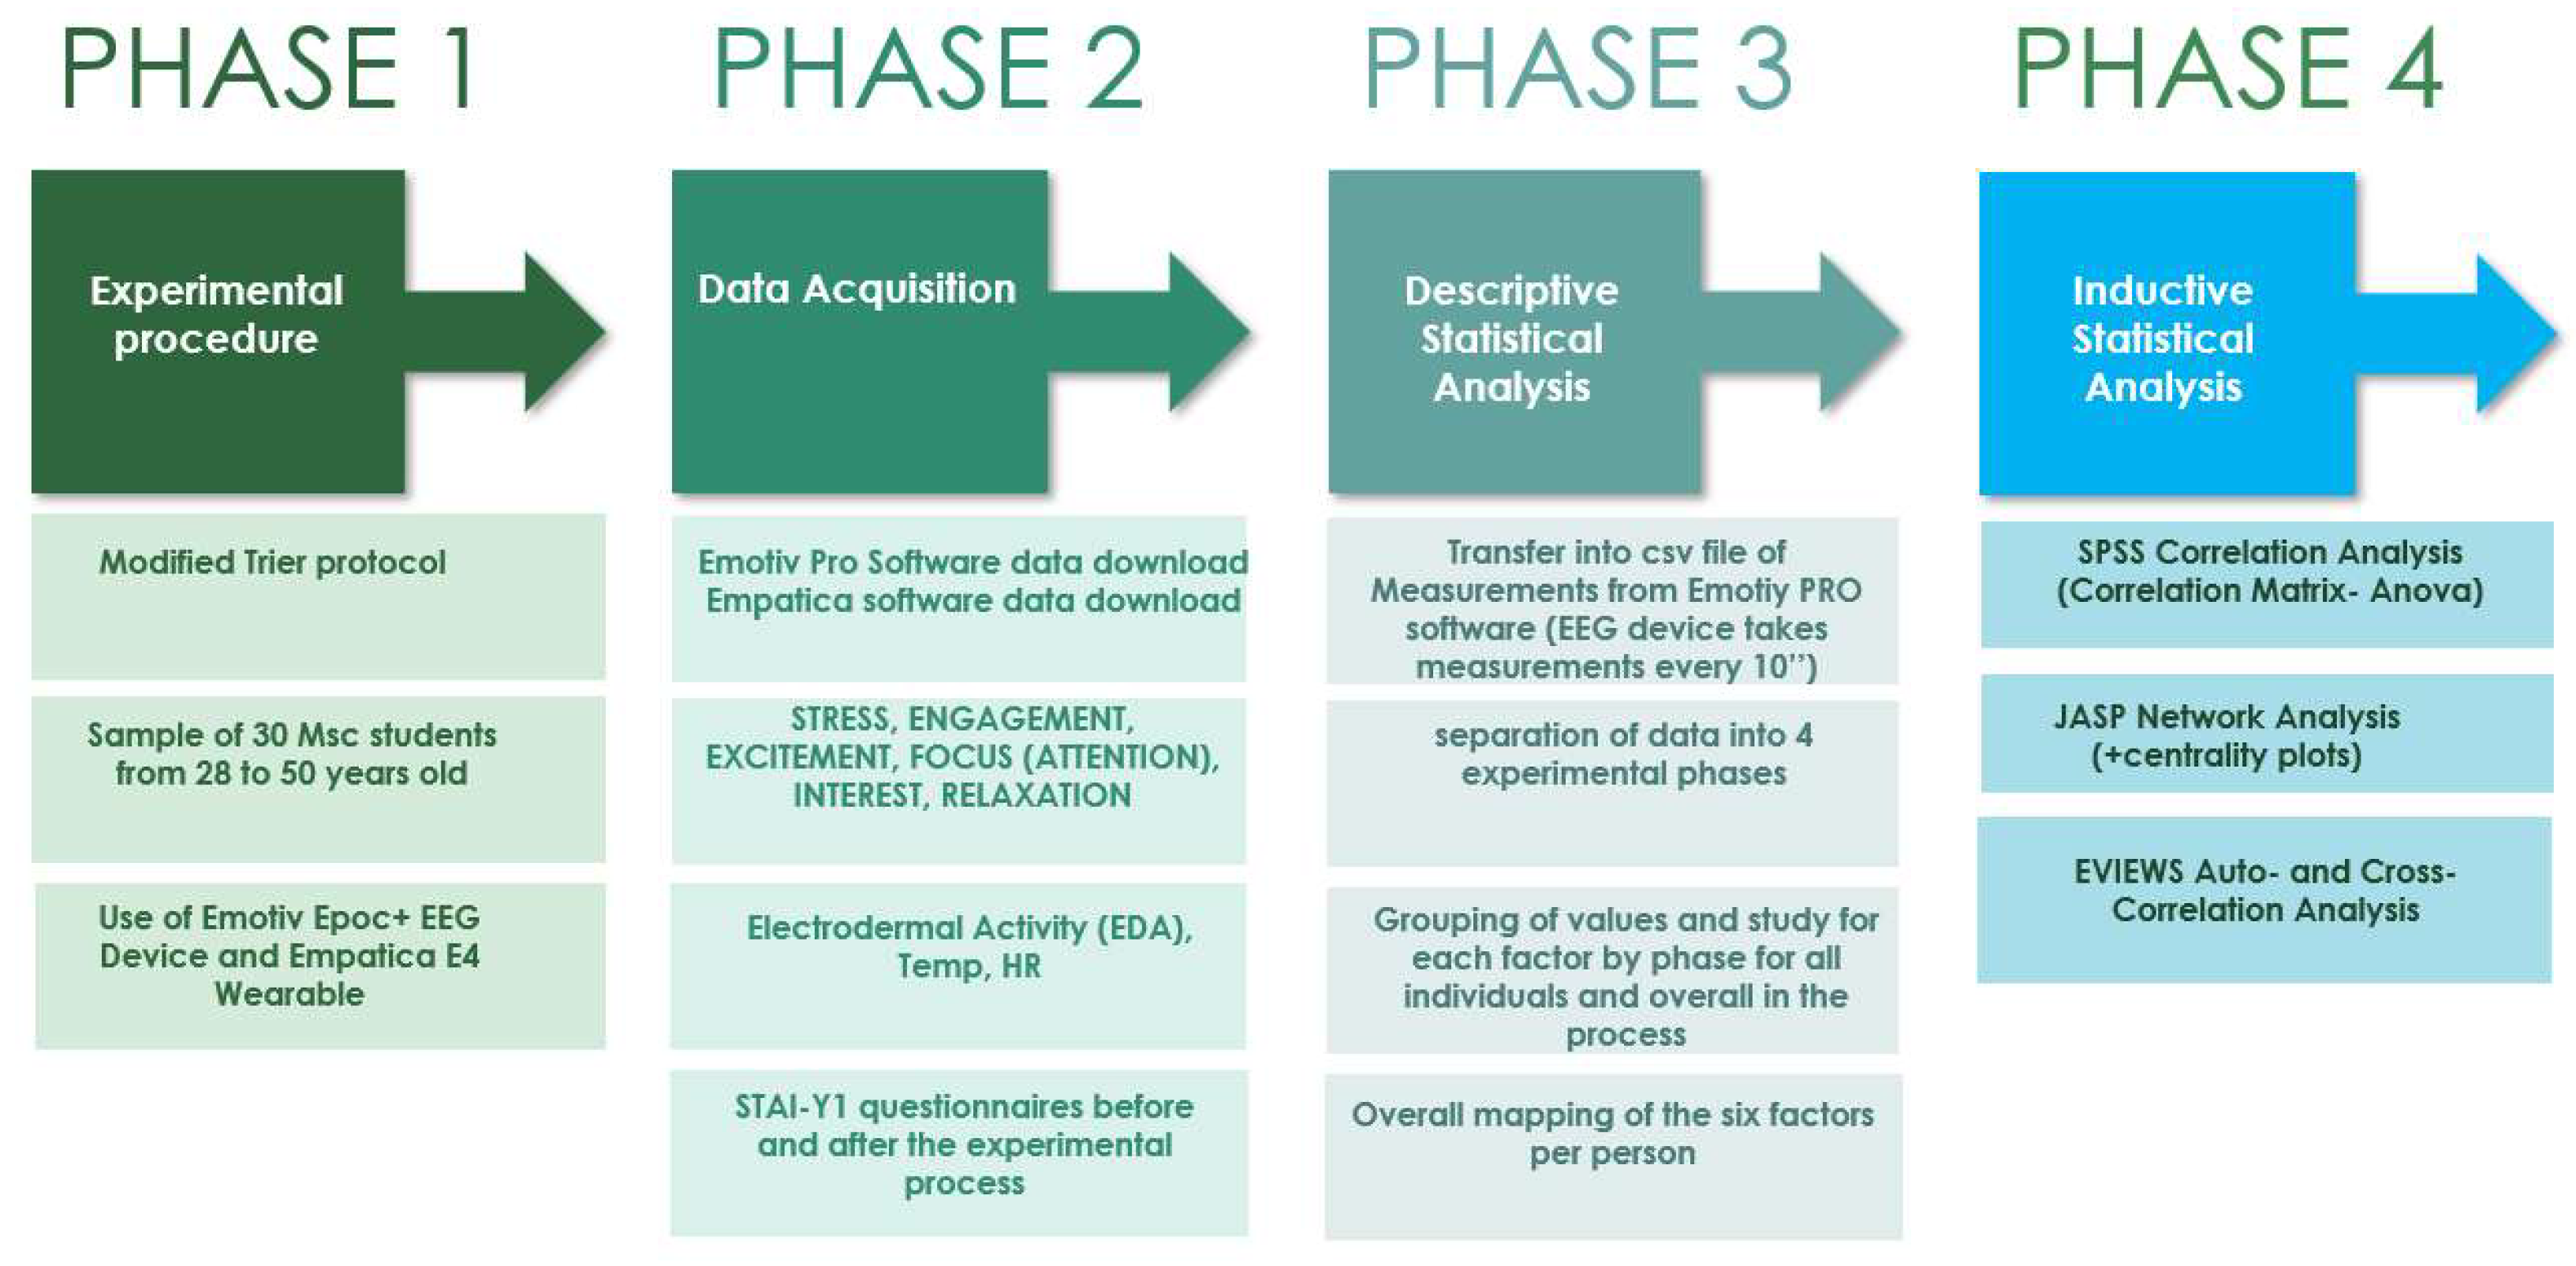
3. Analysis of the Acquired Data
- -
- Spearman and Pearson correlation analyses by phase were performed for each participant using SPSS v.21.0 software. These analyses result in a square matrix of values (a correlation matrix) by phase-based on Pearson analysis to assess the linear relationships between the continuous variables, where the factor of stress is significantly correlated with the factors of focus, excitement, interest, engagement, and relaxation. The statistically significant correlation of the emotions led to the conclusion that there is a significant level of association between them.
- -
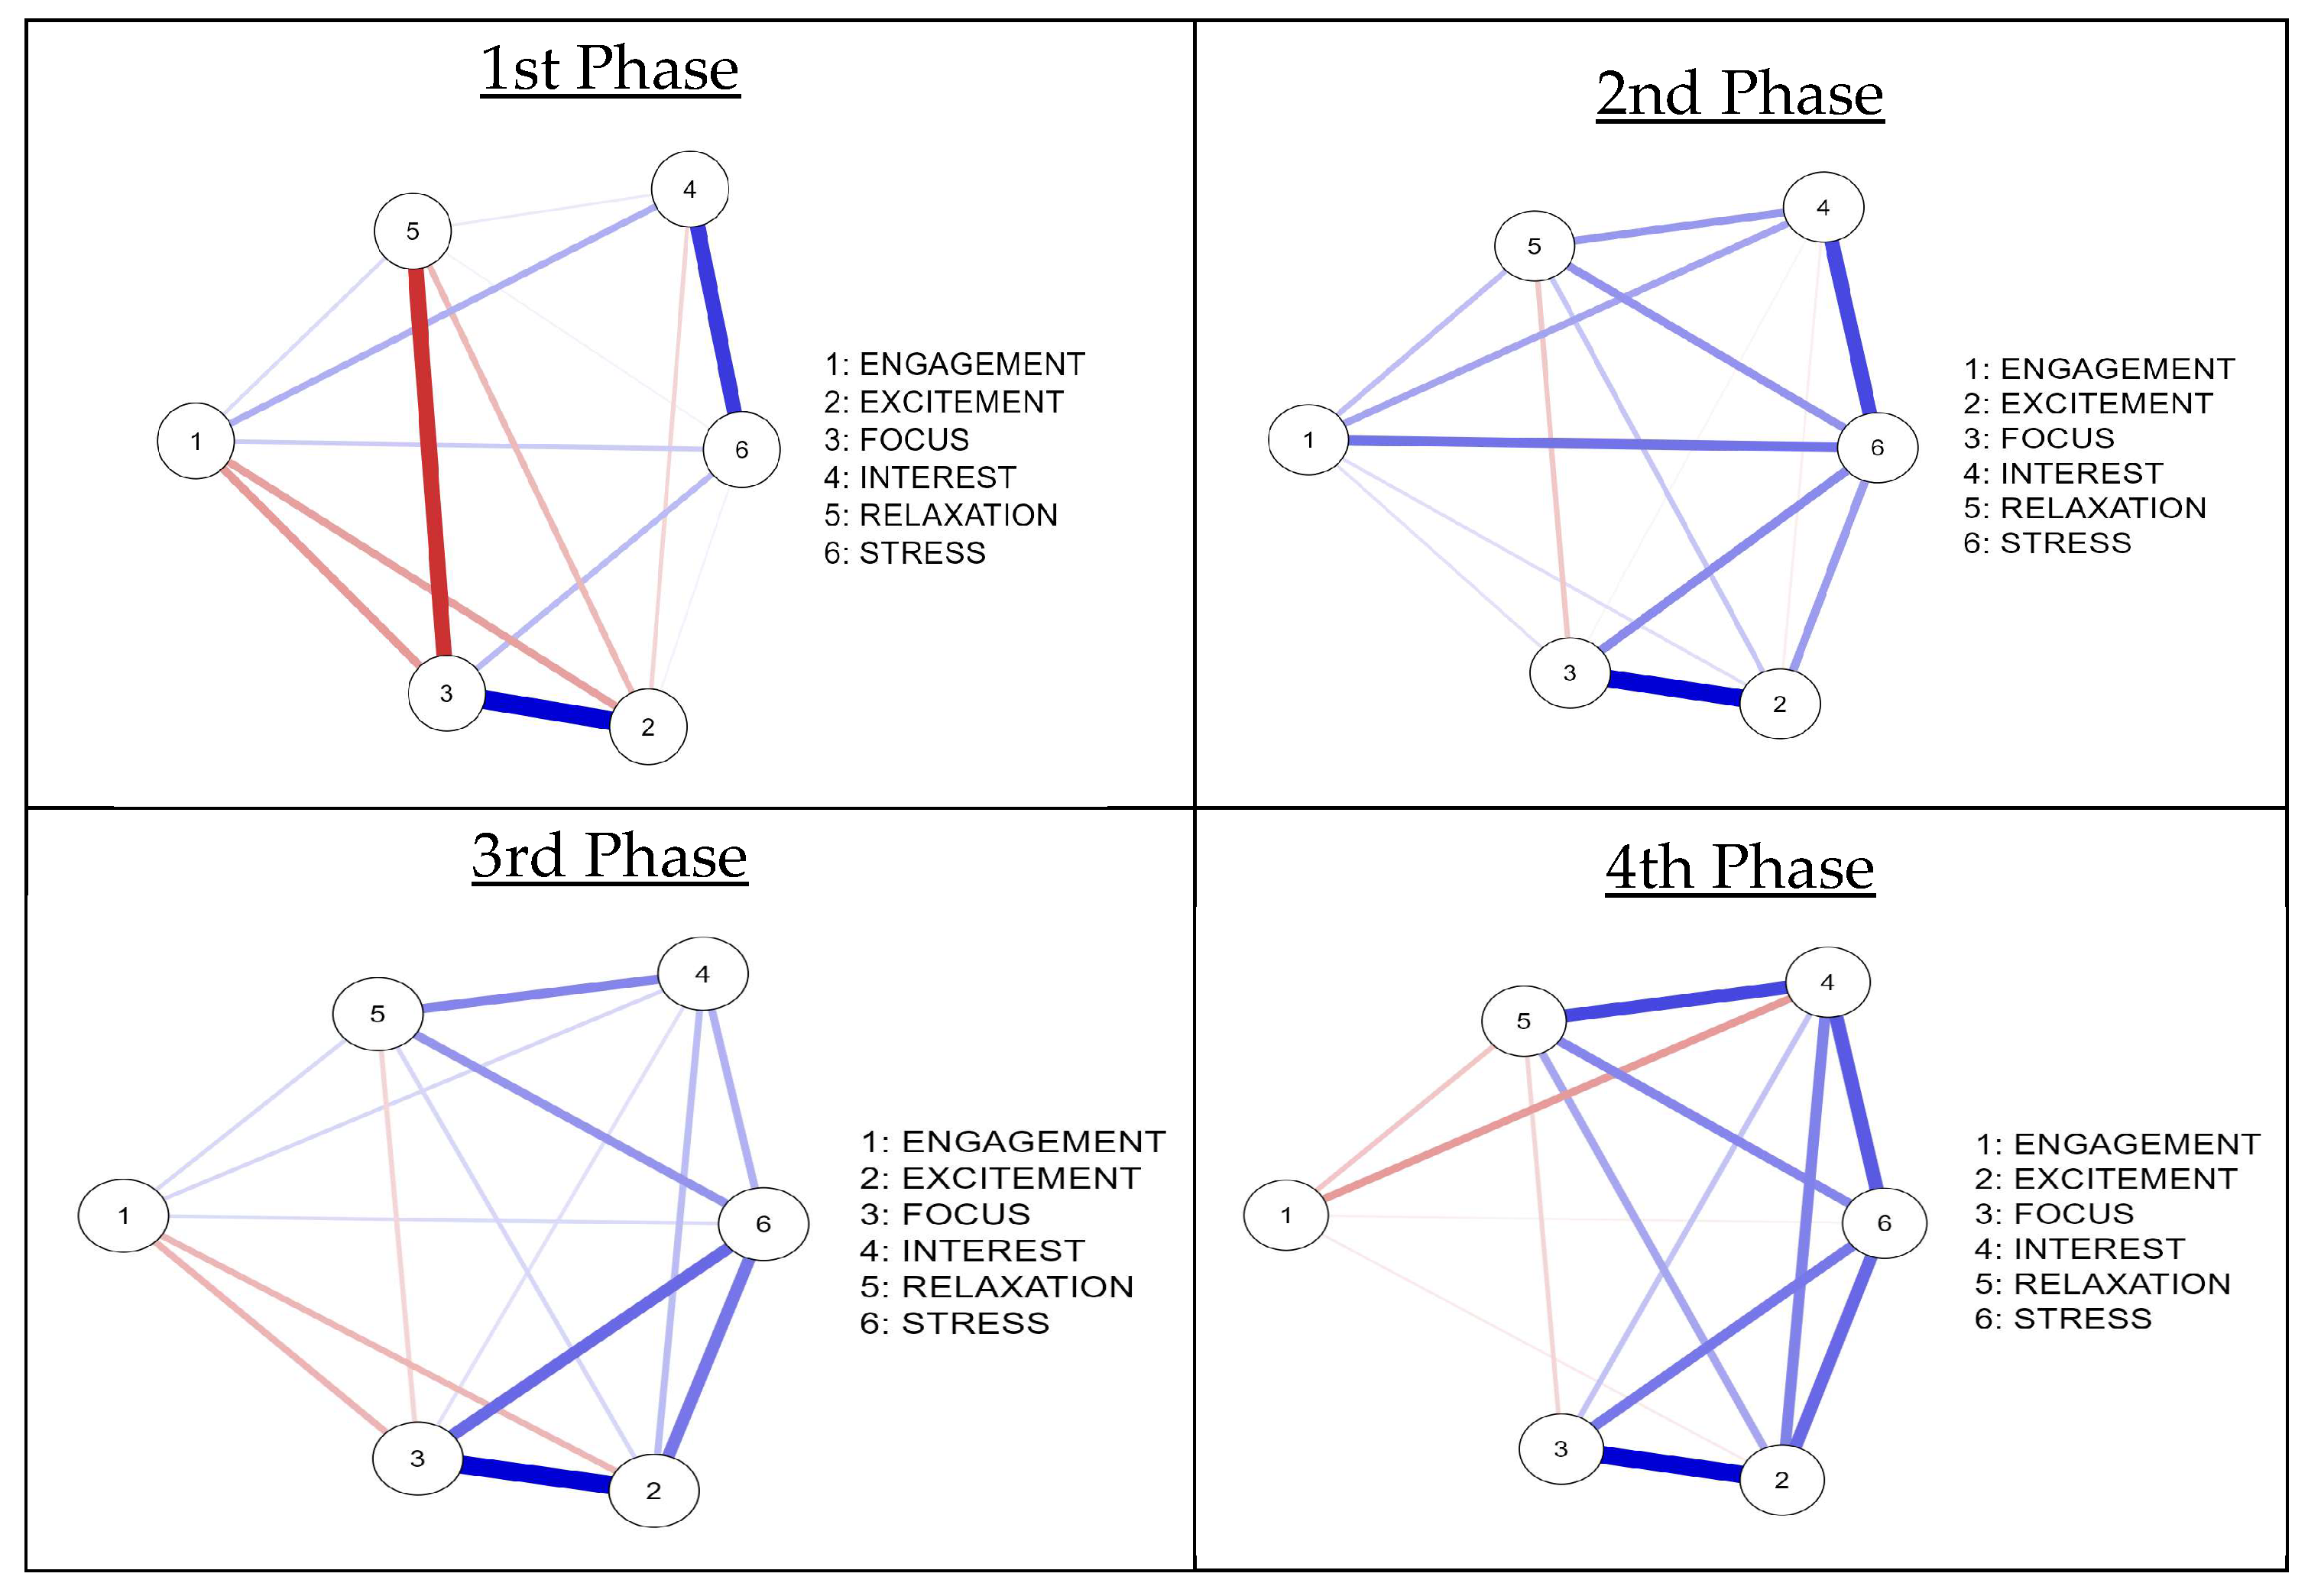
- Using the JASP software v.18.1.0, a network analysis was then attempted, where for each phase of each participant’s experimental process, the correlations of the six factors are mapped as parts of a single network, and the higher the correlation between two factors (either positive or negative), the stronger the link that is mapped. Also, through the analysis of the networks by phase, this software provides a visualization of the centrality of each factor by phase, and through this mapping, it is possible to further analyze whether each factor can influence the overall correlation network in each phase. In a network analysis, it is important to clearly define the concept of centrality. With this term, an attempt is made to identify the importance and impact that a node (an emotion in this case) has in a network [40,41,42,43]. According to the concept of centrality, each node has a value which depends on its position in the network. For this reason, different concepts categories of centrality have been developed [41,44]. (1) Degree centrality refers to the degree of importance of a node in a network. This can be defined according to its connections with as many nodes as possible. (2) Closeness centrality refers to the importance of a node in a network and is approached from the perspective of the proximity of a node to the others. (3) Betweenness centrality refers to the shortest paths that pass through a particular network node. That is, the shorter the paths that pass through a node in order to share information between them, the higher the centrality value for that node.
Time Series Analysis
4. Results
- -
- In the majority of the participants, it was observed that during the third phase of the oral test, the levels of stress were higher than those of the second phase, which concerned the written test (84.6% of participants). This practically means that the participants experienced greater difficulty during the oral examination, and that it was a more stressful situation for them than the written procedure.
- -
- When high value fluctuations were observed during the process, this resulted in a lower performance by the individual during the examination process, as reflected by his/her score. Conversely, when the stress value fluctuations were at low levels, a better performance by the individual was observed.
- -
- When stress was identified at levels higher than the other factors, the person’s performance was at a low level. Conversely, when stress values were in the low–medium range, their performance was better.
5. Discussion
Author Contributions
Funding
Institutional Review Board Statement
Informed Consent Statement
Data Availability Statement
Acknowledgments
Conflicts of Interest
References
- Chrousos, G.P. Stress and disorders of the stress system. Nat. Rev. Endocrinol. 2009, 5, 374–381. [Google Scholar] [CrossRef]
- Lu, S.; Wei, F.; Li, G. The evolution of the concept of stress and the framework of the stress system. Cell Stress 2021, 5, 76–85. [Google Scholar] [CrossRef] [PubMed]
- Goodnite, P. Stress: A concept analysis. Nurs. Forum 2014, 49, 71–74. [Google Scholar] [CrossRef]
- Chan, K.L.; Poller, W.C.; Swirski, F.K.; Russo, S.J. Central regulation of stress-evoked peripheral immune responses. Nat. Rev. Neurosci. 2023, 24, 591–604. [Google Scholar] [CrossRef]
- Lanata, A.; Valenza, G.; Greco, A.; Gentili, C.; Bartolozzi, R.; Bucchi, F.; Frendo, F.; Scilingo, E.P. How the Autonomic Nervous System and Driving Style Change with Incremental Stressing Conditions During Simulated Driving. IEEE Trans. Intell. Transp. Syst. 2015, 16, 1505–1517. [Google Scholar] [CrossRef]
- de Santos Sierra, A.; Avila, C.; del Pozo, G.; Casanova, J. Stress detection by means of stress physiological template. In Proceedings of the Third World Congress on Nature and Biologically Inspired Computing (NABIC), Salamanca, Spain, 19–21 October 2011; pp. 131–136. [Google Scholar]
- Healey, J.; Picard, R. Detecting Stress During Real-World Driving Tasks Using Physiological Sensors. IEEE Trans. Intell. Transp. Syst. 2005, 6, 156–166. [Google Scholar] [CrossRef]
- Seoane, F.; Mohino-Herranz, I.; Ferreira, J.; Alvarez, L.; Buendia, R.; Ayllón, D.; Llerena, C.; Gil-Pita, R. Wearable Biomedical Measurement Systems for Assessment of Mental Stress of Combatants in Real Time. Sensors 2014, 14, 7120–7141. [Google Scholar] [CrossRef] [PubMed]
- Mahmoud, R.; Shanableh, T.; Bodala, I.; Thakor, N.; Al-Nashash, H. Novel classification system for classifying cognitive workload levels under vague visual stimulation. IEEE Sens. J. 2017, 17, 7019–7028. [Google Scholar] [CrossRef]
- Giannakakis, G.; Grigoriadis, D.; Giannakaki, K.; Simantiraki, O.; Roniotis, A.; Tsiknakis, M. Review on Psychological Stress Detection Using Biosignals. IEEE Trans. Affect. Comput. 2022, 13, 440–460. [Google Scholar] [CrossRef]
- Yu, H.; Sano, A. Semi-supervised learning for wearable-based momentary stress detection in the wild. Proc. ACM Interact. Mob. Wearable Ubiquitous Technol. 2023, 7, 80. [Google Scholar] [CrossRef]
- Poganik, J.R.; Zhang, B.; Baht, G.S.; Tyshkovskiy, A.; Deik, A.; Kerepesi, C.; Yim, S.H.; Lu, A.T.; Haghani, A.; Gong, T.; et al. Biological age is increased by stress and restored upon recovery. Cell Metab. 2023, 35, 807–820.e5. [Google Scholar] [CrossRef] [PubMed]
- Greco, A.; Valenza, G.; Lázaro, J.; Garzón-Rey, J.M.; Aguiló, J.; de la Cámara, C.; Bailón, R.; Scilingo, E.P. Acute Stress State Classification Based on Electrodermal Activity Modeling. IEEE Trans. Affect. Comput. 2021, 14, 788–799. [Google Scholar] [CrossRef]
- Kiecolt-Glaser, J.K.; McGuire, L.; Robles, T.F.; Glaser, R. Emotions, Morbidity, and Mortality: New Perspectives from Psychoneuroimmunology. Annu. Rev. Psychol. 2002, 53, 83–107. [Google Scholar] [CrossRef] [PubMed]
- Sternberg, E.M.; Chrousos, G.P.; Wilder, R.L.; Gold, P.W. The Stress Response and the Regulation of Inflammatory Disease. Ann. Intern. Med. 1992, 117, 854–866. [Google Scholar] [CrossRef] [PubMed]
- Popovic, D.; Lavie, C.J. Stress, Cardiovascular Diseases and Exercise—A Narrative Review. Hear. Mind 2023, 7, 18–24. [Google Scholar] [CrossRef]
- Špiljak, B.; Vilibić, M.; Glavina, A.; Crnković, M.; Šešerko, A.; Lugović-Mihić, L. A review of psychological stress among students and its assessment using salivary biomarkers. Behav. Sci. 2022, 12, 400. [Google Scholar] [CrossRef] [PubMed]
- Ouda, S.; Alaki, S.; Safi, M.A.; Nadhreen, A.; Johani, K.A. Salivary stress biomarkers–Are they predictors of academic assessment exams stress. J. Clin. Exp. Pathol. 2016, 15, 276–279. [Google Scholar]
- O’Connor, D.B.; Thayer, J.F.; Vedhara, K. Stress and health: A review of psychobiological processes. Annu. Rev. Psychol. 2021, 72, 663–688. [Google Scholar] [CrossRef]
- Glaser, R.; Kiecolt-Glaser, J.K. Stress-induced immune dysfunction: Implications for health. Nat. Rev. Immunol. 2005, 5, 243–251. [Google Scholar] [CrossRef] [PubMed]
- Orovas, C.; Sapounidis, T.; Volioti, C.; Keramopoulos, E. Eeg in education: A scoping review of hardware, software, and methodological aspects. Sensors 2024, 25, 182. [Google Scholar] [CrossRef]
- Böckenholt, U. Measuring response styles in Likert items. Psychol. Methods 2017, 22, 69–83. [Google Scholar] [CrossRef] [PubMed]
- Allen, A.; Kennedy, P.; Cryan, J.; Dinan, T.; Clarke, G. Biological and psychological markers of stress in humans: Focus on the trier social stress test. Neurosci. Biobehav. Rev. 2014, 38, 94–124. [Google Scholar] [CrossRef]
- Allen, A.; Kennedy, P.; Dockray, S.; Cryan, J.; Dinan, T.; Clarke, G. The trier social stress test: Principles and practice. Neurobiol. Stress 2017, 6, 113–126. [Google Scholar] [CrossRef] [PubMed]
- Vrenken, H.; Vos, E.K.; van der Flier, W.; Sluimer, I.C.; Cover, K.S.; Knol, D.L.; Barkhof, F. Validation of the automated method VIENA: An accurate, precise, and robust measure of ventricular enlargement. Hum. Brain Mapp. 2014, 35, 1101–1110. [Google Scholar] [CrossRef]
- Mozos, O.M.; Sandulescu, V.; Andrews, S.; Ellis, D.; Bellotto, N.; Dobrescu, R.; Ferrandez, J.M. Stress Detection Using Wearable Physiological and Sociometric Sensors. Int. J. Neural Syst. 2017, 27, 1650041. [Google Scholar] [CrossRef] [PubMed]
- Balsamo, M.; Romanelli, R.; Innamorati, M.; Ciccarese, G.; Carlucci, L.; Saggino, A. The State-Trait Anxiety Inventory: Shadows and Lights on its Construct Validity. J. Psychopathol. Behav. Assess. 2013, 35, 475–486. [Google Scholar] [CrossRef]
- EMOTIV. 2024. Available online: https://shorturl.at/YzUsm (accessed on 15 September 2024).
- Badcock, N.A.; Mousikou, P.; Mahajan, Y.; de Lissa, P.; Thie, J.; McArthur, G. Validation of the Emotiv EPOC®EEG gaming system for measuring research quality auditory ERPs. PeerJ 2013, 1, e38. [Google Scholar] [CrossRef] [PubMed]
- Hairston, W.; Whitaker, K.; Ries, A.; Vettel, J.; Cortney- Bradford, J.; Kerick, S.; McDowell, K. Usability of four commercially- oriented EEG systems. J. Neural Eng. 2014, 11, 046018. [Google Scholar] [CrossRef]
- Ekandem, J.I.; Davis, T.A.; Álvarez, I.; James, M.T.; Gilbert, J.E. Evaluating the ergonomics of bci devices for research and experimentation. Ergonomics 2012, 55, 592–598. [Google Scholar] [CrossRef] [PubMed]
- Hossain Faruk, M.J.; Valero, M.; Shahriar, H. An Investigation on Non-Invasive Brain-Computer Interfaces: Emotiv Epoc+ Neuroheadset and Its Effectiveness. In Proceedings of the 2021 IEEE 45th Annual Computers, Software, and Applications Conference (COMPSAC), Madrid, Spain, 12–16 July 2021; pp. 580–589. [Google Scholar] [CrossRef]
- Fouad, I.A. A robust and reliable online P300-based BCI system using Emotiv EPOC + headset. J. Med Eng. Technol. 2021, 45, 94–114. [Google Scholar] [CrossRef] [PubMed]
- Sumak, B.; Spindler, M.; Pusnik, M. Design and development of contactless interaction with computers based on the Emotiv EPOC+ device. In Proceedings of the 2017 40th International Convention on Information and Communication Technology, Electronics and Microelectronics (MIPRO), Opatija, Croatia, 22–26 May 2017; pp. 576–581. [Google Scholar] [CrossRef]
- Avdimiotis, S.; Konstantinidis, I.; Stalidis, G.; Stamovlasis, D. Coping with Examination Stress: An Emotion Analysis. Sensors 2024, 24, 4297. [Google Scholar] [CrossRef] [PubMed]
- Azcarraga, J.; Marcos, N.; Suarez, M.T. Modelling EEG signals for the prediction of academic emotions. In Workshop on Utilizing EEG Input in Intelligent Tutoring Systems (ITS2014 WSEEG); University of Montreal: Montreal, QC, Canada, 2014. [Google Scholar]
- EMPATICA. 2024. Available online: https://e4.empatica.com/e4-wristband (accessed on 15 September 2024).
- Garbarino, M.; Lai, M.; Bender, D.; Picard, R.; Tognetti, S. Empatica E3—A wearable wireless multi-sensor device for realtime computerized biofeedback and data acquisition. In Proceedings of the 2014 4th International Conference on Wireless Mobile Communication and Healthcare-Transforming Healthcare Through Innovations in Mobile and Wireless Technologies (MOBIHEALTH), Athens, Greece, 3–5 November 2014; pp. 39–42. [Google Scholar]
- Boucsein, W. Electrodermal Activity; Springer: New York, NY, USA, 2012. [Google Scholar]
- Valente, T.W.; Coronges, K.; Lakon, C.; Costenbader, E. How correlated are network centrality measures? Connect 2008, 28, 16–26. [Google Scholar]
- Borgatti, S. Centrality and network flow. Soc. Netw. 2005, 27, 55–71. [Google Scholar] [CrossRef]
- Wasserman, S.; Faust, K. Social Network Analysis: Methods and Applications; Cambridge University Press: New York, NY, USA, 1994. [Google Scholar]
- Freeman, L. Centrality in social networks: Conceptual clarification. In Social Networks: Critical Concepts in Sociology; Routledge: London, UK, 1979; pp. 215–239. [Google Scholar]
- Daly, E. Investigation of localised centrality metrics for collaborative networks: What can they reveal? In Artificial Intelligence and Cognitive Science; Springer: Berlin/Heidelberg, Germany, 2010; pp. 41–50. [Google Scholar]
- Barooah, R. Physiology of emotion. In Application of Biomedical Engineering in Neuroscience; Springer: Berlin/Heidelberg, Germany, 2019; pp. 415–435. [Google Scholar] [CrossRef]
- Barthélemy, M. Betweenness centrality in large complex networks. Eur. Phys. J. B 2004, 38, 163–168. [Google Scholar] [CrossRef]
- Evans, T.S.; Chen, B. Linking the network centrality measures closeness and degree. Commun. Phys. 2022, 5, 172. [Google Scholar] [CrossRef]
- Borsboom, D.; Cramer, A.O.J. Network Analysis: An Integrative Approach to the Structure of Psychopathology. Annu. Rev. Clin. Psychol. 2013, 9, 91–121. [Google Scholar] [CrossRef] [PubMed]
- Bröhl, T.; Lehnertz, K. A straightforward edge centrality concept derived from generalizing degree and strength. Sci. Rep. 2022, 12, 4407. [Google Scholar] [CrossRef]
- Robinaugh, D.J.; Millner, A.J.; McNally, R.J. Identifying highly influential nodes in the complicated grief network. J. Abnorm. Psychol. 2016, 125, 747–757. [Google Scholar] [CrossRef] [PubMed]
- Fonseca-Pedrero, E.; Ortuño, J.; Debbané, M.; Chan, R.C.K.; Cicero, D.C.; Zhang, L.C.; Brenner, C.A.; Barkus, E.; Linscott, R.J.; Kwapil, T.R.; et al. The Network Structure of Schizotypal Personality Traits. Schizophr. Bull. 2018, 44 (Suppl. S2), S468–S479. [Google Scholar] [CrossRef]
- Brooks, A. Get excited: Reappraising pre-performance anxiety as excitement. J. Exp. Psychol. Gen. 2014, 143, 1144–1158. [Google Scholar] [CrossRef]


| Centrality Measures per Variable (Average Values) | ||||
|---|---|---|---|---|
| Network | ||||
| Variable | Betweenness | Closeness | Strength | Expected Influence |
| Engagement | −0.52 | −1.811 | −1.843 | −1.663 |
| Excitement | −0.52 | 0.343 | 0.571 | 0.555 |
| Focus | 0.104 | 0.664 | 0.654 | −0.207 |
| Interest | −0.52 | −0.024 | −0.088 | 0.492 |
| Relaxation | −0.52 | −0.225 | −0.191 | −0.396 |
| Stress | 1.977 | 1.053 | 0.897 | 1.219 |
Disclaimer/Publisher’s Note: The statements, opinions and data contained in all publications are solely those of the individual author(s) and contributor(s) and not of MDPI and/or the editor(s). MDPI and/or the editor(s) disclaim responsibility for any injury to people or property resulting from any ideas, methods, instructions or products referred to in the content. |
© 2025 by the authors. Licensee MDPI, Basel, Switzerland. This article is an open access article distributed under the terms and conditions of the Creative Commons Attribution (CC BY) license (https://creativecommons.org/licenses/by/4.0/).
Share and Cite
Konstantinidis, I.; Avdimiotis, S.; Sapounidis, T. Evaluation of Academic Stress Employing Network and Time Series Analysis on EEG Data. Information 2025, 16, 86. https://doi.org/10.3390/info16020086
Konstantinidis I, Avdimiotis S, Sapounidis T. Evaluation of Academic Stress Employing Network and Time Series Analysis on EEG Data. Information. 2025; 16(2):86. https://doi.org/10.3390/info16020086
Chicago/Turabian StyleKonstantinidis, Ioannis, Spyros Avdimiotis, and Theodosios Sapounidis. 2025. "Evaluation of Academic Stress Employing Network and Time Series Analysis on EEG Data" Information 16, no. 2: 86. https://doi.org/10.3390/info16020086
APA StyleKonstantinidis, I., Avdimiotis, S., & Sapounidis, T. (2025). Evaluation of Academic Stress Employing Network and Time Series Analysis on EEG Data. Information, 16(2), 86. https://doi.org/10.3390/info16020086