Abstract
This work presents an innovative method for detecting the respiratory patterns of subjects walking on a treadmill, by leveraging the capabilities of deep learning (DL) technologies and a dual-radar setup. The study aims to overcome the challenge of accurately capturing respiratory rates in subjects performing body movements, a scenario less addressed in prior studies. By employing two radars operating at GHz for motion mitigation, this study compares the efficacy of dual-radar configurations against a single-radar setup. The study employs DL algorithms based on convolutional autoencoders to mitigate the low-quality demodulated radar signals by reconstructing the respiratory signal. The models are trained with data from a single subject and data from 15 subjects, attaining average absolute errors of and Respiration Per Minute (RPM), respectively, allowing to conclude that the use of DL algorithms enhances the accuracy of respiratory signal detection when compared with arctangent demodulation, even in cases where radar data contain minimal information regarding vital signals.
1. Introduction
Vital signs are important medical measurements of the physiological functions of living beings. They are important indicators of a subject’s health and/or well-being, as their monitoring can lead to the early detection of health degradation and aid in diagnosis decisions [1]. These play a crucial part in hospital environments, where the continuous monitoring of vital signs plays a crucial role in the early detection and even the prediction of conditions that may affect the well-being of the patient; in-house environments, where the monitoring of such measures can help individuals keep track of their health and detect any changes that may require medical attention; and another crucial environment is during sports or exercise practice. It can help the practitioner understand how their body is functioning and responding to physical activity, allowing for exercise or intensity adjustment to achieve better results. Cardiopulmonary signs monitoring during the practice of exercises is of paramount importance to not only ensure safety but also to optimize performance. As reviewed in [2], the respiratory rate is one of the most important vital signs to be monitored during exercises, as it is an indicator closely related to effort and associated with exercise tolerance. The respiratory rate, unlike other physiological signs, presents a rapid response to exercise, making it a good parameter to evaluate exertion. Additionally, in [3], a long-term study showed that increased physical activity is linked to a reduction in all-cause mortality. A lot of attention has been paid to the use of radar systems in health monitoring, due to the availability of both low-cost radar devices and computationally efficient algorithms for processing their measurements and their ability for the contactless monitoring of a subject, being flexible to operate in various scenarios where it is unadvised or uncomfortable to wear monitoring devices. Despite this, these systems face the challenge of retrieving accurate vital sign measurements when body motion (BM) is present. A wide range of research has been conducted to mitigate the interference from body movements. Three approaches can be distinguished: traditional signal processing, machine learning algorithms, and hardware-based solutions. Within the first category, techniques such as Bootstrap-Based Generalized Warblet Transform [4] and Empirical Mode Decomposition [5] have been employed, making use of their time–frequency analysis for mitigating disturbances caused by radar motion. Additionally, methods such as active noise cancellation [6], and matched filters [7] have been employed to detect vital signs in the presence of small body movements like swaying. Furthermore, Continuous Wave (CW) and Impulse-Radio Ultra-Wideband (IR-UWB) radar systems for measuring respiratory rates in scenarios with small body movement [8,9], using arctangent demodulation, were employed. As for the ML approaches, references [10,11] employed deep learning algorithms in unrestricted and restricted body movement scenarios. Furthermore, reference [12] adapted Google’s MobileNetV3 for exercise-related signal processing.
Hardware solutions, including the development of dual-radar configurations [13,14,15] and the integration of radar with camera systems [16,17] were used to capture both body movements and vital signs, with one piece of equipment focusing on the movement modulation, allowing to distinguish movement from vital signs. To detect vital signs in walking subjects, other techniques were also tested, such as Continuous Wave Frequency-Locked Loop (FLL) [18], as well as Self-Injection-Locked (SIL) and Mutual Injection-Locked (MIL) [19].
Radar technology has also been employed to characterize physical activities and in the monitoring of exercises involving multiple subjects [20,21].
This study addresses the gap in vital sign detection using radar in a situation where body movement is always present. It introduces a simple dual Continuous Wave (CW) radar architecture for remotely acquiring respiratory signals in subjects walking on a treadmill, and using the data to train DL algorithms. The method aims to explore the problem of body movement in vital signs acquisition using radar, tackling movement-related distortions and reconstructing respiratory signals. This paper is divided into the following sections: proposed architecture and algorithms, Section 2; experiments and results, Section 3; and conclusion and future works, Section 4.
2. Architecture and Algorithms
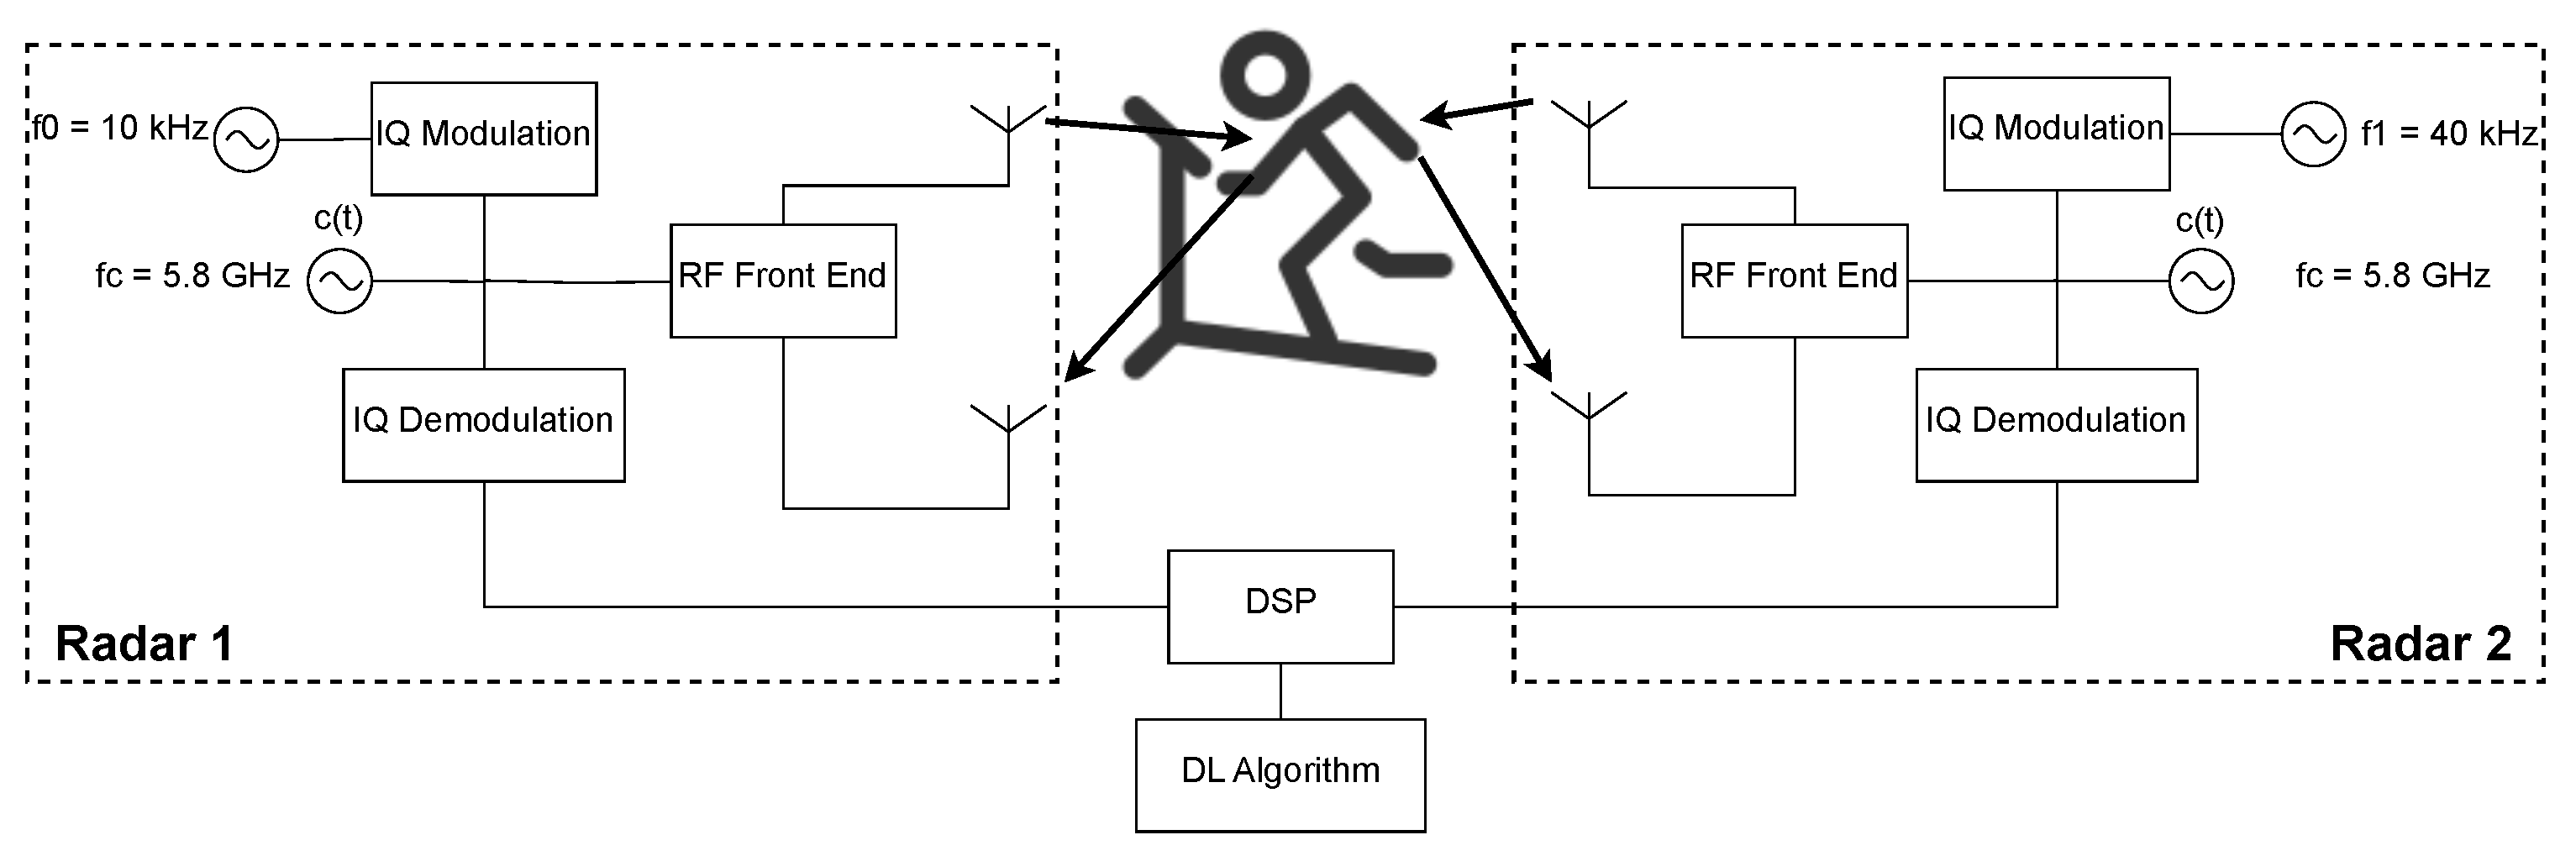
The architecture presented in this paper uses a Dual Continuous Wave (CW) Radar, shown in Figure 1, taking inspiration from the proposed architectures of [13,14], and uses DL for the vital signs reconstruction. The radars are placed facing the front and the back of the subject at chest height and distanced 60 cm from the subject.
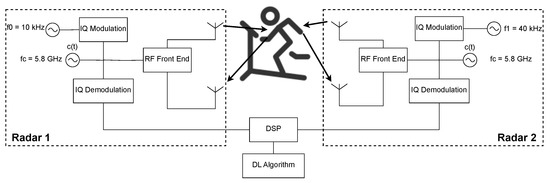
Figure 1.
Dual-Radar architecture used for data acquisition.
The system is composed of two Continuous Wave radars that use a GHz carrier, with both the transmitter and receiver of each radar placed in the front or in the back of the subject, aiming at the same point on the chest. The RF signals are digitally created with intermediate frequencies of kHz and kHz to avoid interference between each radar. These RF signals are then In-Phase and Quadrature (IQ) modulated. In the reception part, the received signal, sampled at a frequency of kHz, is IQ demodulated and passed to the baseband. Before the phase extraction, using the arctangent demodulation (AT), and because the respiratory frequency presents a narrowband of low frequencies, signal decimation is performed by a factor of .
The hardware used is a Software Defined Radio (SDR) USRP B210 FPGA developed by Ettus Research [22].
The software used for programming the board is the GNU Radio software, version 3.10.8.0, which allows for a highly customizable framework, and the digital processing part is conducted in Matlab 2024a and follows the next set of steps:
- Loading the complex signals acquired from the radars;
- Apply a 5 kHz low-pass FIR filter to the signals to avoid interference;
- Decimate the signals;
- Synchronize the radar signals with the ground truth data;
- Identify and isolate the part of the signal where the movement was performed;
- DC offset removal;
- Apply arctangent demodulation.
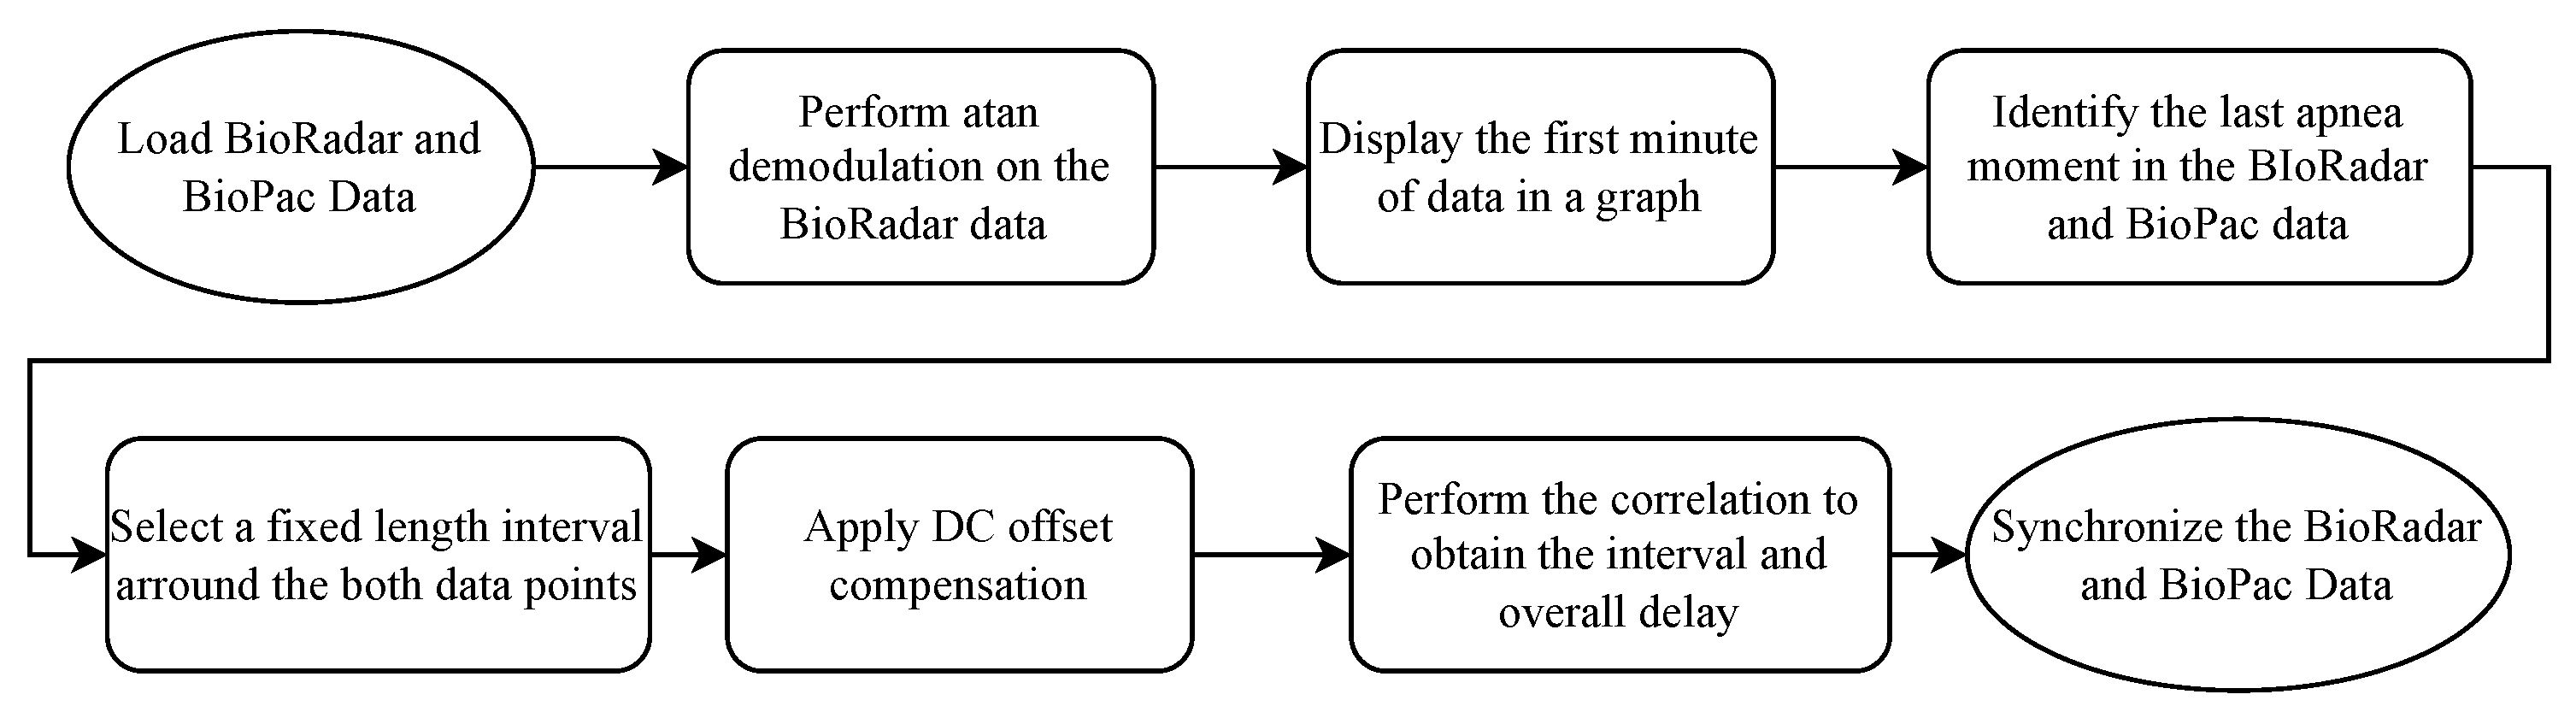
For reconstructing the respiratory signal via the signals acquired by the radars, a ground truth signal has to be obtained. For this purpose, a system called BioPac [23] and a transducer respiratory band used in the subjects’ chest are used. Since the radar and ground truth acquisition system do not present any synchronization mechanism, a protocol and algorithm are employed for such an effect.
The protocol encompasses a subject performing three quick heavy breaths followed by 10-s apnea followed by normal breathing for 30 s, creating a very distinct pattern from the rest of the signal, both in the BioPac and in the radar. Then, a synchronization algorithm is employed. The algorithm can be seen in Figure 2.
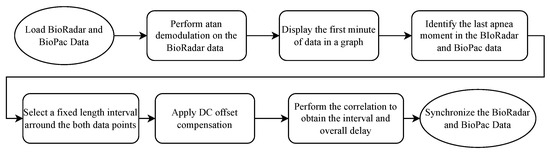
Figure 2.
Block code diagram of the synchronization algorithm.
For the purpose of respiratory signal acquisition under the heavy movement present in a scenario where a subject is walking on a treadmill, two different approaches are studied. The first approach is to directly add the demodulated signals, acquired from the front- and back-faced radars. The theory behind it is that the back- and front-faced radars would perceive the movement with opposite phases and amplitudes; that way, when adding the signals, the movement would be canceled out and, since the rib cage expands with different amplitudes in the front and in the back, the respiratory component would not cancel out. The other approach taken is the employment of DL networks. Simple architectures such as Multilayer Perceptron (MLP) and Long Short-Term Memory (LSTM) have been used for the frequency estimation of noisy speech or music signals [24]; additionally, Recurrent Neural Networks (RNNs) have also been used for signal frequency estimation [25]. Furthermore, Electrocardiogram (ECG) signal reconstruction using radar and DL algorithms was achieved in [26].
Two networks, titled CAE and MODWT, depicted in Figure 3, are trained with two different inputs. The inputs differ on the data used for training (two radars’ data, where both the front- and back-faced radar data are used; or one radar data, where only the data from the front-faced radar are used). The aim is to study if, by including more information, the model will benefit and output better results or if the use of only one radar is enough and reliable.
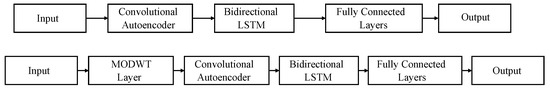
Figure 3.
Models used for signal reconstruction. Top: convolutional autoencoder (CAE) network. Bottom: maximal overlap discrete wavelet transform (MODWT) network.
The convolutional autoencoder (CAE) and the Bidirectional Long Short-Term Memory (BiLSTM) layers serve the same purpose in both networks. Specifically, the CAE is employed for high-frequency noise removal and signal pattern capture, while the BiLSTM shapes the signal. A more detailed description of the networks and the synchronization protocol can be found in [27].
Autoencoders are machine learning models designed to reconstruct an input as closely as possible at the output. They are composed of two main components: the encoder and the decoder. The encoder maps the input data to a lower-dimensional representation using non-linear transformations, and the decoder reconstructs the data by applying another non-linear transformation. In the proposed networks, convolutional layers form the foundation of the autoencoders. Convolutional Neural Networks (CNNs) are particularly advantageous for reducing parameters, extracting key features, minimizing overfitting risk, and improving generalization.
In a convolutional autoencoder (CAE), the encoder consists of convolutional and pooling (downsampling) layers, while the decoder comprises deconvolutional and upsampling layers. CAEs have been effectively applied in various domains, including data compression [28], noise reduction in speech signals [29], medical image denoising [30], and ECG noise reduction [31].
Given the temporal nature of vital signs, incorporating layers capable of storing temporal information is beneficial. For this purpose, the BiLSTM layer is employed. Unlike standard LSTM, which processes input only in the forward direction (from past to future), BiLSTM processes input in both the forward and backward directions. BiLSTM has demonstrated its utility in tasks such as speech enhancement [32], EEG-based mental workload estimation [33], and social signal classification using speech datasets [34].
The networks also include tanh activation layers, which enable the modeling of complex non-linear relationships between inputs and outputs. These layers are zero-centered, differentiable, and allow gradients to propagate effectively through the network. Additionally, dropout layers are incorporated as a regularization technique to mitigate overfitting, while normalization layers ensure input normalization at each layer, reducing the risk of slow convergence and further overfitting.
Both proposed networks use the same layer parameters, differing only in the first layer after the input. Specifically, the MODWT layer (maximal overlap discrete wavelet transform) decomposes the input signal into its frequency components, facilitating the selection of the most suitable components for the task. The base parameters of the CAE network are detailed in Table 1.

Table 1.
Base network parameters.
The next section will focus on the experiments conducted and the respective results.
3. Experiments and Results
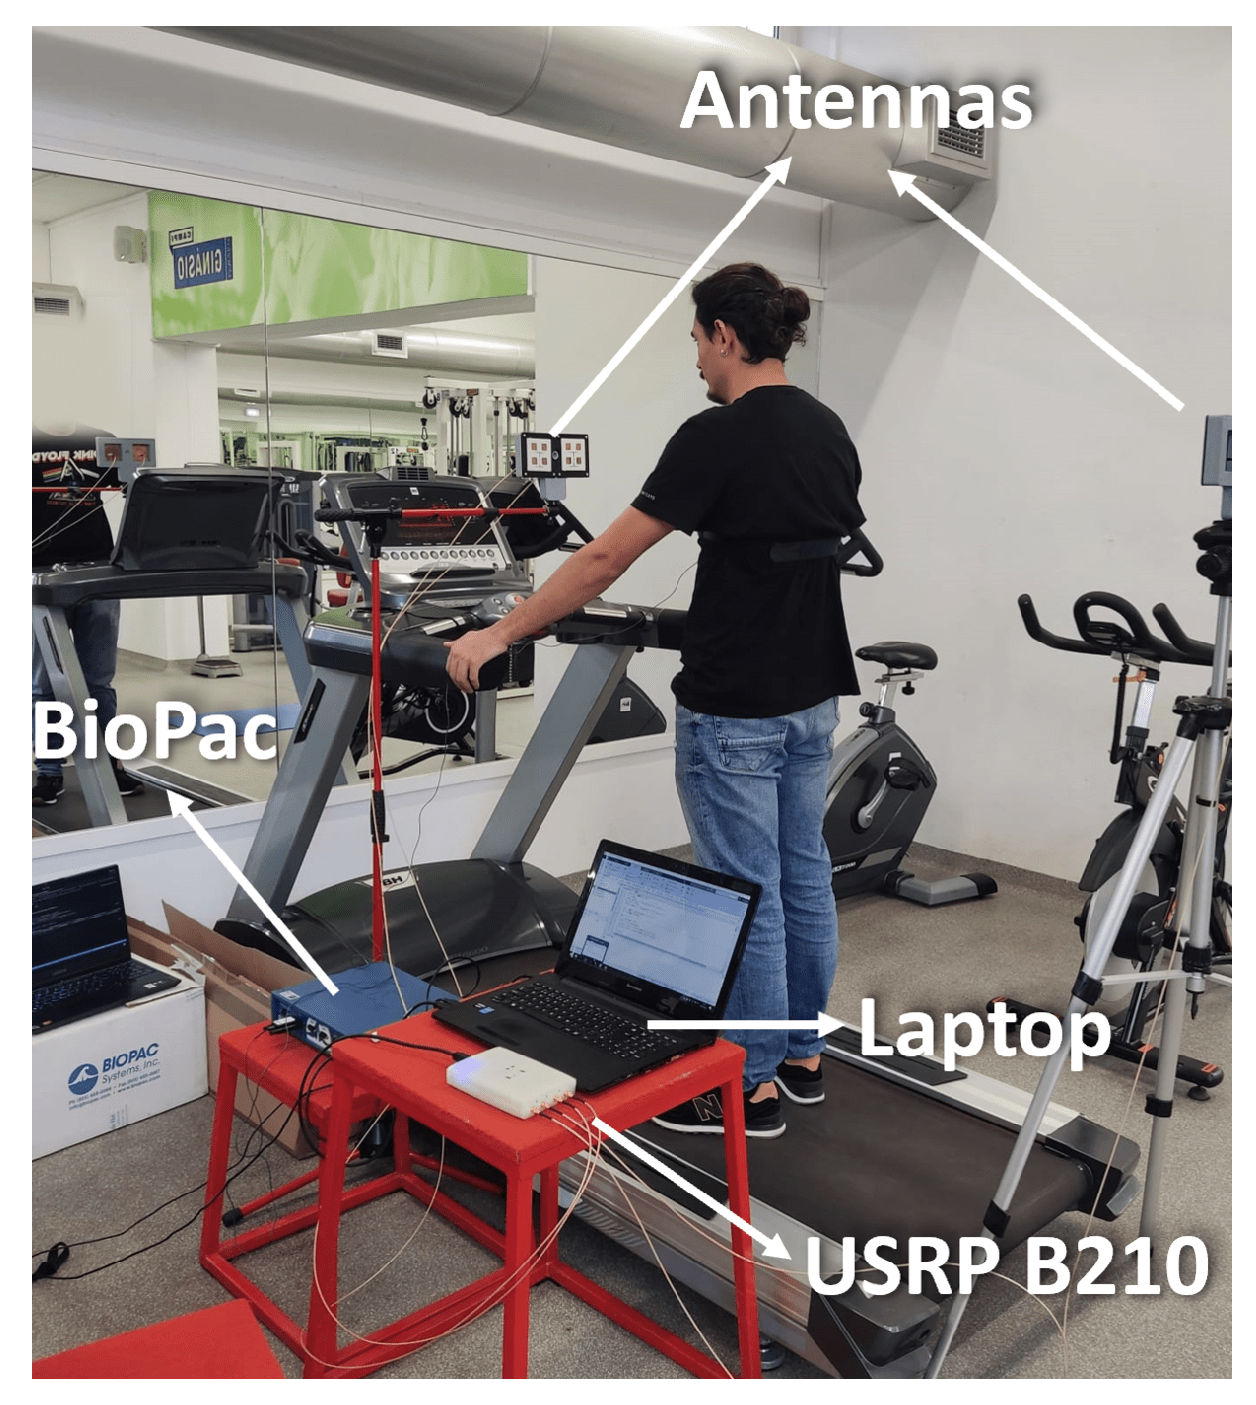
The tests on the treadmill are conducted gradually in order to understand the interference of body movement in the respiratory signal acquisition. For that, the first results are obtained with tests encompassing one subject. Furthermore, only when the method is proven for a single subject are the experiments extended to include more subjects. The setup used during these tests can be observed in Figure 4.
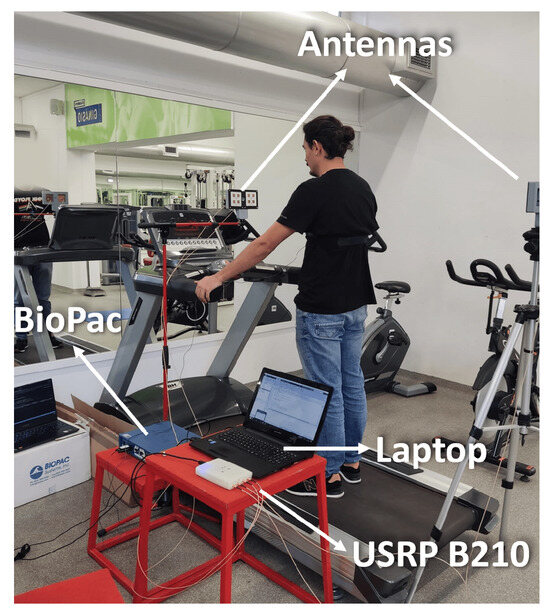
Figure 4.
Experiential setup: Biopac, Antennas, Laptop, and USRP B210.
This setup uses the hardware mentioned in the architecture section. The supports are not on the treadmill in order to reduce the shakes from the subject walking on the treadmill. Additionally, the supports are placed so that the antennas’ heights are similar to one another, focusing on the same point of the subject. For ground truth signal acquisition, the BioPac is used. To allow for signal synchronization and the temporal identification of where the movement is performed, every subject considered is asked, in every experience, to perform the following steps:
- Synchronization protocol;
- Breathing while standing still for thirty seconds;
- Walk for five minutes at a speed of 2 km/h ( m/s);
- Breathing while standing still for thirty seconds.
As for the walking moment, the subjects are asked to keep their hands on the treadmill bars to try to mitigate the dislocation within the treadmill.
3.1. Signal Addition for Movement Compensation
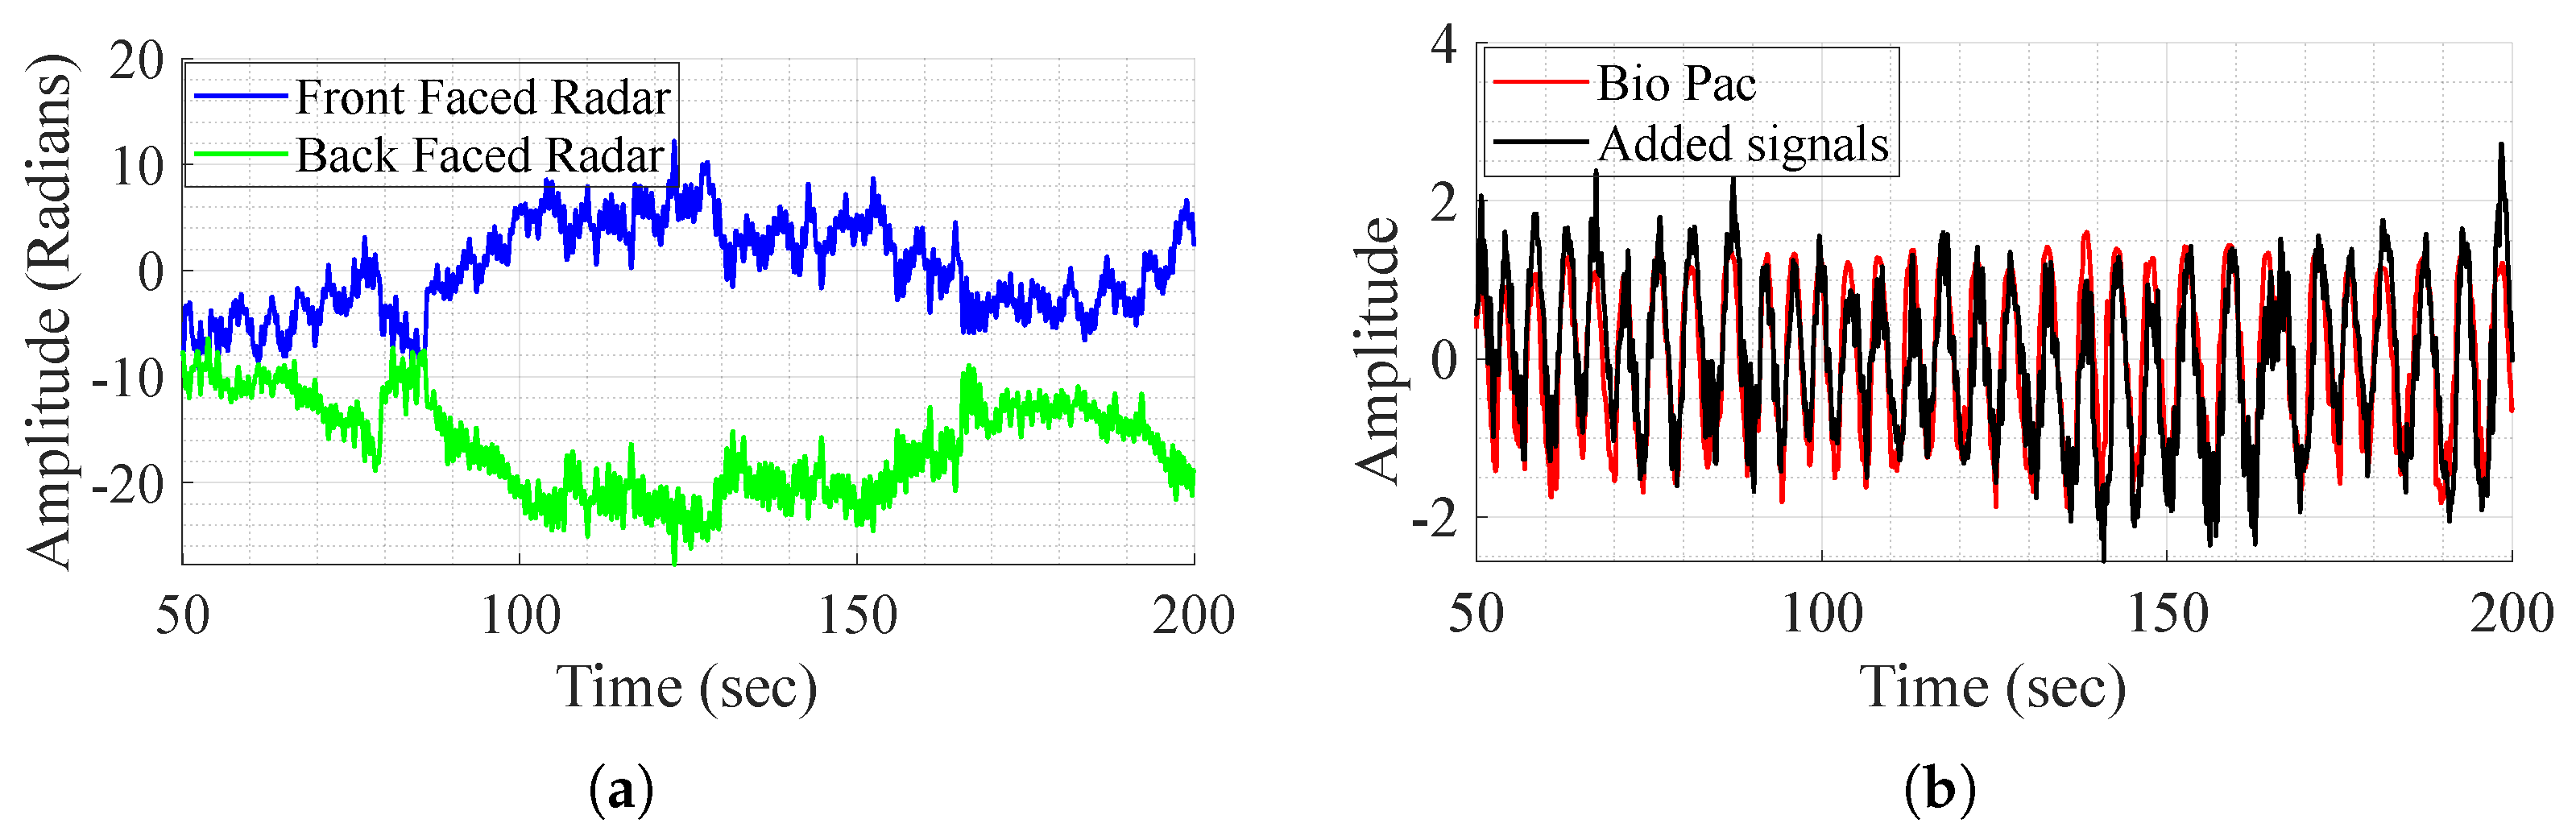
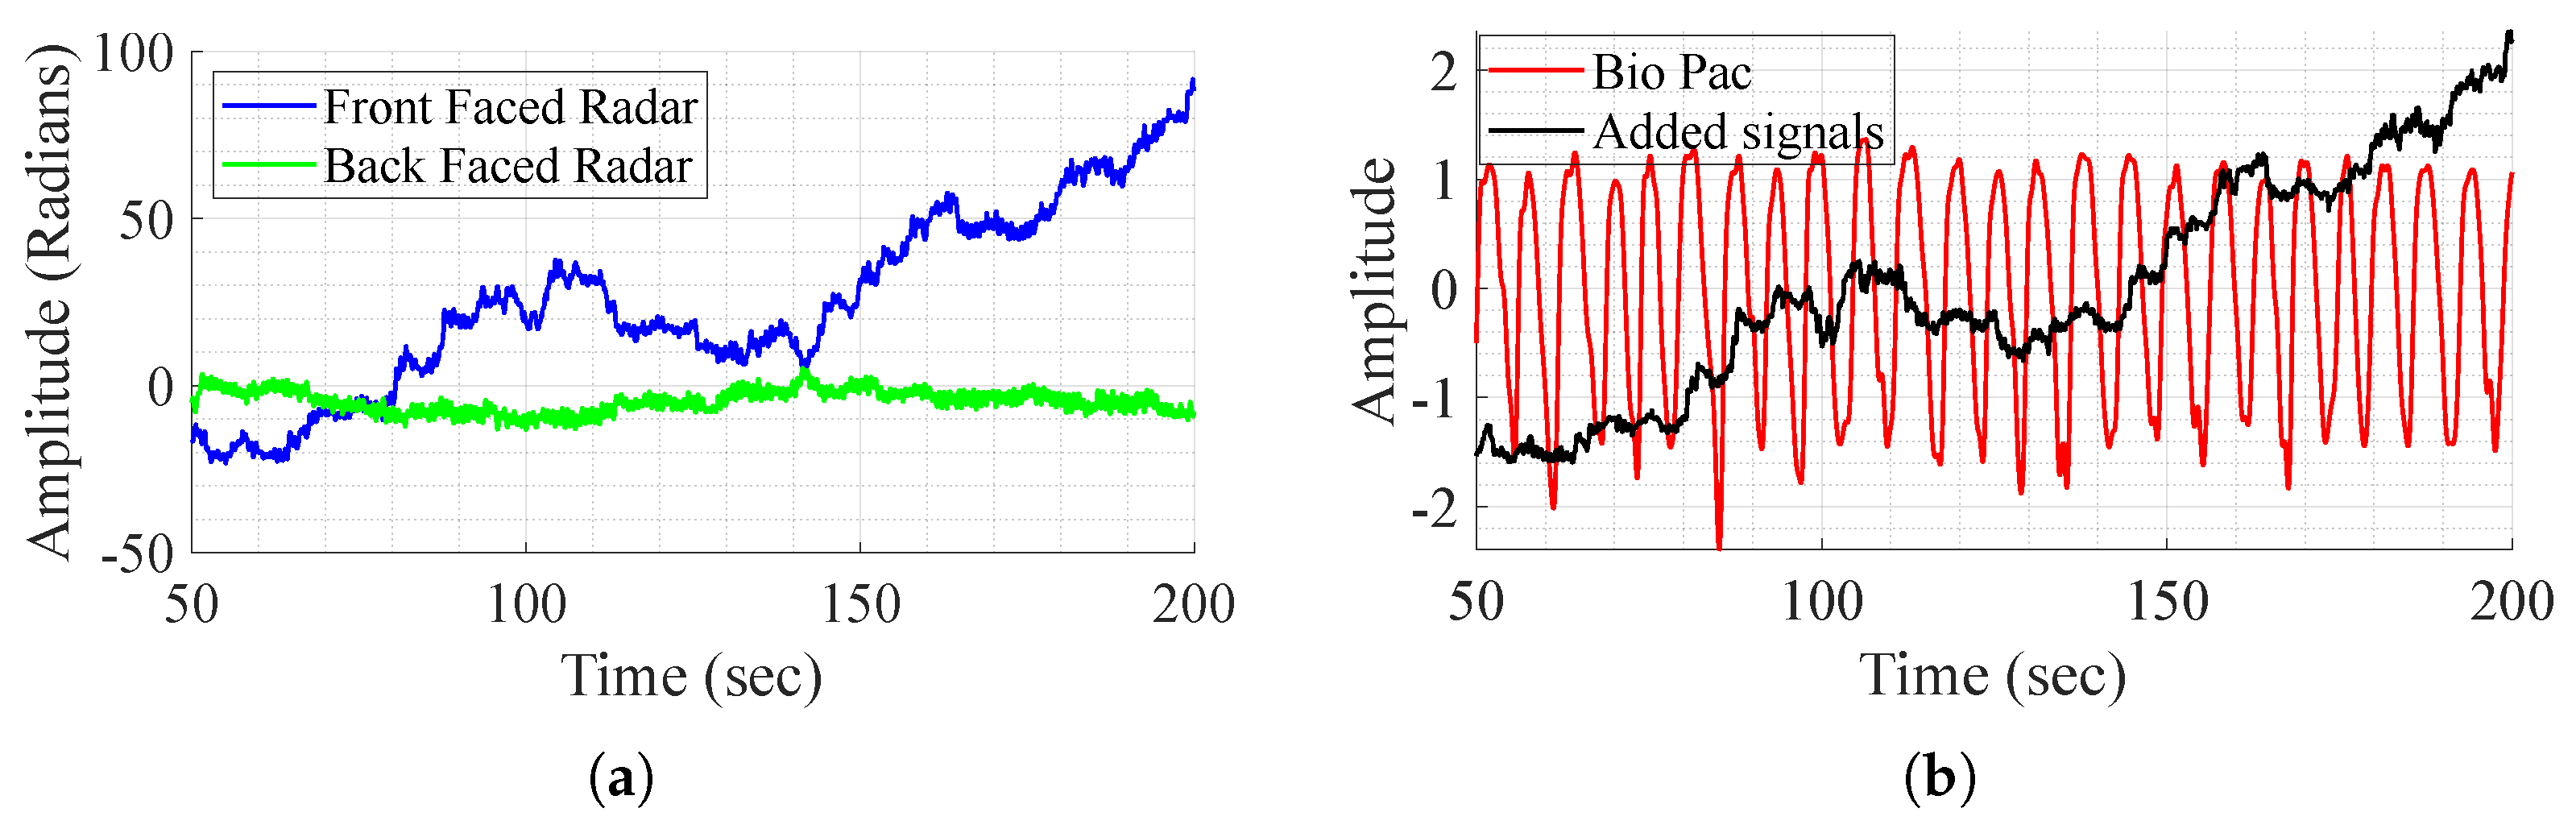
As mentioned before, the direct addition of the demodulated signals aims to remove the body movement, as it is perceived with opposite phases and amplitudes by the radars. The method is tested on one subject that performs different experiences and shows successful results in some experiences and fails to achieve the same in others as shown in Figure 5. In this figure, it is clear that in some cases, movement compensation can be performed, as the demodulated back and front radars present opposite phases and magnitude (Figure 5a), and in some cases it does not work as in Figure 6. Although the exact reason for the method’s failure is not definitive, two major factors appear to play a crucial role. First, body motion is inherently non-linear—subjects, or even the same subject in different tests, tend to walk in varying manners. This variability leads to differences in how movement is perceived by the front and back channels, which are not mirrored. As a result, adding the demodulated signals does not produce the expected respiratory waveform. Furthermore, in most tests, as perceived in Figure 6a, the individual channels do not consistently provide meaningful information regarding vital signs. To address these challenges, DL techniques are employed for signal reconstruction.

Figure 5.
BioPac signal, demodulated front and back radars’ acquired signal, and the sum of the signals, in the case where it works. (a) Demodulated signal from the front and back radars. (b) Signal addition and BioPac.
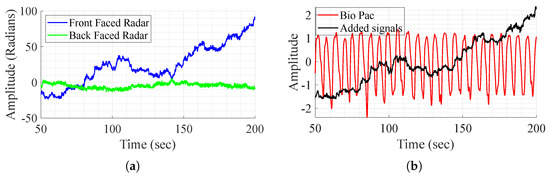
Figure 6.
BioPac signal, demodulated front and back radars’ acquired signal, and sum of the signals, in the case where it does not work. (a) Demodulated signal from the front and back radars. (b) Signal addition and BioPac.
3.2. One Subject Acquisition and Training
For a proof of concept, in the initial stages, the DL algorithms are only evaluated on one subject, allowing for the validation of the algorithms when applied to a single subject, before expanding the experience to multiple subjects.
The two previously mentioned networks are assessed with one input (only considering the signals acquired from the front radar) and two inputs (considering both radar signals). Testing with one subject allows for the collection of an extensive dataset. The dataset for the single subject presents 105 min of radar signal acquired while walking on the treadmill. These data are partitioned into segments of approximately 41 s segments (4096 samples each) and divided for training (), testing (), and validation (). The method for frequency estimation and subsequent error analyses is Welch’s method of Power Spectral Density (PSD). In this case, the signal is divided by 8 windows with 50% overlap and using points for frequency, resulting in mHz precision. Network optimization is not performed since the objective of testing with only one subject is to prove the concept.
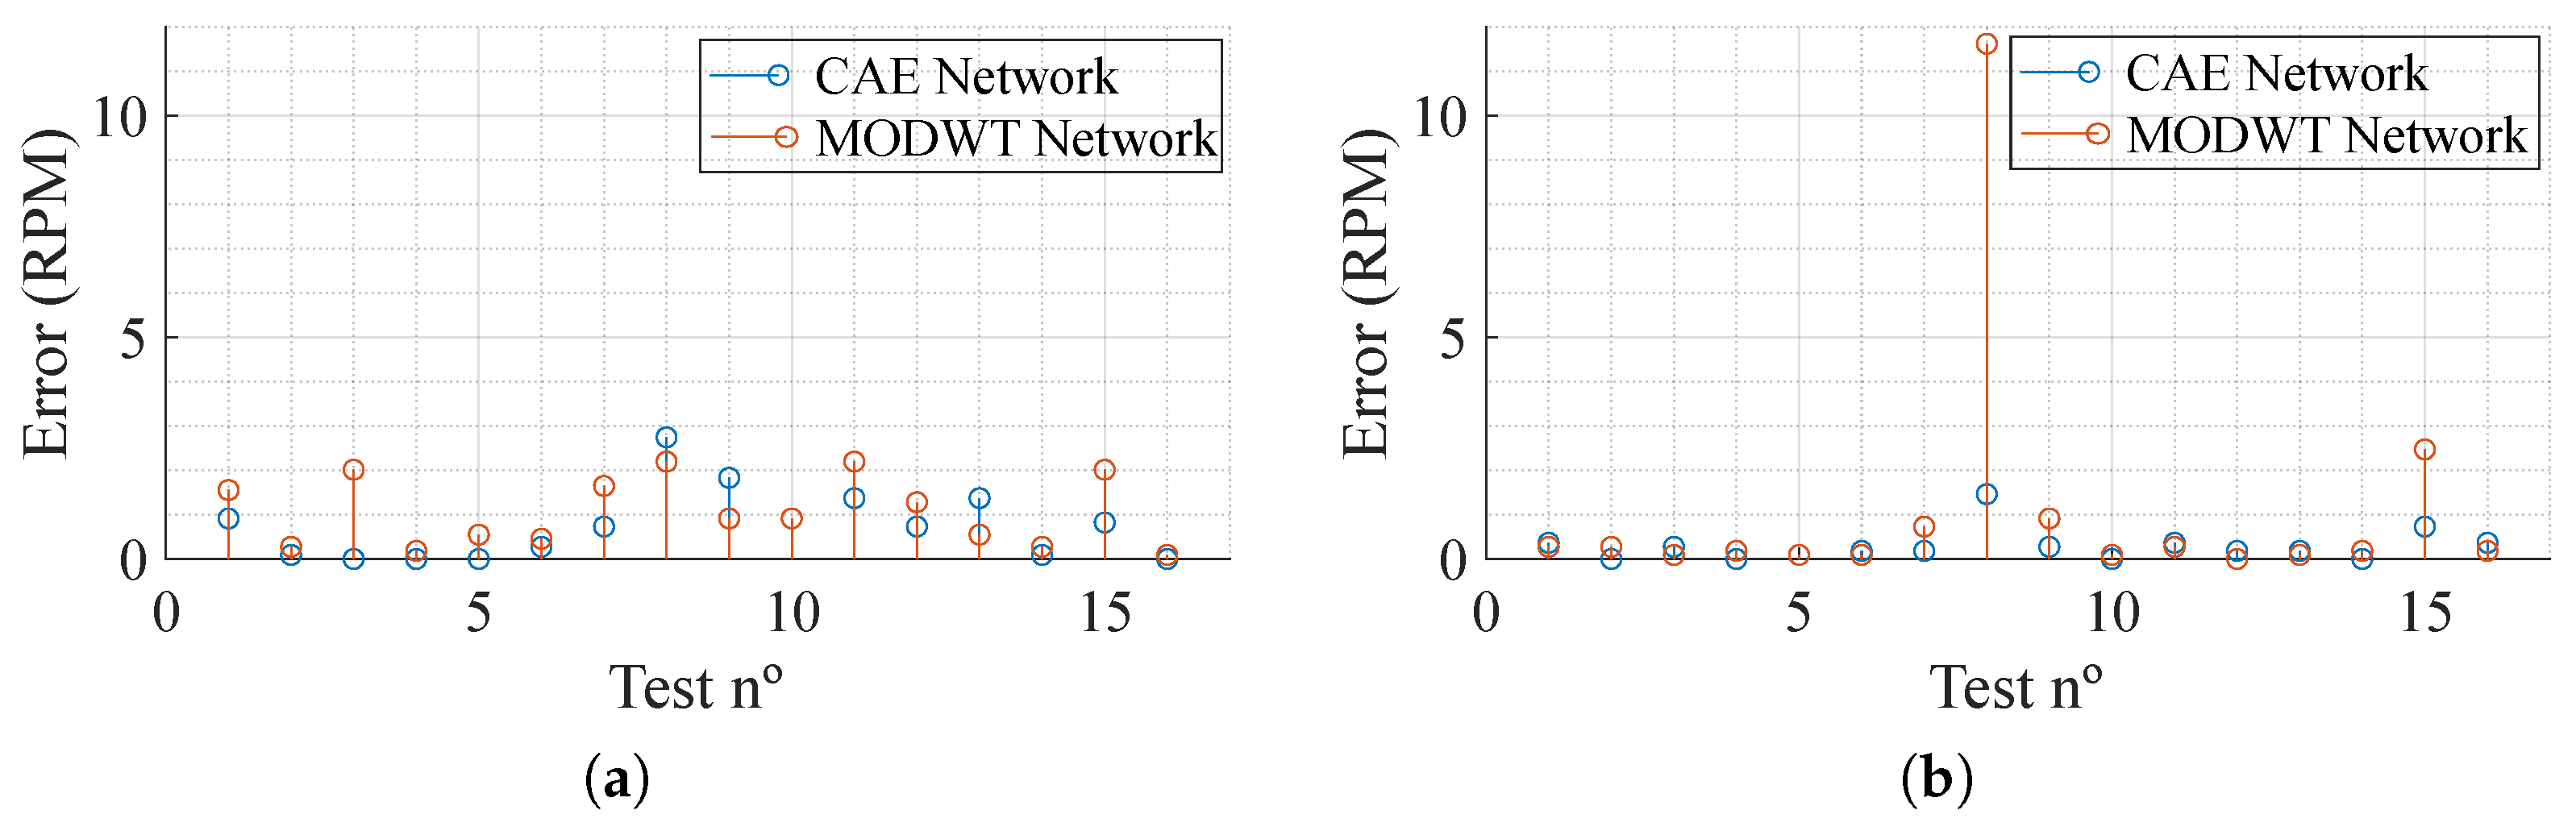
As for the results, shown in Table 2, it can be acknowledged that the impact of using two radars is dependent on the network being used. It is also clear that the MODWT network, in both cases, displays the worst performance. Overall, both networks present a low absolute error, showing great performance when it comes to movement compensation. Figure 7 presents the absolute error, in Respiration Per Minute (RPM), per test (a total of 16 segments reconstructed) trained with one and two inputs. It can be noted that, with the exception of test number 8 in the networks trained with data from both radars, using the MODWT network, the overall results present low error. Furthermore, the CAE network provides better results, presenting a maximum absolute error of and RPM for one-radar and two-radar data training, respectively, which, considering the situation where it is being employed, is a low maximum absolute error.
Table 2.
Network results for 1 subject.
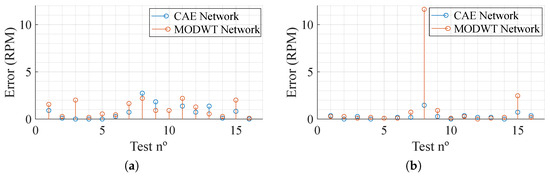
Figure 7.
Absolute error of the test dataset in Respiration Per Minute (RPM). (a) One radar. (b) Two radars.
3.3. Multiple Subject Acquisition and Training
After validating the method for a single subject, more subjects are considered. The study has been approved by the Ethics and Deontology Committee of the University of Aveiro, Portugal (No. 10-CED/2023), and each subject has signed a document giving their informed consent. Each subject performs four experiments, where they walk for five minutes. Each test allows for the retrieval of min of a signal during movement, representing 14 min of movement per subject. In this study, 15 subjects of different genders and ages (20 to 50) are considered. Table 3 depicts the subjects’ age, gender, and Body Mass Index (BMI). The latter is a widely accepted indicator for classifying individuals based on their weight relative to height. These categories, defined by the World Health Organization (WHO), include underweight (), healthy weight (), overweight (), obesity (), and severe obesity () [35]. The inclusion of BMI in this study is important, as body composition and individual physiology can affect the reflection and modulation of radar signals, underscoring the need to consider these factors to better understand the the impact of a subject’s physical characteristics on the system performance.
Table 3.
Subjects’ characteristics description.
The same networks are considered and are trained using data from all the subjects, creating a general model. After splitting each experience into approximately 41-s segments, two approaches to train the models are taken. One is where the same models are trained using a data partition of each subject dataset, and another is where the CAE model is trained using the leave-one-out method. For the first approach, the data partition for each subject is , , and for training, validation, and testing, respectively. This data segmentation allows the model to have more data from each subject for training. This means that each subject has 16 segments for training, 2 for validation, and 2 for testing. As for the second approach, the model is trained 15 times, always leaving data from one subject for testing.
3.3.1. 80-10-10 Data Split Method
The approach taken is similar to the one used for a single subject, where the two networks are assessed using data from one and two radars. The results from different dimensional inputs can be perceived in Table 4.
Table 4.
Network results for multiple subjects.
In this section, given the high inter-variability between subjects, not only is the absolute error assessed but also the relative error.
From Table 4, it can be verified that using a bigger dimension input does not present a clear advantage over using only data acquired from the front radar. The Wilcoxon signed-rank test is applied to the error distributions obtained from the CAE network trained with one input and two inputs, as well as from the MODWT network trained with one input and two inputs. The resulting p-values are for the CAE network and for the MODWT network, indicating that the inclusion of data from a second radar provides a slight advantage.
When comparing the CAE and MODWT networks, for one dimension (using only the front-faced radar), the CAE one provides the lowest error. For that reason, the rest of this subsection will focus only on the CAE network, its development, and data from the front-faced radar. For exploring the impact of the CAE network structure, several networks are derived from the CAE network. The changes in these networks are mostly on the number of autoencoders, number of BiLSTM layers, dropout layers probability, and number of fully connected layers, as well as the hidden layers within. These parameters are manually changed, resulting in experimenting with eleven different networks. Of these eleven different networks, the one that provides the best results is a four-stacked convolutional autoencoder (4CAE) followed by a BiLSTM layer, a dropout layer, and an LSTM layer with 10 hidden layers each, ending up with 3 fully connected layers with 128 hidden layers each. Despite providing the best results, the computational load for training is substantially higher, taking around 172 min to train, 3.5 times greater than the time needed to train the CAE network. Since training networks take a long time, parameter optimization is only conducted in the latter network, 4CAE, and in the CAE network.
To improve the results, hyperparameter tuning is performed. The strategy adopted is Bayesian optimization that uses a probabilistic model, called a Gaussian process, to approximate the unknown function and guide the search for the best point. It also uses an acquisition function, which balances exploration and exploitation, to decide where to sample next. The hyperparameters studied are the filter number, size, and stride, for the convolutional autoencoder, the number of hidden layers in the BiLSTM layer, the number of hidden layers of the fully connected layers, and the dropout probability between them. The optimization runs for 30 experiences with no time limit and the error function to be minimized is the overall average percentage error across all subjects. The hyperparameter optimization results in the best overall average percentage error of for the CAE and for the 4CAE networks, indicating that when both are optimized, the higher complexity from the 4CAE network does not present a significant improvement. Additionally, the trained simpler network is tested with the training data, presenting a medium error of RPM and an average error of %, proving that, despite the overfit, the method proves to be effective in the signal reconstruction.
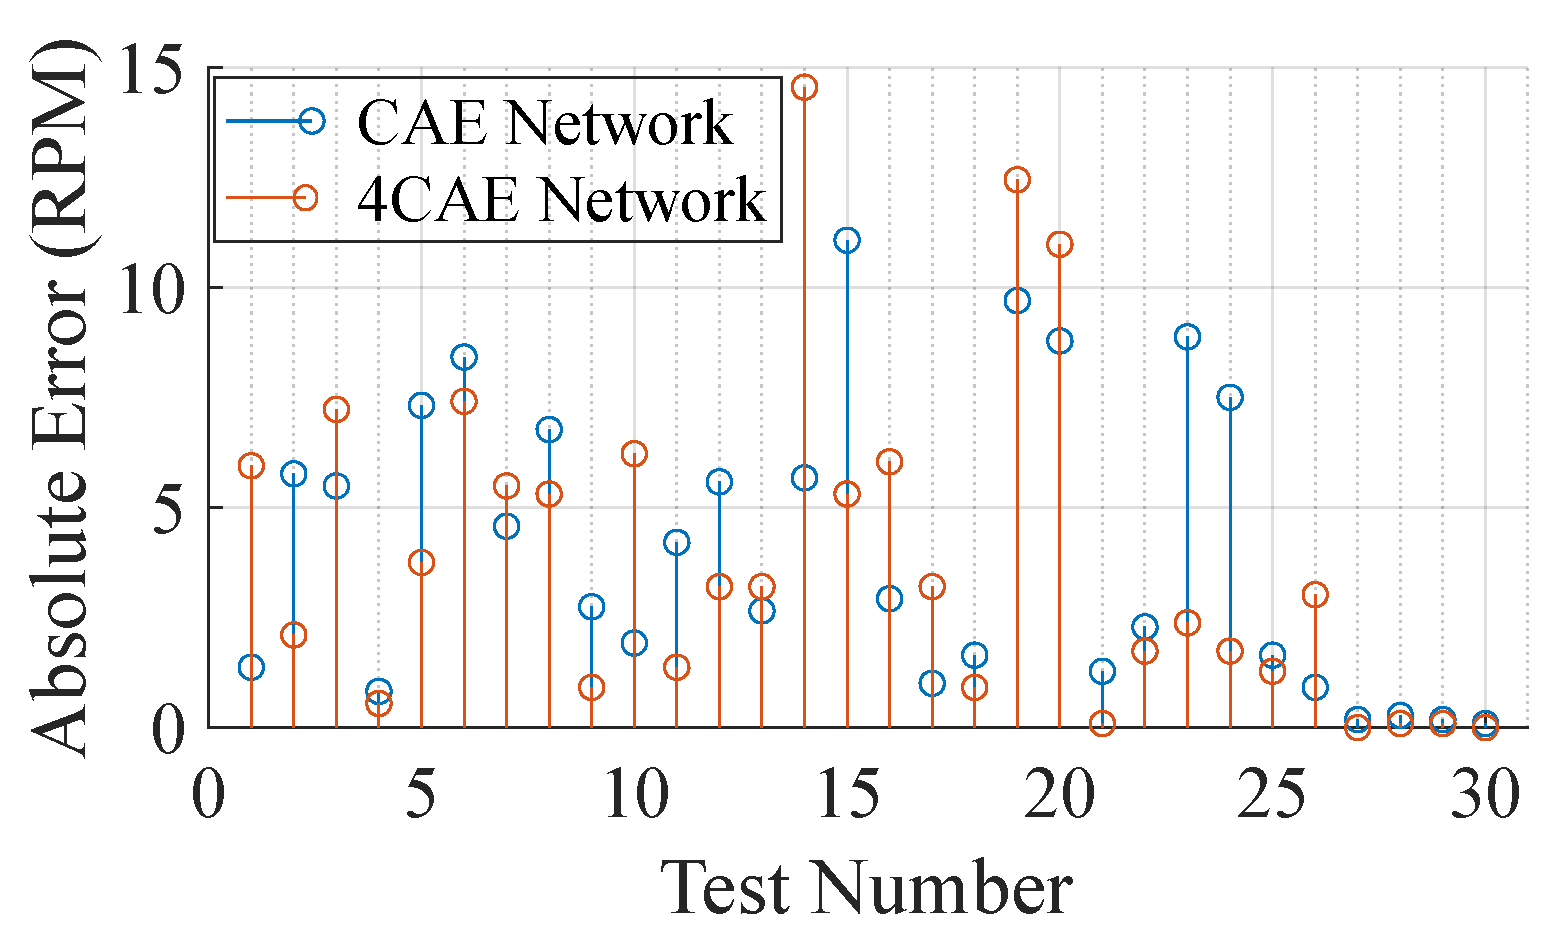
Figure 8 compares the reconstruction error from both networks across the 30 segments from the subjects. It is clear, by Figure 8, that even though the networks do not present similar results, the overall average error is similar, being RPM and RPM from the CAE and 4CAE networks, respectively. To understand the different results from the networks, a more extensive evaluation is concluded. Table 5 demonstrates the overall average respiratory frequency for each subject as well as the average test dataset frequency from the ground truth and from the respective networks mentioned previously.
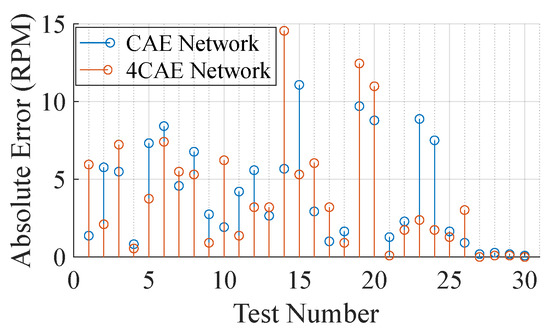
Figure 8.
Absolute error per test in RPM.
Table 5.
BioPac and network results from each subject.
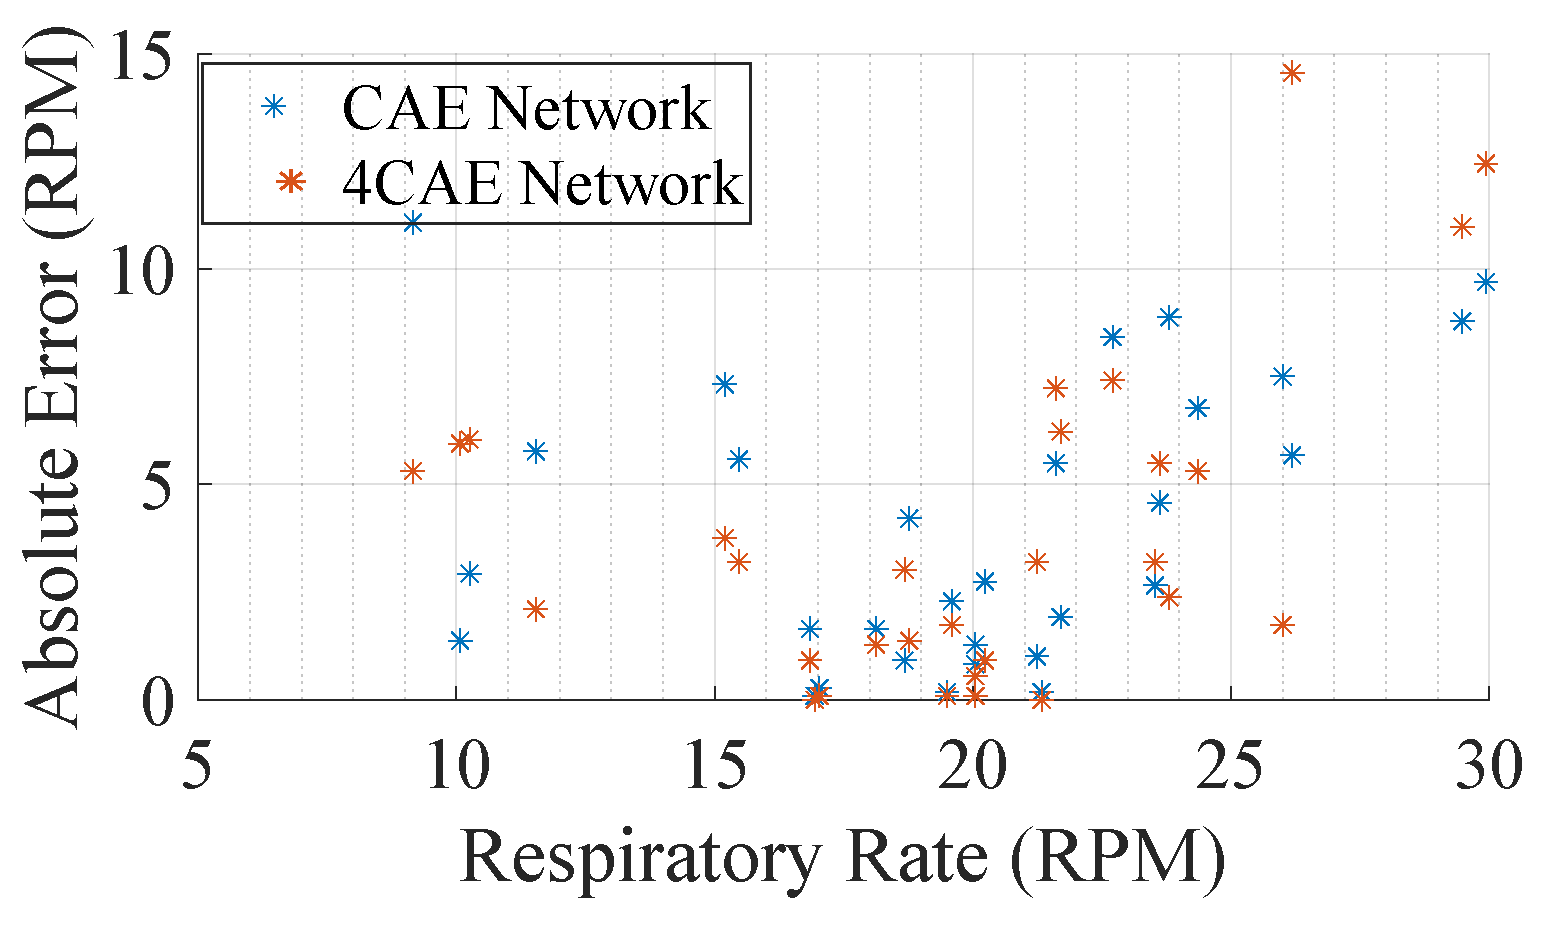
From Table 5, not much can be concluded to support how errors fluctuate; however, one main conclusion that can be drawn from it is that the all-around average set of the BioPac frequency is around 19.77 RPM and that the overall frequency obtained through the signal reconstruction networks are 18.47 RPM and 18.19 RPM from the CAE and 4CAE networks, respectively. This can be explained by how machine learning models work as they try to generalize the solution; hence, the average frequency attained from the networks is close to the average obtained from BioPac. This can be also perceived in Figure 9, where it can be concluded that for respiration rates close to the average, the errors are lower.
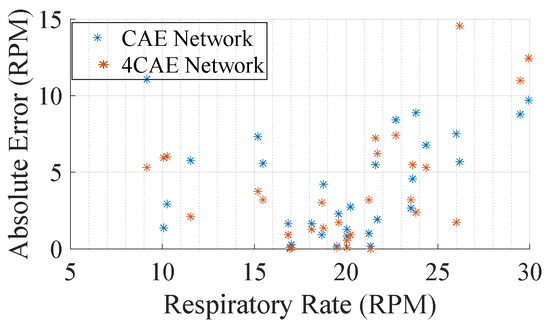
Figure 9.
Average absolute error by subjects’ average respiration rate.
To test whether there are significant differences in error values across the BMI groups, one-way ANOVA is performed independently for CAE errors and 4CAE errors. The results of the ANOVA for CAE errors yield an F-statistic of 1.14 and a p-value of 0.35. Since the p-value is greater than the significance threshold of 0.05, the null hypothesis cannot be rejected, indicating no statistically significant differences in CAE errors across BMI groups. A similar analysis for 4CAE errors results in an F-statistic of 0.65 and a p-value of 0.54, again demonstrating no significant variation between the BMI categories. The Healthy group shows slightly greater variability in both CAE and 4CAE errors, while the Overweight group has minimal variability, as no subject from that group is included in this study. These findings suggest that BMI grouping does not significantly influence the observed error values, at least within the limited sample analyzed.
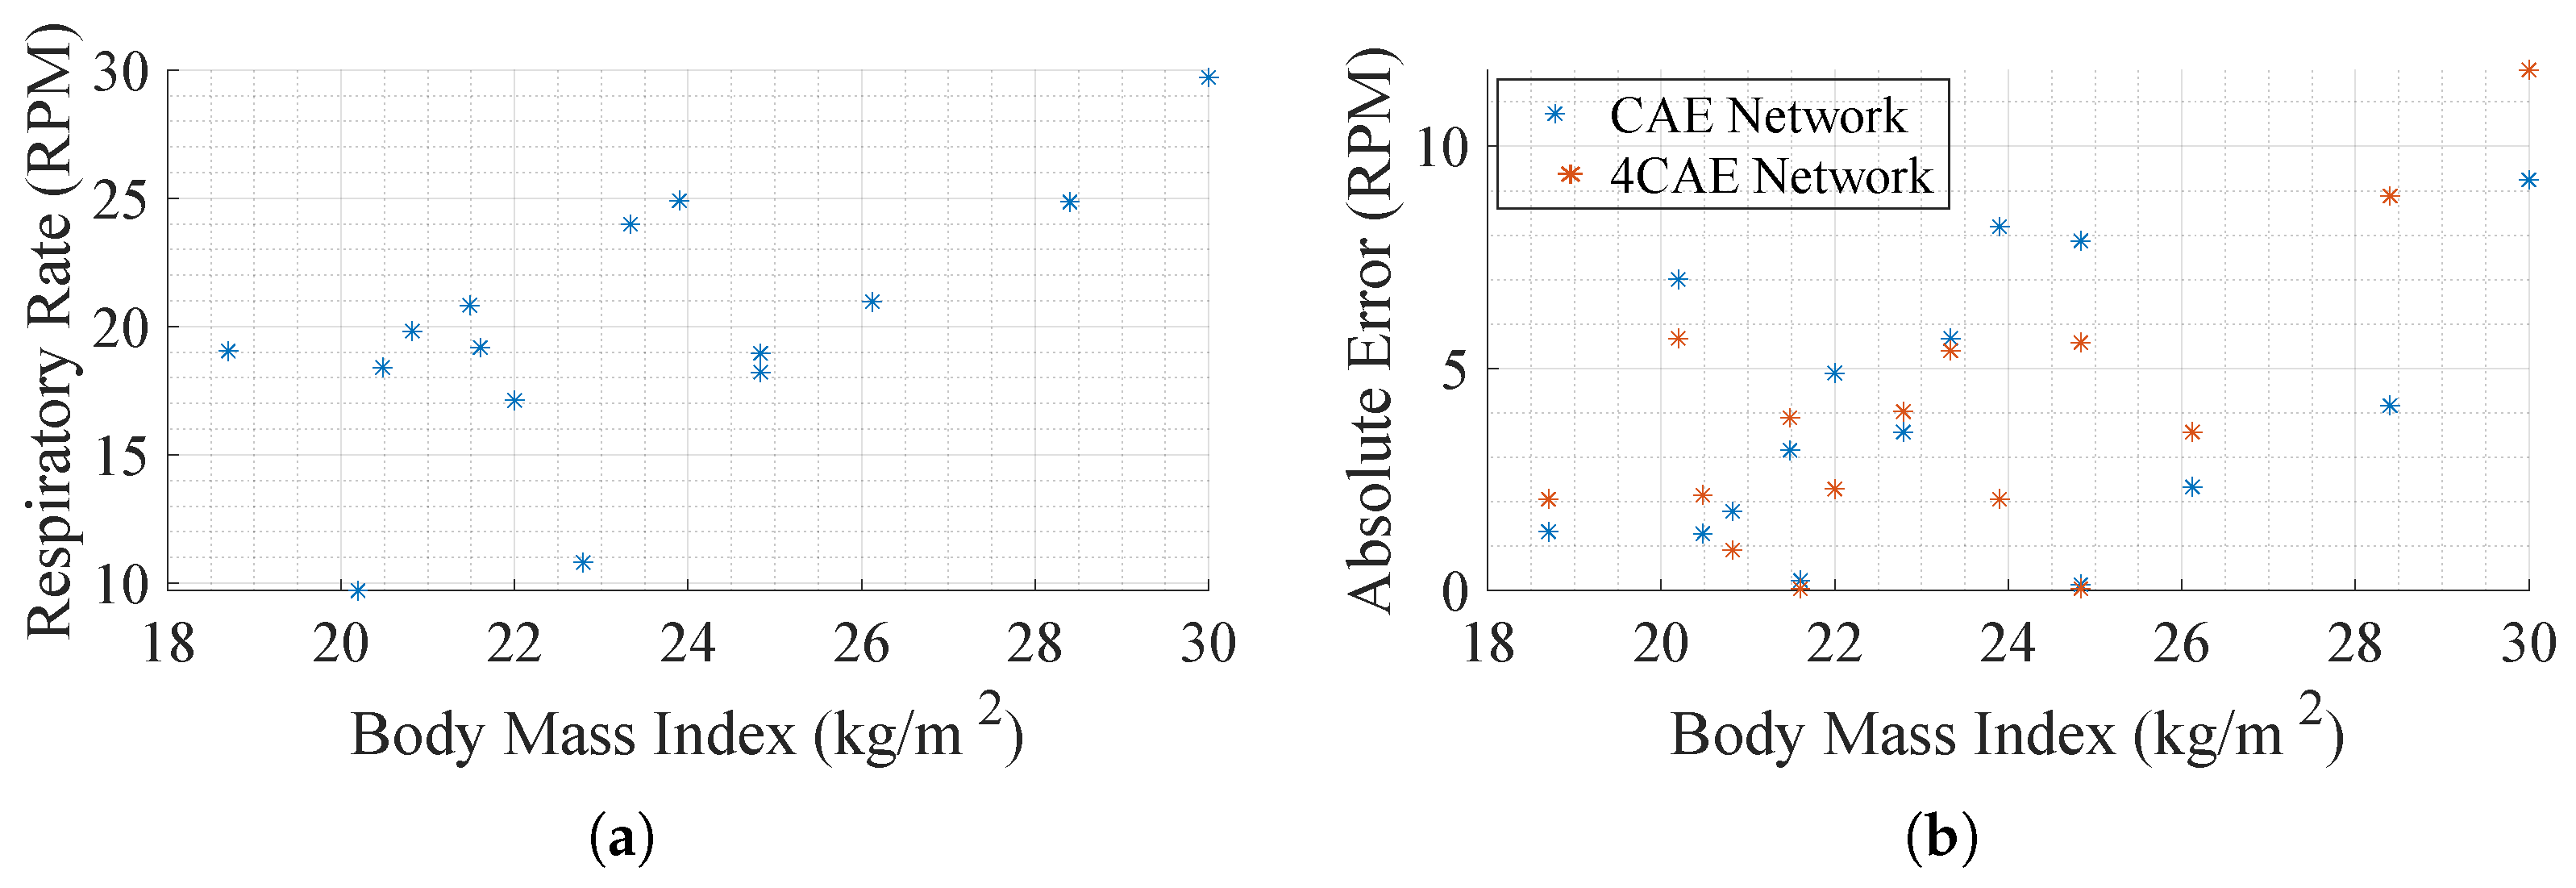
Further effort is put into trying to understand how errors fluctuate. In Figure 10a, a scatter plot evaluates the relation between respiration rate and BMI to compare how the respiration rate varies with it. It seems, even with a small data pool, that the respiration rates are higher as the BMI becomes greater. Another comparison conducted is the absolute error per subject BMI, Figure 10b, so as to understand how the error fluctuates according to the physical characteristics of the subject. Despite not presenting a relation between error and BMI, it can be concluded that subjects with higher BMI present higher respiratory rates, which tend to present higher errors.
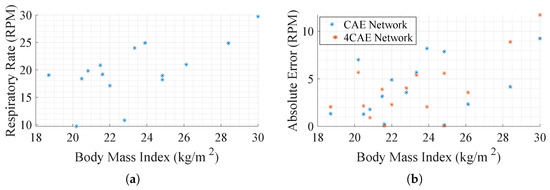
Figure 10.
Body Mass Index (BMI) impact in respiration ratio. (a) Average subjects’ respiration rate by their BMI. (b) Average absolute error by subjects’ BMI.
3.3.2. Leave-One-Out Cross-Validation (LOOCV)
The leave-one-out cross-validation (LOOCV) approach is also employed to further evaluate the networks, as it provides a robust evaluation of the generalization ability, reflecting real-world applications where new subjects may exhibit characteristics not represented in the training data. The LOOVC strategy is applied to identify the parameters of the CAE network, considering both approaches of radar positioning. The overall results from the training can be perceived in Table 6.
Table 6.
Network results for multiple subjects.
The network trained with data from the front radar predicts an average respiratory rate of RPM, while the network trained with data from both radars yields a slightly lower average of RPM, across all subjects, whereas the BioPac reports an average respiratory rate of RPM. To quantify the prediction errors, the average absolute error and the Root Mean Square Error (RMSE) are calculated for both networks. The network trained with data from the front radar achieves an average RMSE of 8.65 RPM, while the network trained with data from both radars achieves a slightly lower average RMSE of 7.67 RPM. This indicates that including data from both radars slightly improves performance, likely by providing additional spatial information that assists in mitigating noise and reconstructing the respiratory signal more effectively.
When applying this strategy, variability in network performance becomes more pronounced compared to the 80/10/10 split. For some subjects, the networks achieve very low errors, whereas others exhibit substantial deviations. The errors across subjects show a significant range, with certain cases achieving minimal deviations, while in others, errors reach as high as 13 RPM. The presence of this variability highlights the difficulty of generalizing the networks to entirely unseen individuals, where the inherent differences in physical and physiological characteristics add complexity to the respiratory signal reconstruction process. While the network trained with data from both radars demonstrates marginally better performance, the improvement is not sufficient to eliminate the variability across subjects.
The relationship between BMI, respiratory rate, and prediction errors is further analyzed to understand the sources of this variability. A negative Pearson correlation of is observed between the BMI and absolute error for both networks, indicating that subjects with higher BMI values are more prone to greater prediction errors. This trend likely results from increased respiratory rates. Similarly, a strong negative Pearson correlation of is found between BioPac respiratory rates and network errors. Subjects with higher respiratory rates consistently exhibit larger deviations in predictions. This trend is expected, as the networks are more prone to reconstructing signals with a respiratory rate closer to the average. This suggests that the networks perform better under conditions where the breathing signal is relatively stable and slow, whereas faster and more irregular breathing introduces challenges for accurate signal reconstruction. This combination of BMI and respiratory rate variability underscores the importance of accounting for inter-subject differences in future model development.
The errors observed across subjects highlight the need to evaluate network performance in relation to individual characteristics. For instance, the network trained with data from the front radar exhibits more pronounced errors for subjects with higher BMI and faster respiratory rates. Nonetheless, the inclusion of data from both radars provides some improvement as reflected in the lower RMSE values, suggesting that the additional information provided by the second radar helps mitigate certain noise and body motion effects.
3.4. Results Outline
The proposed methodology demonstrates superior performance when the model is trained on data from a single individual. Since, to our knowledge, there are not many methods that explore identical scenarios, our method is compared with two others. Table 7 presents a comparison of respiration error rates across methods that are innovative in both their hardware configurations and DL approaches.
Table 7.
Methods comparison. Hardware and software approaches and ours.
When comparing the results obtained with our best-case scenario, where the model is trained with data from a single subject and tested on that same subject, achieving an average error of RPM, to other solutions such as the radar and camera setup [17], which reports errors between and , and the predictive model [10], which has an error of in an ambulant environment, it is evident that our proposed methodology outperforms them by leveraging a simple dual-radar architecture combined with DL.
4. Conclusions and Future Work
This study demonstrates the potential of combining a dual-radar framework with DL algorithms for respiratory signal monitoring in scenarios involving significant body motion, such as walking on a treadmill. The proposed approach was evaluated through single-subject training and multiple-subject training, each offering unique insights into the network’s performance and generalization capabilities.
In single-subject training, the networks were trained and tested on data from a single individual, achieving exceptional performance. The CAE network, when trained with data from both radars, achieved an average absolute error of RPM, demonstrating the model’s ability to reconstruct respiratory signals with high precision under controlled conditions. This initial success served as a proof of concept for applying DL techniques to movement-compensated radar-based respiratory monitoring.
In the multiple-subject training, two distinct strategies were applied: a conventional 80/10/10 split and the more rigorous leave-one-out cross-validation (LOOCV). Under this split strategy, the CAE network achieved an average absolute error of RPM when using data from a single radar, and this error was slightly reduced to RPM when both radars were included. Despite this improvement, the relative deviation in results remained notable, with values of % and % for single- and dual-radar configurations, respectively. While dual-radar input provided a small performance gain, statistical analysis (Wilcoxon test) confirmed that the difference was not significant.
The LOOCV approach, which evaluates generalization on unseen subjects, revealed systematic underestimation of respiratory rates compared to the BioPac ground truth. The RMSE values were RPM for single-radar data and RPM for dual-radar data. Relative deviations were higher under LOOCV, with averages of % for single-radar data and % for dual-radar data, reflecting the challenge of generalizing to subjects with varying physiological characteristics. Subjects with elevated BMI and higher respiratory rates tended to exhibit greater deviations, emphasizing the need for the better handling of inter-subject variability.
As for future work, optimizing the DL models through advanced hyperparameter tuning and exploring alternative architectures could further reduce both absolute and relative error rates. The inclusion of adaptive models or personalized learning strategies could address inter-subject variability by accounting for physiological differences, such as BMI, respiratory rate, and walking style. Additionally, including more hardware in the setup, such as infrared cameras, sonar systems, and additional radars, could help further mitigate the effects of body movement by providing complementary data for signal enhancement. Expanding the dataset to include a broader range of participants, in terms of age, body type, and activity level, will provide deeper insights into the population-specific impacts on model performance. Finally, validating the methodology under real-world conditions, such as free walking environments or clinical settings, would help bridge the gap between research and practical deployment. Reducing the computational overhead and ensuring real-time processing will further enable applications in clinical monitoring, rehabilitation, and in-home health tracking, where movement-compensated radar-based systems have the potential to provide non-invasive and continuous respiratory monitoring.
Author Contributions
Conceptualization, C.G.; methodology: G.G., S.B. and P.P.; software: G.G.; validation, G.G., S.B., C.G., D.A. and P.P.; formal analyses: S.B.; investigation, G.G.; data curation: C.G. and D.A.; writing—orginal draft preparation: G.G.; writing—review and editing: S.B., C.G., D.A. and P.P.; visualization, D.A. and P.P.; supervision, S.B., C.G., D.A. and P.P. All authors have read and agreed to the published version of the manuscript.
Funding
Gonçalo Gomes acknowledges the Research Grant from Fundação para a Ciência e Tecnologia, with reference UIDB/00127/2020. This work was funded by national funds through FCT—Fundação para a Ciência e a Tecnologia, I.P., within the R&D unit IEETA/UA (doi:10.54499/UIDB/00127/2020 and doi:10.54499/UIDP/00127/2020). S. B. is funded by (doi:10.54499/DL57/2016/CP1482/CT0096) national funds, European Regional Development Fund, FSE through COMPETE2020, through FCT, in the scope of the framework contract foreseen in the numbers 4, 5, and 6 of the article 23, of the Decree-Law 57/2016, of 29 August, changed by Law 57/2017, of 19 July. It was also founded by FCT/Ministério da Ciência, Tecnologia e Ensino Superior (MCTES) through national funds and when applicable co-funded by the European Union (EU) fund under the project 2022.05005.PTDC and the project UIDB/50008/2020-UIDP/50008/2020 (IT) and under the project EMPA 2022.05005.PTDC (doi:10.54499/2022.05005.PTDC).
Institutional Review Board Statement
The study has been approved by the Ethics and Deontology Committee of the University of Aveiro, Portugal (No. 10-CED/2023).
Informed Consent Statement
Informed consent was obtained from all subjects involved in the study. Written informed consent has been obtained from the patient(s) to publish this paper.
Data Availability Statement
The original data presented in the study are openly available in IEEE DataPort at https://doi.org/10.21227/7y00-1183.
Conflicts of Interest
The authors declare no conflicts of interest.
References
- Mahomela, M.K.; Owolawi, P.A.; Mapayi, T.; Malele, V.; Aiyetoro, G. Self Diagnostic Vital Sign Monitoring System. In Proceedings of the 2021 International Conference on Electrical, Computer, Communications and Mechatronics Engineering (ICECCME), Mauritius, Mauritius, 7–8 October 2021; pp. 1–6. [Google Scholar] [CrossRef]
- Nicolò, A.; Massaroni, C.; Schena, E.; Sacchetti, M. The Importance of Respiratory Rate Monitoring: From Healthcare to Sport and Exercise. Sensors 2020, 20, 6396. [Google Scholar] [CrossRef] [PubMed]
- Paffenbarger, R.S.J.; Hyde, R.T.; Wing, A.L.; Hsieh, C.C. Physical activity, all-cause mortality, and longevity of college alumni. N. Engl. J. Med. 1986, 314, 605–613. [Google Scholar] [CrossRef] [PubMed]
- Kazemi, S.; Ghorbani, A.; Amindavar, H.; Morgan, D.R. Vital-Sign Extraction Using Bootstrap-Based Generalized Warblet Transform in Heart and Respiration Monitoring Radar System. IEEE Trans. Instrum. Meas. 2016, 65, 255–263. [Google Scholar] [CrossRef]
- Mostafanezhad, I.; Yavari, E.; Boric-Lubecke, O.; Lubecke, V.M.; Mandic, D.P. Cancellation of Unwanted Doppler Radar Sensor Motion Using Empirical Mode Decomposition. IEEE Sens. J. 2013, 13, 1897–1904. [Google Scholar] [CrossRef]
- Yang, Z.K.; Shi, H.; Zhao, S.; Huang, X.D. Vital Sign Detection during Large-Scale and Fast Body Movements Based on an Adaptive Noise Cancellation Algorithm Using a Single Doppler Radar Sensor. Sensors 2020, 20, 4183. [Google Scholar] [CrossRef] [PubMed]
- Lv, Q.; Chen, L.; An, K.; Wang, J.; Li, H.; Ye, D.; Huangfu, J.; Li, C.; Ran, L. Doppler Vital Signs Detection in the Presence of Large-Scale Random Body Movements. IEEE Trans. Microw. Theory Tech. 2018, 66, 4261–4270. [Google Scholar] [CrossRef]
- Pour Ebrahim, M.; Sarvi, M.; Yuce, M.R. A Doppler Radar System for Sensing Physiological Parameters in Walking and Standing Positions. Sensors 2017, 17, 485. [Google Scholar] [CrossRef]
- Khan, F.; Cho, S.H. A Detailed Algorithm for Vital Sign Monitoring of a Stationary/Non-Stationary Human through IR-UWB Radar. Sensors 2017, 17, 290. [Google Scholar] [CrossRef]
- Gong, J.; Zhang, X.; Lin, K.; Ren, J.; Zhang, Y.; Qiu, W. RF Vital Sign Sensing under Free Body Movement. Proc. ACM Interact. Mob. Wearable Ubiquitous Technol. 2021, 5, 1–22. [Google Scholar] [CrossRef]
- Chen, Z.; Zheng, T.; Cai, C.; Luo, J. MoVi-Fi: Motion-Robust Vital Signs Waveform Recovery via Deep Interpreted RF Sensing. In Proceedings of the 27th Annual International Conference on Mobile Computing and Networking, MobiCom ’21, New Orleans, LA, USA, 25–29 October 2021; pp. 392–405. [Google Scholar] [CrossRef]
- Li, K.L.; Lai, S.H.; Cheng, K.; Henrickson, L.; Chen, I.; Wu, V.; Chen, J. Exercise Vital Signs Detection Employing FMCW Radar and Artificial Neural Networks. In Proceedings of the 2021 Conference on Lasers and Electro-Optics (CLEO), Virtual, 9–14 May 2021; pp. 1–2. [Google Scholar]
- Li, C.; Lin, J. Random Body Movement Cancellation in Doppler Radar Vital Sign Detection. IEEE Trans. Microw. Theory Tech. 2008, 56, 3143–3152. [Google Scholar] [CrossRef]
- Rong, Y.; Dutta, A.; Chiriyath, A.; Bliss, D.W. Motion-Tolerant Non-Contact Heart-Rate Measurements from Radar Sensor Fusion. Sensors 2021, 21, 1774. [Google Scholar] [CrossRef] [PubMed]
- Zhang, X.; Yang, X.; Ding, Y.; Wang, Y.; Zhou, J.; Zhang, L. Contactless Simultaneous Breathing and Heart Rate Detections in Physical Activity Using IR-UWB Radars. Sensors 2021, 21, 5503. [Google Scholar] [CrossRef]
- Gu, C.; Wang, G.; Li, Y.; Inoue, T.; Li, C. A Hybrid Radar-Camera Sensing System with Phase Compensation for Random Body Movement Cancellation in Doppler Vital Sign Detection. IEEE Trans. Microw. Theory Tech. 2013, 61, 4678–4688. [Google Scholar] [CrossRef]
- Wang, Y.; Wang, Z.; Zhang, J.A.; Zhang, H.; Xu, M. Vital Sign Monitoring in Dynamic Environment via mmWave Radar and Camera Fusion. IEEE Trans. Mob. Comput. 2024, 23, 4163–4180. [Google Scholar] [CrossRef]
- Peng, K.C.; Sung, M.C.; Wang, F.K.; Horng, T.S. Noncontact Vital Sign Sensing Under Nonperiodic Body Movement Using a Novel Frequency-Locked-Loop Radar. IEEE Trans. Microw. Theory Tech. 2021, 69, 4762–4773. [Google Scholar] [CrossRef]
- Wang, F.K.; Horng, T.S.; Peng, K.C.; Jau, J.K.; Li, J.Y.; Chen, C.C. Single-Antenna Doppler Radars Using Self and Mutual Injection Locking for Vital Sign Detection with Random Body Movement Cancellation. IEEE Trans. Microw. Theory Tech. 2011, 59, 3577–3587. [Google Scholar] [CrossRef]
- Tiwari, G.; Gupta, S. An mmWave Radar Based Real-Time Contactless Fitness Tracker Using Deep CNNs. IEEE Sens. J. 2021, 21, 17262–17270. [Google Scholar] [CrossRef]
- Rodrigues, D.V.; Li, C. Noncontact Exercise Monitoring in Multi-Person Scenario with Frequency-Modulated Continuous-Wave Radar. In Proceedings of the 2020 IEEE MTT-S International Microwave Biomedical Conference (IMBioC), Toulouse, France, 14–17 December 2020; pp. 1–3. [Google Scholar] [CrossRef]
- Ettus Research Products. Available online: https://www.ettus.com/all-products/UB210-KIT/ (accessed on 1 May 2023).
- Inc. BIOPAC Systems. MP36R 4-Channel Systems. Available online: https://www.biopac.com/product-category/research/systems/mp36r-4-channel-systems/ (accessed on 12 May 2023).
- Verma, P.; Schafer, R. Frequency Estimation from Waveforms Using Multi-Layered Neural Networks. In Proceedings of the INTERSPEECH 2016, San Francisco, CA, USA, 8–12 September 2016; pp. 2165–2169. [Google Scholar] [CrossRef]
- Huang, B.; Lin, C.L.; Chen, W.; Juang, C.F.; Wu, X. Signal Frequency Estimation Based on RNN. In Proceedings of the 2020 Chinese Control And Decision Conference (CCDC), Hefei, China, 22–24 August 2020; pp. 2030–2034. [Google Scholar] [CrossRef]
- Human Health Monitoring Using Continuous Wave Radar and Deep Learning. Available online: https://www.mathworks.com/help/wavelet/ug/human-health-monitoring-using-continuous-wave-radar-and-deep-learning.html (accessed on 5 May 2023).
- Gomes, G.; Gouveia, C.; Albuquerque, D.; Brás, S.; Pinho, P. Dual-Radar Integration for Vital Signs Acquisition under Heavy Body Movement using Machine Learning. In Proceedings of the 2024 IEEE 22nd Mediterranean Electrotechnical Conference (MELECON), Porto, Portugal, 25–27 June 2024; pp. 367–371. [Google Scholar] [CrossRef]
- Sriram, S.; Dwivedi, A.K.; Chitra, P.; Sankar, V.V.; Abirami, S.; Durai, S.J.R.; Pandey, D.; Khare, M.K. DeepComp: A Hybrid Framework for Data Compression Using Attention Coupled Autoencoder. Arab. J. Sci. Eng. 2022, 47, 10395–10410. [Google Scholar] [CrossRef]
- Lai, Y.H.; Chen, F.; Wang, S.S.; Lu, X.; Tsao, Y.; Lee, C.H. A Deep Denoising Autoencoder Approach to Improving the Intelligibility of Vocoded Speech in Cochlear Implant Simulation. IEEE Trans. Biomed. Eng. 2017, 64, 1568–1578. [Google Scholar] [CrossRef]
- Gondara, L. Medical Image Denoising Using Convolutional Denoising Autoencoders. In Proceedings of the 2016 IEEE 16th International Conference on Data Mining Workshops (ICDMW), Barcelona, Spain, 12–15 December 2016; pp. 241–246. [Google Scholar] [CrossRef]
- Chiang, H.T.; Hsieh, Y.Y.; Fu, S.W.; Hung, K.H.; Tsao, Y.; Chien, S.Y. Noise Reduction in ECG Signals Using Fully Convolutional Denoising Autoencoders. IEEE Access 2019, 7, 60806–60813. [Google Scholar] [CrossRef]
- Wang, Z.; Zhang, T.; Shao, Y.; Ding, B. LSTM-convolutional-BLSTM encoder-decoder network for minimum mean-square error approach to speech enhancement. Appl. Acoust. 2021, 172, 107647. [Google Scholar] [CrossRef]
- Das Chakladar, D.; Dey, S.; Roy, P.P.; Dogra, D.P. EEG-based mental workload estimation using deep BLSTM-LSTM network and evolutionary algorithm. Biomed. Signal Process. Control 2020, 60, 101989. [Google Scholar] [CrossRef]
- Brueckner, R.; Schulter, B. Social signal classification using deep blstm recurrent neural networks. In Proceedings of the 2014 IEEE International Conference on Acoustics, Speech and Signal Processing (ICASSP), Florence, Italy, 4–9 May 2014; pp. 4823–4827. [Google Scholar] [CrossRef]
- A Healthy Lifestyle—WHO Recommendations. Available online: https://www.who.int/europe/news-room/fact-sheets/item/a-healthy-lifestyle---who-recommendations (accessed on 13 December 2023).

Disclaimer/Publisher’s Note: The statements, opinions and data contained in all publications are solely those of the individual author(s) and contributor(s) and not of MDPI and/or the editor(s). MDPI and/or the editor(s) disclaim responsibility for any injury to people or property resulting from any ideas, methods, instructions or products referred to in the content. |
© 2025 by the authors. Licensee MDPI, Basel, Switzerland. This article is an open access article distributed under the terms and conditions of the Creative Commons Attribution (CC BY) license (https://creativecommons.org/licenses/by/4.0/).