Article

A Centralized Approach to the Logging Mechanisms of Distributed Complex ERP Applications

by
Cosmin Strilețchi
1,*,
Petre G. Pop
1 and
Christian Gavrilă
2
1
Communications Department, Technical University of Cluj-Napoca, Baritiu Street no. 26, 400027 Cluj-Napoca, Romania
2
Crisoft Romania, 500214 Brașov, Romania
*
Author to whom correspondence should be addressed.
Information 2025, 16(3), 216; https://doi.org/10.3390/info16030216
Submission received: 15 January 2025 / Revised: 3 March 2025 / Accepted: 4 March 2025 / Published: 11 March 2025

Abstract

:
Complex software applications traverse a multitude of running or idling states that depend on their implementation phase (development, testing, debugging, and exploitation). The applications can be monitored by letting them produce descriptive messages, the corresponding data being logged and usually marked according to their meaning or severity (info, debug, warning, error and fatal). Our software platform (Crosweb) provides the generic tools for implementing complex Enterprise Resource Planning (ERP) applications and has its component software modules divided into several levels, the main ones being responsible for the infrastructure, the data management, the business logic, and user interfaces. Any of the mentioned components can produce logging messages, and the reporting methods can vary according to the place they occupy in the software hierarchy. The physical location of each software component can differ, their running environments often being distributed across several computing systems connected via various communication protocols. All these factors add complexity to the logged data inspection process. The current paper presents a solution that centralizes the logging information issued by the Crosweb components for ensuring a better exposure of the associated information and for simplifying the solutioning of the reflected problems.

1. Introduction

A software application is usually developed and tested on the proprietary company’s software and hardware technology, later deployed on the client’s machines. The software modules developed as part of a complex software solution can be located and executed in various supporting environments. Those environments are characterized by specific technologies, supported programming languages, hardware requirements and physical location [1]. The more complex the application is, the more diverse the underlying support platforms are.
Applications have a series of versions due to their natural evolution and maintenance [2]. An application is delivered to customers, each of them receiving a software clone that is closely connected to the currently used technologies and programming languages. Every client is in possession of their own representation of the deployed application that depends on the versions of the component modules and on the compatibility between them.
Maintaining and updating all the applications deployed to the clients involves keeping track of both the installed versions of the software product itself and the underlying support technologies [3]. Any future modification must be compatibilized with the entire context that defines the application.
All the aspects mentioned so far put a considerable amount of pressure on the development team. An option at hand of managing and controlling all the software components embedded in the application itself relies heavily on the log messages issued by the application [4].
The information reported by the application itself represents a primary tool for ensuring the normal functioning and for inspecting unusual behavior of the various component modules. The corresponding data can be either printed in a terminal (volatile information) or stored to be analyzed later (logged information). Each report usually falls into one the following categories: INFO, DEBUG, WARNING, ERROR and FATAL [5].
The logged data’s meaning is directly connected to the application level from which it is issued. In the case of our web platform developed and used for tailoring user specific Enterprise Resource Planning (ERP) systems (Crosweb), the following major areas can be identified:
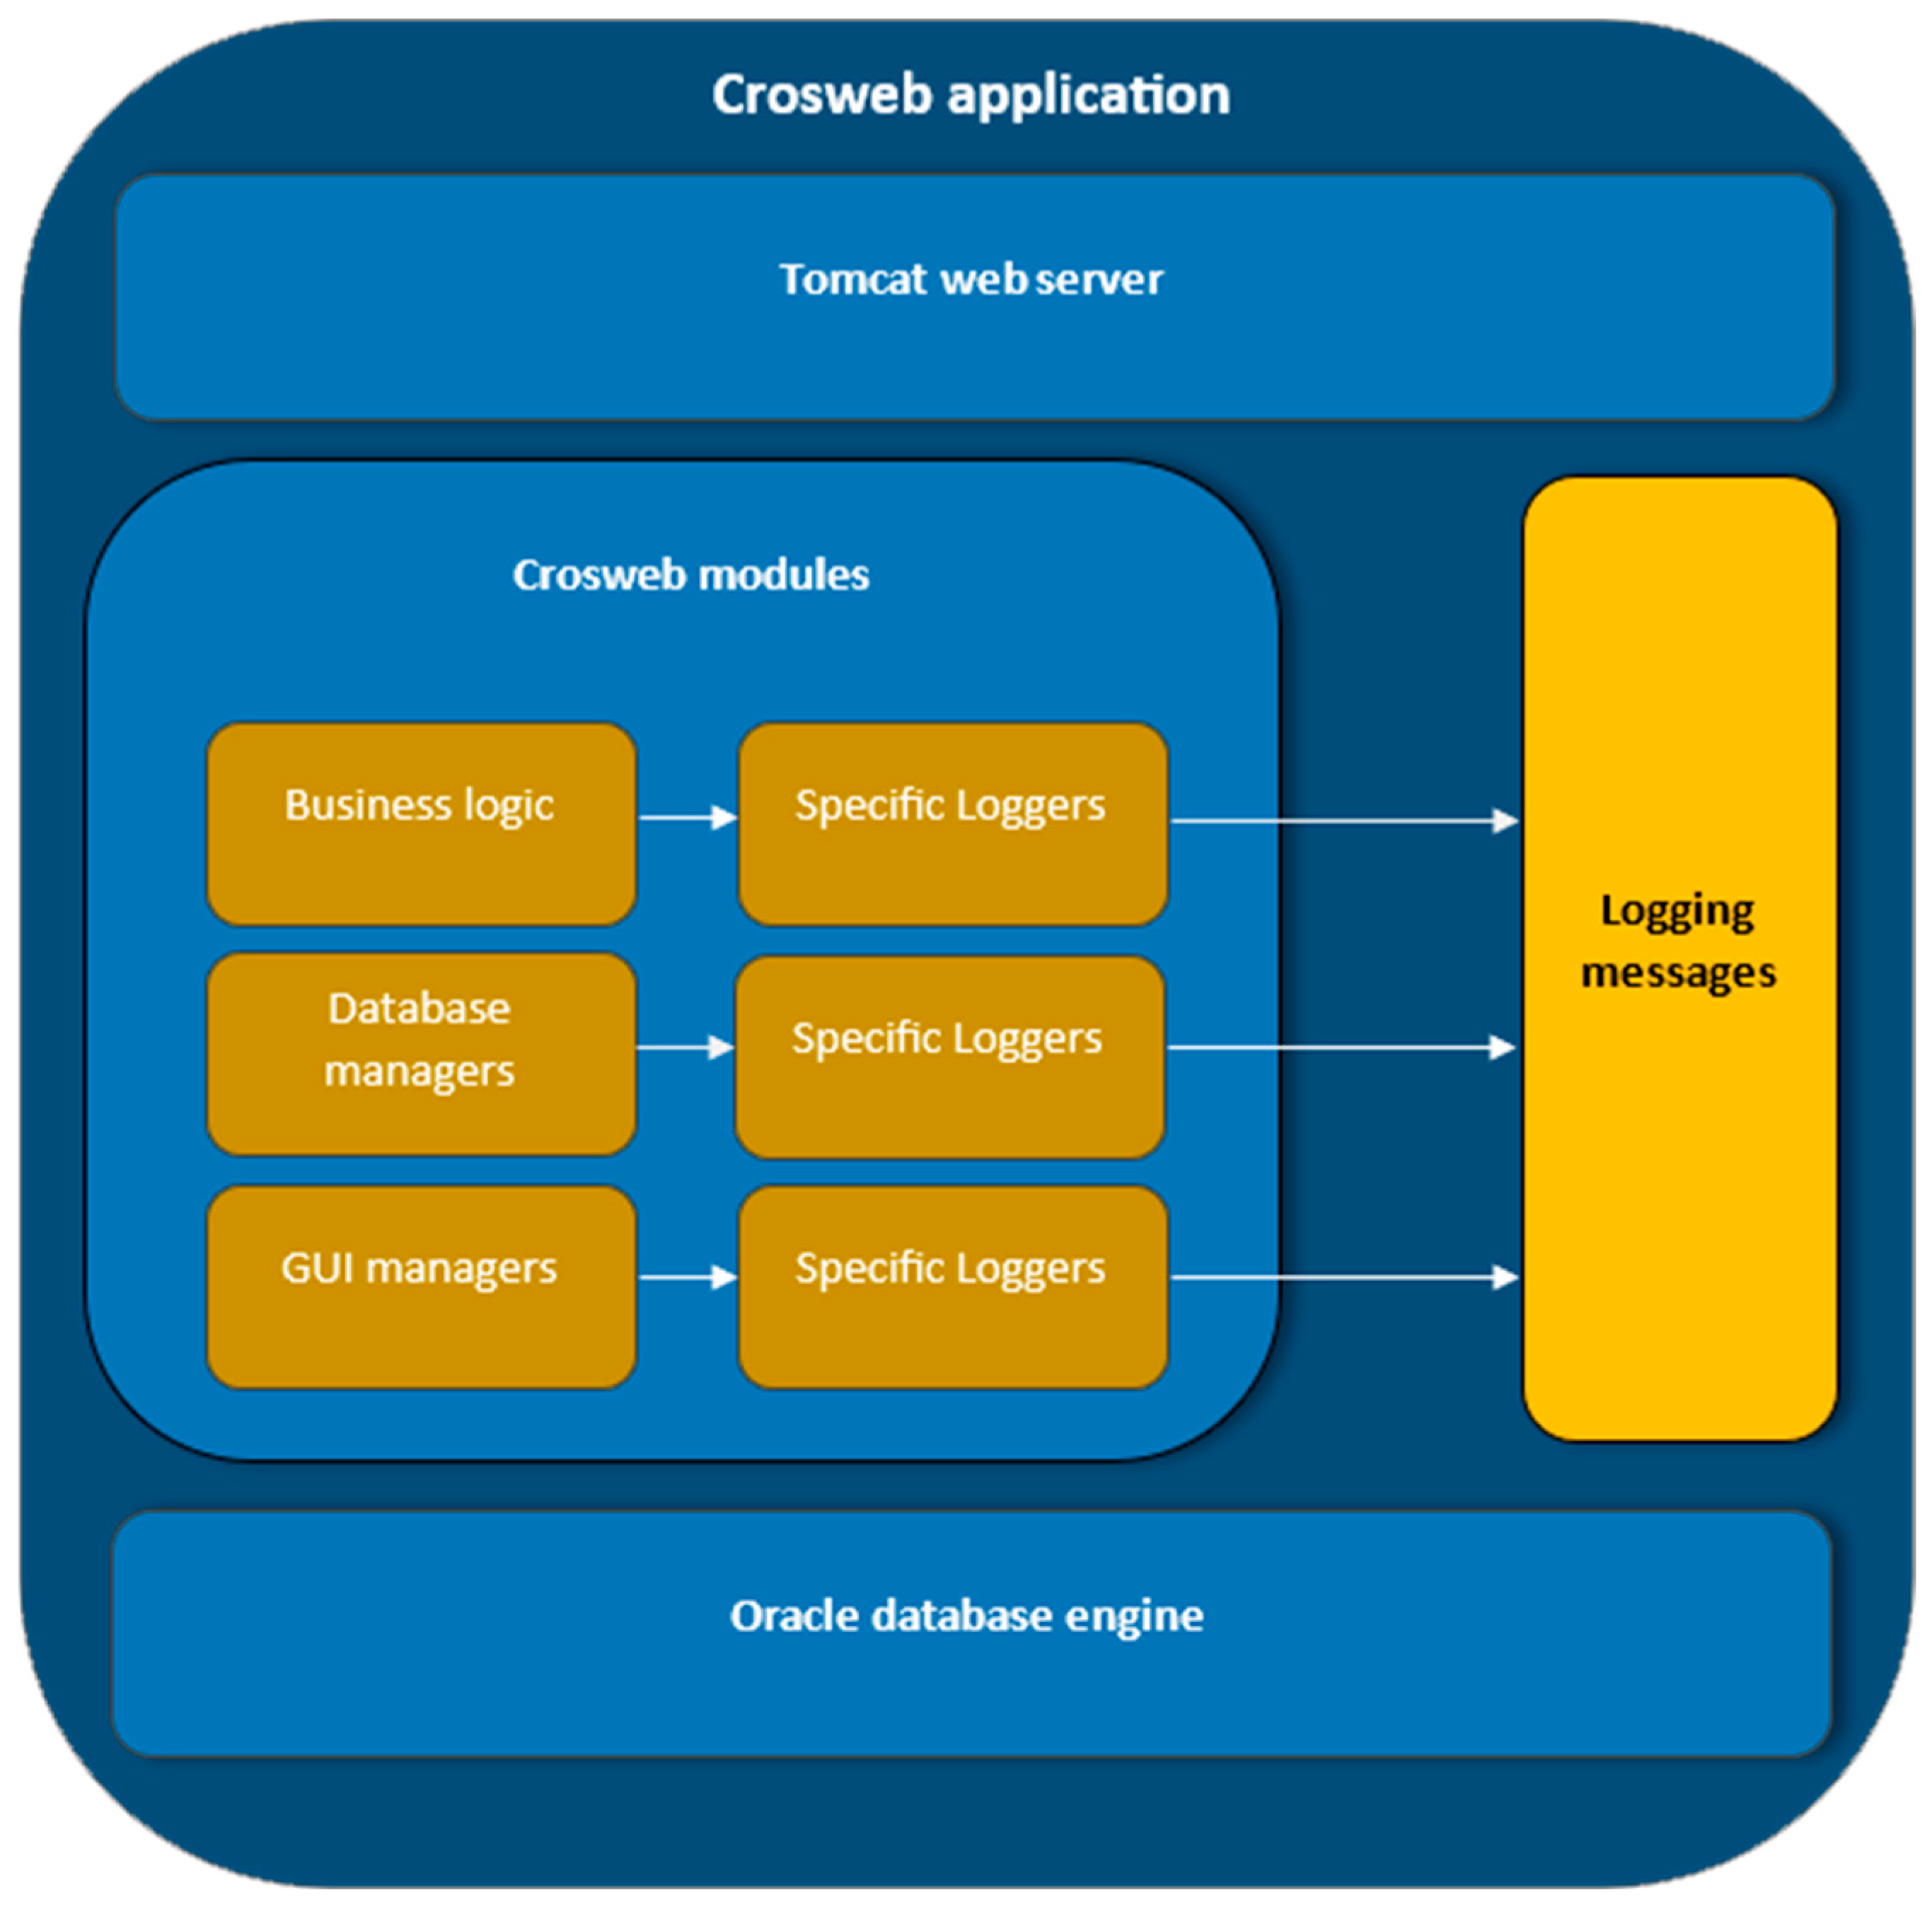
  • Web server level: the infrastructure that supports the entire application.
  • Database level: the operations performed for managing the persistent data of the application.
  • Business logic levels: the completeness of the computing operations performed to provide the application’s facilities.
  • Application presentation level: the components that sustain and offer functionalities to the user accessible interfaces.
All the software component modules that form the final application fall into the above-mentioned categories, and all of them can emit various logging messages generated by the problems detected during runtime.
Reporting logging messages is generally related to producing textual information. The associated content is not meant for any of the rightful applications’ users, instead being meant to be analyzed by specialists (programmers, testers, product owners). The relevance of a logging message is usually related to the following:
  • The date it was issued
  • The part of the application that produced it
  • A significant description [6].
The data associated with logging messages respect the same reporting practices. Regardless of the operating system (Windows [7], Mac OS [8], etc.) or the programming languages involved (Java [9], C/C++ [10], Python [11], etc.), the associated logging data take three major directions.
The first (and the most preferred) destination for reporting the logging messages involves outputting the corresponding information in the closest and most accessible console [12].
A second but just as important logging target is represented by depositing the messages in specific files [13].
The third common logging destination is a specialized database engine [14].
In the currently existent Crossweb logging contexts, there are a series of obstacles that must be overcome in order to facilitate the resolution of the problem that has arisen. The idea that sustains our implementation presented in this article details the solutions found for the problems mentioned below.
P1. The access to the storing places of the logging messages is restricted due to the physical scattering of the software modules involved in our ERP applications. The problems are reported and displayed on the machines that constitute the hardware infrastructure, and delivering the messages to the in-charge specialist usually involves third party communication channels (e-mails, etc.).
P2. Identifying the software processes that issued a certain message serves for a better understanding of the reported problem. In the case of real problems or even fatal errors (database engine failure, database queries that take too long to complete, web pages that consume too many physical resources to be fully loaded), the corresponding data still must be logged even if the software process that issued them has been forcefully terminated.
P3. Identifying the specific infrastructure software context is crucial. The identifiers of the different installed web servers, database engines, and application versions that must cooperate during runtime must also be logged.
P4. The time of the reported logged data must be recorded. This serves for a better understanding of the reported problem’s nature by corelating it to other processes that might have been running at that specific moment.
The criteria mentioned above could be embedded in the logged messages as textual information. A mere prefixing of the actual reported problem with descriptors would make it hard to classify and read by a human operator. An additional structuring level must be introduced.
Assuming that the previously mentioned aspects have been dealt with, solving the reported problem would consist in replicating the entire context it was signaled. Only by seeing exactly the erroneous behavior, the development team can start implementing the right solution. Replicating the error involves running the exact version of the application in the exact underlying context. The success of this operation is directly dependent on the accuracy and promptness of the logged messages.
The P1, …, P4 considerations presented above induce additional effort and time spent by the programming team, that is not efficiently oriented towards solving the actual problems, being instead counterbalanced by gathering the information stored in the reported logging messages.
Due to the complexity of the software stack embedded in the Crosweb platform and the processing times already required for assembling a certain web page (presented in Section 2. The Crosweb Context) using external logging services that serve at prevailing data from any source, in any format, for being searched, analyzed, and visualized (Elastic Stack [15], Splunk [16], Fluentd [17]) would add unaffordable additional running times.
The ERP solutions implemented on the Crosweb platform manifest data security needs, as some of our clients have very strict confidentiality rules. This idea, corelated with the added time factor, made the already implemented external logging services unusable in the Crosweb context. The need to develop an in-house specific error reporting and viewing technology became obvious. The decision was made despite the clear advantages of the existent logging solutions (efficient searching, ergonomic display, etc.).
The proposed solution is to implement a centralized logging mechanism that is supposed to run in parallel with the traditional, machine-dependent, error-reporting mechanisms. This article is focused on presenting the concepts and implementation that transcend the above-mentioned disadvantages and streamlines the process of errors analyzing mechanisms, allowing the programming team to focus on solving the actual problems instead of acquiring the information that describes them.

2. The Crosweb Context

Crosweb is a software platform endowed with various software modules that can be assembled and customized to create complex ERP web solutions. It is developed and permanently updated by our programming team and has recently celebrated its 10-year anniversary. The platform provides the infrastructure for implementing custom applications for e-commerce, organizational personnel and documents management, clients invoicing, etc.
The entire platform is sustained by an Oracle database [18]. The main programming language used is Java [19] and the outside world interfacing is ensured by a Tomcat web server [20].
Each typical Crosweb application is constructed by assembling the software components mentioned below. All the modules are managed by a Tomcat version and an Oracle database engine that are distributed to the client along with the rest of the application.
The software hierarchy specific to a Crosweb product is presented below.
Web server: a Tomcat distribution
Database engine: an Oracle distribution
Actual Crosweb modules:
  • Business logic implementation files: written in Java, define the data processing specific to each functioning situation.
  • Database communication files: written in Java and by the JDBC [21] bridge can launch database interrogations and receive and interpret the obtained results.
  • Graphical User Interface (GUI) managers:
    Layout files: written in Java and contain page elements’ components defined by descriptor attributes.
    Support files: CSS [22] and JavaScript [23] modules control the look and feel and the user experience.
    Resource files: Multimedia content (images, etc.) are associated with each developed page.
    Component manager files: written in Java, control the functionality and behavior of the developed web components (menus, buttons, charts, tables, etc.).
    Page manager files: written in Java and are responsible for assembling all the components embedded in a certain page. They also interpret the roles associated with each user.
    Renderer files: written in Java and are specialized in web content production. They deliver browser displayable content based on the entire infra-structure mentioned above.
The facilities offered by a finalized Crosweb product are meant to be accessed by authenticated users. Specific user allocated roles grant the action possibilities inside the allocated pages.

3. Crosweb Logging Mechanisms

3.1. Initial Implementation of Logging Mechanisms

Each source code located in any of the modules mentioned above can produce logging messages. The primary implemented mechanism is based on the Log4j2 Apache logging services [24] and is supported by the Maven [25] project types. The following components are involved:
  • An XML configurator [26] that establishes which logging levels are monitored in the current project. The possible values are OFF, FATAL, ERROR, WARN, INFO, DEBUG, TRACE, ALL [27].
  • Specific instances of Logger type [28] created in each Java source code that is capable of launching logging messages.
  • Direct calls to specific logging methods (debug(), error(), warn(), etc.) or to the generic method log() [25]. Both method categories receive as parameter the message to be re-ported in logging, the second one’s functioning being controlled in addition by the log level.
Based on the XML configurator specifiers, the logging messages can be directed to a console or to a file, or to a custom Appender type class [29].
Figure 1 presents the software hierarchy of a regular Crosweb application and the initial reporting of logging messages.
As shown in the previous figure, the logging messages are strictly dependent on the application’s physical installation.
Regardless the destination of the specific loggers (console, files, custom appenders, etc.), all the reported data are stuck on the same machine/s and must be delivered “by hand” to the development team, thus hardening the actual debugging and error fixing processes, which implies the following:
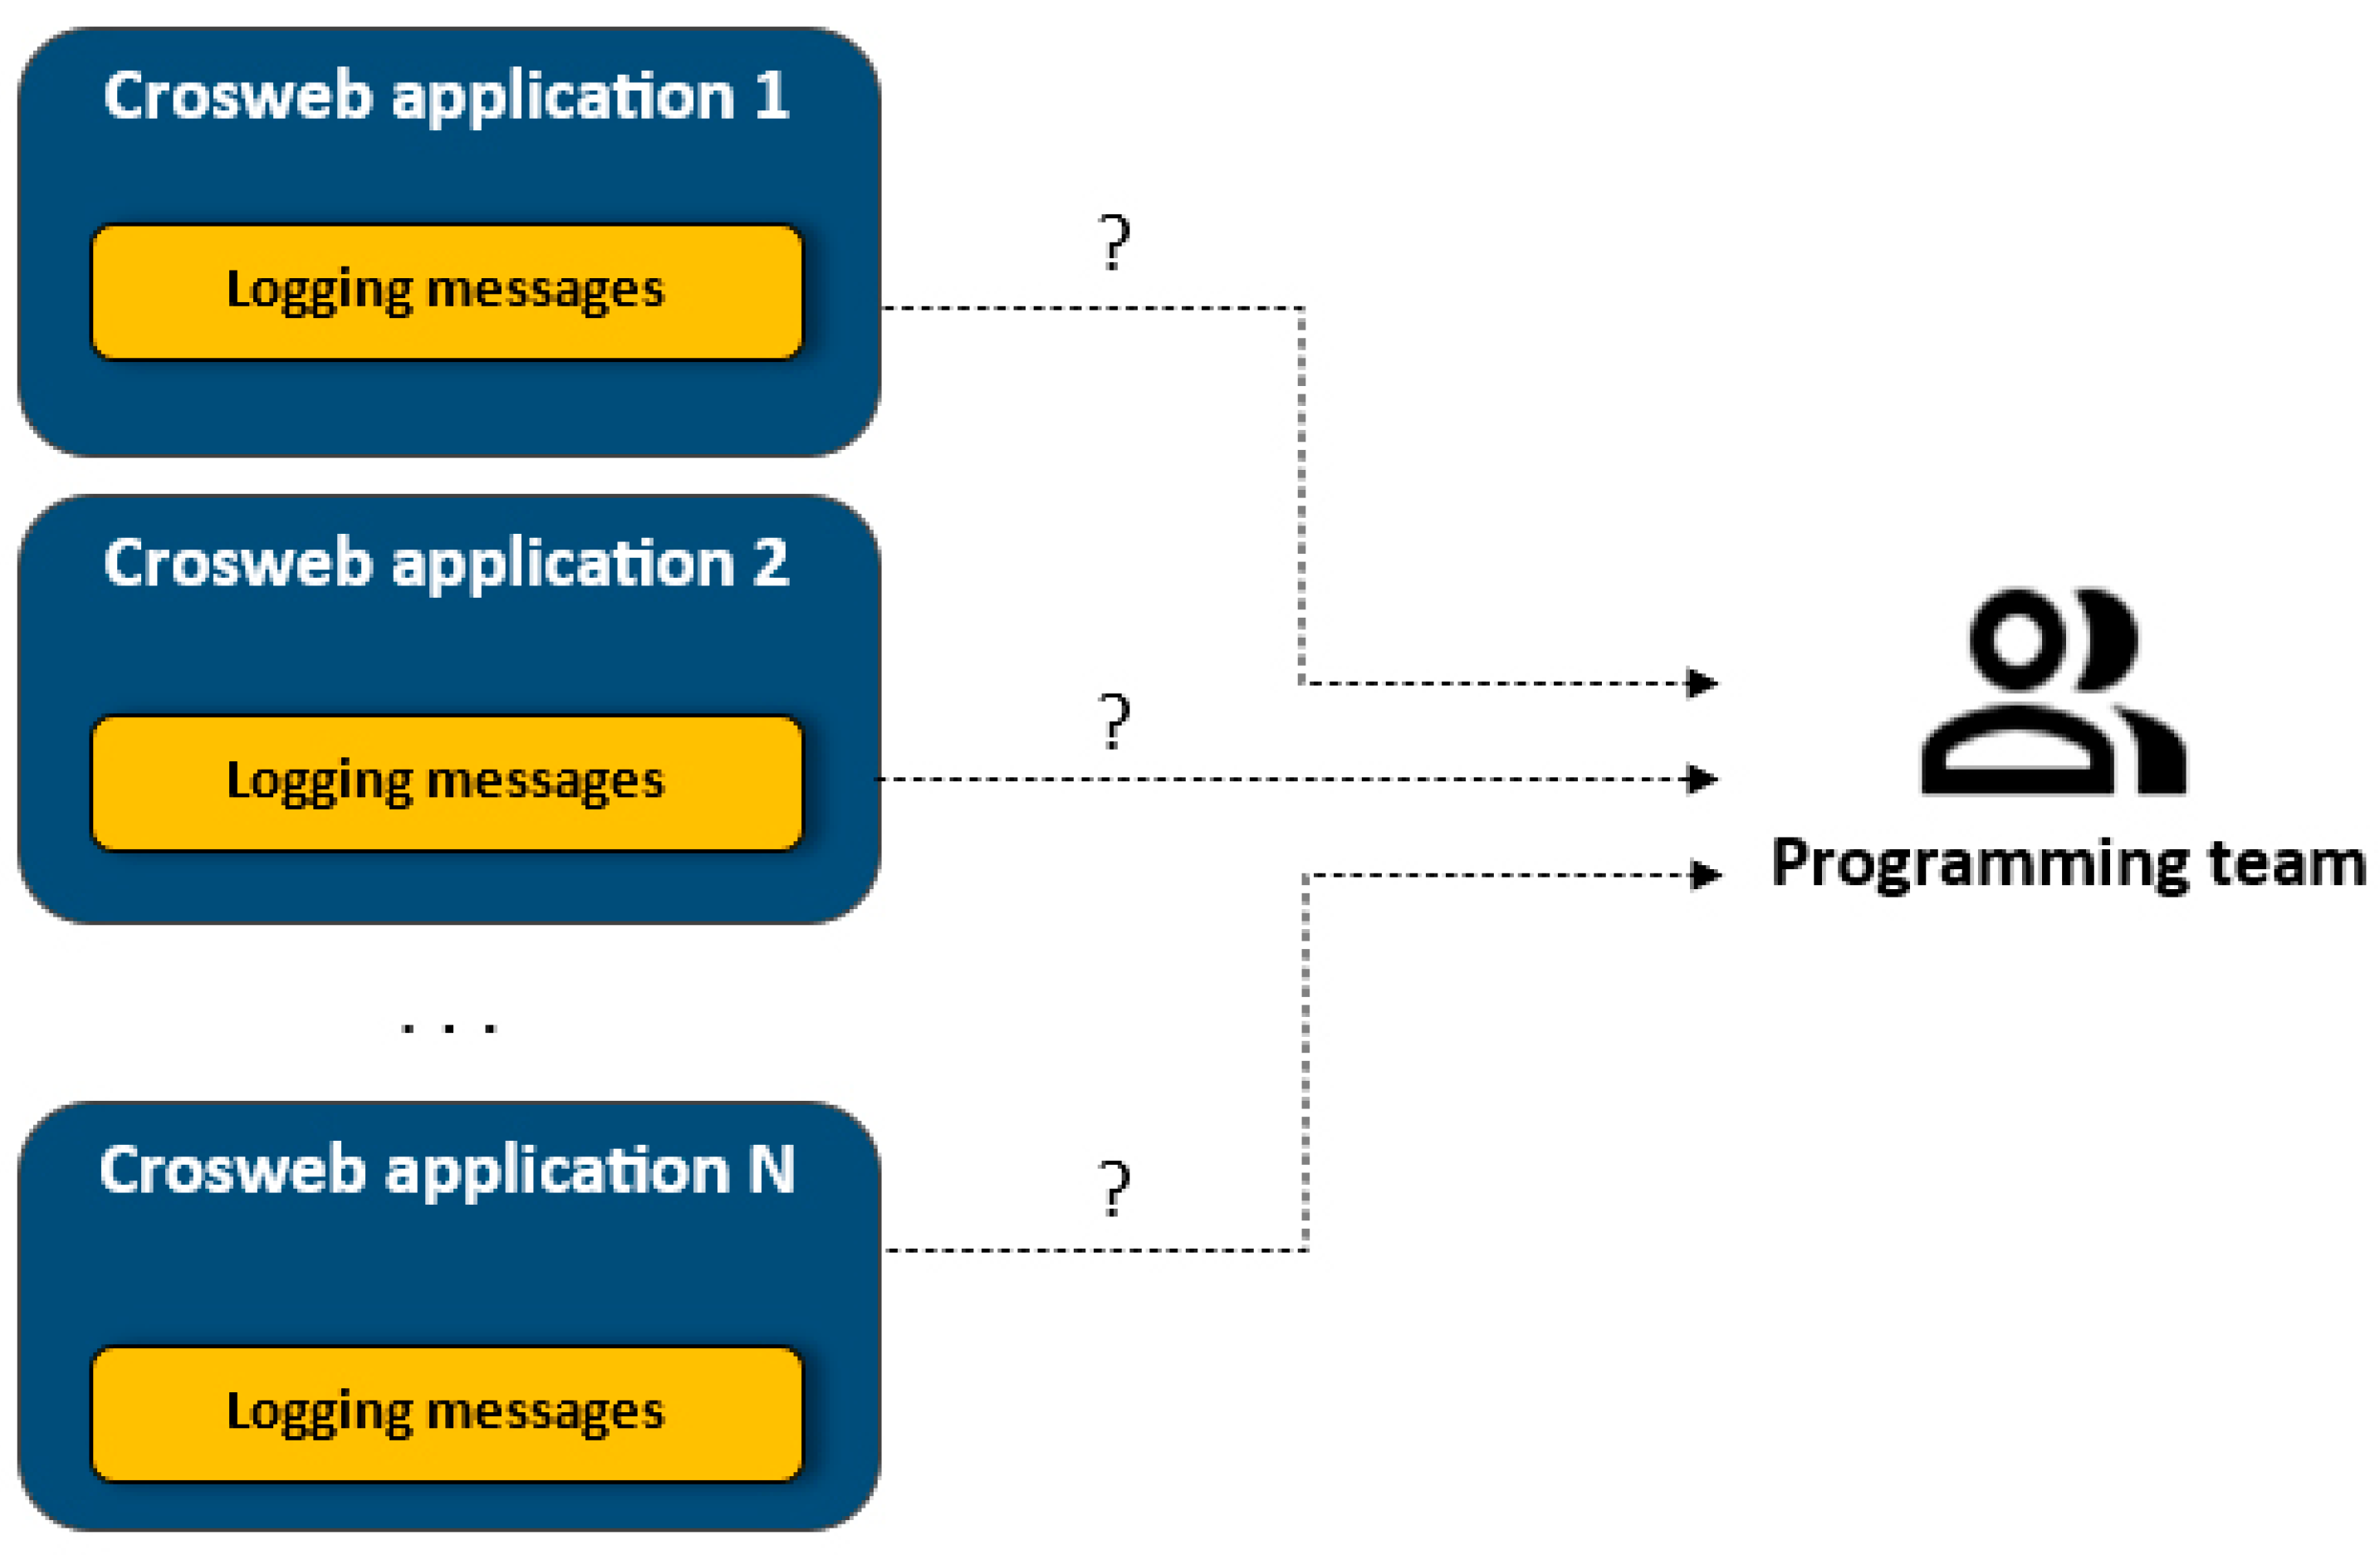
  • Seeing the actual logging messages.
  • Determining the installed Crosweb application version.
  • Determining the underlying installed software infrastructure (Tomcat and Oracle versions).
  • Trying to replicate the scenario that led to the reported problems.
  • Fixing the determined issues.
  • Deploying the fixed codes on the machines that signaled the problems.
The last three items mentioned above represent the actual problem-solving process. Reading the reported messages (the first three items) tends to occupy a significant amount of time and effort (Figure 2).

3.2. The Centralized Logging Mechanisms

Our solution to the local representation of logging messages consists of a centralized mechanism that communicates with all Crosweb deployments. All the individual application installations are supposed to accumulate their reported local log messages and to deliver the data to a unique external service that will later serve for being interrogated and analyzed by the programmer team (Figure 3).
The local logging messages accumulators serve to deliver entire chunks of logging data to the external accumulator, as opposed to delivering them one by one, as they are recorded. This way, the delivery process will manifest less fragmentation, therefore being more efficient.

3.2.1. The Structure of Logging Messages

The starting point for describing our implementation is the information related to the logging messages. Since we are talking about a centralized mechanism that gathers data from different applications and machines, besides the actual message reported by the system, some additional identifier information will have to be stored.
We can affirm that each logging message will be composed of the following:
  • Payload (actual reported data).
  • Overhead (additional identifiers).
The reported data are always represented in text format, so the payload will have an array of characters type. Its length will be big enough to fit the needs of the Crosweb applications. It was experimentally determined that 255 characters are sufficient for this purpose.
According to the internal structure of the Crosweb software modules and the identifying needs that derive from that, each message’s overhead is composed of the following fields:
  • log_client_id: the identifier of the Crosweb registered client currently using the application.
  • log_node_id: the Crosweb node that signals the message.
  • log_level: the message error level (INFO, WARNING, DEBUG, etc.).
  • log_class: the Java class containing the code that signaled the error.
  • log_module_name: the Crosweb module that signals the problem.
  • log_action_name: the action (if any) that led to the reported problem.
  • log_date: the date the logging message was reported.
  • log_user_id: the identifier of the Crosweb registered user (if existent).
  • log_session_id: the Crosweb session identifier (if existent).
  • log_session_created_at: the timestamp the session was created (if the session exists).
  • log_layer: the Crosweb layer from which the error was launched.
  • log_package: the Crosweb package from which the error was launched.
  • log_component: the Crosweb component from which the error was launched.
  • log_line: the line number in the Java source code that signaled the error.
  • log_context_id: the internal Crosweb context identifier (if existent).
  • log_context_page: the Crosweb web page that was running when the error was reported (if existent).
  • log_request_id: the Crosweb web page request identifier (if existent).
  • log_request_type: the Crosweb request type (if existent).
The most generic and comprehensive format of the overhead information is the text type. Since each stored piece of information is connected to a specific label, storing the overhead data as a JavaScript Object Notation (JSON) object [30] comes as a natural solution.
The payload and the overhead can be combined to form a unitary JSON entity. To attach the actual reported message (payload) to the overhead structure defined above, a last field was introduced:
  • log_message: the actual error message explaining its nature.
This way, all the information related to a logging message is well structured and packed into a single JSON object that can be easily populated and transferred as textual data to the local accumulators.
The structuring provided by JSON packing the logging data and the additional information allows the error storing and transport mechanism to be:
  • Independent of the number of parameters and the order in which they are specified.
  • Elastic enough to allow the omission of some parameters that may not have values in certain contexts.
  • Universal enough to be processed in various technologies and programming languages (can be created, transmitted, and disassembled in Java, JavaScript, etc.).

3.2.2. Local Logging Messages Accumulators

The first module that sustains our implementation refers to gathering the local logging data produced by all the machines that run Crosweb applications. To deliver the information to the external centralized accumulator mechanism, the individual applications must collect all the reported logging messages. For this, a separate repository is used.
The data that need to be logged are produced by various Crosweb software modules. The most convenient way of collecting them is to implement a custom Appender [25] instance that is triggered automatically each time a specific logging message is reported.

Custom Appender Configuration

In the log4j2-conf.xml configuration file, all the pre-implemented or custom appenders are specified. Since our logging process has special needs and is different from a mere console or output file, we anchored a special appender with the following syntax:
<?xml version=“1.0” encoding=“UTF-8” ?>
<Configuration strict=“true” monitorInterval=“5” packages=“crosweb.helpers”>
<Appenders>
 <LogMessagesAppender name=“logMessagesAppender”>
  <PatternLayout
  pattern=“%d{HH:mm:ss.SSS} [%t] %-5level %logger{36} –
%msg%n”/>
 </LogMessagesAppender>
 <!-- … other appenders … -->
</Appenders>
<Loggers>
 <!-- modules that trigger the appender -->
 <Logger name=“cros.package1” additivity=“false” level=“info”>
  <AppenderRef ref=“logMessagesAppender”/>
 </Logger>
 <!-- … other modules -->
 <Logger name=“cros.packageN” additivity=“false” level=“info”>
  <AppenderRef ref=“logMessagesAppender”/>
 </Logger>
</Loggers>
</Configuration>
Table 1 synthetizes the main components of the custom appender class.
The code sequence that needs to be executed in order to trigger the appender is similar to this one:
//logger declaration
private static final Logger logger = LoggerManager.framework(SessionFilter.class);
//setting logging parameters
ThreadContext.put(“parameter_name”, “parameter value”);
//logger triggering
logger.debug(“Call performed with session “ + session.getId() + “ at “ + servletPath);

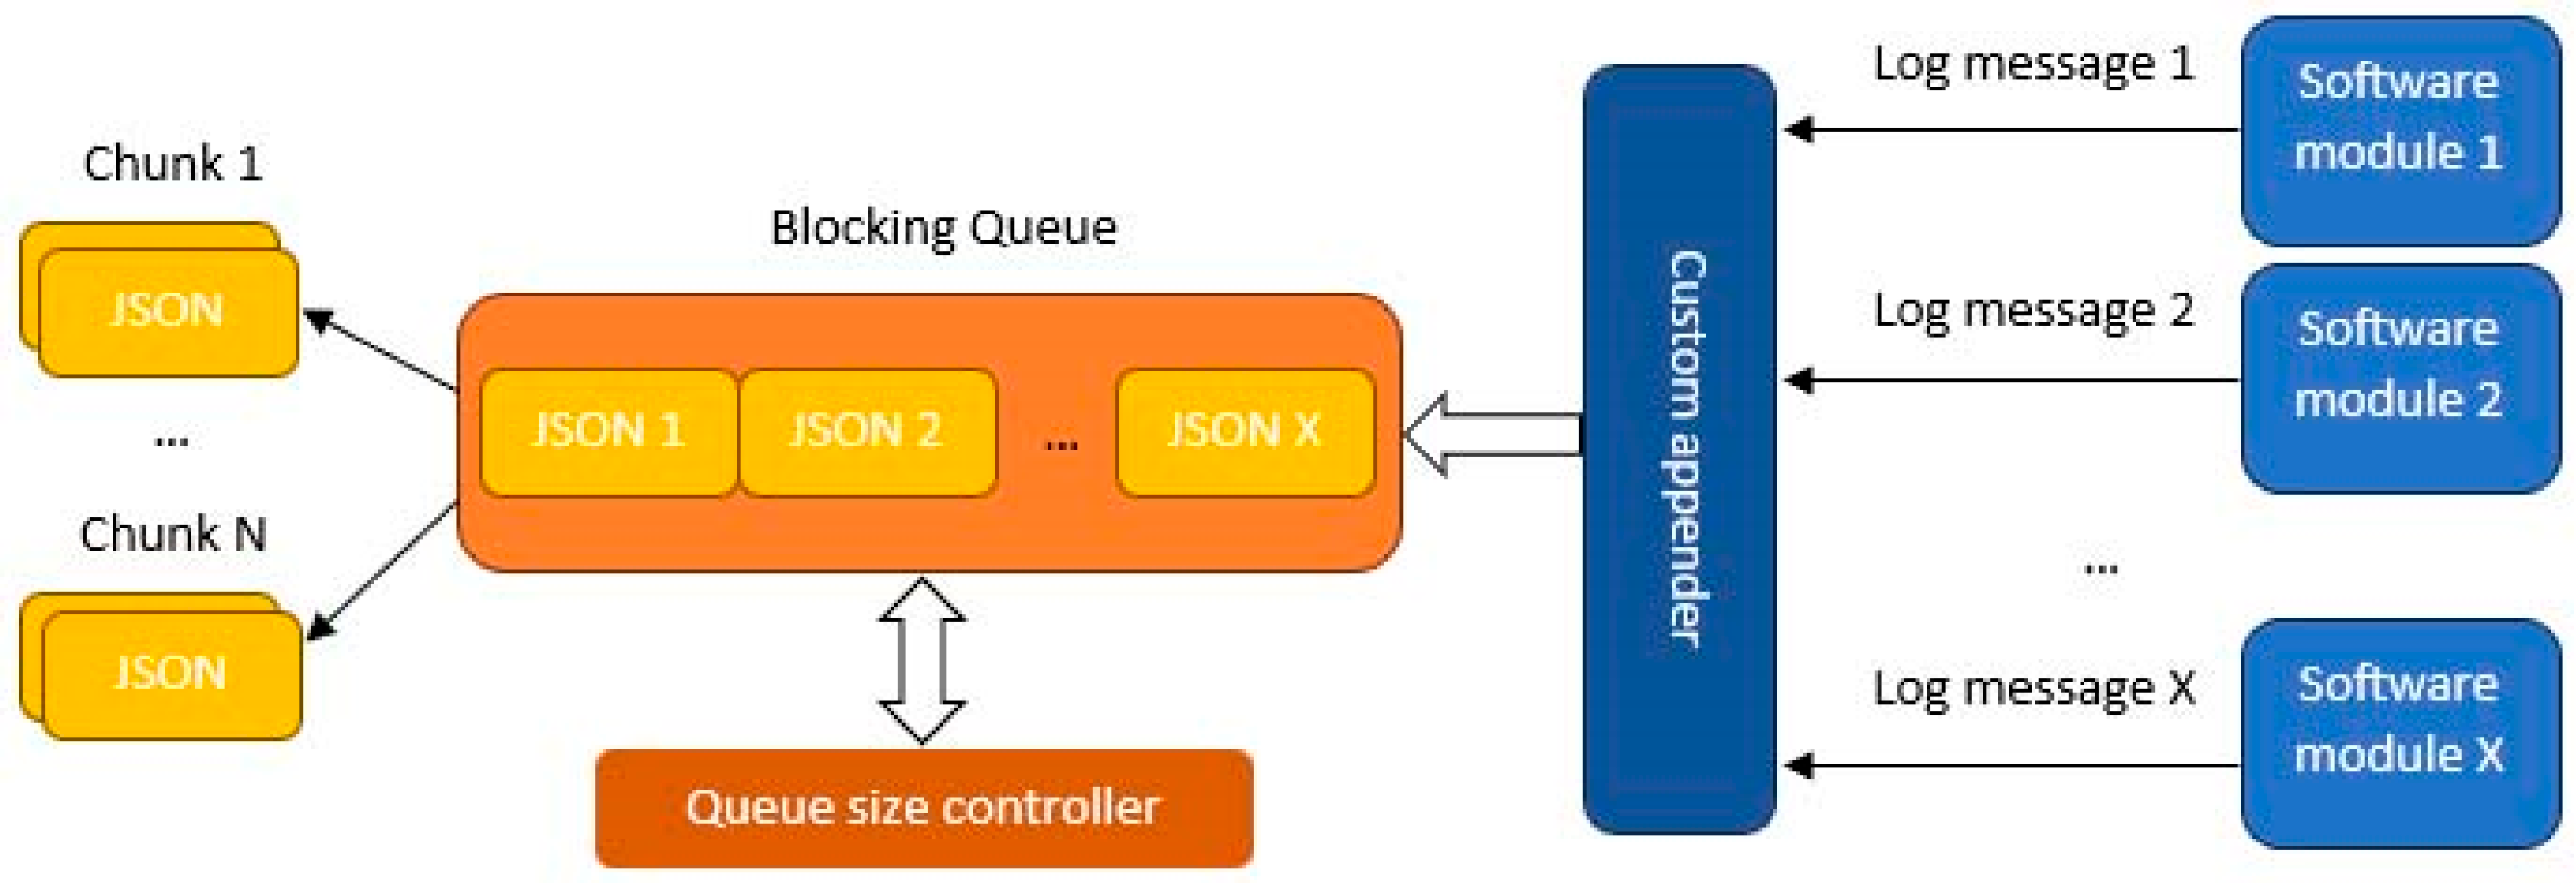
Custom Appender Functionality

The custom Appender needs to collect all the data specific to the logging messages coming from various Crosweb software modules (JSON objects composed of specific values associated with the required attributes) and to store them individually into an accumulator variable. Once accumulated, the stored values will be extracted in chunks and delivered to an external unique service that will be later interrogated by the software processes that will analyze the logged information.
Since the Appender is called asynchronously from different Crosweb modules, it is vital for the accumulator’s good functionality to have a thread-safe functionality (storing entities that are accessed by a single process at a single moment in time).
The accumulator must be able to perform the following actions:
  • Add new singular entries to its own internal repository, in a thread-safe manner.
  • Extract chunks of data from the repository, in a thread-safe manner.
  • Monitor its capacity and handle the edge case scenarios (empty or full).
After a close analysis of the available variants, the ArrayBlockingQueue [31] class was selected for implementing the accumulator. It models a queue able to handle generic type data and manifests methods for all the insertion/extraction operations.
Having queue behavior, an ArrayBlockingQueue instance allows inserting the data into one end while the extraction is performed at the other one. This suits our implementation’s needs perfectly since the older messages must be processed first, thus ensuring the first two items from the list above are checked.
The blocking characteristic refers to restraining simultaneous access to the queue’s content. This ensures thread-safe access to the queue’s data concerning the insertion and extraction operations.
A minor disadvantage manifested by the ArrayBlockingQueue instance refers to the fixed queue capacity. The maximum size is specified during its creation and cannot be modified. Our solution to this problem consists of the following aspects.
For a memory-efficient implementation, a predefined size is used for establishing the queue’s capacity. Each time a new item is added to the queue, the current size is compared to the maximum available capacity. If a safety threshold (established at 80%) is exceeded, the queue’s size has to be increased by a predefined percentage (set at 20%). Due to the limitation mentioned in the previous paragraph, the only possible way of achieving this is to clone the queue instance and to copy the current content into a new and larger space.
For testing the cloning process and for simulating the real case scenarios, we implemented a mockup environment in which different queues filled with data were cloned into new ones with larger capacity. The items in the queues were String type, and the volume of an item was 255 characters. The process was timed, and the tests were performed on a regular machine with Intel(R) Core (TM) i7-10750H CPU @ 2.60 GHz and 16 GB of RAM. Table 2 presents the results obtained.
The conclusion is that the difference between the cloning times is insignificant and varies very little at large queue dimensions. The cloning process reaches a saturation point at 10–15 ms, and this is due to the operations performed to accomplish the queue cloning. First, the Java environment must identify a new available memory slot big enough to fit the new queue capacity. Secondly, a shallow copy is created to preserve the existent queue content. Creating a copy of this kind involves almost the same amount of effort. Spotting the new contiguous memory zone determines the cloning duration difference between the small queues and the big ones. The small queues are satisfied by any available small memory fragment (easier to be found by the memory allocation system). The capacity required for storing bigger queues is similar for larger queues because, even different, are part of the same memory category range. The memory-finding effort depends firstly on the memory category range and only secondly on the actual size required.
The Appender’s functionality with its associated queue is reflected in Figure 4.
Managing the blocking queue is a typical producer–consumer process. Inserting the JSON objects in the queue is an asynchronous process and is controlled entirely by the natural occurrence of logging messages. Extracting the stored objects is an independent time-based iterative activity. Therefore, a separate independent thread is made responsible with extracting the JSON chunks from the queue. Based on an established timestep, the data to be delivered is eliminated from the queue. After that, it will be transformed into HTTP deliverable information (arrays of characters) ready to be sent to the central accumulator. The sending itself is implemented as a POST request delivered to a specialized service attached to the central log accumulator.

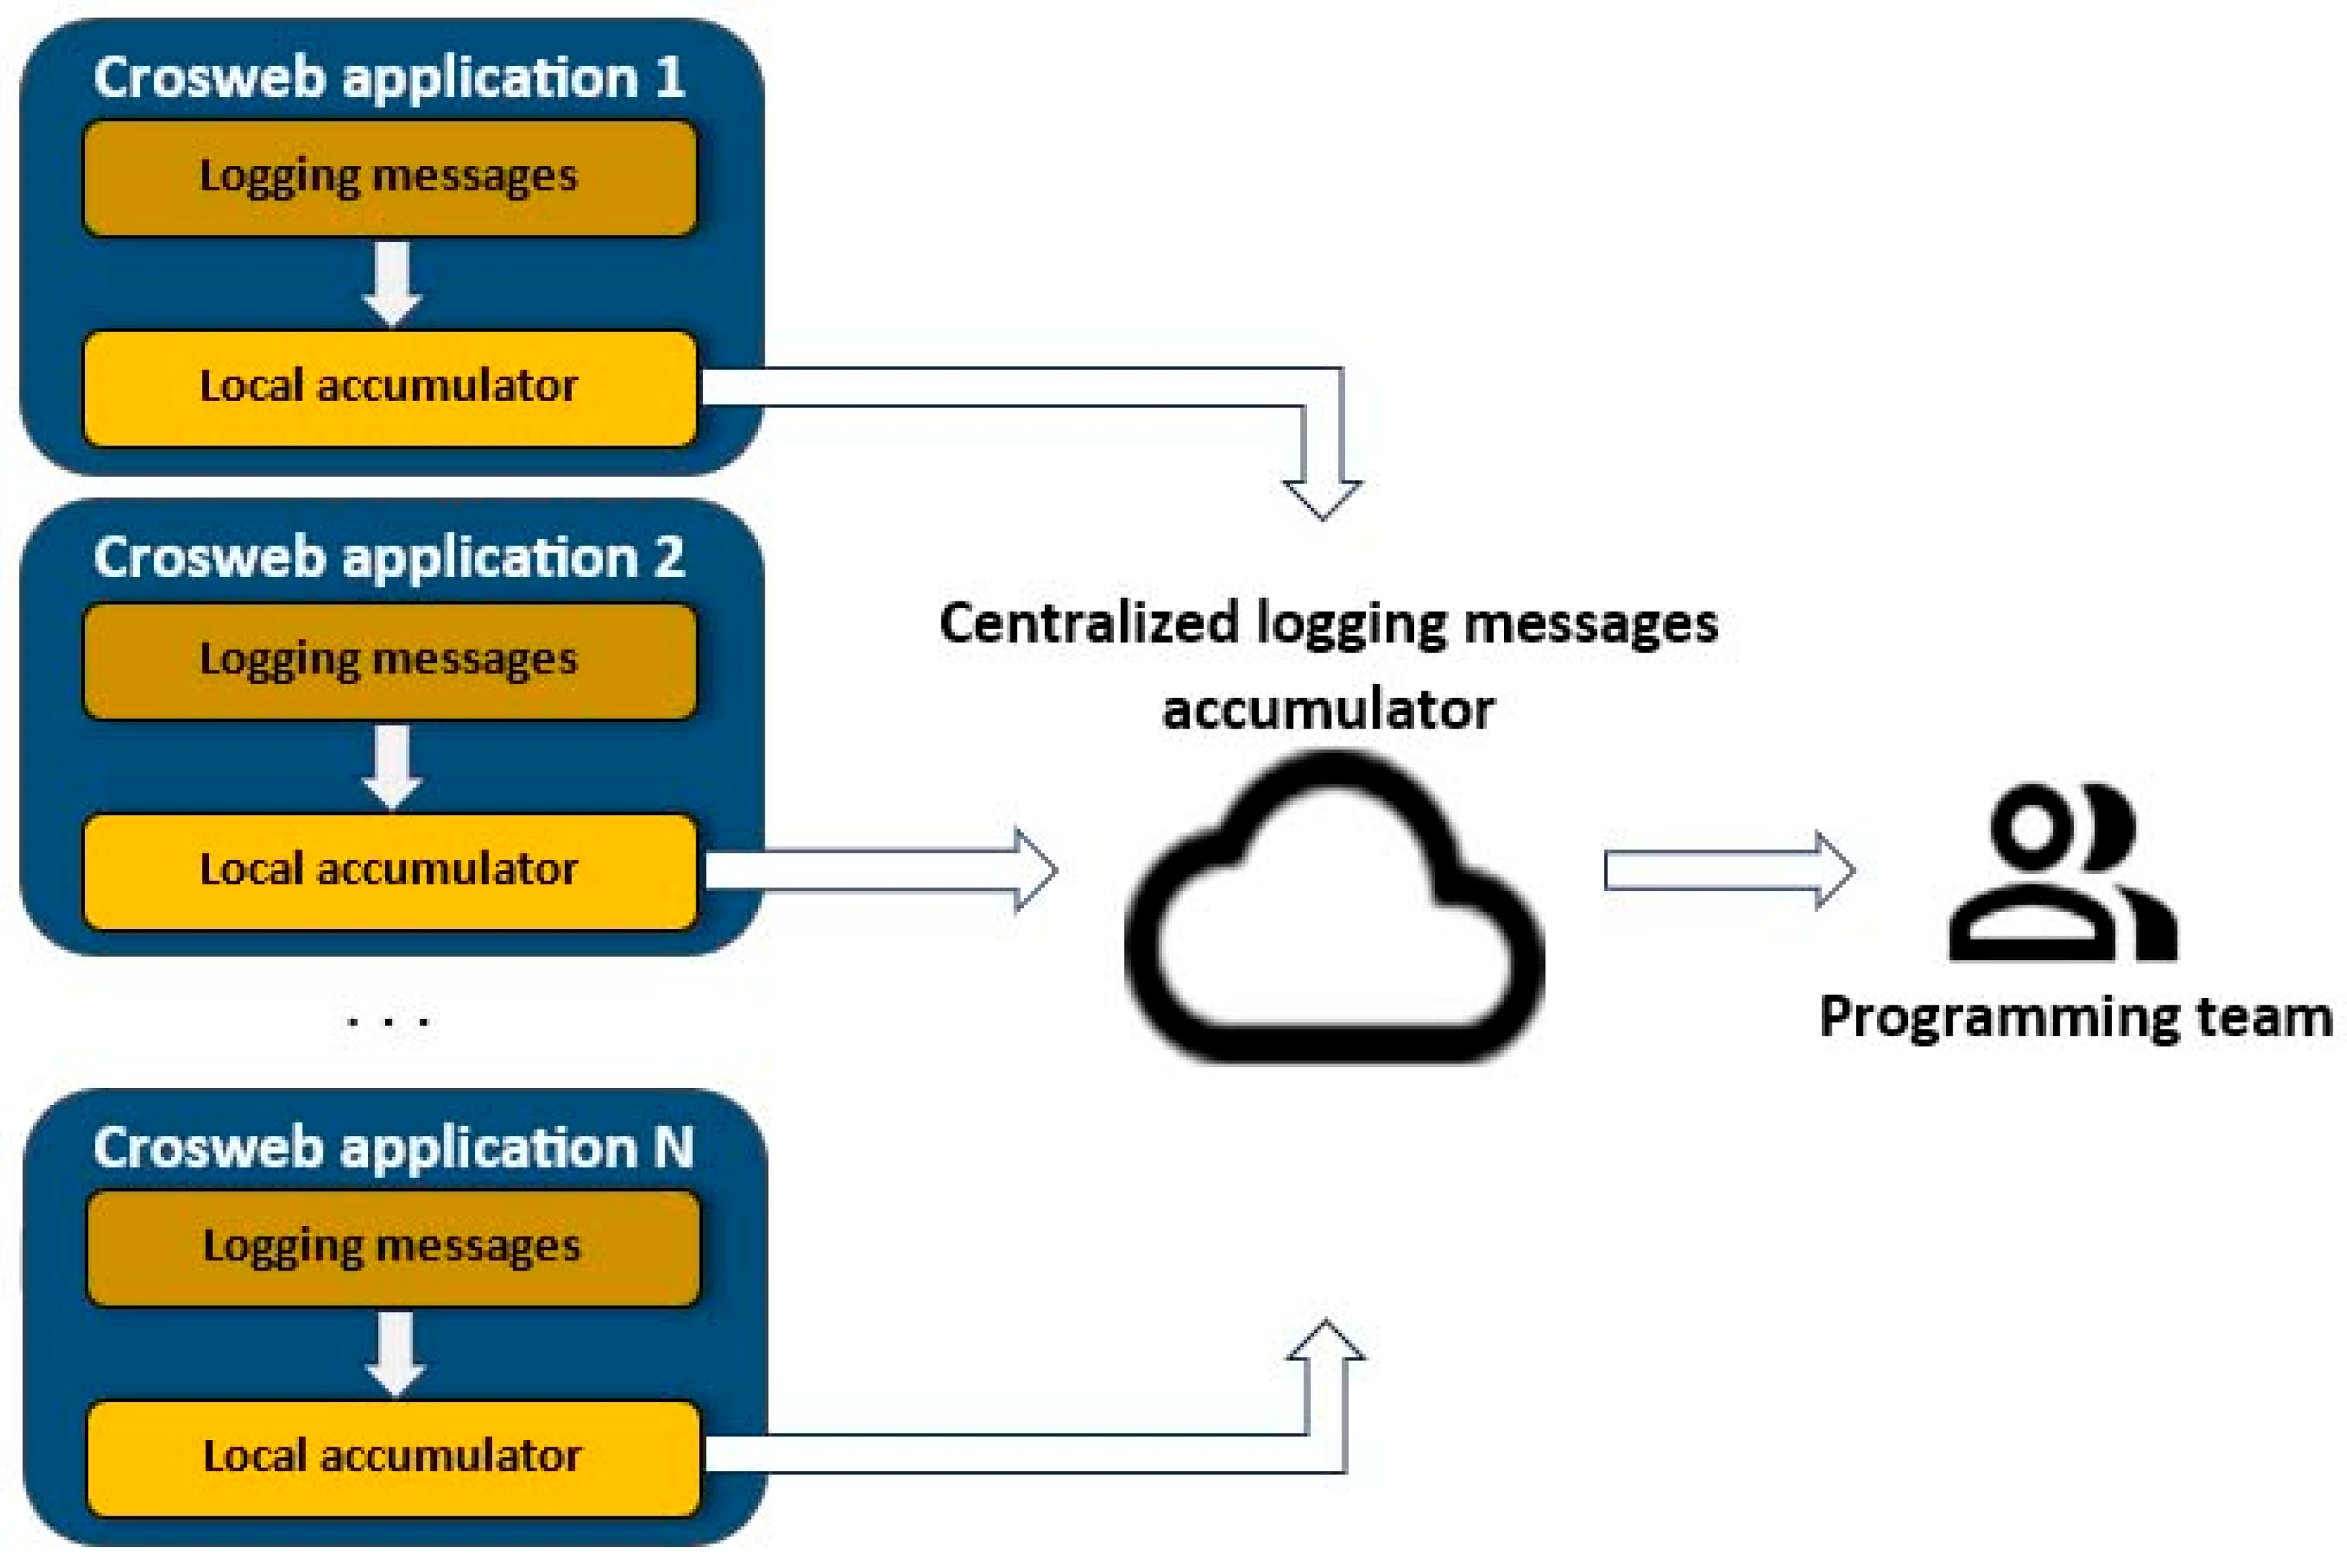
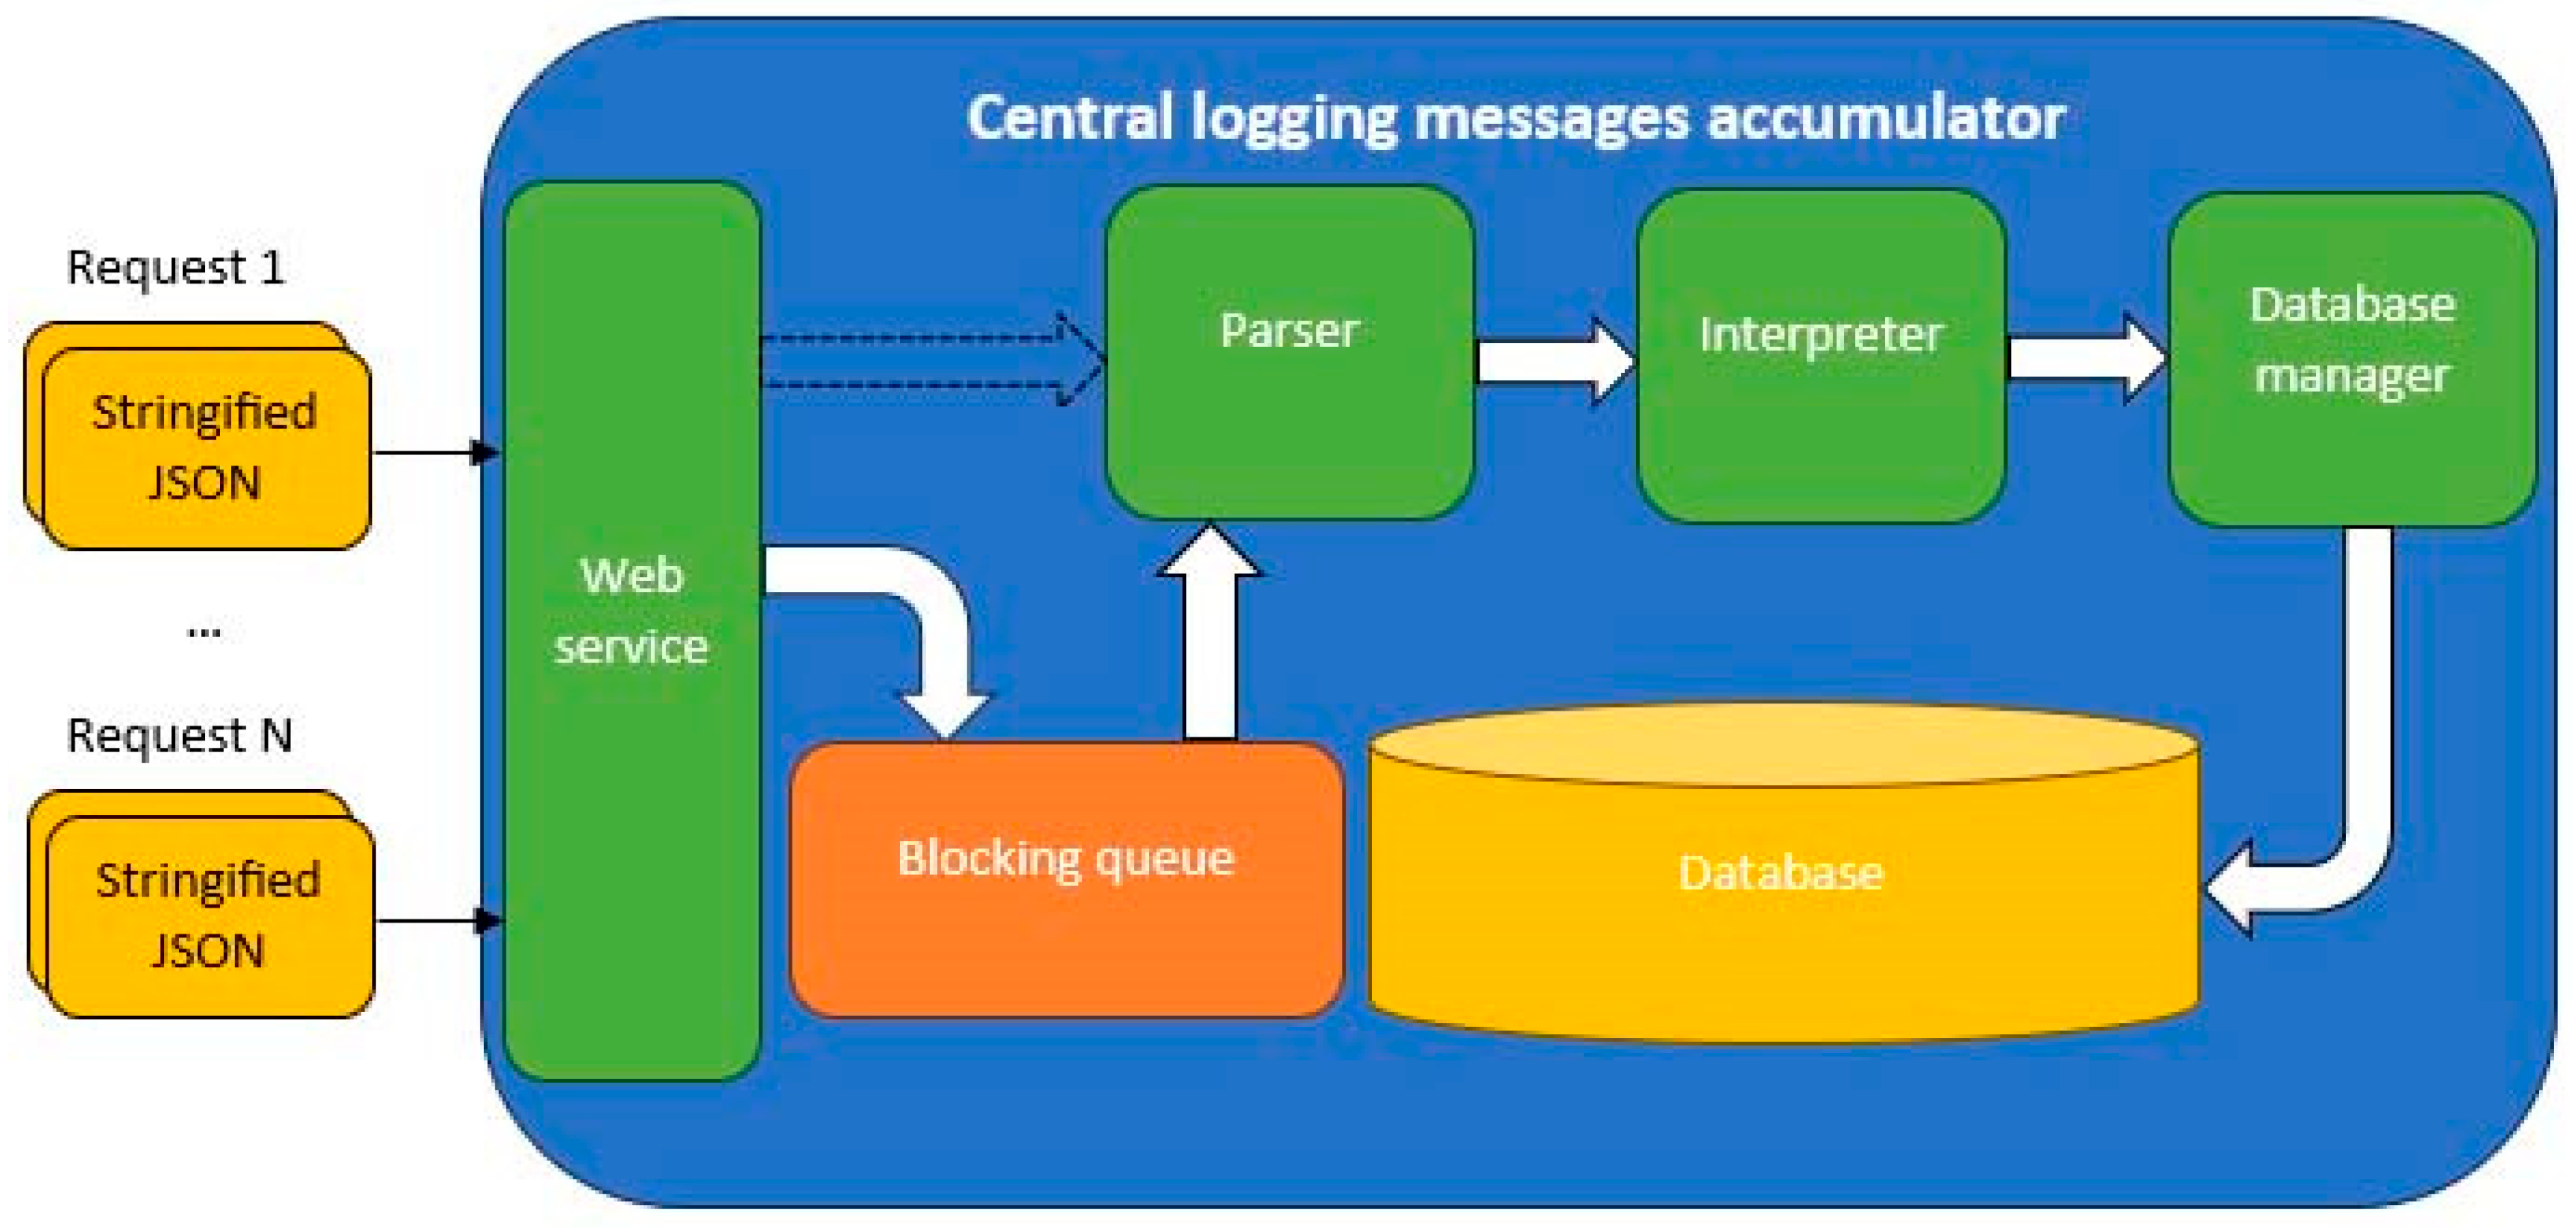
3.2.3. The Central Logging Messages Accumulator

The central log messages accumulator’s role is to receive all the requests coming from all the remote Crosweb applications via HTTP POST requests.
Once received, the information must be parsed, and the original JSON objects must be restored. An interpreter will analyze the values and will prepare them for being stored. A module specialized in database operations will format the corresponding insert queries thus storing all the values attached to the JSON attributes. The concept is illustrated in Figure 5.
The parser reconstructs the received stringified JSON objects, retrieved from the queue.
The interpreter transfers into a local class instance the representation of the JSON object. Each JSON data depends on the specific Crosweb context that served at producing it; therefore, the number of keys will vary. This leads to different degrees of class instance attribute completion.
For the database manager to produce valid storing syntaxes, a maximum possible set of attributes was defined. The corresponding values have either specific (if found in the JSON object) or predefined values.
Currently, there are 15 major deployments of Crosweb ERP applications. Each one has an average of 1000 registered users, mainly consisting of employees that manage their companies’ data based on specific access permissions. This means that a maximum of 1000 Crosweb instances run permanently in the 15 machines that provide the necessary infrastructure.
Each Crosweb running instance produces an average of 200 logging messages/functioning hour. Running 1000 instances will produce 200,000 logging messages/functioning hour. All the 15 Crosweb deployments will deliver a maximum of 3,000,000 logging messages/functioning hour to the centralized logging accumulator.
The centralized accumulator’s web service is permanently under pressure. Processing the received data as they arrive will create input latencies and will force the web service to respond even more slowly. To avoid that (the greyed arrow in the previous image), the only way to properly parse, interpret and store in the database the required information is to introduce a mechanism similar to the one used when the data are sent.
A blocking queue is fed instantly with the received raw logging messages, packed as they were transported. A consuming execution thread extracts the oldest entries stored in the queue and passes the corresponding data through the rest of the processing steps.
The size of the blocking queue is adaptable and controlled by a threshold set to 80%. This means when the number of entries exceeds the threshold, the capacity is increased by another 20%. The maximum number of 3,000,000 logging messages/h is equivalent to 833.33 messages/s. That number is rarely reached since not all the users are logged in the same time interval. A realistic measurement proves that not even half of the logging messages are sent.
The starting queue capacity is set to 200,000 elements. The size-increasing policy needs to be applied 2 or 3 times at some point during runtime, therefore raising the capacity to 240,000 (after the first increase), 288,000 (after the second increase) and 345,600 (after the third increase).
Processing a single received packed logging message involves the following steps:
  • Queue extraction.
  • Parsing.
  • Interpretation.
  • Database insertion.
On the same computing machine used for emitting the logging messages (Intel(R) Core (TM) i7-10750H CPU @ 2.60 GHz and 16 GB of RAM), passing a message through all the above-mentioned steps takes between 900 ns and 1 ms.
Table 3 presents the time balance required for managing the raw messages queue.
The consumer thread step indicates how often its run method is executed. The raw messages processed/cycle are obtained by dividing the maximum number of messages/second (833.33) by the number of times the consumer thread is executed/second. We considered the maximum processing time required for a message (1 ms). By multiplying these two values, the maximum total time required is calculated. The exceeding time is obtained by subtracting this last value from the consumer thread time step.
We can conclude that even in the worst-case scenario (maximum number of logging messages sent to the centralized accumulator), the queue is able to be parsed by the consumer thread without entering a process in which the data are accumulated at a higher rate than their consumption. In addition, the more capable the hardware of the machine that runs the centralized accumulation mechanism is, the shorter the processing times and the bigger the exceeding times left unused will be.
Table 4 presents the class diagram of the central logging messages accumulator.
The LogServlet’s class implementation relies on 2 other classes:
  • LogJSONInterpreter—a class specialized in interpreting the JSON stringified data.
  • LogQueueConsumer—a consumer thread-type class that digests the data stored in the queue.

3.2.4. The Centralized Logging Messages Displayer

The final utility of the entire mechanism presented in this paper is a web interface, also implemented using the Crosweb platform, that displays in an intuitive way the logging data stored in the central logging messages accumulator’s database. It is a tool accessed only by the programming team and it serves to perform the following functions:
  • Form a global view about the health of all the Crosweb deployments.
  • Deliver the required information for fixing the eventual abnormal situations that may occur.
The displayer allows filtering the presented logging data according to all the stored fields, the most used ones being as follows:
  • By date.
  • By logging message type (ERROR, DEBUG, etc.).
  • By Crosweb client identifier.
  • By module name.
  • By request type.
  • By Crosweb package.
  • By Crosweb component.
The logging information is presented in a read-only format and has two views:
  • An abbreviated initial view containing the main characteristics of the logged data. This view is the default one.
  • An extended view containing all the database-stored fields related to the logged data. This view is presented only if requested by the programmer who analyzes the logs.
Both views are endowed with textual annotation facilities. The annotations will keep track of the user, the date and the attached comment.
The displayed log entries can be flagged. The initial state of the database stored log data is “new”, and the programmers can flag it as follows:
  • “viewed”
  • “obsolete”
  • “in progress”
  • “solved”.
Each status change is stored along with the date on which it was processed.
The status codes also serve as log messages filtering criteria.

4. Results

The success of the implemented centralized logging mechanism can be measured using the following criteria:
  • C1—Global measurement: considering the effectiveness of solutioning the reported errors that occurred in the ERP solutions developed using the Crosweb platform.
  • C2—Metrics measurement: analyzing specific measures that reflect the effort made by the platform to manage successfully the logging messages

4.1. C1—Global Measurement

The programming team’s performance was analyzed during error fixing processes, before and after implementing the centralized logging mechanism. The info messages were not considered as relevant in this context. The results are presented in Table 5.
The efficiency gained in error solving time is due to shortening the time of acquiring the reported problem’s nature, the solutioning itself being unaffected. Due to the centralized logging mechanism, an average of 20 min is spared, irrespective of the error localization.

4.2. C1—Metrics Measurement

The effort made by the Crosweb platform for acquiring, sending, storing and retrieving the logging messages was measured on a server system with the following hardware specifications Intel(R) Xeon E-RS100-E11 CPU and 128 GB of RAM. The measured values are mentioned below:
  • RAM Memory usage for storing the logging messages queues: an average of 500 messages/queue, each message having an average of 1000 characters: 500 Kbytes (round up from 488.28 Kbytes).
  • Time intervals elapsed for delivering the stringified JSON objects representing the logged messages: less than 1ms added with the network ping time.
  • Database storage capacity used for an average of 500 users/h/Crosweb ERP, 1000 logging messages/h: 500 Mbytes/h. This produces an average of 4 Gbytes/work day (assuming there are roughly 8 working hours/day). In a month with an average of 20 working days, approximately 800 Gbytes will be consumed for storing the logged data.

5. Discussion

The implementation of the centralized logging mechanism started from a concrete need of gathering in a single place all the reported information produced by distributed Crosweb applications deployments. The complexity of the functioning scenario correlated with the multitude of software modules and versions transformed the debugging process into a real challenge. Most of the time spent by the programming team solving the reported problems was consumed by gathering the necessary information. This problem needed to be addressed.
The solution passed through several conceptual and implementation phases. Besides the final approach presented in this paper, several other variants were considered.
Catching and detouring the logged messages was first implemented with a custom appender class that had to be instantiated in each source code capable of signaling logging messages. The approach was conceptually valuable, but from the implementation point of view, it presumed modifying a very large amount of source code files. A better approach was needed, and we came up the idea of an appender that is triggered automatically by the system each time a logging message was launched.
The structure of the JSON objects representing the logged data had to be deeply analyzed. The stored information had to cover all the identifiers needed for properly isolating the machine, user, software module and component, completed with the content of the actual reported problem. Some data could be extracted from the custom appender itself, while other fields had to be populated in other Crosweb modules that control the user sessions. Everything was packed after finding a common denominator of all the logging messages for packing them in a unitary representation.
Managing the logging messages accumulation (on the Crosweb deployment machines or on the central accumulator computer) also involved a considerable amount of programming effort. Once the thread-safe producer–consumer mechanism was implemented, it had to be extensively tested to make sure that all the edge cases were properly covered, and no logging message is left unhandled. The consumer thread policy works on data chunks extracted from the queues and depends on several configuring variables that need adjustment during runtime (empty queue, number of items smaller than the defined chunk size, etc.).
Choosing the right Java class for implementing the queues also needed adequate attention. We had to decide whether we had to implement from scratch a new accumulator, or to use the facilities offered by some existent queue implementations.
The large volume of logging data produced by any Crosweb application had to be handled during development and testing. Mock environments had to be implemented to perfect the centralized logging methodologies and to simulate the real-life scenarios. This task was also solicitating due to the complexity of each Crosweb project and the variety of the maneuvered data.
An immediate future development refers to securing the communication channel between the satellite servers that host Crosweb ERP products and the central server that gathers the logged data. Currently, the stringified JSON objects are sent embedded in common web requests, therefore being vulnerable to man-in-the-middle attacks. The vulnerability is only superficial, since the data transfer is performed using the HTTPS protocol. Since the transferred information is represented as character sequences, a direct approach would consider coding/decoding the associated information. For preserving the volume of the maneuvered data, any variant of scrambling algorithms can be used.
The visual interface that represents the utility of the presented mechanisms was the easiest to implement. It has the basic functionalities manifested by a common database administrator module.

6. Conclusions

6.1. Achievements

This paper presents our approach to solving the problem of accessing the logging messages launched by complex ERP applications built using the Crosweb platform and deployed on the clients’ machines. The associated data are initially displayed only in remote consoles or files, thus making them hardly accessible for the programming team. Additional effort and time are spent by the specialists that is not efficiently oriented towards solving the actual problems, instead being counterbalanced by gathering the information stored in the reported logging messages.
The Crosweb software stack complexity, the processing times already required for assembling a certain outputted web page and the confidentiality rules imposed by our ERP solutions’ clients eliminate the usage of third-party external logging services already implemented (Elastic Stack [15], Splunk [16], Fluentd [17], etc.).
The solution consists of implementing an adjacent centralized logging mechanism that gathers the reported log data from all the currently deployed applications. The presented material is focused on the concepts and implementation that overcome the detected disadvantages and streamlines the process of errors analyzing mechanisms, allowing the programming team to focus on solving the reported problems instead of acquiring the information that describes them.
Our implementation consists of two main modules. The first one is deployed on each machine that runs our deployed ERP solutions and has as main job collecting the logging messages into an adaptable queue type local accumulator. Once stored, a consumer thread extracts the logged information and delivers it to the second module, external to all the individual ERP deployments, that centralizes the reported data. Since the central accumulator gathers logging messages from all the machines that run our ERP solutions, the actual reported data must be accompanied with additional information that serves at identifying its origin and issuing context (specific machine, module, package, date, etc.).
Both modules are based on thread-safe producer–consumer independent processes. The internal accumulators’ size is monitored and adapted according to the current data volume. Efficiency studies have been performed to decide if the implementation is able to handle the worst-case scenarios defined by the data size and the accumulation rate.
A visual interface accessible by the programming team offers a centralized place for analyzing the logged data. The displayed data can be filtered to identify the searched items according to multiple criteria. Annotation facilities allow the programming team to mark the status of each reported problem’s solving process.

6.2. Further Directions

There are some aspects that will need to be implemented as future development of the centralized logging mechanism.
The first aspect refers to establishing an upper limit on the logged data volume. At the rate the logging messages are currently acquired, there will be an acute need of enlarging the database capacity. For avoiding such extreme measures, there are a few ideas worth implementing:
  • Preserving only the latest logging information. The data older than a predefined time threshold can be automatically overridden.
  • Selecting the logging messages severity that need to benefit of the centralized logging mechanisms. Usually, only the occurred errors need a quick solution, and these kinds of situations occur very rarely in the deployed ERP products; they are more common in the development and testing phases.
The second improvement feature refers to analyzing the logged data. The most problematic scenarios can be identified, and some future predictions can be made. In this respect, various AI predictors can be used to estimate the possible outcomes of the contexts of the future Crosweb ERP applications.

6.3. Final Words

Our work and the knowledge involved can be extrapolated and customized for helping to implement centralized logging mechanisms in other informatic systems, not necessarily dependent on the Crosweb platform and that cannot use external third-party logging systems. Applying the presented concepts and technologies offer a complementary logging level that is much more accessible and relevant to the technical staff.

Author Contributions

C.S.: Conceptualization, Architecture, Formal analysis, Methodology, Implementation, Writing—original draft, P.G.P.: Database analyst, Database syntaxes, Stored procedures, C.G.: Crosweb platform maintenance, Programming team leader, Validation. All authors have read and agreed to the published version of the manuscript.

Funding

The work was supported by the project: “Innovative technological models for the design and use of database applications, which will ensure the complete separation of the logical model of the data from the implementation details and running on multiple platforms, including running in the cloud”. Project code: POC/163/1/3/121403, Project co-financed by the Operational Program Competitiveness (POC) 2014-2020 Component 1: Innovative Technology Project, Priority Axis: Research, Technological Development and Innovation (RDI) in support of economic competitiveness and business development.

Institutional Review Board Statement

Not applicable.

Informed Consent Statement

Not applicable.

Data Availability Statement

The implemented technologies can be discussed and provided by request; the logging database can be discussed by request and with the approval of Crisoft Romania.

Conflicts of Interest

Author Christian Gavrilă was employed by the company Crisoft Romania. The remaining authors declare that the research was conducted in the absence of any commercial or financial relationships that could be construed as a potential conflict of interest.

References

  1. Distributed Applications. Available online: https://www.techtarget.com/searchitoperations/definition/distributed-applications-distributed-apps (accessed on 1 March 2024).
  2. Software Versioning Best Practices. Available online: https://cpl.thalesgroup.com/software-monetization/software-versioning-basics (accessed on 15 January 2024).
  3. How Can You Effectively Handle API Versioning and Maintenance in Large-Scale Projects. Available online: https://www.linkedin.com/advice/0/how-can-you-effectively-handle-api-versioning-maintenance-asxwf (accessed on 15 January 2024).
  4. Generating Log Messages from Your Code. Available online: https://developer.apple.com/documentation/os/logging/generating_log_messages_from_your_code (accessed on 13 February 2024).
  5. Logging Levels. Available online: https://www.xcitium.com/knowledge-base/logging-levels/ (accessed on 13 February 2025).
  6. Formatting Log Messages. Available online: https://docs.gigaspaces.com/latest/admin/logging-formatting-messages.html (accessed on 3 February 2024).
  7. Windows Logging Guide: The Basics. Available online: https://www.crowdstrike.com/guides/windows-logging/ (accessed on 20 February 2024).
  8. View Log Messages in Console on Mac. Available online: https://support.apple.com/guide/console/log-messages-cnsl1012/mac (accessed on 20 February 2024).
  9. Java Logging Overview. Available online: https://docs.oracle.com/en/java/javase/11/core/java-logging-overview.html#GUID-B83B652C-17EA-48D9-93D2-563AE1FF8EDA (accessed on 21 February 2024).
  10. Getting Started Quickly with C++ Logging. Available online: https://www.sentinelone.com/blog/getting-started-quickly-cplusplus-logging/ (accessed on 21 February 2024).
  11. (Python) Logging Howto. Available online: https://docs.python.org/3/howto/logging.html (accessed on 21 February 2024).
  12. Console: Log() Static Method. Available online: https://developer.mozilla.org/en-US/docs/Web/API/console/log_static (accessed on 11 February 2024).
  13. How to Log Messages to Different Files. Available online: https://symfony.com/doc/current/logging/channels_handlers.html (accessed on 11 February 2024).
  14. Guidelines for Creating a Logging Database. Available online: https://www.ibm.com/docs/en/cognos-analytics/11.1.0?topic=messages-guidelines-creating-logging-database (accessed on 11 February 2024).
  15. Elastic Stack. Available online: https://www.elastic.co/elastic-stack (accessed on 14 February 2025).
  16. Splunk. Available online: https://www.fortinet.com/resources/cyberglossary/what-is-splunk#:~:text=Splunk%20is%20a%20big%20data,management%2C%20compliance%2C%20and%20security (accessed on 22 January 2025).
  17. Fluentd. Available online: https://www.fluentd.org/ (accessed on 2 February 2025).
  18. Database|Oracle. Available online: https://www.oracle.com/database/ (accessed on 26 February 2024).
  19. Java|Oracle. Available online: https://www.java.com/en/ (accessed on 15 January 2024).
  20. Apache Tomcat. Available online: https://tomcat.apache.org/ (accessed on 29 January 2024).
  21. Java JDBC API. Available online: https://docs.oracle.com/javase/8/docs/technotes/guides/jdbc/ (accessed on 20 February 2024).
  22. CSS: Cascading Style Sheets. Available online: https://developer.mozilla.org/en-US/docs/Web/CSS (accessed on 30 January 2024).
  23. JavaScript|MDN. Available online: https://developer.mozilla.org/en-US/docs/Web/JavaScript (accessed on 30 January 2024).
  24. Apache Logging Services Log4j. Available online: https://logging.apache.org/log4j/2.x/ (accessed on 10 January 2024).
  25. Apache Maven Project. Available online: https://maven.apache.org/ (accessed on 11 January 2024).
  26. Configuring Log4j 2. Available online: https://logging.apache.org/log4j/2.x/manual/configuration.html (accessed on 20 February 2024).
  27. Log4j 2 Architecture. Available online: https://logging.apache.org/log4j/2.x/manual/architecture.html (accessed on 13 February 2024).
  28. Logger Class (Java SE 21 & JDK 21). Available online: https://docs.oracle.com/en/java/javase/21/docs/api/java.logging/java/util/logging/Logger.html (accessed on 2 February 2024).
  29. Log4j 2 Appenders. Available online: https://logging.apache.org/log4j/2.x/manual/appenders.html (accessed on 2 February 2024).
  30. JSON. Available online: https://www.json.org/json-en.html (accessed on 23 February 2024).
  31. ArrayBlockingQueue Class. Available online: https://docs.oracle.com/en/java/javase/21/docs/api/java.base/java/util/concurrent/ArrayBlockingQueue.html (accessed on 21 February 2024).
Figure 1. Initial logging in the Crosweb software hierarchy.
Information 16 00216 g001
Figure 2. The disruption introduced by logging messages localization.
Information 16 00216 g002
Figure 3. The concept of centralized logging messages management.
Information 16 00216 g003
Figure 4. Storing and extracting logging messages.
Information 16 00216 g004
Figure 5. Processing the logging messages data in the central accumulator.
Information 16 00216 g005
Table 1. The custom appender class diagram.
LogMessagesAppender Class
Class headerclass LogMessagesAppender extends AbstractAppender

//variables for ensuring the synchronicity
private final ReadWriteLock readWriteLock
private final Lock readLock

//thread that sends the accumulated data
LogMessagesSender log_messages_sender;

//other helper variables
Class attributes
Class methods
//constructor
protected LogMessagesAppender(String name, Filter filter, Layout<? extends Serializable> layout, final boolean ignoreExceptions);

//appender start method (overridden)
public void start();

//append method (populate and store the JSON representation of the current logging message)
public void append(LogEvent event);

//method that triggers the log_messages_sender
public void processJSONObject(String JSON_object);
Table 2. Blocking queues cloning times correlated with the number of entries.
Initial Queue CapacityQueue Increase PercentageQueue Cloning Duration
500 items20%1–5 ms
1000 items20%1–7 ms
2000 items20%2–9 ms
10,000 items20%5–12 ms
100,000 items20%10–15 ms
500,000 items20%10–15 ms
Table 3. Raw messages processing times.
Consumer Thread StepRaw Messages Processed/Cycle Time Required for Processing 1 Raw MessageTotal Time RequiredExceeding Time
500416.661 ms416.66 ms83.33 ms
1000833.331 ms833.33 ms166.66 ms
20001666.661 ms1666.66 ms333.33 ms
Table 4. Centralized messages accumulator class diagram.
LogServlet Class
Class headerclass LogServlet extends HttpServlet

//the logging queue
BlockingQueue<Map<String, Map<String, String>>> queue;

//queue capacity
int queue_size;

//the consumer process
LogQueueConsumer consumer;
Class attributes
Class methods
//constructor
public LogServlet();

//requests servicing method (overridden)
@Override
protected void doService(HttpServletRequest request, HttpServletResponse response, JSONObject authorizationPayload) throws HttpException, DataException, IOException

//request parsing method
public Vector parseRequest(HttpServletRequest request);

//queue appending method
public void appendToQueue(LogJSONInterpreter json_interpreter);
Table 5. Centralized logging efficiency.
Error LocalizationAvg. Error Solving Time (Before Centralized Logging) [min.]Avg. Error Solving Time (After Centralized Logging) [min]Improvement [%]
Web interface604033.33%
Database452544.44%
Software module (Java code)12010016.66%
Infrastructure18016011.11%
Disclaimer/Publisher’s Note: The statements, opinions and data contained in all publications are solely those of the individual author(s) and contributor(s) and not of MDPI and/or the editor(s). MDPI and/or the editor(s) disclaim responsibility for any injury to people or property resulting from any ideas, methods, instructions or products referred to in the content.

