Abstract
This research explores the impact of social media metrics on revenue growth, specifically focusing on Instagram, a leading platform for businesses to engage consumers and promote offerings. It examines key metrics such as reach, impressions, interaction rate, and virality rate, which gauge user engagement with brand content. A novel metric, the loyalty rate, is introduced, combining interaction and virality rates to measure follower loyalty—those who not only engage but also share content, enhancing organic reach. The methodology involved comprehensive statistical analyses, including descriptive statistics, Pearson’s correlations, and regression models, to investigate the relationship between social media metrics and monthly turnover. The findings reveal a moderate positive correlation between the loyalty rate and turnover, although the statistical significance was insufficient to establish a direct relationship. In contrast, metrics like follower count exhibited a stronger influence on financial performance, indicating that follower growth may be more critical for revenue generation. This study concludes that while engagement and loyalty matter, their effect on turnover is part of a broader digital strategy encompassing various factors beyond direct interactions. Practical recommendations are made for enhancing the loyalty rate and expanding research to include other platforms, like Facebook and LinkedIn, for a more comprehensive understanding of social media’s impact on financial outcomes.
1. Introduction
Social media use has become crucial to business success, particularly when it comes to reaching out to their target market and advertising goods and services. Instagram has become one of the most well-known platforms in this regard, distinguished by its capacity to produce interactions and reach a sizable user base [1]. Many businesses, communication firms, and digital marketing agencies use this social network as a vital source of performance indicators that can have a direct impact on their financial outcomes, in addition to using it as a dissemination tool [2].
By examining these measures, we can have a better understanding of how social media interactions can support the expansion of the company’s revenue [3]. The sustainability of businesses depends on determining which elements directly affect business success in a digital age where interactions are constant [2].
The emphasis on Instagram is warranted given its widespread use and direct influence on how companies interact with and connect with their target consumers [4]. Through analysis, they aim to determine the true financial value of the attention and involvement that companies are able to garner from their followers. The evolution of social networks as marketing tools and the necessity for businesses to assess and optimize their digital presence are thus inextricably related to the research’s theme [5].
A significant portion of businesses’ marketing budgets are now allocated to the digital world and social media in particular. According to the literature on digital marketing, social media platforms like Instagram are crucial to how businesses engage with customers and advertise their goods [1]. In turn, investing in these media necessitates a thorough examination of their performance indicators to comprehend how social media actions affect businesses’ financial outcomes [2]. There are a number of performance indicators, including reach, impressions, and engagement rate, but there are currently fewer thorough studies on how these metrics affect invoicing directly [3].
Additionally, a lot of businesses struggle to assess whether social media presence and interactions are truly generating revenue [6]. Given the current environment, where businesses are continuously searching for strategies to defend their investments in digital marketing, this issue is especially pertinent [7]. Although social media platforms provide a wealth of data, marketing managers still face a number of difficulties in assessing follower loyalty and identifying which followers truly aid in the expansion of their businesses [5].
The desire to better understand the connection between follower engagement and the effect on financial success justifies the establishment of a new indicator, the “loyalty rate” [8]. This measure enables a more thorough understanding of follower behaviour and the value they contribute to the brand by integrating the interaction rate and the virality rate [4]. This study is pertinent not only because of the novel metric’s proposal, but also because it tackles a real-world issue that many businesses in the digital world face: how to accurately quantify the return on investment in social networks [2].
This study intends to provide and evaluate the novel metric known as loyalty rate in addition to analysing traditional metrics like reach, impressions, and interaction rate. Measuring follower loyalty and its direct effect on the company’s financial performance, this statistic is the average of the interaction rate and the virality rate. Understanding the effect of social media analytics, particularly Instagram, on the expansion of a business’s revenue will be the primary goal of this study. KOR Creatives will be taken into account for this research.
The goal of this study is to thoroughly examine the connections between income and metrics in order to determine which have the most impact on financial outcomes. In order to provide insights that can be applied to the management of your social media campaigns and optimize your strategies to maximize return on investment, we use statistical analyses of these variables, including regressions and correlations, to validate the effectiveness of the loyalty rate as an indicator of loyalty and financial impact.
A number of fundamental questions led this research and provided a foundation for the analysis and discussion of the findings. The following are the primary research questions:
- -
- What is the relationship between revenue growth and social media measures like reach, impressions, and interaction rate?
- -
- Is the loyalty rate, as suggested in this study, a reliable and accurate way to gauge Instagram follower loyalty?
- -
- In terms of revenue forecasting, what is the statistical correlation between the company’s monthly revenue and the loyalty rate, and how does this indicator stack up against other traditional metrics?
- -
- How can businesses use these insights to increase the return on their digital strategy, and what are the practical implications for social media management based on the data obtained?
Critical issues that require more investigation are highlighted by research gaps in the realm of social media and billing. First, there is still a lack of research on the direct relationship between social media measures like reach and engagement rate and their effect on revenue growth. Additionally, the absence of strong metrics to gauge devotion on Instagram, like the devotion rate, suggests that despite being a novel idea, it has not yet received widespread acceptance as a trustworthy indicator. The inability to effectively analyse revenue projections due to the limited comparability of classic and new measures is another crucial issue. Last but not least, study findings are frequently not put into practice; many studies only offer theoretical frameworks and do not offer helpful recommendations for businesses looking to maximize their digital strategies.
In order to provide a more precise evaluation of Instagram follower loyalty, this study presents the loyalty rate, a novel statistic. This innovative method has the potential to revolutionize how businesses gauge engagement and, as a result, guide their marketing initiatives. This study is notable for its thorough statistical analyses as well, which aim to demonstrate a relationship between monthly revenue and the loyalty rate. In addition to bridging current gaps, this quantitative method gives businesses a strong basis for understanding the connection between social media performance and financial outcomes, providing insightful information for decision-making.
Finally, by providing a useful tool for gauging follower loyalty, this study aims to add to the body of knowledge on social media metrics, particularly in the context of digital marketing. This paper attempts to fill a gap in literature and industry practice by offering a metric that measures both virality and direct engagement.
This study is divided into six parts. The context, problem relevance, goals, and research questions are all covered in the first section. The second segment examines the research on digital marketing, social media metrics, and how online interactions affect a company’s bottom line. The methodology, including data collecting and statistical analysis approaches, is covered in the third section. The studies’ findings, which emphasise the new statistic known as loyalty rate, are shown in the fourth section. A discussion of the practical and theoretical implications is shown in the fifth section. The results, study limitations, and suggestions for further research are covered in the last section.
2. Social Media Marketing
2.1. Contextualization of the Role of Social Networks in the Business World
Social networks have become more and more important in recent years. Social media platforms were utilized by almost 3.6 billion people in 2020, according to Statista data, and this figure is predicted to rise further [9].
Communication techniques have changed over the centuries, profoundly altering our day-to-day existence [10]. Social networks have become the primary mode of communication in the twenty-first century, offering a creative forum for expressing opinions, thoughts, and actions [10]. Businesses have also been significantly impacted by this communication method, realizing the need for a strong social media strategy to differentiate themselves in a constantly evolving digital environment [10]. Businesses must include many marketing strategies in order to build a strong social media presence and improve their brand in a number of ways. Additionally, Zachlod et al. [10] claim that businesses can significantly boost their chances of dominating the social media industry by combining unique approaches to customer interaction.
Social media has a big and wide-ranging impact [11]. In addition to transforming research methodologies, it has made it possible for businesses and their customers to communicate more effectively, thereby fortifying their relationship [12]. Companies now employ social networks in their marketing aims and plans to increase consumer involvement, gather valuable information about them, and strengthen customer connections, whereas in the past, social networks were used to give information about a company or brand [2]. Social networks are important in the advertising industry, which makes businesses more cautious in their strategies, anticipating customer reactions and avoiding potential blunders that could have a detrimental impact on network platforms [11].
As part of their digital transformation, B2C (business-to-consumer) organizations frequently use social media and reap its benefits, which include higher sales, brand exposure, and customer engagement [13,14]. These platforms serve as a hybrid kind of advertising, enabling businesses to communicate with their clientele while also fostering communication amongst clients [12]. Businesses must steer these discussions in a way that supports company objectives. Social media is the technology element of a business’s transactional communication and relationship-building that makes use of the network of clients and prospects to encourage value co-creation, according to marketing and sales studies [2]. Developing proprietary network platforms and engaging customers with blogs and other social networking tools are two tactics that are being used more and more [12]. The “big four” social networks—Facebook, YouTube, LinkedIn, and Twitter—are used by over 70.0% of businesses. Furthermore, according to Dwivedi et al. [2], 25.0% of businesses reported an increase in income on social media, and 50.0% said it enhanced their customer experience and marketing optimization.
Social networks are crucial to businesses’ digital transformation [2]. Social media marketing has emerged as a key subject for businesses, enabling them to communicate directly with consumers, advertise their goods, enhance their brand image, and foster client loyalty [11]. Nonetheless, it is critical for businesses to recognize that unhappy consumers can swiftly express their grievances, reaching a wide audience and possibly harming the reputation of the brand [15].
Businesses can combine their social media initiatives with their overall marketing plan to mitigate this risk and guarantee that social media marketing enhances brand image. This entails determining the characteristics of the target audience and tailoring communications to meet their unique requirements and preferences [11]. Businesses who wish to sell their goods are viewed as undesirable since social media has evolved into a user-centric space where people communicate, obtain information, and express their opinions. Organizations must so effectively build positive brand equity if they want to survive in the cutthroat online market [16].
2.2. Digital Marketing vs. Traditional Methods: Competitors or the Perfect Synergy?
Although social media marketing (SMM) is mostly conducted online, it is comparable to more conventional marketing strategies like word-of-mouth advertising. SMM is the process of using social media platforms to engage with or pique the attention of existing or future clients in order to promote a website, brand, or business [17].
Due to social media’s nature, business owners can quickly communicate with clients who live far away and advertise their company to a wide audience. Numerous research studies have examined the advantages and disadvantages of social networks for corporate organizations [18]. Because of their functionality and reach, social networks offer a valuable marketing environment. The American Marketing Association (AMA) states that marketing includes all of the institutions, actions, and procedures used to develop, convey, provide, and trade value propositions for partners, customers, and society at large.
Since direct user involvement can increase loyalty and impact purchasing decisions, it is clear that active user participation is a crucial component of social media marketing strategies as they continue to develop [19]. Unquestionably, social networks are changing how people live their lives, and in a similar way, they are changing how marketing is conducted. New social media platforms are essential for enhancing customer service, preserving ties with customers, communicating benefits, promoting brands or exclusive deals, creating new products, or influencing brand perception [20]. According to Ilodigwe and Uzoh [18], social media marketing is the process of creating, communicating, delivering, and exchanging value offerings with an organization’s stakeholders through the use of social media technologies, channels, and software.
This concept is mirrored in new social media developments, where we observe more current commercial uses like funding in addition to influencing firms’ promotional strategies [20].
2.3. Social Media’s Function in Marketing Goals
The range of objectives that businesses can accomplish with social media platforms has expanded dramatically with the rise in social media marketing usage [21]. The percentage of marketers who use social media tactics to accomplish different goals in a range of activities, including retail trade, customer relationship management, customer support, brand promotion and building, and market research [21] is shown in Table 1.

Table 1.
The top priorities for businesses utilizing social media marketing.
2.4. Social Network Consumer Behavior
Due to its capacity to promote social relationships and meet users’ need to preserve their social identities, social networks have grown rapidly in popularity. According to a poll, 61.0% of teenagers regularly check their social media accounts to see how their posts are being received, 36.0% check to see whether their friends are participating in their activities, and 21.0% keep an eye on unfavourable comments [22].
Prior research has emphasized how social identity affects how people behave online. Strong social identities in virtual communities have been shown to boost the likelihood of participating online [23]. This implies that a major driving force for social media use is social identity.
Furthermore, social media involvement directly affects how customers behave when making purchases. Managers can turn users into efficient customers by determining the elements that affect social media usage and purchase decisions. This adds value to assets and raises the possibility of marketing impact [24].
The demand for more efficient digital marketing is reflected in the fact that consumers use digital communication channels throughout their daily lives to learn about goods and services [25]. Businesses must modify their strategies to suit the digital environment, as the number of people using mobile devices to access the internet has increased to 4.1 billion worldwide, and there are 3.56 billion users on social networks [26].
In conclusion, knowing how advertising influences customer behaviour is essential to making more successful advertisements. While most customers are not actively looking for ads, effective advertising can boost sales and brand awareness by educating consumers about necessary goods or services [27].
2.4.1. Brand Awareness
Brand awareness can be defined as the degree of recognition that the consumer has in relation to a product or service from a given company [28]. This awareness is formed by taking into account important elements including human behaviour, brand management, advertising management, and strategic development. These components are essential for allowing the customer to buy the company’s goods or services. Moreover, the best strategy to advertise a brand using both direct and indirect marketing strategies is to raise brand awareness. Brand awareness can be one of a business’s most valuable assets in fiercely competitive markets [28].
2.4.2. Perception of Brand Awareness Among Consumers
Brand recognition has a neutral impact on consumers. Notifying consumers of a product or service’s availability is the primary purpose of advertising [29]. Advertisements introduce people to things in a similar manner to how the news informs them about current affairs. Customers are prepared for potential future purchases by this process, which moves them from being ignorant of the company’s existence to brand identification [27]. Agencies must keep abreast of emerging trends in digital marketing, since people are becoming more and more integrated with the digital world. Many consumers feel overloaded with traditional advertising (such as leaflets and brochures), which frequently fails to pique their interest, as a result of growing advertising prices. Additionally, this affects how customers view and connect with brand awareness [28].
Customers are choosing Internet marketing over traditional brand recognition and are spending more time online not only to make purchases but also to compare goods and services, prices, features, and information. As a result, controlling brand awareness at every stage of a product’s life cycle—from the introduction to the decline phase in the market—is essential to its success [28].
2.5. Theories and Models of Social Media Marketing
Several industries have seen a shift in paradigms due to social media, with business models favouring mass personalization over traditional one-to-many marketing techniques [30,31]. The significance of internet reviews and the customization of brand–consumer interactions serve as proof of this change [32,33].
2.5.1. Theories of Personal Behaviour
The study of individual behaviour on social networks has been defined by several psychological theories. The most outstanding include the following:
- Five-Factor Personality Model: This explains how traits such as openness and extroversion influence users’ interactions on social media [34]. This model is also called OCEAN [35,36].
- Technology Acceptance Model (TAM): this model is used to understand how the perception of ease of use and usefulness affects the adoption of technologies, often applied to the study of social media [37].
- Theory of Reasoned Action and Theory of Planned Behaviour: both predict behaviours based on attitudes and social norms, which is useful for understanding voluntary participation in activities on social networks [38].
2.5.2. Theories of Social Behaviour
Interactions on social networks are also studied through theories that focus on social aspects, such as the following:
- Theory of Social Aspects: this includes social influence and social capital, which describe how social interactions and social ties impact the use of social networks [39,40].
2.5.3. Theories of Mass Communication
These theories are applied to understand how media content has the most impact on consumer behaviour on social networks:
- Parasocial Interaction (PSI): originally applied to celebrities on TV, this theory has been adapted to study relationships between brands and consumers on social media [41,42].
- Uses and Gratifications Theory (UGT): this explores how social networks satisfy specific users’ needs, influencing their choices and behaviour [42,43].
2.5.4. Integrated Communication Theories with Metrics Analysis
In order to provide a consistent and powerful message, integrated communication theories emphasize how crucial it is to coordinate all of an organization’s communication efforts. In order to present a cohesive picture to stakeholders, this notion integrates a number of disciplines, including marketing, advertising, public relations, and internal communication.
In this process, metrics analysis is essential, since it enables you to evaluate the success of communication tactics and modify your strategy as needed. Campaign impact is measured and communication goals are effectively met with the use of metrics [44,45]. An example of this type of theory is implemented by Swonkie (https://swonkie.com/en/), where users have access to a variety of metrics that allow them to evaluate the performance of campaigns and content published on platforms such as Instagram, Facebook, and others [46,47].
Swonkie provides several important metrics, such as “reach”, which counts the number of distinct users who saw the content; “impressions”, which show how many times the content was viewed overall; “interaction rate”, which determines the proportion of followers who engaged with the posts (likes, comments, and shares); and “virality rate”, which counts the number of shares of the content relative to the total views (Swonkie, the year 2024 [47]). These indicators are essential for analysing social media success, because they offer comprehensive information about follower engagement and the spread of content [47].
2.6. Metrics on Social Media Are Crucial for Evaluating Performance and Sales Impact
According to Singh et al. [48], the widespread use of social media has produced a wealth of data that may be analysed for a variety of research issues in a number of academic fields. According to Kaplan and Haenlein [49], social media platforms produce a significant amount of quantitative data that are crucial for analysts and marketers who are interested in tracking and researching brand loyalty, behavioural segmentation, and other performance metrics [50].
According to Crisci et al. [51], social network analysis, often known as social media marketing, is an interdisciplinary field that creates, modifies, and broadens tools and techniques for gathering and analysing vast amounts of organized and unstructured data from networks. Social media communities are monitored, opinion dynamics are understood, collective sentiments are analysed, and predictions are made using these data, which supports a number of useful applications in the business and social sciences [51,52,53,54,55].
In order to support commercial decision-making, social media monitoring is an iterative process of methodically examining networks for pertinent information regarding subjects, target audiences, and rivals [56,57,58,59]. In contrast to traditional business analysis approaches that rely on historical data, this process uses real-time data and involves the collecting and evaluation of unstructured data to generate opinions and evaluate the influence of specific players [58].
Additionally, businesses use platforms that facilitate engagement and provide access to real-time data and insights into consumer behaviour to create marketing campaigns and programs that help customers move through the sales funnel [60]. An emerging issue in the marketing community is CRM-based marketing objectives, which align marketing objectives with sales operations and assess the return on investment (ROI) for particular actions, like boosting eWOM and brand awareness [60,61].
2.7. How to Evaluate Metrics
With an initial focus on political communication, Stieglitz et al. [54,62] presented a three-step methodology for social network analysis [54,62]. In order to create a foundation for more efficient comparison analyses on social networks, they enhanced this model in 2018 [63].
The four primary stages of Stieglitz et al.’s [63] methodology are preparation, analysis, tracking, and discovery.
As an expansion of the original model, the first phase, discovery, was incorporated to handle the growing difficulties in recognizing subjects and events as well as the multidisciplinary complexity of the data [10].
Depending on the method selected, the data collected during the crawling phase may be organised or unstructured. These methods may include the usage of keywords, topics, profiles, or URLs (Uniform Resource Locators) [10]. Technical difficulties pertaining to the software’s architecture are another aspect of this phase.
The gathered data are handled during the preparation phase, where issues with data quality and visualisation arise.
Finally, the analysis phase includes a number of methods, including the examination of attitudes, opinions, trends, and structural features [10]. Depending on the type of research question formulated and the context of the data, which may include areas like politics, business, sports, or entertainment, this phase also includes a variety of analytical techniques, including statistics, social network analysis, sentiment analysis, content analysis, or trend analysis [54]. To handle the range of problems and situations, a combination of these approaches is advised.
2.7.1. Social Network Analysis Steps
In order to shed light on the social network analysis process, scholars have created frameworks that serve as a common foundation for research in this field. Four categories of social network activities and three levels of analysis are proposed by Aral et al. [64] in order to examine research prospects and provide a framework for examining connections between enterprises, society, and social networks.
A three-step process model for social network analysis is also proposed by Fan and Gordon [53]: “capture”, “understand”, and “present”. Data are gathered and pre-processed, and pertinent information is extracted during the capture step. In order to comprehend the data, this phase also entails removing noise and using particular methods, including sentiment analysis. The results are synthesized and presented in the last stage.
In turn, Stieglitz et al. [54] established a three-step paradigm for social network analysis (SMA) that has now become a standard in information systems. To find latent patterns and structures, a preliminary “discovery” phase was added to this model, which was also modified to apply to domains other than political communication [62].
The model now has four steps instead of the prior three [62]:
- Discovery: finding hidden patterns and structures.
- Monitoring: selecting the data source, such Facebook or Twitter, and establishing the strategy and technique to be used.
- Preparation: although the original model does not completely outline the required processes, this phase gets the data ready for analysis.
- Analysis: various techniques, such as opinion extraction and social network analysis, are used, depending on the goals of the study.
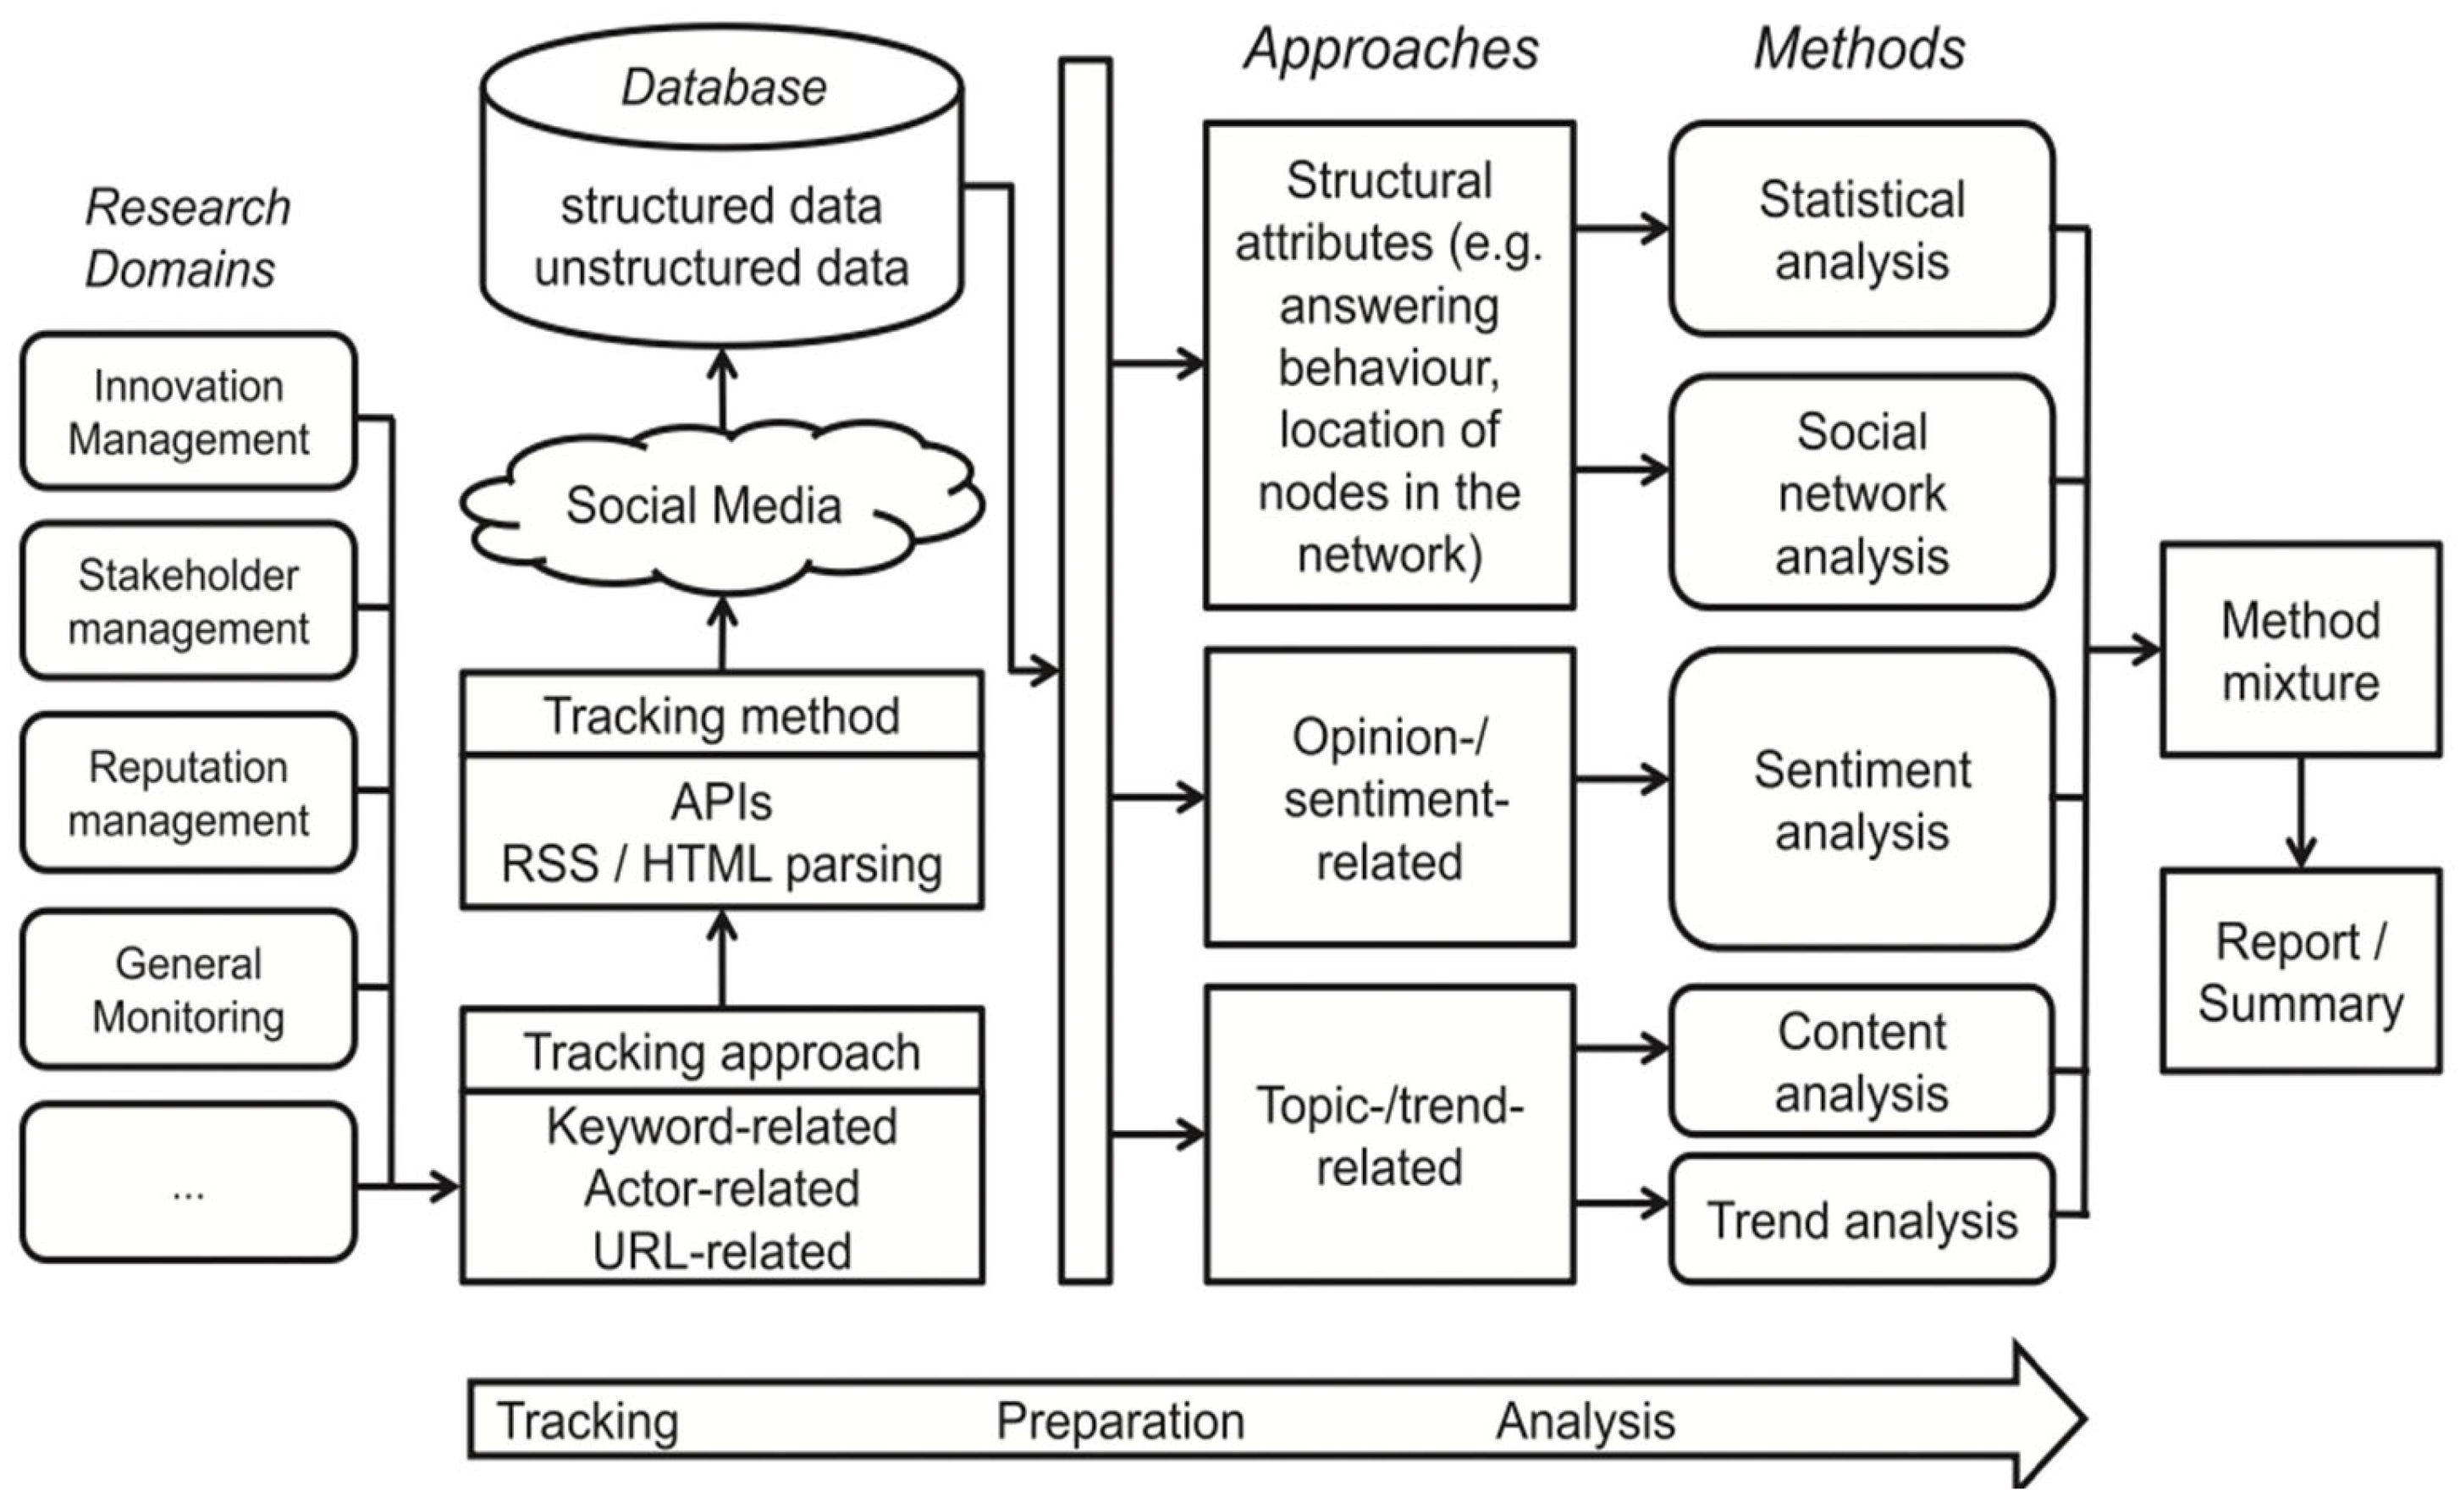
This modified theoretical model ensures efficient and flexible analysis across many study domains by empowering researchers to make well-informed choices regarding data collection (Figure 1), analytical methodologies, software architecture, and storage [63].
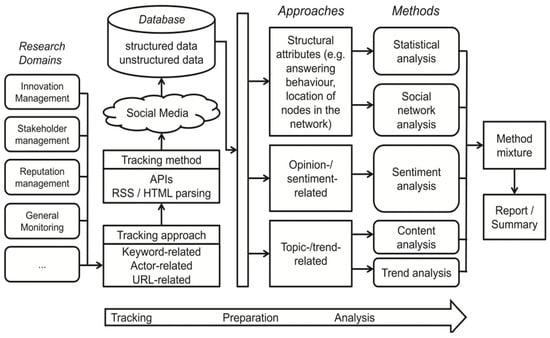
Figure 1.
Framework for social network analysis. Source: Stieglitz and Dang-Xuan [62].
2.7.2. Technologies and Tools for Social Network Analysis
Social networks have made new kinds of data available, making it easier to complete tasks that were previously difficult or impossible [65]. Marketers have access to a multitude of user-generated data through a range of marketing research approaches. This information, which includes text, audio, and video, is extensively shared and discussed in communities and is crucial to understanding how customers express their thoughts and experiences [65]. Improvements in customer service and service recovery techniques are made possible by this broader expression, which is essential for the creation and assessment of marketing strategies [20,63].
In order to derive valuable insights from social networks, the interdisciplinary discipline of “Social Media Analytics” aims to expand and modify analysis techniques [63]. In order to guarantee accurate and trustworthy results, this field comprises techniques like data mining and netnography, which apply scientific marketing research concepts [63].
Tools that communicate with platform APIs are frequently used to obtain these data, enabling the tracking and examination of pertinent data. Data assist in detecting hazards and possibilities for successful communications, as well as trends and new challenges. Employing reports and dashboards to make decisions based on real-time data, businesses employ these insights for a range of objectives, including reputation management and direct consumer communication [66,67].
In order to comprehend user behaviour on social networks, a number of theories and, considering the aforementioned features of the Swonkie platform, the primary theoretical foundation for the analysis of social network measurements will be the theory of integrated communication theories with metrics analysis. Because of its capacity to deliver comprehensive and easily comprehensible data, this platform was selected to enable the tracking of crucial metrics including reach, impressions, interactions, and virality.
Metrics like interaction rate and virality rate, which Swonkie directly provides, can be used to precisely gauge follower engagement and content distribution. This information is essential for developing the new metric suggested in this study.
As a result, Swonkie provides a solid theoretical foundation for comprehending how various measures affect social media performance and, in turn, revenue development for the organization being studied, in addition to being a trustworthy source of data.
3. Methods
3.1. Methodology of Research
Using KOR Creatives as a case study, the metrics of its social media accounts from December 2022 to August 2024 were examined and contrasted with revenue data for the same time period in order to examine the effect of social media metrics, particularly Instagram, on a company’s revenue growth. A key element of the business’s digital marketing approach has been efficient social media management. Effective social media management has been a critical component of the digital marketing strategy of Kor Creatives, which shares its data for research and is therefore considered in this study.
By determining whether there is a substantial association between the expansion of the company’s social media presence (as measured by reach, impressions, virality rate, etc.) and the rise in revenue, the impact was examined. In addition to offering data-driven suggestions to improve your digital marketing strategies, this will enable you to comprehend the part social media plays in a business’ success plan.
According to Misirlis and Vlachopoulou [68], this study examines methodology related to social media analytics that includes the following steps: identifying the data source; choosing data collection techniques; treating and calculating metrics; and, lastly, analysing the findings.
3.2. Data Source
Data collection for this research was carried out from two main sources: Social Media Metrics and Financial Data. Data were collected by the Swonkie platform that relate to the social networks used by the company and include the following metrics:
- (a)
- Reach (unique number of people who saw the content);
- (b)
- Impressions (likes, shares, comments, and number of times the content was viewed);
- (c)
- Virality rate (actions taken by users who saw the content);
- (d)
- Growth of followers over time;
- (e)
- Frequency of publications and content format (reels, posts, and carousels);
- (f)
- Financial data: company revenue data for the last three years by month.
The performance in terms of reach, impressions, publications, and interaction rates is noteworthy when comparing the metrics of Instagram, Facebook, and LinkedIn between December 2022 and December 2023. Instagram received the most results in the metrics, confirming its position as the most engagement-effective platform.
With an average reach of 644.67 thousand and a virality rate of 1.8%, Instagram stats for the January–August 2024 period show that follower engagement has increased over previous time periods. When compared to Instagram, Facebook’s average engagement rate was 1.9%, showing more consistent performance but less impressions.
In addition to social media metrics, Table 2 shows the company’s monthly revenue from 2022 to 2024. It shows a steady growth in revenue over the years, with 2024 showing a significant increase, especially in the months of June and July, where the company reached EUR 89,948.87 and EUR 107,134.27, respectively. This increase may be correlated with increased social media engagement, highlighting the importance of effective digital strategies for revenue growth.
Table 2.
Monthly revenue from 2022 to 2024.
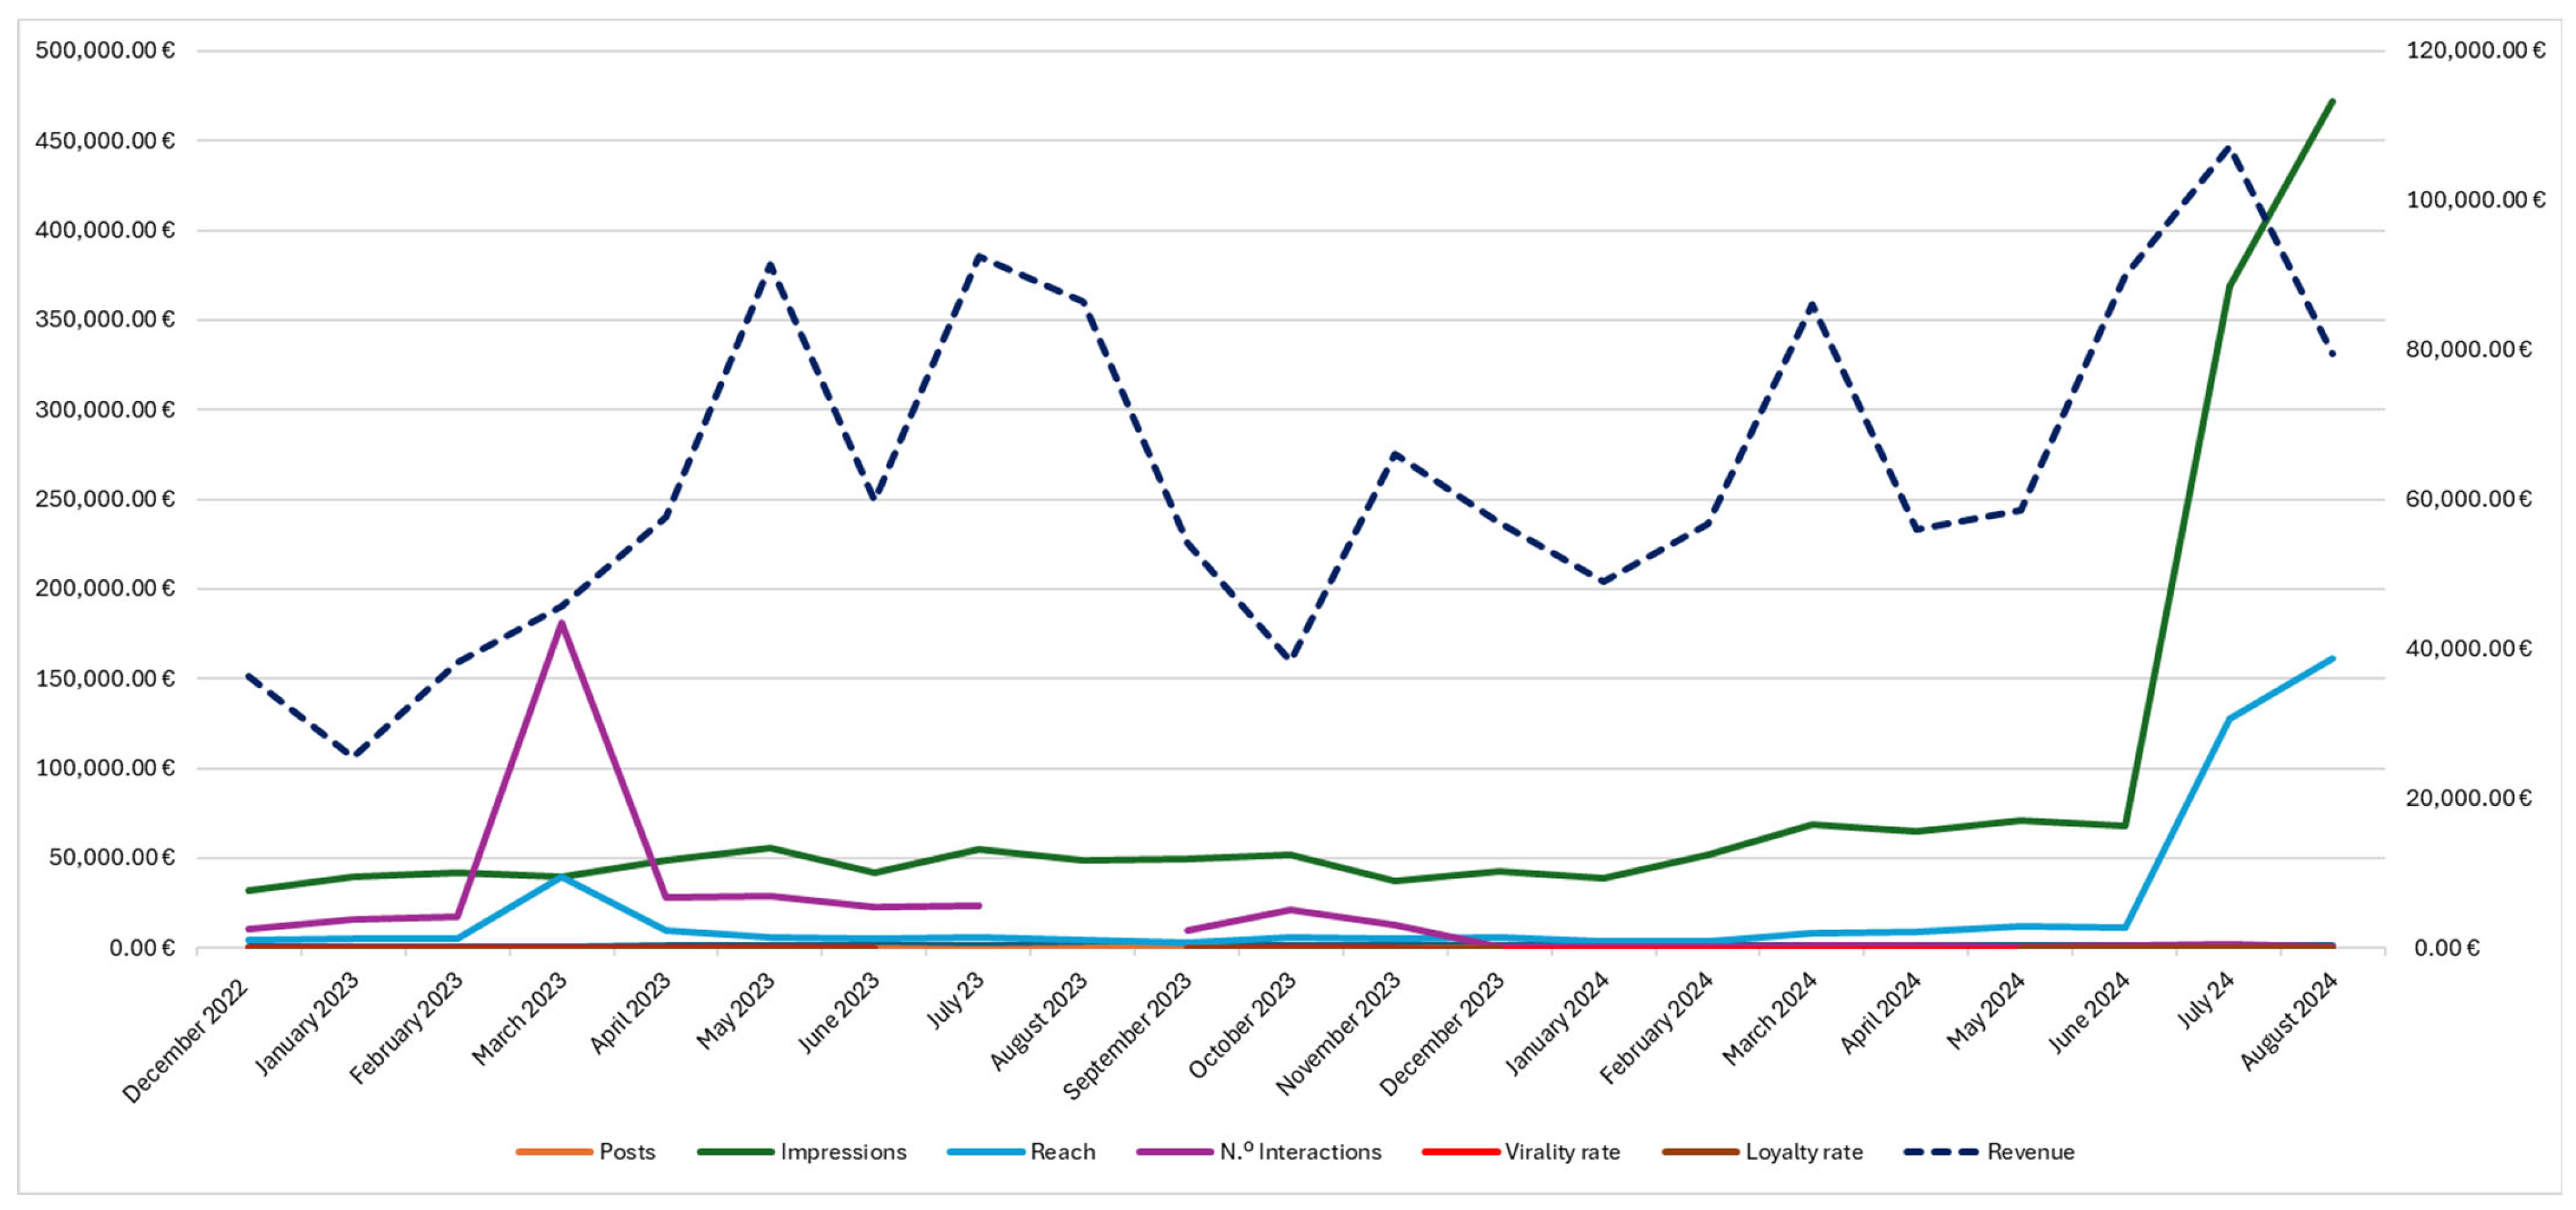
The social network Instagram was chosen for this study, since, at the moment, it is the most popular and pertinent site for the company’s target demographic. As seen in Table 3, Instagram is notable for its capacity to produce substantial user-brand engagement and provides a variety of helpful performance analysis measures, including reach, impressions, and interactions. Moreover, as Figure 2 illustrates, Instagram is the primary focus for comprehending how social media techniques affect revenue growth due to its dominance in terms of popularity and everyday usage. It makes sense that this investigation concentrates solely on this platform given its significance in the current digital market in order to gather precise and pertinent findings.
Table 3.
Instagram metrics (December 2022 to August 2024).
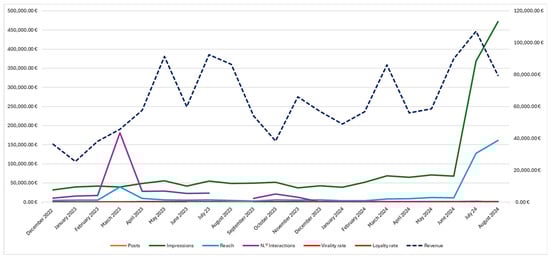
Figure 2.
Revenue x Social media metrics 2022/2024. Source: KOR Creatives [69].
In accordance with the company’s strategy, considered in the current research, the following metrics are the most relevant for managing social media marketing, which requires calculations to be performed as follows [69]:
- (a)
- Impressions = Number provided by Facebook’s MetaBusiness.
- (b)
- Reach = Number provided by Facebook’s MetaBusiness.
- (c)
- No. of Interactions = Number provided by Facebook’s MetaBusiness.
- (d)
- Page interaction rate = (Accounts with interaction/Accounts reached) × 100.
- (e)
- Virality rate = (Interactions/Impressions) × 100.
- (f)
- Δ% Posts = (Current month’s posts/Previous month’s posts)/Previous month’s posts.
- (g)
- Δ% Impressions = (Current month’s impressions/Previous month’s impressions)/Previous month’s impressions.
- (h)
- Δ% Reach = (Current month’s reach/Previous month’s reach)/Previous month’s reach.
- (i)
- Δ% No. of interactions = (Current month’s interactions/Previous month’s interactions)/Previous month’s interactions.
- (j)
- Δ% Page Interaction Rate = (Current Month’s Interaction Rate/Previous Month’s Interaction Rate)/Previous Month’s Interaction Rate.
- (k)
- Δ% Virality rate = (Current month’s virality rate/Previous month’s virality rate)/Previous month’s virality rate.
The creation of a new metric is proposed, being the average between the page interaction rate and the virality rate, which can be used to measure follower loyalty, that is, the percentage of “loyal followers” who regularly interact with the content and who also help to amplify the reach through virality.
By combining these two metrics, we measure a combination of direct engagement (interactions) and viral spread (shares that expand reach). The average between these two rates will represent loyal followers who not only interact with the content but also contribute to its amplification. The following equation presents the formula for the proposed metric, which is called loyalty rate:
where Page Engagement Rate measures the percentage of followers who directly interact with posts (likes, comments, and shares). This rate reflects the level of engagement of followers. And the Virality Rate measures the percentage of virality, that is, the dissemination of content beyond the initial audience, potentially expanded through sharing.
Loyalty rate = Page interaction rate/Virality rate,
3.3. Data Collection Method
Data were sourced directly from Swonkie’s social media reports and the company’s internal financial records. It was crucial to ensure the accuracy and consistency of the data collected for the analysis to be reliable. A specific time period was used to align social media data with financial data, which were from December 2022 to August 2024.
For this investigation, the following metrics were analysed:
Social media indicators:
- (a)
- Annual Reach = Unique number of people who viewed the content throughout each year;
- (b)
- Annual Impressions = Total content views, including all interactions for each year;
- (c)
- Annual Virality Rate = Percentage of actions (likes, shares, and comments) performed by users who saw the content in relation to the total number of people reached per year;
- (d)
- Annual Follower Growth = Increase in the number of followers throughout each year.
Financial indicators:
- (a)
- Monthly Billing = Total revenue generated by the company at the end of each month.
- (b)
- Monthly Revenue Growth Rate = Percentage of revenue growth from one month to the next.
3.4. Results Analysis
The gathered data were summarized and interpreted through data analysis utilizing descriptive statistics techniques. The following were included in the analysis:
- (a)
- Averages: used to comprehend the typical monthly performance of income and social media analytics.
- (b)
- Standard Deviations: used to quantify the extent to which data deviate from the monthly average.
- (c)
- Minimum and Maximum Values: used to determine the lowest and maximum points in the revenue and performance of social media throughout the course of the months.
- (d)
- Correlation: Used to ascertain the connection between social media metrics and monthly revenue, using Pearson’s correlation. This assisted in determining whether the variables under analysis have a positive or negative connection.
The Statistical Package for the Social Sciences, or SPSS 28.0.1.0, was the analysis instrument used.
4. Analysis and Discussion of Results
4.1. Descriptive Analysis of Metrics
Descriptive data provide an overview of the main Instagram variables analysed, including reach, impressions, number of interactions, page engagement rate, virality rate, and revenue. Table 4 presents the descriptive statistics for the variables under analysis.
Table 4.
Descriptive statistics for reach, impressions, and revenue.
As shown in Table 4, the average range was 20,981.10, with considerable variation over the months (standard deviation of 42,082.48). Impressions averaged 85,148.38, reflecting the total number of times the content was viewed. Monthly revenue averaged 63,415.95, with a high standard deviation of 22,167.53, indicating significant variations in revenue over the period analysed.
These results demonstrate that there is substantial variation in Instagram page performance metrics, suggesting that seasonal factors or other variables may influence both post visibility and follower interactions.
Figure 3 illustrates the relationship between monthly reach and revenue. Although there is a moderate positive correlation between these variables, the graph demonstrates considerable dispersion, which confirms the absence of a strong linear relationship between reach and revenue.
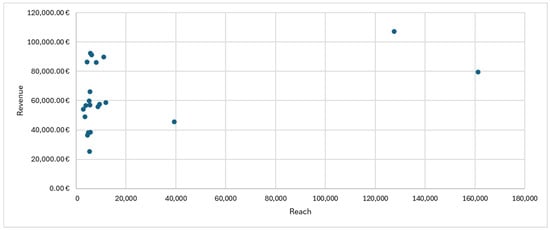
Figure 3.
Scatter plot of reach and revenue. Source: own elaboration.
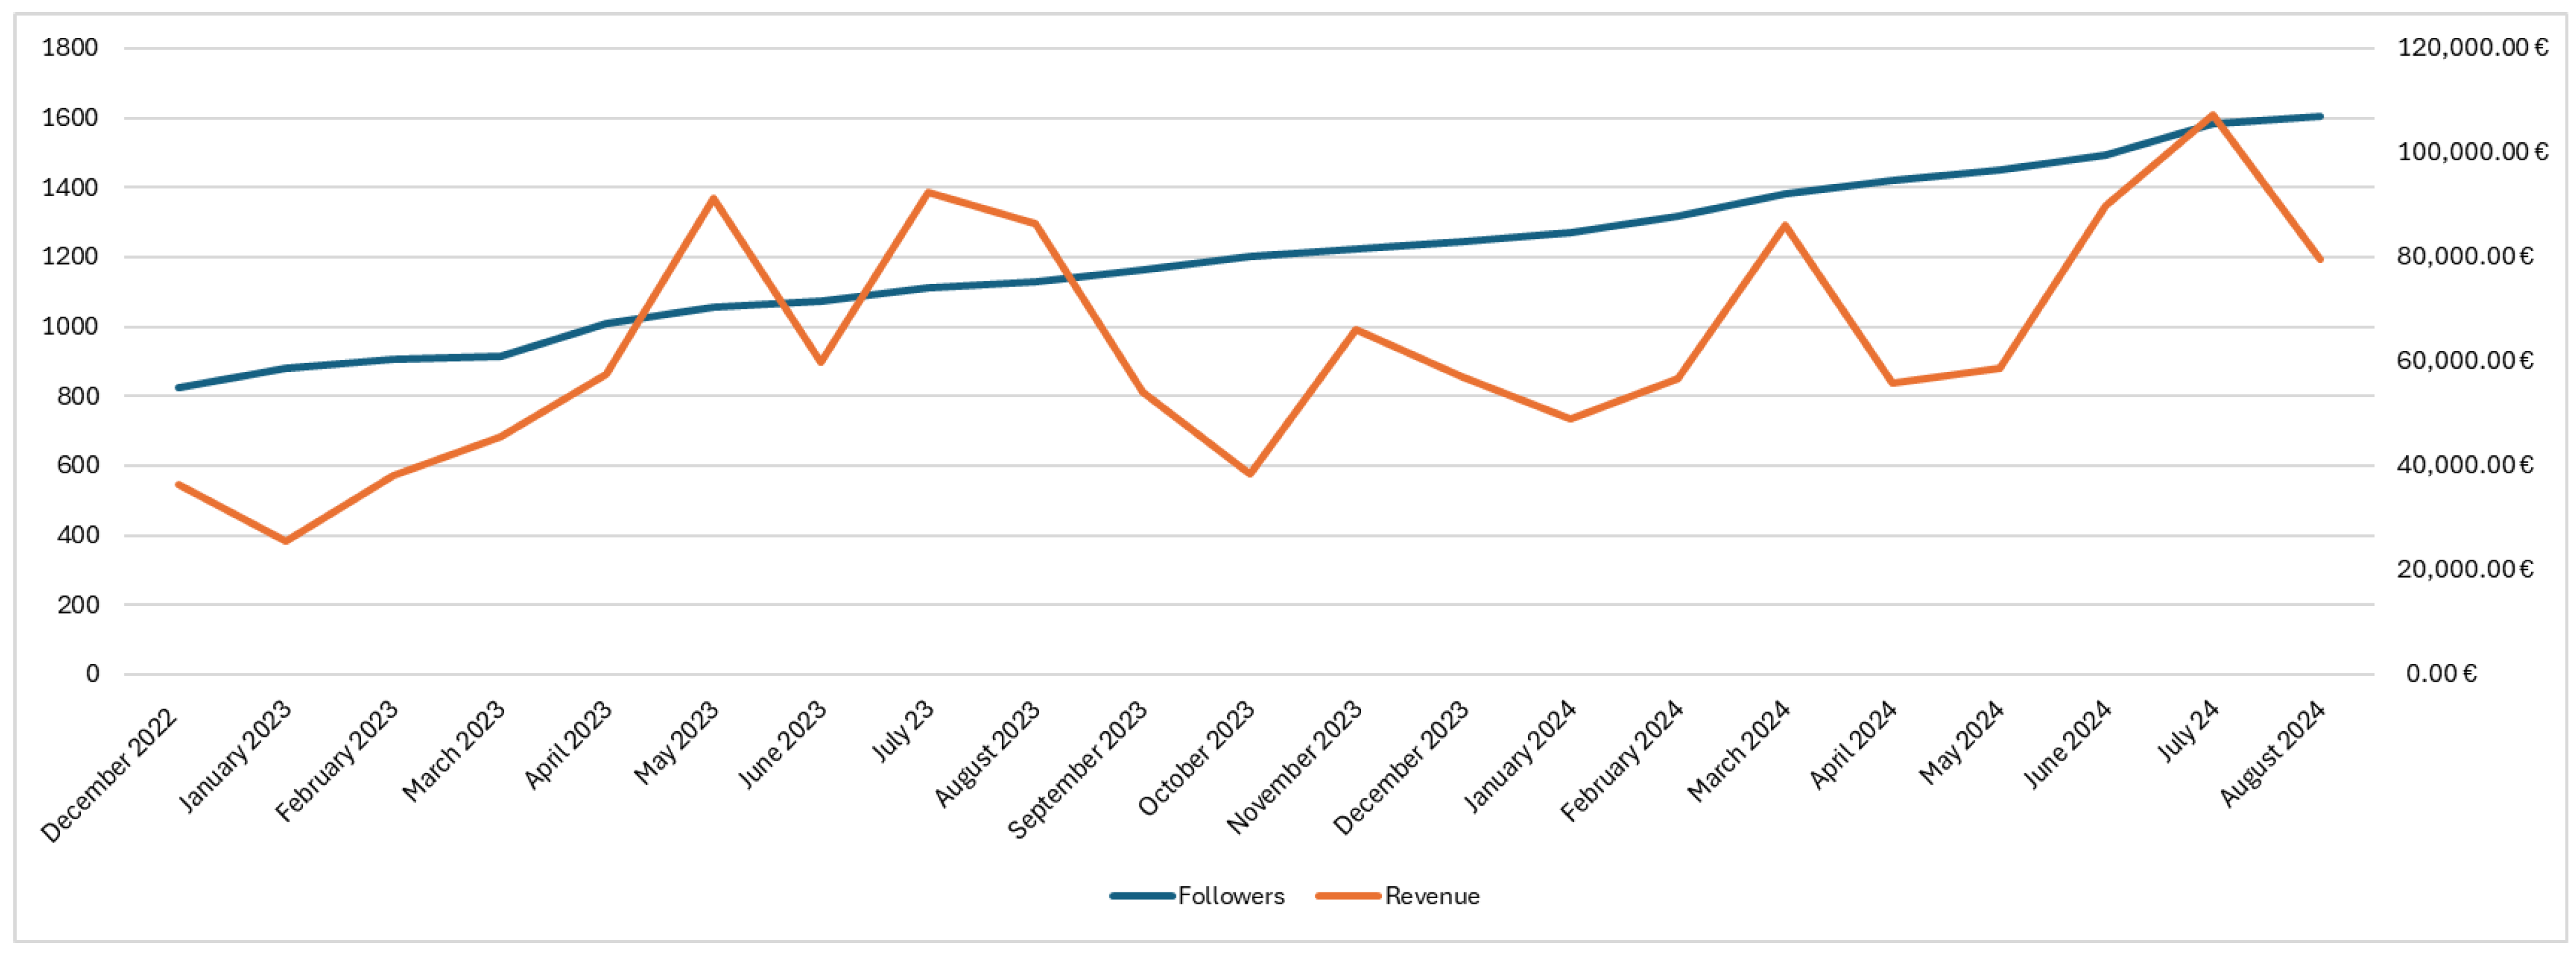
Figure 4 shows the evolution of the number of followers and revenue over the period analysed. It is observed that an increase in the number of followers tends to coincide with revenue peaks, corroborating the results of the regression analysis.
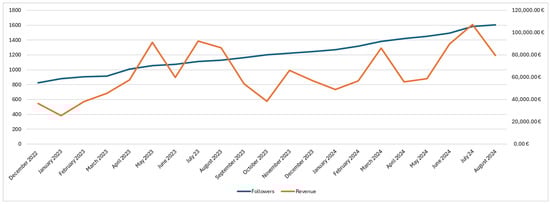
Figure 4.
Line graph showing the evolution of the number of followers and revenue. Source: own elaboration.
4.2. Correlation Between Metrics
Pearson’s correlation was used to assess the relationship between the reach of posts on Instagram and the company’s monthly revenue. Table 5 presents the correlation results.
Table 5.
Pearson’s correlation between revenue and reach.
Although the correlation coefficient of 0.401 indicates a moderate positive relationship between reach and revenue, the statistical significance is marginal (p = 0.072), suggesting that this correlation is not statistically significant at the 0.05 level. This implies that although a tendency for greater reach may result in greater revenue, this relationship is not strong enough to be considered conclusive with the available data.
4.3. Regression Analysis
Regression analysis was performed to identify whether social media metrics such as reach, impressions, number of interactions, and virality rate have a significant impact on the company’s monthly revenue. Table 6 presents the regression results.
Table 6.
Regression of reach, impressions, number of interactions, and virality rate with monthly revenue.
This regression analysis examined the relationship between monthly revenue and factors such as reach, impressions, number of interactions, page interaction rate, and followers. The constant coefficient is −65,120.64, representing the estimated revenue when all predictors are zero. However, its high standard error (49,551.60) and low t-value (−1.314) indicate weak statistical significance. Among the independent variables, reach shows a positive effect on revenue, with an unstandardised coefficient of 1.25 and a standardised Beta of 2.64, though its t-value (0.533) implies limited significance. Impressions and number of interactions, on the other hand, have negative coefficients (−0.442 and −0.236, respectively) and low t-values (−0.502 and −0.464), suggesting they may not have a meaningful impact on revenue.
In contrast, the page interaction rate and the number of followers stand out as more influential factors. The page interaction rate has a coefficient of 2512.92, suggesting a potential positive effect on revenue, but its t-value (1.198) indicates moderate significance. Followers, with a coefficient of 101.27 and a standardised Beta of 1.13, show the most significant relationship with revenue, as reflected in its t-value of 2.26. Overall, this analysis highlighted that while reach, page interaction rate, and followers may contribute positively to revenue, impressions and the number of interactions appear to have a negligible or even negative impact.
A regression analysis revealed that the followers variable has a positive and marginally significant impact on revenue (p = 0.050), with a coefficient of B = 101.27. This suggests that an increase in the number of followers can have a direct positive effect on increasing monthly revenue.
The other variables, such as reach and impressions, did not demonstrate a significant impact on revenue (with p-values greater than 0.05), suggesting that simply increasing reach or impressions is not necessarily associated with direct revenue growth. However, the page interaction rate, with a positive coefficient of B = 2512.92, also showed a trend of positive influence on collection, although this was not statistically significant (p = 0.261).
These results indicate that the quality of follower engagement, measured by interaction rate and number of followers, can have a more direct impact on revenue than the number of people reached.
4.4. New Proposed Metric: Loyalty Rate
To complement the analysis and address follower loyalty, a new metric is proposed that combines the page interaction rate and the virality rate. This metric is designed to measure the percentage of loyal page followers who not only engage with the content but also spread it beyond the page’s network of followers.
The inclusion of this metric provides a more complete view of the effectiveness of social media strategies, as it combines both direct follower engagement and its impact in terms of organic reach. The loyal followers metric can be especially useful for understanding the loyalty and behaviour of your most active followers, who play a crucial role in expanding your brand’s reach. The descriptive statistics in Table 7 present the results of the descriptive analysis of this new metric.
Table 7.
Descriptive statistics of the loyalty rate.
The loyalty rate varies between 19.9% and 221.6%, with an average of 65.8%. The standard deviation of 68.2% is high, indicating a large dispersion between loyalty rates over the period analysed. This suggests that follower loyalty fluctuates significantly from month to month. Table 8 shows the correlation between the loyalty rate and revenue.
Table 8.
Correlation between loyalty rate and revenue.
The correlation between loyalty rate and revenue is r = 0.423, which indicates a moderate positive correlation. However, the statistical significance (p = 0.116) is not strong enough to conclude that this correlation is statistically significant at the 0.05 level. This suggests that while there is a tendency for greater follower loyalty to be associated with higher revenue, we cannot say with certainty that this relationship is robust based on this sample.
The regression table was used to verify the impact of the loyalty fee on revenue. The regression model included the loyalty rate as a predictor of revenue. The coefficient of determination R2 = 0.179 indicates that approximately 17.9% of the variation in revenue can be explained by the loyalty rate, presented in Table 9.
Table 9.
Regression between loyalty rate and revenue.
The adjusted R2 of 0.116 suggests that when taking into account the number of observations, the model does not explain a very significant amount of the variation in collection.
The F value = 2.840 indicates the strength of the model, presented in Table 10, but with p = 0.116, the regression model is not statistically significant at the 0.05 level. This suggests that loyalty rate is not a strong predictor of revenue with the available data.
Table 10.
ANOVA test between loyalty rate and revenue.
The coefficient B = 143.61 for the loyalty rate indicates that an increase of 1 unit in the loyalty rate is associated with an increase of 143.61 units in revenue, but this result is not statistically significant (p = 0.116), as shown in Table 11.
Table 11.
Coefficients between loyalty rate and revenue.
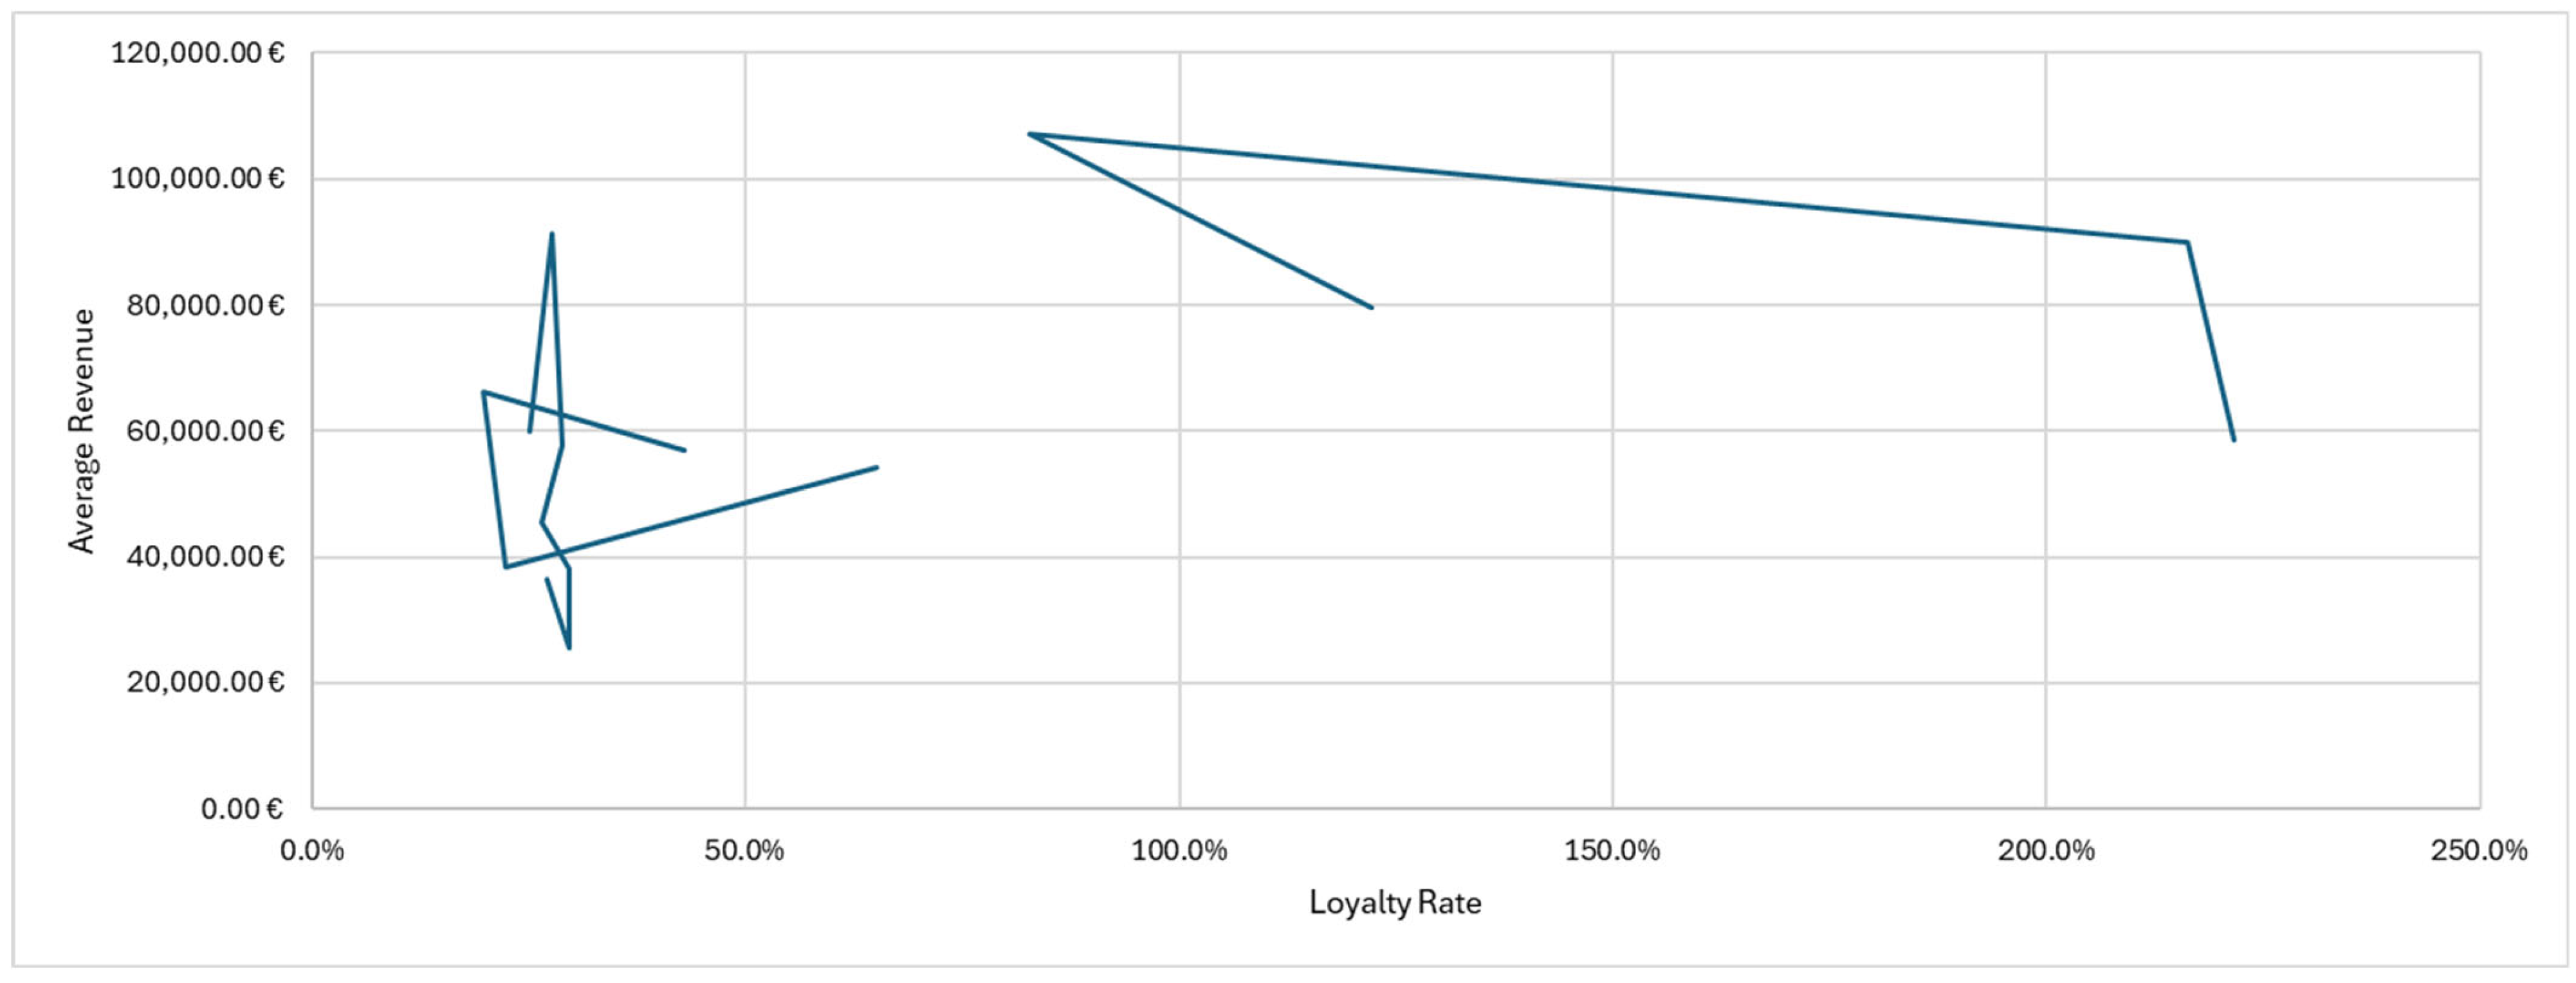
Figure 5 shows the relationship between the loyalty rate and average revenue, which suggests an upward trend in the relationship between the loyalty rate and revenue, although the variation is relatively large.
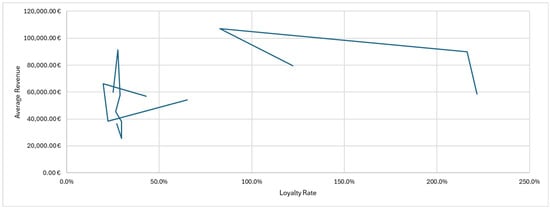
Figure 5.
Relationship between loyalty rate and average revenue. Source: own elaboration.
The line on this graph demonstrates a possible link between follower loyalty (loyalty rate) and financial performance, but the dispersion of the points suggests that there are other factors that can significantly influence revenue.
As far as the company’s practical consequences are concerned, it should keep investing in expanding its following, because doing so has been shown to increase revenue.
The quality of content that creates meaningful interactions should receive particular attention, because this seems to have a significant impact on revenue growth.
Whether virality and follower loyalty have comparable effects in other situations should be explored by investigating other social media platforms.
5. Discussion
According to the findings of other earlier studies, the outcomes of this research are consistent. The significance of social media in marketing and its effect on businesses’ financial outcomes were emphasised by Alalwan et al. [1]. They contend that social media platforms are crucial resources for companies looking to engage with customers and successfully market goods and services. By showing that social media engagement indicators, like the number of followers and the loyalty rate, have a major impact on businesses’ financial performance, this study supports this viewpoint.
Dwivedi et al. [2] discuss how businesses are changing digitally and the importance of social media in consumer communication. They emphasise that the use of digital strategies is essential for businesses to remain competitive in the current market, where ongoing customer interaction is crucial. This article’s results support this idea, highlighting the need for effective digital strategies and demonstrating how important follower engagement and content quality are to the growth of the audience.
Duffett [3] examined the ways in which social media interactions might help businesses increase their income. Although more research is required to validate this indicator properly, the study in question discovered a moderately favourable association between revenue and loyalty rate, indicating that follower engagement can, in fact, help financial growth.
The difficulties marketing managers encounter while evaluating follower loyalty and its effect on revenue were discussed by Felix et al. [6]. They note that even while social media provides a multitude of data, it is still difficult to gauge follower loyalty and how it directly affects income. To handle this complexity, this article presents loyalty rate, a new statistic that combines engagement and virality rates to offer a more comprehensive picture of follower loyalty.
The impact of social media on brand relationships and word of mouth was examined by Hudson et al. [4]. They concluded that a brand’s relationship with its customers can be strengthened through good social media interactions, increasing brand loyalty and the frequency of word-of-mouth recommendations. This view is supported by this study’s findings, which demonstrate how important high-quality material that fosters meaningful connections is for increasing sales and fortifying customer ties.
5.1. Theoretical Implications
By presenting the loyalty rate, a novel metric that offers a more thorough comprehension of follower behaviour and its influence on financial performance, this study adds to the body of knowledge in the field of digital marketing. This statistic provides a more thorough assessment of follower loyalty, enhancing current theories and models in digital marketing. This study emphasises the significance of follower count while validating the significance of conventional engagement metrics like reach, impressions, and interaction rate. This adds to and validates current beliefs regarding the contribution of social media use to business performance.
Loyalty rate, which combines virality and engagement rates, was introduced to provide a more comprehensive indicator of follower loyalty. The creation and validation of new metrics that capture the complex nature of social media involvement may be encouraged by this theoretical advancement. This study offers a platform for further investigation into the connection between social media indicators and financial performance, enabling researchers to examine more factors, longer time frames, and more situations to gain a deeper comprehension of the efficacy of digital marketing.
Additionally, this study adopted an interdisciplinary approach, integrating knowledge from social media analysis, statistics, and marketing. This strategy might encourage other researchers to use comparable techniques in the future, leading to a more comprehensive comprehension of the intricate relationships between digital marketing initiatives and corporate results. Digital marketing theory and practice can develop significantly through the integration of new metrics and the validation of current ones.
5.2. Practical Implications
This research emphasises how crucial social media engagement measures are to expanding businesses’ income, including the number of followers and the loyalty rate. To boost financial success, businesses can utilise these insights to improve their social media strategies, concentrating on increasing followers and enhancing engagement. The launch of devotion rate, a new metric for gauging follower devotion, combines engagement and virality rates. By identifying their most devoted followers, who share and engage with content, this statistic can assist businesses in expanding their organic reach.
Additionally, businesses can make well-informed judgments regarding their investments in digital marketing by employing statistical analysis tools like regression models and Pearson’s correlations. More focused and successful marketing campaigns are made possible by an understanding of the connection between social media indicators and income. To give businesses a more thorough grasp of how social media affects financial outcomes across various platforms, this report also recommends broadening this research to include other platforms like Facebook and LinkedIn. Digital marketing tactics that are more cohesive and integrated may result from this.
The findings show that revenue development depends on producing high-quality content that inspires meaningful connections. For businesses to get the most out of their social media efforts, producing excellent, captivating content that appeals to their audience must be their priority. You may directly boost your revenue by investing in growing your following and concentrating on producing content that encourages significant connections.
In addition to supporting the theoretical and practical implications, these references offer a strong basis for comprehending the context and significance of this study’s findings. By proposing the loyalty rate and confirming the significance of conventional engagement indicators, this study adds to the body of existing material while providing fresh perspectives on how businesses may maximise their social media strategy to boost financial performance.
6. Conclusions
This study’s findings, which focus mostly on Instagram as the social network under investigation, provide significant new information about how social media measures affect a company’s revenue development. Some patterns could be found using regressions, correlations, and descriptive analyses, but not all of the relationships showed high statistical significance.
More engaged and devoted followers may help boost revenue, according to the newly suggested indicator of loyalty rate, which showed a moderately favourable link with revenue (r = 0.423). However, with p = 0.116, this association was not statistically significant.
Approximately 17.9% of the revenue variation was explained by the loyalty rate, according to the regression study. This is significant but not enough to regard this metric as a stand-alone predictor of financial performance. The association between social media metrics and income may be influenced by additional elements that were not examined, according to the adjusted coefficient of determination (adjusted R2 = 0.116).
Revenue was marginally impacted by other variables, including the number of followers and interaction rate, with the number of followers exhibiting marginal significance (p = 0.050). This implies that increasing following might have a direct impact on revenue in addition to loyalty and virality.
Although the current study yields significant insights, it has certain limitations that should be taken into account, such as the sample size and time period examined. This study was conducted using data from a relatively short time period; a larger and more comprehensive sample could yield more reliable and definitive results. The fact that the investigation solely looked at income and social media data presents another drawback. However, the analysis did not account for other factors that could have affected the outcomes, such as economic trends, marketing techniques outside of social media, and seasonality.
The most significant constraint is the tiny amount of data collected, which prevented the generation of highly accurate results. The current work, however, is meant to serve as a springboard for further research that takes this novel statistic into account.
Based on the limitations identified and the results obtained, some suggestions for future research are as follows: expanding the analysis period; conducting a longitudinal study with data from a longer period, which would allow for a more accurate assessment of the evolution of the metrics and their impact on revenue; performing a multichannel analysis to investigate the impact of metrics on various social media platforms (Facebook, LinkedIn, etc.) to verify whether the correlation between metrics and revenue is maintained or varies between networks, including external variables that may be integrated into the model, such as offline marketing campaigns, seasonal events, and economic factors that can help better explain fluctuations in revenue; and finally, refining the loyalty rate metric to include other parameters such as the frequency of interaction per follower, which can improve its predictive capacity. Also, to evaluate the emotional and affective component that exists in the digital environment, additional metrics that come from the application of algorithms and sentiment analysis may be taken into consideration in addition to the ones that are presented in this study. These metrics are intended to measure sentiment and, when feasible, emotion expressed in social media.
Author Contributions
Conceptualization, E.S.; methodology, C.M.Q.R.; software, C.M.Q.R. and E.S.; validation, C.M.Q.R.; formal analysis, E.S.; investigation, E.S.; resources, E.S.; writing—original draft preparation, E.S.; writing—review and editing, C.M.Q.R.; supervision, C.M.Q.R.; project administration, C.M.Q.R.; funding acquisition, C.M.Q.R. All authors have read and agreed to the published version of the manuscript.
Funding
This research was funded by national funds provided by the FCT—the Foundation for Science and Technology—grant number: UIB/04020/2020 (CinTurs).
Data Availability Statement
Data are available on request by author Célia Ramos.
Conflicts of Interest
The authors report no potential conflicts of interest.
References
- Alalwan, A.A.; Rana, N.P.; Dwivedi, Y.K.; Algharabat, R. Social media in marketing: A review and analysis of the existing literature. Telemat. Inform. 2017, 34, 1177–1190. [Google Scholar]
- Dwivedi, Y.K.; Ismagilova, E.; Hughes, D.L.; Carlson, J.; Filieri, R.; Jacobson, J.; Jain, V.; Karjaluoto, H.; Kefi, H.; Krishen, A.S.; et al. Setting the future of digital and social media marketing research: Perspectives and research propositions. Int. J. Inf. Manag. 2021, 59, 102168. [Google Scholar]
- Duffett, R.G. The YouTube marketing communication effect on cognitive, affective and behavioural attitudes among Generation Z consumers. Sustainability 2020, 12, 5075. [Google Scholar] [CrossRef]
- Hudson, S.; Roth, M.S.; Madden, T.J.; Hudson, R. The effects of social media on emotions, brand relationship quality, and word of mouth: An empirical study of music festival attendees. Tour. Manag. 2016, 47, 68–76. [Google Scholar]
- Batra, R.; Keller, K.L.; Strecher, A. Leveraging consumer insights to improve digital and social media marketing. J. Consum. Psychol. 2018, 28, 165–169. [Google Scholar]
- Felix, R.; Rauschnabel, P.A.; Hinsch, C. Elements of strategic social media marketing: A holistic framework. J. Bus. Res. 2017, 70, 118–126. [Google Scholar]
- Lamberton, C.; Stephen, A.T. A thematic exploration of digital, social media, and mobile marketing: Research evolution from 2000 to 2015 and an agenda for future inquiry. J. Mark. 2016, 80, 146–172. [Google Scholar]
- De Vries, N.J.; Gensler, S.; Leeflang, P.S. Effects of traditional advertising and social messages on brand-building metrics and customer acquisition. J. Mark. 2017, 81, 1–15. [Google Scholar]
- Statista. Global Social Networks Ranked by Number of Users 2020. Statistica. 2020. Available online: https://www.statista.com/statistics/272014/global-social-networks-ranked-by-number-of-users/ (accessed on 24 April 2024).
- Zachlod, C.; Samuel, O.; Ochsner, A.; Werthmüller, S. Analytics of social media data—State of characteristics and application. J. Bus. Res. 2022, 144, 1064–1076. [Google Scholar] [CrossRef]
- Saravanakumar, M.; Suganthalakshmi, T. Social Media Marketing. Life Sci. J. 2012, 9, 4444–4451. [Google Scholar]
- Scott, D.M. The New Rules of Marketing and PR: How to Use News Releases, Blogs, Podcasting, Viral Marketing and Online Media to Reach Buyers Directly; John Wiley & Sons: Hoboken, NJ, USA, 2008. [Google Scholar]
- Chatterjee, S.; Kar, A.K. Why do small and medium enterprises use social media marketing and what is the impact: Empirical insights from India. Int. J. Inf. Manag. 2020, 53, 102103. [Google Scholar] [CrossRef]
- Harrigan, P.; Miles, M.P.; Fang, Y.; Roy, S.K. The role of social media in the engagement and information processes of social CRM. Int. J. Inf. Manag. 2020, 54, 102151. [Google Scholar]
- Gillin, P. The New Influencers: A Marketer’s Guide to the New Social Media; Linden Publishing: Fresno, CA, USA, 2007. [Google Scholar]
- Dubbelink, S.I.; Herrando, C.; Constantinides, E. Social media marketing as a branding strategy in extraordinary times: Lessons from the COVID-19 pandemic. Sustainability 2021, 13, 10310. [Google Scholar] [CrossRef]
- Evans, D. Social Media Marketing: The Next Generation of Business Engagement; John Wiley & Sons: Hoboken, NJ, USA, 2010. [Google Scholar]
- Ilodigwe, A.O.; Uzoh, B.C. Utilization of social media for marketing by entrepreneurs in Anambra state: Challenges and opportunities. Afr. J. Soc. Behav. Sci. 2024, 14, 4444–4451. [Google Scholar]
- Vinerean, S.; Opreana, A. Measuring customer engagement in social media marketing: A higher-order model. J. Theor. Appl. Electron. Commer. Res. 2021, 16, 2633–2654. [Google Scholar] [CrossRef]
- Tuten, T.L.; Solomon, M.R. Social Media Marketing; Sage Publications: Thousand Oaks, CA, USA, 2020. [Google Scholar]
- Moorman, C. Capitalizing on Social Media Investments. The CMO Survey. 2020. Available online: https://cmosurvey.org/tag/investments/ (accessed on 12 April 2024).
- Hadad, C. Why Some 13-Year-Olds Check Social Media 100 Times a Day. CNN.com. 13 October 2015. Available online: http://edition.cnn.com/2015/10/05/health/being-13-teens-social-media-study/index.html (accessed on 12 April 2024).
- Lee, K.-H.; Kim, J.W. Integrating suppliers into green product innovation development: An empirical case study in the semiconductor industry. Bus. Strategy Environ. 2011, 20, 527–538. [Google Scholar] [CrossRef]
- Alghizzawi, M. The role of digital marketing in consumer behavior: A survey. Int. J. Inf. Technol. Lang. Stud. 2019, 3, 24–31. [Google Scholar]
- Cao, G.; Duan, Y.; Edwards, J.S.; Dwivedi, Y.K. Understanding managers’ attitudes and behavioral intentions towards using artificial intelligence for organizational decision-making. Technovation 2021, 106, 102312. [Google Scholar]
- Dazeinfo. The Number of Internet Users Worldwide Reached 4.1 Billion In July 2018. Dazeinfo. 2018. Available online: https://dazeinfo.com/2018/07/27/facebook-internet-users-worldwide-online/ (accessed on 12 April 2024).
- Shahbaznezhad, H.; Dolan, R.; Rashidirad, M. The role of social media content format and platform in users’ engagement behavior. J. Interact. Mark. 2021, 53, 47–65. [Google Scholar]
- Ghazie, D.A.; Dolah, J. How digital marketing affects consumer behavior. In Proceedings of the 3rd International Conference on Creative Media, Design & Technology, Surkarta, Indonesia, 25 September 2018. [Google Scholar]
- Revythi, A.; Tselios, N. Extension of technology acceptance model by using system usability scale to assess behavioral intention to use e-learning. Educ. Inf. Technol. 2019, 24, 2341–2355. [Google Scholar] [CrossRef]
- Peters, L. The new interactive media: One-to-one, but who to whom? Mark. Intell. Plan. 1998, 16, 22–30. [Google Scholar] [CrossRef]
- Hanna, R.; Rohm, A.; Crittenden, V.L. We’re all connected: The power of the social media ecosystem. Bus. Horiz. 2011, 54, 265–273. [Google Scholar] [CrossRef]
- Ngai, E.W.T.; Tao, S.S.C.; Moon, K.K.L. Social media research: Theories, constructs, and conceptual frameworks. Int. J. Inf. Manag. 2015, 35, 33–44. [Google Scholar] [CrossRef]
- Babatunde, S.O.; Odejide, O.A.; Edunjobi, T.E.; Ogundipe, D.O. The role of AI in marketing personalization: A theoretical exploration of consumer engagement strategies. Int. J. Manag. Entrep. Res. 2024, 6, 936–949. [Google Scholar]
- Roos, J.M.; Kazemi, A. The five factor model of personality as predictor of online shopping: Analyzing data from a large representative sample of Swedish internet users. Cogent Psychol. 2022, 9, 2024640. [Google Scholar] [CrossRef]
- Digman, J.M. Personality structure: Emergence of the five-factor model. Annu. Rev. Psychol. 1990, 41, 417–440. [Google Scholar] [CrossRef]
- Allbeck, J.M.; Badler, N.I. Creating crowd variation with the ocean personality model. In Proceedings of the AAMAS08: 7th International Conference on Autonomous Agents and Multi Agent Systems, Estoril, Portugal, 12–16 May 2008; Volume 3, pp. 1217–1220. [Google Scholar]
- Musa, H.G.; Fatmawati, I.; Nuryakin, N.; Suyanto, M. Marketing Research Trends Using Technology Acceptance Model (TAM): A Comprehensive Review Of Researches (2002–2022). Cogent Bus. Manag. 2024, 11, 2329375. [Google Scholar]
- Sok, J.; Borges, J.R.; Schmidt, P.; Ajzen, I. Farmer behaviour as reasoned action: A critical review of research with the theory of planned behaviour. J. Agric. Econ. 2021, 72, 388–412. [Google Scholar]
- Kelman, H.C. Compliance, identification, and internalization three processes of attitude change. J. Confl. Resolut. 1958, 2, 51–60. [Google Scholar] [CrossRef]
- Poecze, F.; Strauss, C. Social capital on social media: Concepts, measurement techniques and trends in operationalization. Information 2020, 11, 515. [Google Scholar] [CrossRef]
- Colliander, J.; Dahlén, M. Following the fashionable friend: The power of social media weighing the publicity effectiveness of blogsversus online magazines. J. Advert. Res. 2011, 51, 313–320. [Google Scholar]
- Zhong, Y.; Shapoval, V.; Busser, J. The role of parasocial relationship in social media marketing: Testing a model among baby boomers. Int. J. Contemp. Hosp. Manag. 2021, 33, 1870–1891. [Google Scholar]
- Chen, Y.; Mak, P.I.; Zhou, Y. Self-tracking charge pump for fast-locking PLL. Electron. Lett. 2010, 46, 755–757. [Google Scholar] [CrossRef]
- Reinold, T.; Tropp, J. Integrated marketing communications: How can we measure its effectiveness? J. Mark. Commun. 2012, 18, 113–132. [Google Scholar]
- Blakeman, R. Integrated Marketing Communication: Creative Strategy from Idea to Implementation; Rowman & Littlefield: Lanham, MD, USA, 2023. [Google Scholar]
- Marques, V. Marketing Digital de A a Z; Digital 360: Milan, Italy, 2022. [Google Scholar]
- Swonkie. Swonkie: A Social Media Management Platform. 2024. Available online: https://swonkie.com (accessed on 24 May 2024).
- Singh, P.; Dwivedi, Y.K.; Kahlon, K.S.; Sawhney, R.S.; Alalwan, A.A.; Rana, N.P. Smart Monitoring and Controlling of Government Policies Using Social Media and Cloud Computing. Inf. Syst. Front. 2020, 22, 315–337. [Google Scholar] [CrossRef]
- Kaplan, A.M.; Haenlein, M. Users of the world, unite! The challenges and opportunities of social media. Bus. Horiz. 2010, 53, 59–68. [Google Scholar]
- Zeferino, A. Digital Marketing Analytics; Sabedoria Alternativa Edições: Lisboa, Portugal, 2016. [Google Scholar]
- Crisci, A.; Grasso, V.; Nesi, P.; Pantaleo, G.; Paoli, I.; Zaza, I. Predicting TV programme audience by using Twitter based metrics. Multimed. Tools Appl. 2018, 77, 12203–12232. [Google Scholar] [CrossRef]
- Zeng, D.; Chen, H.; Lusch, R.; Li, S.H. Social media analytics and intelligence. IEEE Intell. Syst. 2010, 25, 13–16. [Google Scholar] [CrossRef]
- Fan, W.; Gordon, M.D. The power of social media analytics. Commun. ACM 2014, 57, 74–81. [Google Scholar] [CrossRef]
- Stieglitz, S.; Dang-Xuan, L.; Bruns, A.; Neuberger, C. Social media analytics. Bus. Inf. Syst. Eng. 2014, 6, 89–96. [Google Scholar] [CrossRef]
- Belcastro, L.; Marozzo, F.; Talia, D.; Trunfio, P. A parallel library for social media analytics. In Proceedings of the 2017 International Conference on High Performance Computing & Simulation (HPCS), Genoa, Italy, 17–21 July 2017; pp. 683–690. [Google Scholar] [CrossRef]
- Arnaboldi, M.; Azzone, G.; Sidorova, Y. Governing social media: The emergence of hybridised boundary objects. Account. Audit. Account. J. 2017, 30, 821–849. [Google Scholar] [CrossRef]
- Baur, A.W. Harnessing the social web to enhance insights into people’s opinions in business, government and public administration. Inf. Syst. Front. 2017, 19, 231–251. [Google Scholar] [CrossRef]
- Parsons, A.L.; Lepkowska-White, E. Social Media Marketing Management: A Conceptual Framework. J. Internet Commer. 2018, 17, 81–95. [Google Scholar] [CrossRef]
- Kim, J.H.; Sabherwal, R.; Bock, G.W.; Kim, H.M. Understanding Social Media Monitoring and Online Rumors. J. Comput. Inf. Syst. 2021, 61, 507–519. [Google Scholar] [CrossRef]
- Misirlis, N.; Vlachopoulou, M. Social media metrics and analytics in marketing–S3M: A mapping literature review. Int. J. Inf. Manag. 2018, 38, 270–276. [Google Scholar] [CrossRef]
- Hoffman, D.L.; Fodor, M. Can You Measure the ROI of Your Social Media Marketing? MIT Sloan Management Review. 2010. Available online: https://sloanreview.mit.edu/article/can-you-measure-the-roi-of-your-social-media-marketing/ (accessed on 23 March 2024).
- Stieglitz, S.; Dang-Xuan, L. Social media and political communication: A social media analytics framework. Soc. Netw. Anal. Min. 2013, 3, 1277–1291. [Google Scholar] [CrossRef]
- Stieglitz, S.; Mirbabaie, M.; Ross, B.; Neuberger, C. Social media analytics—Challenges in topic discovery, data collection, and data preparation. Int. J. Inf. Manag. 2018, 39, 156–168. [Google Scholar] [CrossRef]
- Aral, S.; Dellarocas, C.; Godes, D. Introduction to the special issue—Social media and business transformation: A framework for research. Inf. Syst. Res. 2013, 24, 3–13. [Google Scholar] [CrossRef]
- Jacobsen, B.N.; Beer, D. Quantified nostalgia: Social media, metrics, and memory. Soc. Media+ Soc. 2021, 7, 20563051211008822. [Google Scholar] [CrossRef]
- Cvijikj, I.P.; Michahelles, F. Online engagement factors on Facebook brand pages. Soc. Netw. Anal. Min. 2013, 3, 843–861. [Google Scholar] [CrossRef]
- Griffiths, M.; McLean, R. Unleashing corporate communications via social media: A UK study of brand management and conversations with customers. J. Cust. Behav. 2015, 14, 147–162. [Google Scholar]
- Misirlis, N.; Vlachopoulou, M. A Unified Framework for Decision-Making Process on Social Media Analytics. In Operational Research in the Digital Era–ICT Challenges; Sifaleras, A., Petridis, K., Eds.; Springer Proceedings in Business and Economics; Springer: Cham, Switzerland, 2019; pp. 147–159. [Google Scholar] [CrossRef]
- KOR Creatives. Dados Fornecidos Pela Kor Creatives; KOR Creatives: Faro, Portugal, 2024. [Google Scholar]

Disclaimer/Publisher’s Note: The statements, opinions and data contained in all publications are solely those of the individual author(s) and contributor(s) and not of MDPI and/or the editor(s). MDPI and/or the editor(s) disclaim responsibility for any injury to people or property resulting from any ideas, methods, instructions or products referred to in the content. |
© 2025 by the authors. Licensee MDPI, Basel, Switzerland. This article is an open access article distributed under the terms and conditions of the Creative Commons Attribution (CC BY) license (https://creativecommons.org/licenses/by/4.0/).