Article

Center-Guided Network with Dynamic Attention for Transmission Tower Detection

1
Jiangmen Power Supply Bureau of Guangdong Power Grid Co. Ltd., Jiangmen 529000, China
2
School of Automation Science and Engineering, South China University of Technology, Guangzhou 510640, China
*
Author to whom correspondence should be addressed.
Information 2025, 16(4), 331; https://doi.org/10.3390/info16040331
Submission received: 9 March 2025 / Revised: 16 April 2025 / Accepted: 17 April 2025 / Published: 21 April 2025
(This article belongs to the Special Issue AI-Based Image Processing and Computer Vision)

Abstract

:
Transmission tower detection in aerial images is the critical step for the inspection of power transmission equipment, which is essential for the stable operation of the power system. However, transmission towers in aerial images pose numerous challenges for object detection due to their multi-scale elongated shapes, large aspect ratios, and visually similar backgrounds. To address these problems, we propose the Center-Guided network with Dynamic Attention (CGDA) for detecting TTs from aerial images. Specifically, we apply ResNet and FPN as the feature extractor to extract high-quality and multi-scale features. To obtain more discriminative information, the dynamic attention mechanism is employed to dynamically fuse multi-scale feature maps and place more attention on the object regions. In addition, a two-stage detection head is proposed to employ a two-stage detection process to perform more accurate detection. Extensive experiments are conducted on a subset of the public TTPLA dataset. The results show that CGDA achieves competitive performance in detecting TTs, demonstrating the effectiveness of the proposed approach.

1. Introduction

Over the past decade, the technological advancements in Unmanned Aerial Vehicles (UAVs) have significantly expanded their use in intelligent power grid inspections and power engineering planning. UAVs have proven to be highly effective in various applications [1,2], including defect detection [3], anomaly detection [4], and georeferenced image matching [5]. In power engineering, transmission towers (TTs) are critical components of the power transmission infrastructure. Ensuring their structural integrity is essential for the stable operation of the power system. Automatic TT detection from aerial images can significantly improve inspection efficiency, reduce costs, and improve responsiveness to power equipment failures.
TT detection is a significantly challenging task in computer vision. Traditional methods mainly used handcrafted features. For example, Tilawat et al. [6] utilized a Hough transformation to locate TTs in aerial videos. However, these approaches rely heavily on experts’ experience for the hyper-parameters, limiting generalizability across diverse scenarios. With the rapid development of deep learning, deep-feature-based approaches have become the dominant paradigm in this field. The current trend is to improve general object detection models to better capture the characteristics of transmission towers. For instance, Qiao et al. [7] proposed to apply Faster RCNN [8] for electric tower detection in remote sensing images, while Manninen et al. [9] utilized a multi-stage network based on YOLOv5 to classify tower conditions automatically. To address data scarcity, Peterlevitz et al. [10] synthesized simulated data with real-world data, thereby enhancing detection performance. Moreover, Zhu et al. [11] proposed an improved CornerNet with an attention module to detect transmission towers (TTs) and power lines (PLs) together. However, due to the substantial differences between PLs and TTs, this method cannot extract representative features simultaneously of TTs and PLs. Therefore, this study focuses on the task of detecting TTs.
As shown in Figure 1, TTs can be classified into various types based on their materials and structural designs. Most of them have elongated, multi-scale shapes with exceptionally large aspect ratios. In aerial images, similar-looking objects, such as trees, often easily lead to false detections, posing serious challenges for object detection networks. CenterNet [12], which represents objects by a single point at their bounding box center, has advantages in objects with large aspect ratios like TTs. Detecting center points can significantly ignore background interference and enhance robustness to morphological changes. However, as a one-stage detector, the original CenterNet has unsatisfactory feature extraction and classification abilities, resulting in frequent false detections and missed detections. To improve TT detection in aerial images, we propose a new network based on CenterNet, named Center-Guided network with Dynamic Attention (CGDA) for TT detection of aerial images. CGDA includes three main modules: a multi-scale feature extractor, a dynamic attention module, and a two-stage detection head. Specifically, we integrate ResNet [13] and FPN [14] to extract high-quality, multi-scale features. The dynamic attention module is employed to dynamically fuse multi-scale feature maps, emphasizing the discriminative regions and task-specific features. Additionally, the two-stage detection head with SIoU loss improves detection accuracy by refining predictions in a sequential process.
To verify the effectiveness of the proposed CGDA for TTs detection, we conducted extensive experiments on a subset of the widely used TTPLA dataset. Compared to other object detection models, the proposed CGDA demonstrated superior performance, which clearly manifests its effectiveness in this task.
Overall, our contributions can be summarized as follows:
  • We design a novel center-guided network that focuses on TT detection in aerial images.
  • We introduce a two-stage detection head with SIoU loss, which improves the quality of bounding boxes.
  • The experimental results on a public dataset demonstrate that the proposed CGDA performs well in detecting TTs.

2. Related Works

2.1. Object Detection Based Deep Learning

With the rapid development of deep learning, many object detection models [8,12,15,16,17,18,19] have been developed to detect all kinds of objects, such as people, vehicles, and animals. These models are generally divided into two types: two-stage and one-stage detectors. The representative works of two-stage detectors are the RCNN series [8,20,21]. Faster RCNN [8] is the milestone of object detection, which innovatively introduced the Region Proposal Network (RPN) to achieve end-to-end learning. One-stage detectors include various models, with the YOLO series [15,16,22,23] being among the most popular. YOLOv1 [15] creatively transforms the detection task to a regression problem and achieves real-time detection with end-to-end training. Therefore, various studies continuously improved this work and successively proposed more powerful detectors, including YOLOx [17], YOLOv5 [22], YOLOv6 [24], and YOLOv8 [23]. Recently, YOLOv11 [25] and YOLOv12 [26] have been widely used for their outstanding performance in classification, detection, and segmentation. In addition, other one-stage detectors [12,18,19,27,28] focus on keypoint-based object detection. For instance, CornerNet [19] detects objects by identifying their top-left and bottom-right corners to generate bounding boxes, while CenterNet [12] represents objects with a single point, having advantages in objects with large aspect ratios. More recently, Transformer-based detectors [29,30] have shown competitive performance with the above CNN-based detectors.

2.2. Transmission Tower Detection

TT detection is a challenging task, with traditional methods mainly relying on handcrafted features. For example, Tilawat et al. [6] proposed an automatic detection method with Hough transformation to detect transmission towers in aerial videos. Sampedro et al. [31] trained a multi-layer perceptron (MLP) network with HOG features for classification and detection. In recent years, deep-feature-based approaches have become the dominant paradigm in this field. Fei et al. [32] developed a two-stage detector by cascading YOLOv2 and VGG to identify TTs, while Qiao et al. [7] utilized Faster RCNN to detect electric towers in remote sensing images. Manninen et al. [9] proposed to utilize a multi-stage network based on YOLOv5 to classify tower conditions automatically. Peterlevitz et al. [10] addressed the scarcity of transmission tower data by integrating simulated data with real-world data, thereby enhancing detection performance. In addition, some studies have also explored the joint detection of power lines and transmission towers. For example, Zhu et al. [11] introduced an improved CornerNet with an attention module to detect both objects. However, these existing models fail to learn representative features for power lines and transmission towers simultaneously due to their distinct characteristics.

3. Methods

3.1. Overall Framework

The proposed algorithm is designed for practical application in power equipment inspection. UAVs capture aerial images of regions containing transmission towers. These images will be processed to accurately detect and analyze. The analysis results are utilized to assess the operational status of the TTs, thereby enhancing the reliability and stability of the power system.
The proposed CGDA aims to perform precise TT detection in aerial images. The challenges can be concluded as follows: (1) TTs have multi-scale, elongated shapes with extreme aspect ratios; (2) there is considerable interference from visually similar objects and complex environmental conditions. CenterNet, which represents objects by a single center point, is well-suited for handling these issues. However, its feature extraction and classification abilities are insufficient for accurate TT detection. While two-stage detectors like Faster RCNN [8] show superior performance, they are not suitable for detecting targets with high aspect ratios. To address these limitations, we propose a new network named Center-Guided network with Dynamic Attention (CGDA), which includes a feature extractor, a dynamic attention module, and a two-stage detection head. First, the feature extractor extracts high-quality and multi-scale features to adapt to the characteristics of TTs. Then, to further improve the network’s ability, we employ the dynamic attention module to adaptively focus on the target information. Finally, the two-stage detection head improves classification and regression performance for TTs, reducing both false detections and missed detections. The overall architecture is illustrated in Figure 2.
Specifically, the feature extractor plays a crucial role in the basic features that affect the accuracy of the subsequent network. ResNet [13] is widely used in visual recognition tasks due to its translation invariance and locality. However, its hierarchical structure could cause the loss of small objects during the feature extraction process. To address this, we use FPN [14] to preserve multi-scale features and obtain global information. In this paper, we use ResNet-50 combined with FPN as the feature extractor. ResNet-50 consists of five stages, beginning with a 7 × 7 convolution layer. From the second to the fifth stage, the feature map output channels are 256, 512, 1024, and 2048, respectively, with corresponding convolution block counts of 3, 4, 6, and 3. The feature maps from all stages are fed into the FPN to enable the fusion of multi-scale feature maps. Finally, we select the last feature map output used as input for the subsequent network.

3.2. Dynamic Attention

Aerial images present significant challenges for accurate detection due to interference from environmental conditions and the presence of objects resembling TTs. To mitigate the influence of these problems, an effective method is to use an attention mechanism that enhances the feature extraction ability, enabling the model to focus on the object information. Over the past decade, researchers have proposed various attention-based approaches for improved performance, such as SENet [33] and CBAM [34]. However, traditional attention mechanisms usually operate independently on a single dimension, lacking a consideration of multi-dimensional optimization. For example, SENet emphasizes channel-wise importance, while CBAM focuses on spatial attention. Therefore, we adopt a unified framework, including dynamic attention [35], which integrates multi-dimensional information to emphasize TT detection.
As shown in the lower-left part of Figure 2, the dynamic attention block consists of three complementary attention mechanisms: scale-aware attention ψ L , spatial-aware attention ψ S , and task-aware attention ψ T , with each focusing on a different perspective of feature representation. Scale-aware attention block ψ L contains an average pooling, a 1 × 1 convolution layer, a ReLU activation function, and a sigmoid function. It dynamically fuses multi-scale features by assigning adaptive fusion weights. This attention improves the model’s sensitivity to small tower targets. Spatial-aware attention block ψ S includes an offset learning module and a 3 × 3 convolution layer. It first makes attention learning sparse and then aggregates spatial locations at multiple levels. This attention mechanism puts more attention on discriminative regions to improve location precision. Task-aware attention block ψ T is utilized to adapt to different tasks according to specific task parameters. It contains average pooling, fully connected layers, a ReLU activation function, and a normalization operation to optimize feature selection for diverse objectives. In addition, we can sequentially connect these three attention mechanisms, and the output of the dynamic attention block will be
W ( F ) = ψ T ψ S ψ L ( F ) · F · F · F ,
where F R L × H × W × N is the feature map, and L presents the number of levels in the feature pyramid. H, W, and N denote the height, width, respectively, and number of channels of the feature map F. Each attention block applies adaptive weights across different feature dimensions to enhance the feature extraction capability. Additionally, we can stack multiple blocks to obtain more powerful feature fusion capability, though excessive stacking increases computational costs. To explore the optimal number of dynamic attention blocks, we conducted a detailed analysis in the ablation study section.

3.3. Two-Stage Detection Head
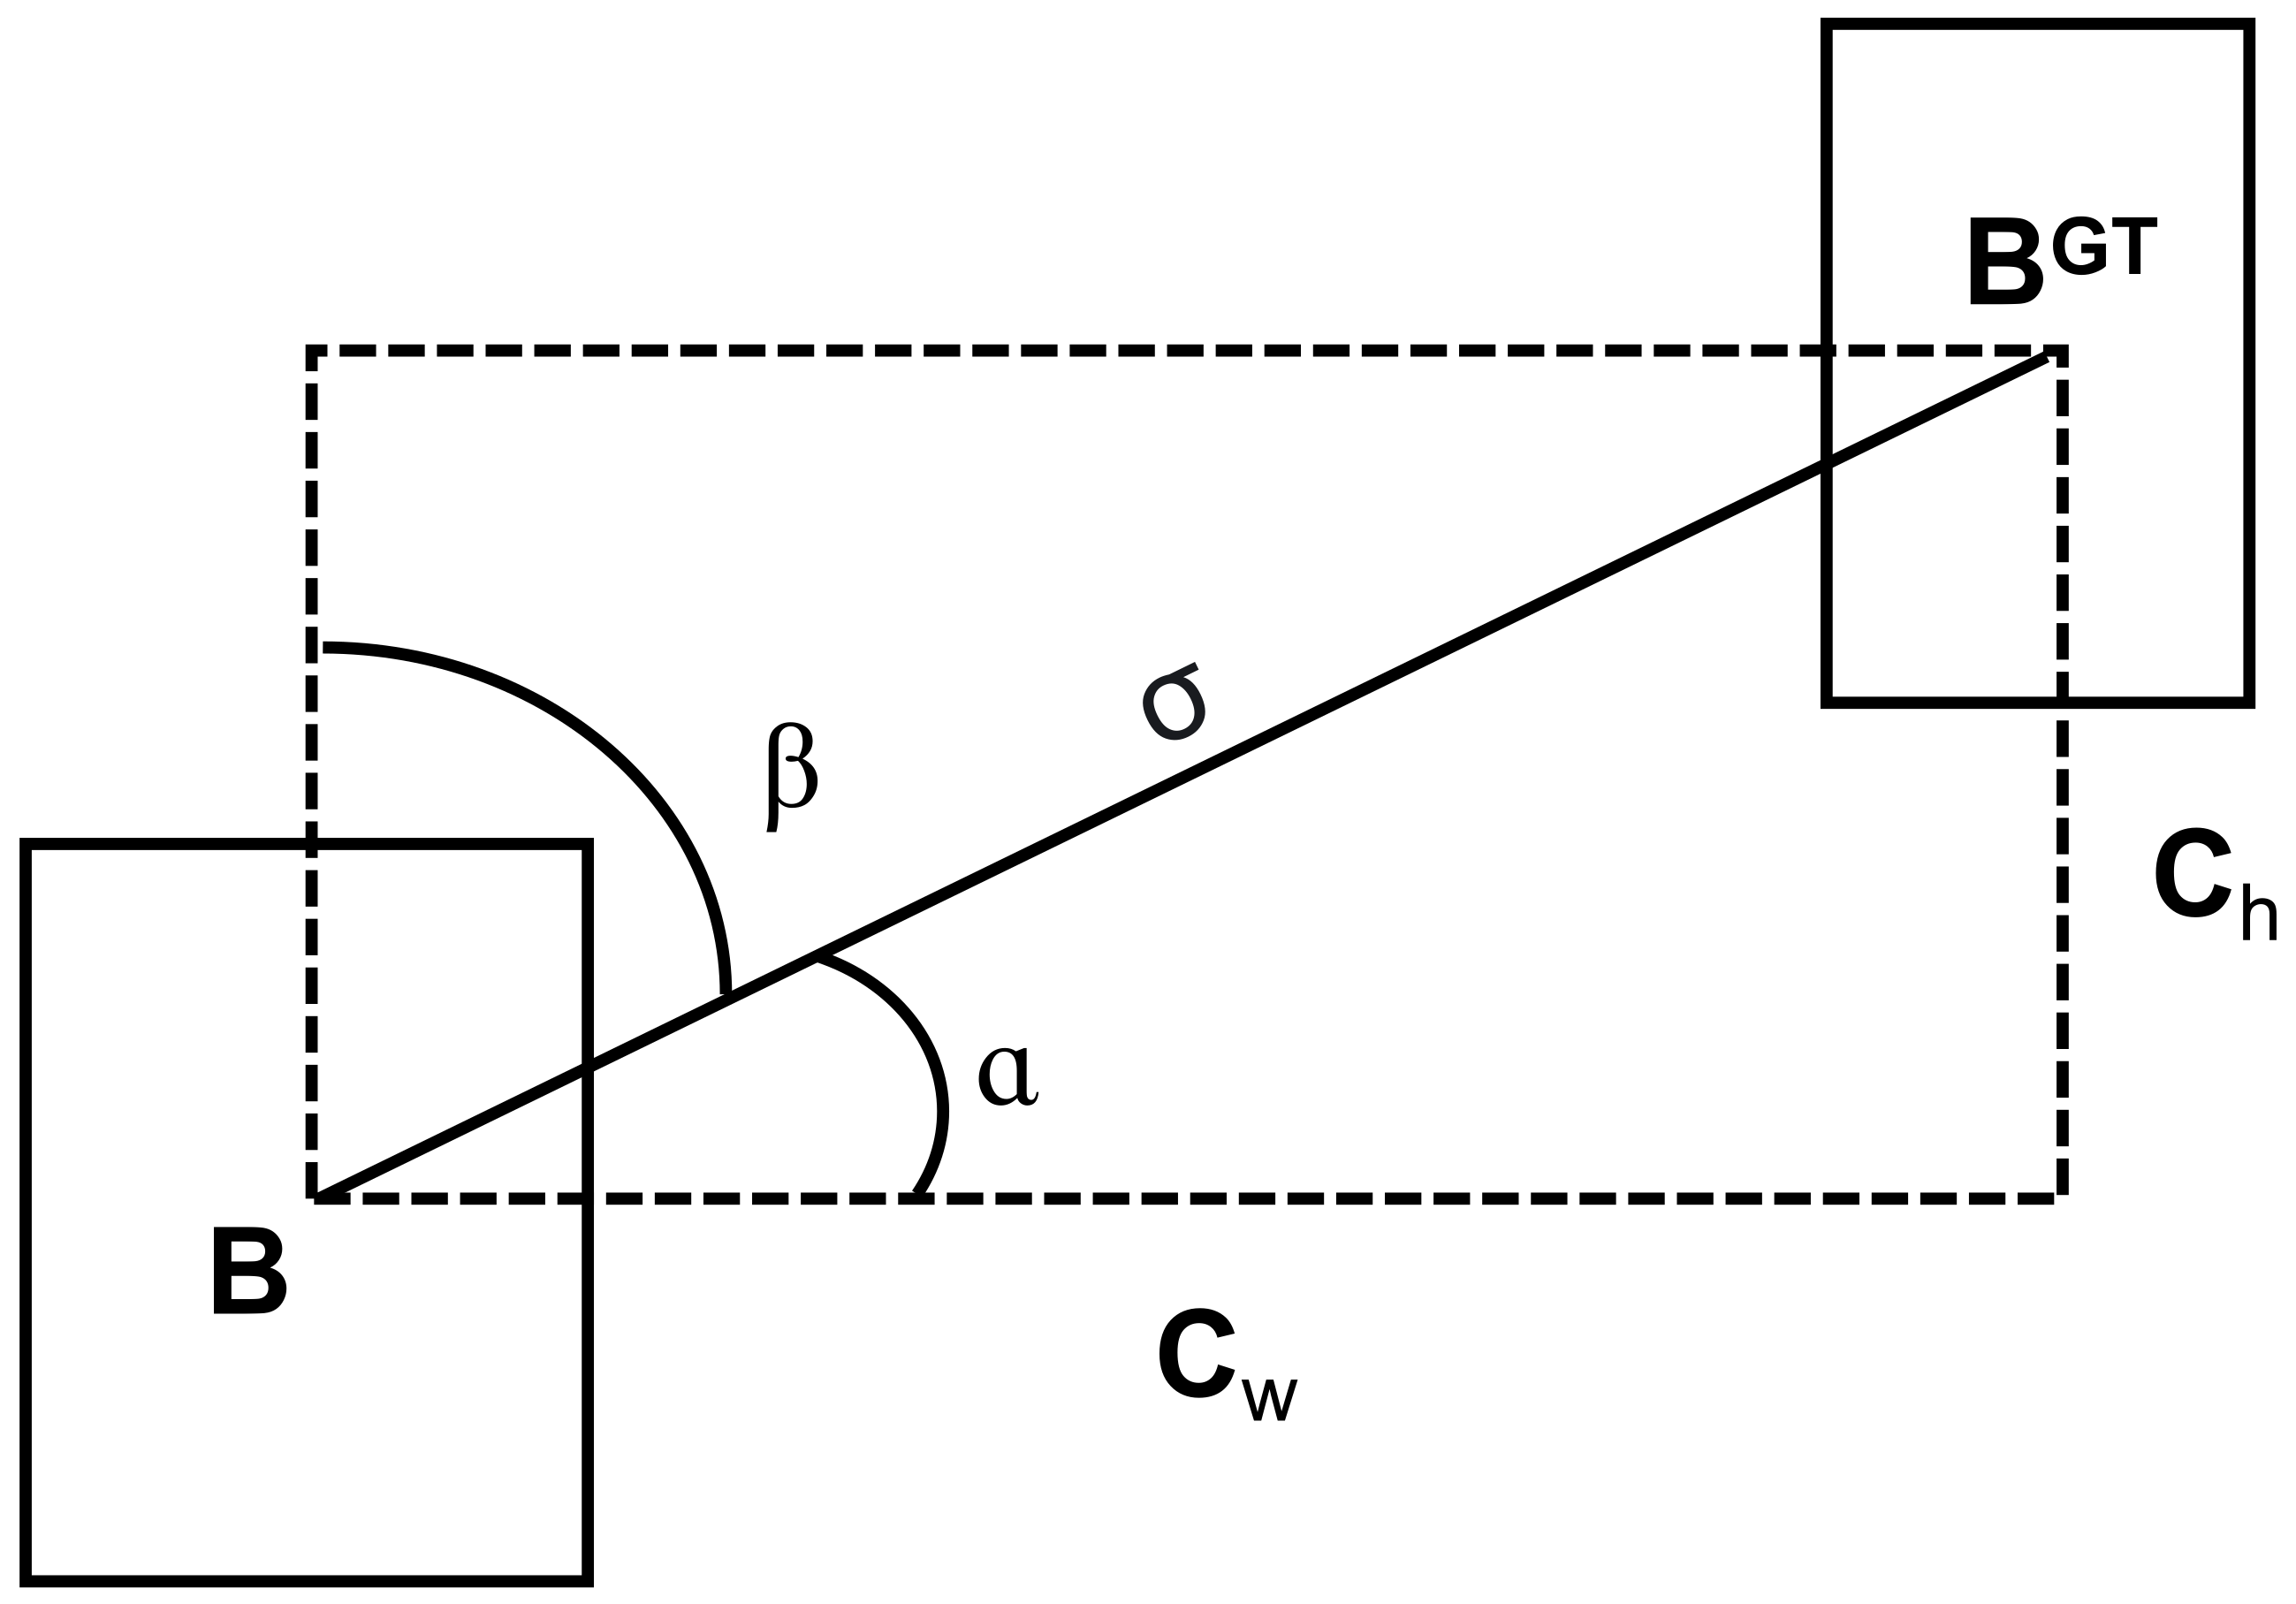
Based on two-stage detectors, such as Faster R-CNN, we know that a two-stage detection paradigm usually yields high-quality detection results. This is because the second detection stage refines predictions by reducing the false positives and missed detections from the first stage process. To improve the classification and regression performance, we creatively employ a two-stage detection head to perform the TT detection task. As illustrated in the left-bottom part of Figure 2, the two-stage detection head predicts whether the center point belongs to the foreground or background in the first prediction, which can be described as
P O i = σ ϕ c b i ,
where b i and O i denote the corresponding bounding box and binary classification result for the i-th feature point. A value of O i = 1 indicates a positive detection in the first stage, while O i = 0 denotes a background classification. ϕ c represents the classification branch in the first prediction, and σ presents the sigmoid function, which outputs the probability of a bounding box belonging to the foreground. In addition, the first prediction stage predicts the locations of the bounding boxes, i.e., the coordinates of the upper-left and bottom-right corner points.
In the detection task of TTs, missed detections and false detections primarily reduce detection performance, and the main reason is the classification uncertainty. To address this, we keep the coordinates of bounding boxes unchanged. In the second prediction, the detection head only uses a classifier with two fully connected layers to further obtain a conditional categorical probability P C i . Here, C i M { b g } represents the fine-grained classification result of the i-th bounding box, where M denotes the classes of transmission towers, and bg indicates the background. The joint predicted probability is computed as
P C i = P C i O i P O i ,
For annotated objects, we maximize their predicted probabilities, while for background boxes, we minimize them. It is noted that any negative first-stage detection ( O i = 0 ) leads to a background C i = b g classification. In aerial images, TT objects are sparsely distributed, typically with only one or two per image. To increase the positive sample number in the training process, all the bounding box centroids in the neighboring area of the ground truth are assigned as positive samples.

3.4. Loss Function

The overall loss in our proposed CGDA consists of two parts: the loss L c l s for classification and the loss L r e g for regression. Thus, the overall loss L a l l can be formulated as
L a l l = L c l s + L r e g ,
In this study, we employ a variant of focal loss as L c l s to enhance the learning of hard instances. For the regression loss L r e g , we adopt SIoU loss [36] to improve the location ability of our proposed CGDA. Other IoU-based losses, such as GIoU [37], DIoU [38], and CIoU [38], calculate the penalty for mismatches between ground truth and predicted bounding boxes based on the distance, the shape, and the IoU. Unlike them, the SIoU loss uniquely considers the direction of the mismatch between the ground box and the predicted box. Specifically, SIoU introduces an angle cost, as detailed in Figure 3, which is computed as
a n g l e c o s t = 1 2 sin 2 arcsin ( x ) π 4 ,
where
x = c h σ = sin ( α ) σ = b c x g t b c x 2 + b c y g t b c y 2 c h = max b c y g t , b c y min b c y g t , b c y
where ( b c x g t , b c y g t ) and ( b c x , b c y ) are the center coordinates of the ground truth and the predicted bounding box, respectively. The parameter α represents the angular displacement between the boxes, σ indicates their Euclidean distance, and c h corresponds to the vertical offset along the y-axis.
With this cost, SIoU loss will force the model to align the bounding box with the ground truth on the x or y axis first (whichever is closest) and then continue the optimization along the remaining axes. By constraining the degrees of freedom in parameter optimization, this approach makes the model converge faster and enhances detection performance. Therefore, compared to conventional IoU-based loss functions, SIoU is more suitable for detecting TTs in aerial images.

4. Results and Discussion

In this section, we conducted extensive experiments to validate the effectiveness of our proposed CGDA. First, we introduce the dataset and evaluation protocols used for performance evaluation. Then, we present the implementation details in our experiments. Finally, we present and analyze the experimental results.

4.1. Dataset and Evaluation Protocol

Dataset: TTPLA [39] is the first public dataset for the detection of TTs and PLs. The images were captured from various view angles and at different times, including different tower types in two U.S. states, to guarantee the diversity of the scenes. These aerial images contain different geographical regions, such as residential areas, forests, hills, and rivers. In detail, the TTPLA dataset was extracted from 80 4K HDR videos captured by a UAV (Parrot-ANAFI), with a resolution of 3840 × 2160 and up to 2.8× lossless zoom. The images were sampled every fifteen frames from these videos and labeled by three human experts. TTPLA includes four object types—cable, tower-lattice, tower-wooden, and tower-tucohy—with the latter three classified based on the lattice and pole types. It consists of 1100 images, which contain 8083 power line instances and 781 transmission tower instances. There are 330, 168, and 283 instances for the three TT types, respectively. The dataset is randomly split into the training, validation, and test in the ratio of 7:1:2. For our study, we divided TTPLA into two subdatasets, TTPLA-cable and TTPLA-tower, which only contain annotations of PLs and TTs, respectively. Since our goal is to improve TT detection, we mainly trained our CGDA and other detection models on the TTPLA-tower dataset. For a fair comparison, all images were resized to 700 × 700 and normalized using the variance and mean values of the dataset images. We implemented random horizontal flipping, cropping, and color jittering as data augmentation for all experiments.
Evaluation protocol: We evaluated our proposed method on the test set using precision (P) and recall (R) to analyze the model performance in terms of false and missed detections, respectively. Additionally, we also used the F1-score to provide an overall evaluation of these two metrics, which is calculated as
F 1 s c o r e = 2 × P × R P + R
Following the mainstream setting, we used the average precision (AP) as the performance indicator to evaluate the overall model performance. The intersection over union (IoU) measures the overlap between the ground truth and the matched prediction boxes. The AP is accounted when the IoU is greater than 50%. Following [39], we computed three average precision scores: A P a v g , A P 50 % , and A P 75 % . A P a v g , commonly known as the mAP, is the mean A P across all classes under different I o U thresholds ranging from 50% to 95%, with a step of 5%. A P 50 % , and A P 75 % are the A P values with the I o U values of 50% and 75%, respectively.

4.2. Implementation Details

We utilized the MMDetection [40] toolbox to implement our CGDA and other networks. All the experiments were conducted on two GeForce RTX3060 GPUs. The models were trained for 200 epochs using the Adam optimizer, with a weight decay of 4 × 10⁻⁴ and a batch size of 8. The backbones of most models are initialized using pretrained parameters from the PyTorch [41] official library. The initial learning rate was set to 1 × 10⁻⁴ and decayed by a factor of 10 at the 160th epoch. To accelerate training, we employed a mixed precision training method for all experiments. During the test phase, soft-NMS was applied to refine the detection results.

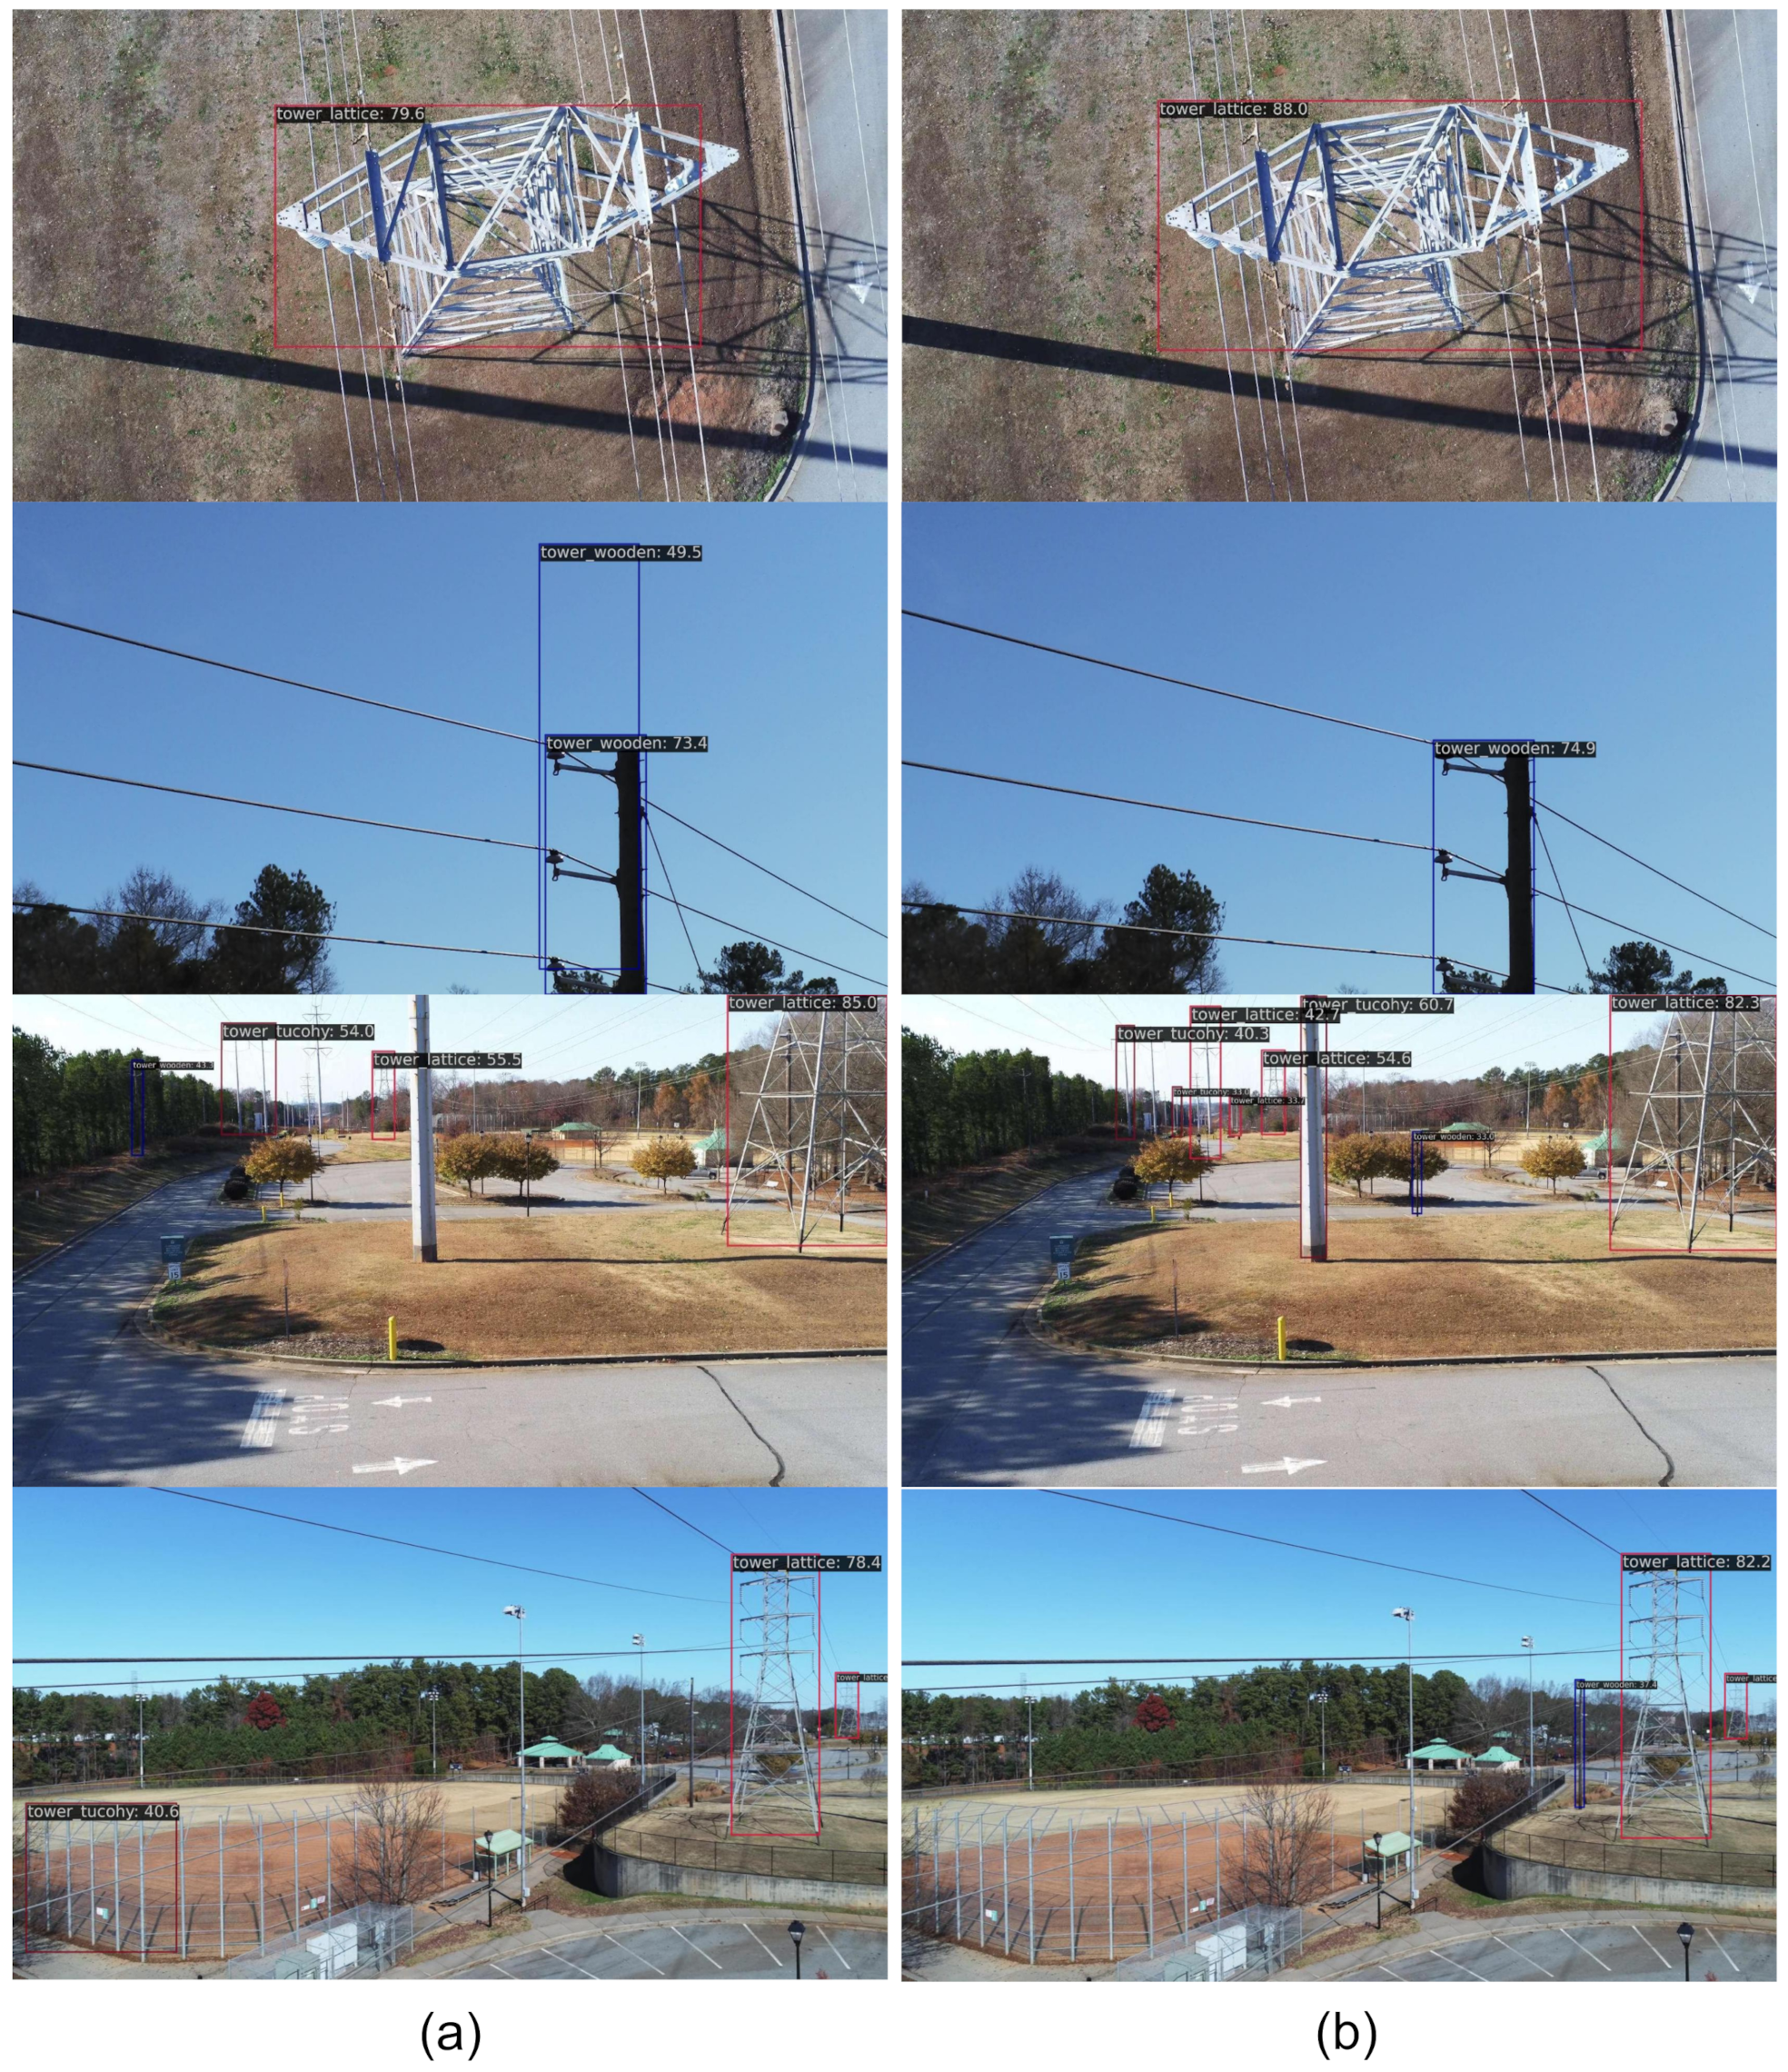
4.3. Experimental Results

Extensive experiments were conducted on the TTPLA-tower dataset to compare our proposed CGDA with mainstream object detectors. These include Faster RCNN [8] for two-stage detection, as well as FCOS [18], ATTS [28], the YOLO series, CenterNet [12], CornerNet [19], RTMDet [42], and CentripetalNet [27] for one-stage detection. The YOLO models were initialized with pretrained models from the ultralytics tool [25]. Table 1 reports the average AP scores across different TT types. CGDA achieved AP scores of 65.5%, 62.9%, and 39.0% for these three tower categories, showing competitive results against powerful detectors like YOLOv11 [25] and YOLOv12 [26]. Especially, an AP score of 39% on tower-wooden demonstrates that CGDA can effectively extract the discriminative features of wooden tower objects. As shown in Table 2, CGDA achieved an overall AP of 55.3% on the TTPLA-tower dataset, outperforming the baseline model CenterNet and the advanced model YOLOv11 by 9.9% and 2.5%, respectively. It also achieved the highest AP across other IoU thresholds (e.g., 72.9% and 58.4%). For further evaluation, we also evaluated the precision, recall, and F1-score with a score threshold of 0.3 and an IoU threshold of 0.5. Compared to the benchmark method, CGDA substantially improved the recall rate, indicating a strong ability to reduce missed detections and focus on object information. It also achieved the best F1-score of 71.7%, while YOLOv12 showed high precision. This may be attributed to its one-to-many and one-to-one label allocation strategies to train two location regression branches simultaneously, improving the prediction box quality. In practice, different models require different IoU thresholds to achieve the best trade-offs between precision and recall. CenterNet with a Swin Transformer significantly improved the detection performance due to the enhanced feature extraction capabilities. However, CGDA outperformed this model, particularly excelling by 7.2% in the tower-wooden category. This advantage likely stems from CGDA’s dynamic attention mechanism, which focuses on the critical information of elongated targets. Moreover, compared to YOLOv11 and CenterNet (Swin), the CGDA method demonstrated a substantial performance advantage.
Training and inference costs are crucial for the practical deployment of models. Table 3 reports three real-time performance metrics—training time, parameter count (Params), and inference time—evaluated on one GeForce RTX3060 GPU. The training time refers to the duration required to complete 200 epochs. Params presents the total number of trainable parameters, indicating model complexity and storage requirements. The inference time includes the time spent on preprocessing, model inference, and postprocessing for a single input image. As shown in Table 3, CGDA required 3.6 h for training, being comparable to Faster RCNN. This duration falls within a reasonable range for practical applications. CGDA has 34.1 M parameters, 4.9 M more than the original CenterNet, mainly due to the introduction of the dynamic attention mechanism. In contrast, CornerNet and CentripetalNet contain nearly 200 million parameters, primarily due to their highly complex hourglass backbone. Compared to the hourglass backbone, ResNet can achieve a good balance between performance and efficiency. The inference time is a key indicator of real-time performance. The inference time of the proposed CGDA was 48.1 ms, 17.7 ms slower than the original CenterNet, but it also meets the speed requirement of UAV detection. While CGDA’s complexity has increased compared to the benchmark model, better hardware support may be needed for deployment. As seen in the table, YOLO series detectors generally have strong real-time performance due to their lightweight network design, which may provide a direction for our future work.
As seen in Figure 4, CGDA detected various TT objects with high accuracy. As shown in the first group of images on the top, CGDA predicted more precise bounding boxes than CenterNet, likely due to SIoU’s geometric constraints, which enhance bounding box quality. As shown in the middle two groups, CenterNet struggled with small objects, whereas CGDA consistently detected all kinds of objects with different scales. This improvement is attributed to the dynamic attention mechanism, which strengthens the discernibility of the feature maps. Moreover, the two-stage detection approach increases the confidence scores of predominantly small and elongated targets, which are often overlooked during single-stage detection. As shown in the last group, CGDA effectively filtered out background boxes to reduce false detections. Overall, our proposed CGDA outperformed the baseline model in feature extraction capability, handling complex backgrounds, object scales, and changes in lighting conditions.
We conducted a t-test using the models’ average precision obtained from three repeated experiments to verify the statistical significance of the reported performance. As shown in Table 4, the mean A P a v g values for our proposed CGDA and the original CenterNet were 55.79% and 45.94%, respectively. The t-value obtained for the AP metric is −36.83. The p-value obtained for the AP metric is 7.37 × 10⁻⁴, which is below 0.01, indicating that the performance difference between the two models is statistically significant.

4.4. Ablation Study

We also performed several ablation experiments to analyze the proposed CGDA method further.
Effect of the regression loss function: To find a suitable regression loss for TT detection, we conducted experiments to compare different types of IoU-based loss functions. As shown in Table 5, the SIoU loss demonstrated superior performance in TT detection compared to other losses. With an overall performance of 53.9%, SIoU outperformed the IoU, GIoU, DIoU, CIoU, and EIoU by 5.8%, 1.3%, 0.7%, 1.2%, and 1.4%, respectively. In addition, SIoU achieved the highest AP75% score of 59.3% on the TTPLA-tower dataset. These results suggest SIoU’s effectiveness, likely due to its additional angle cost, which enables faster convergence and greater location accuracy, making it particularly advantageous for accurate TT detection.
Influence of the number of dynamic attention blocks: The CGDA framework allows for flexibility in adjusting the number of dynamic attention blocks. As shown in Table 6, the best AP score of 55.8% was achieved when the number of dynamic attention blocks was set to six. The detection performance decreased when the block number continued to increase. This is likely because the detector with more attention blocks requires more training time to converge. Considering both performance and efficiency, for all experiments, CGDA was implemented with six dynamic attention blocks in this study.
Ablation studies on all modules: CGDA proposes to employ three main modules, including a two-stage detection head, dynamic attention, and SIoU loss. We conducted detailed ablation studies on the TTPLA-tower dataset to evaluate their individual and combined contributions. As shown in Table 7, the proposed two-stage detection head and dynamic attention individually achieved overall performance results of 48.1% and 49.2%, respectively. When combined, the model’s performance significantly improved to 52.3%. Finally, our CGDA achieved an outstanding average AP of 55.8%. These results demonstrate the effectiveness of each component and the overall strength of the CGDA framework.

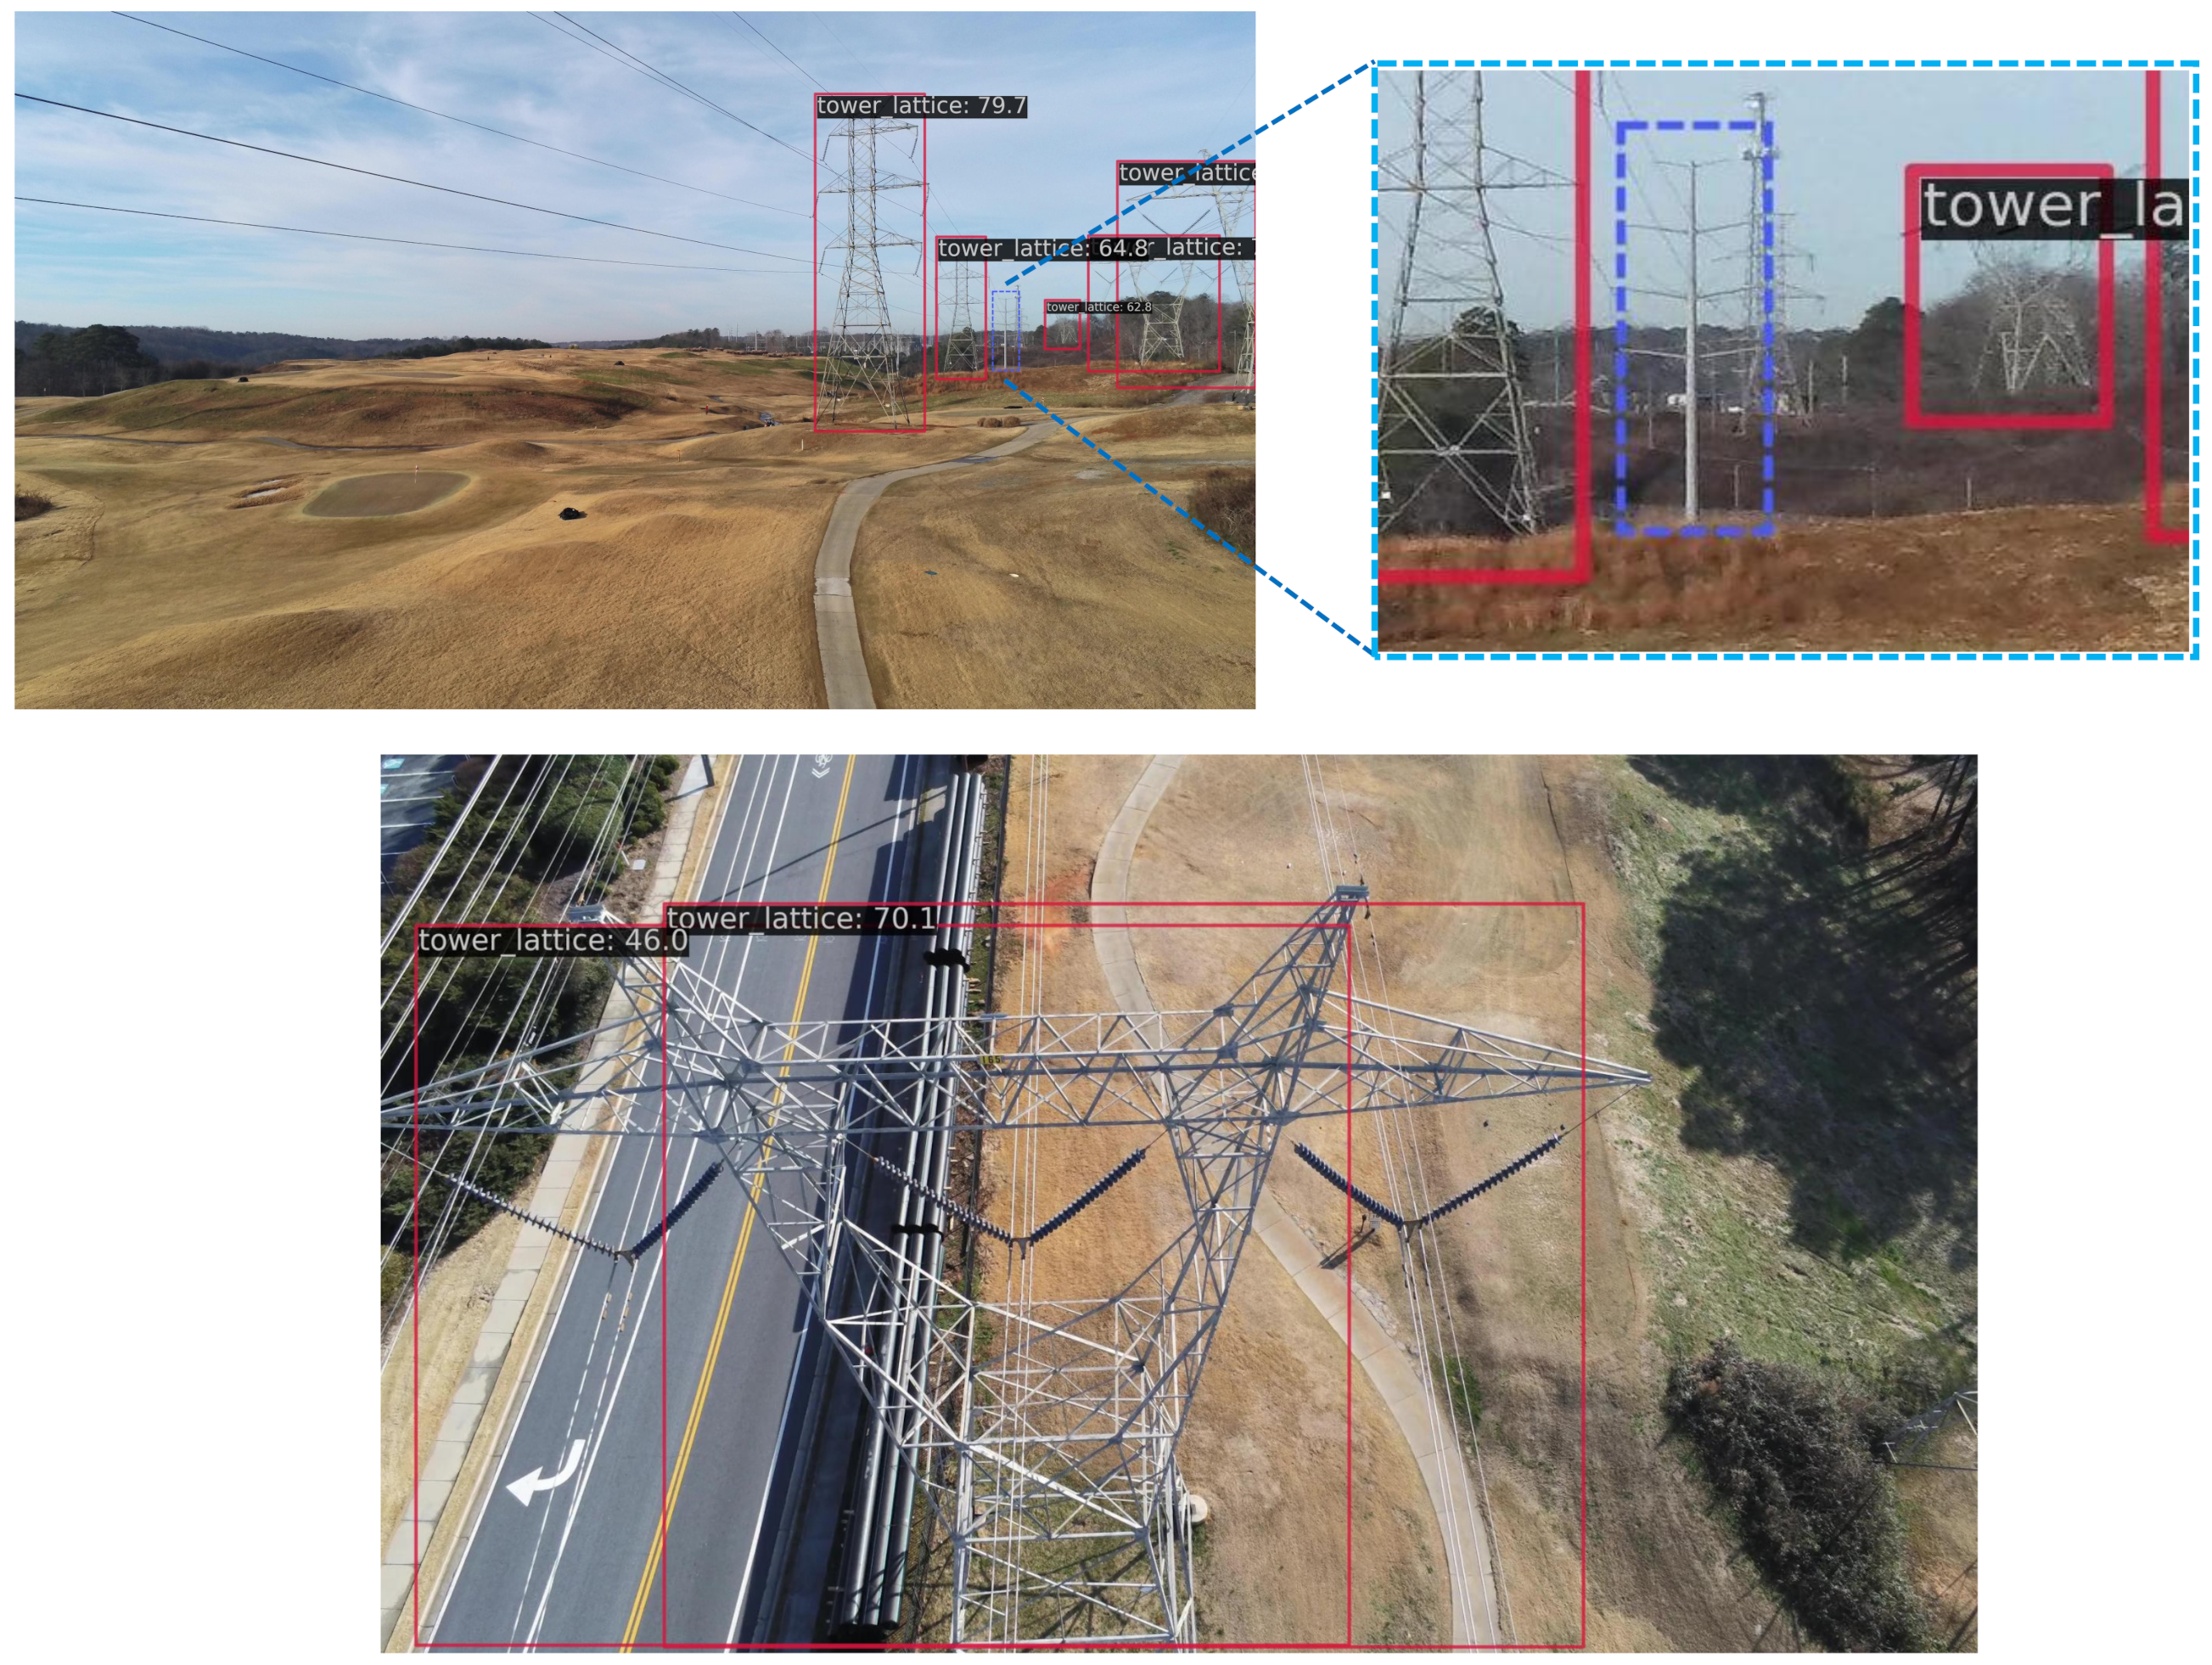
4.5. Failure Case Analysis

Although our proposed CGDA has exhibited superior performance in TT detection compared to existing object detectors, there is still room for improvement.
We show the failure cases of CGDA on the TTPLA-tower dataset. On the one hand, as shown in the first case of Figure 5, some tiny TTs may not be detected, likely due to information loss during the image resizing process. On the other hand, TTs captured at large viewing angles can result in duplicate detections in the second case shown in Figure 5. To mitigate these issues, our proposed method could be further improved in NMS postprocessing to better handle occlusion while reducing redundancy in detection.

5. Conclusions

In this paper, we propose the Center-Guided network with Dynamic Attention (CGDA) for the challenging task of detecting transmission towers (TTs) in aerial images. The CGDA framework integrates three key components: a multi-scale feature extractor based on ResNet and FPN, a dynamic attention mechanism for adaptive feature fusion and target region enhancement, and a two-stage detection head for improved classification and localization. The dynamic attention mechanism effectively suppresses background interference and emphasizes the discriminative features of TTs, while the two-stage detection paradigm significantly reduces false positives and improves bounding box precision. Extensive experiments on the subset of the public TTPLA dataset demonstrate that CGDA achieved competitive performance in detecting TTs. Ablation studies further validate the contributions of each module, particularly the dynamic attention module, which is crucial for handling the elongated shapes and scale variations of TTs. Overall, CGDA advances the performance of TT detection and provides insights into designing specialized networks for objects with distinctive geometric characteristics.
In the future, we could explore extending CGDA to multi-task scenarios, such as extending CGDA for power line detection alongside transmission towers and applying unsupervised learning to address the lack of label data. Our method requires more hardware performance support than the original CenterNet, which may pose challenges for practical applications. Therefore, future work could develop a lighter backbone framework for real-time UAV applications.

Author Contributions

Conceptualization, X.L. and Z.L.; methodology, X.L. and J.Y.; software, C.L.; validation, J.Y. and Y.X.; formal analysis, X.L., J.Y. and Y.X.; investigation, X.L.; resources, Y.X.; data curation, Z.L.; writing—original draft preparation, Z.L. and C.L.; writing—review and editing, X.L.; visualization, C.L.; supervision, Y.X.; project administration, X.L.; funding acquisition, Z.L. All authors have read and agreed to the published version of the manuscript.

Funding

This research was supported by the Science and Technology Project of China Southern Power Grid Co., Ltd. (030700KC23070011).

Institutional Review Board Statement

Not applicable.

Informed Consent Statement

Not applicable.

Data Availability Statement

The data presented in this study are openly available at https://github.com/R3ab/ttpla_dataset (accessed on 27 June 2024).

Conflicts of Interest

Author Yuge Xu was employed by the company Jiangmen Power Supply Bureau of Guangdong Power Grid Co. Ltd. The remaining authors declare that the research was conducted in the absence of any commercial or financial relationships that could be construed as a potential conflict of interest.

References

  1. Hosseini, M.M.; Umunnakwe, A.; Parvania, M.; Tasdizen, T. Intelligent Damage Classification and Estimation in Power Distribution Poles Using Unmanned Aerial Vehicles and Convolutional Neural Networks. IEEE Trans. Smart Grid 2020, 11, 3325–3333. [Google Scholar] [CrossRef]
  2. Lim, G.J.; Kim, S.; Cho, J.; Gong, Y.; Khodaei, A. Multi-UAV Pre-Positioning and Routing for Power Network Damage Assessment. IEEE Trans. Smart Grid 2016, 9, 3643–3651. [Google Scholar] [CrossRef]
  3. Yang, Z.; Xu, Z.; Wang, Y. Bidirection-Fusion-YOLOv3: An Improved Method for Insulator Defect Detection Using UAV Image. IEEE Trans. Instrum. Meas. 2022, 71, 3521408. [Google Scholar] [CrossRef]
  4. Chen, C.; Yang, B.; Song, S.; Peng, X.; Huang, R. Automatic Clearance Anomaly Detection for Transmission Line Corridors Utilizing UAV-Borne LIDAR Data. Remote Sens. 2018, 10, 613. [Google Scholar] [CrossRef]
  5. Zhuo, X.; Koch, T.; Kurz, F.; Fraundorfer, F.; Reinartz, P. Automatic UAV Image Geo-Registration by Matching UAV Images to Georeferenced Image Data. Remote Sens. 2017, 9, 376. [Google Scholar] [CrossRef]
  6. Tilawat, J.; Theera-Umpon, N.; Auephanwiriyakul, S. Automatic Detection of Electricity Pylons in Aerial Video Sequences. In Proceedings of the 2010 International Conference on Electronics and Information Engineering, Kyoto, Japan, 1–3 August 2010; Volume 1, pp. V1-342–V1-346. [Google Scholar]
  7. Qiao, S.; Sun, Y.; Zhang, H. Deep Learning Based Electric Pylon Detection in Remote Sensing Images. Remote Sens. 2020, 12, 1857. [Google Scholar] [CrossRef]
  8. Ren, S.; He, K.; Girshick, R.; Sun, J. Faster R-CNN: Towards Real-Time Object Detection with Region Proposal Networks. IEEE Trans. Pattern Anal. Mach. Intell. 2017, 39, 1137–1149. [Google Scholar] [CrossRef] [PubMed]
  9. Manninen, H.; Ramlal, C.J.; Singh, A.; Kilter, J.; Landsberg, M. Multi-Stage Deep Learning Networks for Automated Assessment of Electricity Transmission Infrastructure Using Fly-by Images. Electr. Power Syst. Res. 2022, 209, 107948. [Google Scholar] [CrossRef]
  10. Peterlevitz, A.J.; Chinelatto, M.A.; Menezes, A.G.; Motta, C.A.M.; Pereira, G.A.B.; Lopes, G.L.; Souza, G.D.M.; Rodrigues, J.; Godoy, L.C.; Koller, M.A.F.F.; et al. Sim-to-Real Transfer for Object Detection in Aerial Inspections of Transmission Towers. IEEE Access Pract. Innov. Open Solut. 2023, 11, 110312–110327. [Google Scholar] [CrossRef]
  11. Zhu, G.; Zhang, W.; Wang, M.; Wang, J.; Fang, X. Corner Guided Instance Segmentation Network for Power Lines and Transmission Towers Detection. Expert Syst. Appl. 2023, 234, 121087. [Google Scholar] [CrossRef]
  12. Zhou, X.; Wang, D.; Krähenbühl, P. Objects as Points. arXiv 2019, arXiv:1904.07850. [Google Scholar]
  13. He, K.; Zhang, X.; Ren, S.; Sun, J. Deep Residual Learning for Image Recognition. In Proceedings of the 2016 IEEE Conference on Computer Vision and Pattern Recognition (CVPR), Las Vegas, NV, USA, 27–30 June 2016; pp. 770–778. [Google Scholar]
  14. Lin, T.Y.; Dollar, P.; Girshick, R.; He, K.; Hariharan, B.; Belongie, S. Feature Pyramid Networks for Object Detection. In Proceedings of the 2017 IEEE Conference on Computer Vision and Pattern Recognition (CVPR), Honolulu, HI, USA, 21–26 July 2017. [Google Scholar]
  15. Redmon, J.; Divvala, S.; Girshick, R.; Farhadi, A. You Only Look Once: Unified, Real-Time Object Detection. In Proceedings of the IEEE Conference on Computer Vision and Pattern Recognition, Las Vegas, NV, USA, 27–30 June 2016; pp. 779–788. [Google Scholar]
  16. Redmon, J. Yolov3: An Incremental Improvement. arXiv 2018, arXiv:1804.02767. [Google Scholar]
  17. Ge, Z.; Liu, S.; Wang, F.; Li, Z.; Sun, J. Yolox: Exceeding Yolo Series in 2021. arXiv 2021, arXiv:2107.08430. [Google Scholar]
  18. Tian, Z.; Shen, C.; Chen, H.; He, T. FCOS: Fully Convolutional One-Stage Object Detection. In Proceedings of the 2019 IEEE/CVF International Conference on Computer Vision (ICCV), Seoul, Republic of Korea, 27 October–2 November 2019; pp. 9626–9635. [Google Scholar]
  19. Law, H.; Deng, J. CornerNet: Detecting Objects as Paired Keypoints. In Proceedings of the European Conference on Computer Vision (ECCV), Munich, Germany, 8–14 September 2018; pp. 734–750. [Google Scholar]
  20. Girshick, R.; Donahue, J.; Darrell, T.; Malik, J. Rich Feature Hierarchies for Accurate Object Detection and Semantic Segmentation. In Proceedings of the IEEE Conference on Computer Vision and Pattern Recognition, Columbus, OH, USA, 23–28 June 2014; pp. 580–587. [Google Scholar]
  21. Girshick, R. Fast R-Cnn. In Proceedings of the IEEE International Conference on Computer Vision, Santiago, Chile, 7–13 December 2015; pp. 1440–1448. [Google Scholar]
  22. Jocher, G.; Stoken, A.; Borovec, J.; Liu, C.; Hogan, A.; Chaurasia, A.; Diaconu, L.; Ingham, F.; Colmagro, A.; Ye, H.; et al. Ultralytics/Yolov5: V4. 0-Nn. SiLU () Activations, Weights & Biases Logging, PyTorch Hub Integration. Zenodo. 2021. Available online: https://github.com/ultralytics/yolov5 (accessed on 16 April 2025).
  23. Aboah, A.; Wang, B.; Bagci, U.; Adu-Gyamfi, Y. Real-Time Multi-Class Helmet Violation Detection Using Few-Shot Data Sampling Technique and Yolov8. In Proceedings of the IEEE/CVF Conference on Computer Vision and Pattern Recognition, Vancouver, BC, Canada, 17–24 June 2023; pp. 5350–5358. [Google Scholar]
  24. Li, C.; Li, L.; Jiang, H.; Weng, K.; Geng, Y.; Li, L.; Ke, Z.; Li, Q.; Cheng, M.; Nie, W.; et al. YOLOv6: A Single-Stage Object Detection Framework for Industrial Applications. arXiv 2022, arXiv:2209.02976. [Google Scholar]
  25. Jocher, G.; Qiu, J. Ultralytics YOLO11. 2024. Available online: https://www.ultralytics.com/ (accessed on 16 April 2025).
  26. Tian, Y.; Ye, Q.; Doermann, D. Yolov12: Attention-Centric Real-Time Object Detectors. arXiv 2025, arXiv:2502.12524. [Google Scholar]
  27. Dong, Z.; Li, G.; Liao, Y.; Wang, F.; Ren, P.; Qian, C. Centripetalnet: Pursuing High-Quality Keypoint Pairs for Object Detection. In Proceedings of the IEEE/CVF Conference on Computer Vision and Pattern Recognition, Seattle, WA, USA, 13–19 June 2020; pp. 10519–10528. [Google Scholar]
  28. Zhang, S.; Chi, C.; Yao, Y.; Lei, Z.; Li, S.Z. Bridging the Gap between Anchor-Based and Anchor-Free Detection via Adaptive Training Sample Selection. In Proceedings of the IEEE/CVF Conference on Computer Vision and Pattern Recognition, Seattle, WA, USA, 13–19 June 2020; pp. 9759–9768. [Google Scholar]
  29. Liu, Z.; Lin, Y.; Cao, Y.; Hu, H.; Wei, Y.; Zhang, Z.; Lin, S.; Guo, B. Swin Transformer: Hierarchical Vision Transformer Using Shifted Windows. In Proceedings of the IEEE/CVF International Conference on Computer Vision, Montreal, QC, Canada, 10–17 October 2021; pp. 10012–10022. [Google Scholar]
  30. Carion, N.; Massa, F.; Synnaeve, G.; Usunier, N.; Kirillov, A.; Zagoruyko, S. End-to-End Object Detection with Transformers. In Proceedings of the European Conference on Computer Vision, Glasgow, UK, 23–28 August 2020; pp. 213–229. [Google Scholar]
  31. Sampedro, C.; Martinez, C.; Chauhan, A.; Campoy, P. A Supervised Approach to Electric Tower Detection and Classification for Power Line Inspection. In Proceedings of the 2014 International Joint Conference on Neural Networks (IJCNN), Beijing, China, 6–11 July 2014; pp. 1970–1977. [Google Scholar]
  32. Tian, G.; Meng, S.; Bai, X.; Zhi, Y.; Ou, W.; Fei, X.; Tan, Y. Electric Tower Target Identification Based on High-Resolution SAR Image and Deep Learning. J. Phys. Conf. Ser. 2020, 1453, 012117. [Google Scholar] [CrossRef]
  33. Hu, J.; Shen, L.; Sun, G. Squeeze-and-Excitation Networks. In Proceedings of the IEEE Conference on Computer Vision and Pattern Recognition, Salt Lake City, UT, USA, 18–22 June 2018; pp. 7132–7141. [Google Scholar]
  34. Woo, S.; Park, J.; Lee, J.Y.; Kweon, I.S. Cbam: Convolutional Block Attention Module. In Proceedings of the European Conference on Computer Vision (ECCV), Munich, Germany, 8–14 September 2018; pp. 3–19. [Google Scholar]
  35. Dai, X.; Chen, Y.; Xiao, B.; Chen, D.; Liu, M.; Yuan, L.; Zhang, L. Dynamic Head: Unifying Object Detection Heads With Attentions. In Proceedings of the IEEE/CVF Conference on Computer Vision and Pattern Recognition, Nashville, TN, USA, 19–25 June 2021; pp. 7373–7382. [Google Scholar]
  36. Gevorgyan, Z. SIoU Loss: More Powerful Learning for Bounding Box Regression. arXiv 2022, arXiv:2205.12740. [Google Scholar]
  37. Rezatofighi, H.; Tsoi, N.; Gwak, J.; Sadeghian, A.; Reid, I.; Savarese, S. Generalized Intersection over Union: A Metric and a Loss for Bounding Box Regression. In Proceedings of the 2019 IEEE/CVF Conference on Computer Vision and Pattern Recognition (CVPR), Long Beach, CA, USA, 15–20 June 2019. [Google Scholar]
  38. Zheng, Z.; Wang, P.; Liu, W.; Li, J.; Ye, R.; Ren, D. Distance-IoU Loss: Faster and Better Learning for Bounding Box Regression. In Proceedings of the AAAI Conference on Artificial Intelligence, New York, NY, USA, 7–12 February 2020; Volume 34, pp. 12993–13000. [Google Scholar]
  39. Abdelfattah, R.; Wang, X.; Wang, S. TTPLA: An Aerial-Image Dataset for Detection and Segmentation of Transmission Towers and Power Lines. In Proceedings of the Asian Conference on Computer Vision, Kyoto, Japan, 30 November–4 December 2020. [Google Scholar]
  40. Chen, K.; Wang, J.; Pang, J.; Cao, Y.; Xiong, Y.; Li, X.; Sun, S.; Feng, W.; Liu, Z.; Xu, J.; et al. MMDetection: Open Mmlab Detection Toolbox and Benchmark. arXiv 2019, arXiv:1906.07155. [Google Scholar]
  41. Paszke, A.; Gross, S.; Chintala, S.; Chanan, G.; Yang, E.; DeVito, Z.; Lin, Z.; Desmaison, A.; Antiga, L.; Lerer, A. Automatic Differentiation in Pytorch. In Proceedings of the 31st Conference on Neural Information Processing Systems (NIPS 2017), Long Beach, CA, USA, 4–9 December 2017. [Google Scholar]
  42. Lyu, C.; Zhang, W.; Huang, H.; Zhou, Y.; Wang, Y.; Liu, Y.; Zhang, S.; Chen, K. Rtmdet: An Empirical Study of Designing Real-Time Object Detectors. arXiv 2022, arXiv:2212.07784. [Google Scholar]
Figure 1. Examples of transmission towers.
Information 16 00331 g001
Figure 2. The architecture of the proposed CGDA network.
Information 16 00331 g002
Figure 3. The scheme for the calculation of angle cost.
Information 16 00331 g003
Figure 4. Outputs of (a) CenterNet and (b) CGDA on the TTPLA-tower dataset.
Information 16 00331 g004
Figure 5. Failure cases in TTPLA-tower dataset.
Information 16 00331 g005
Table 1. Object detection performance of different detectors on different types of TTs in the TTPLA-tower dataset. The best and the secondary results are marked in bold and underline, respectively.
MethodTower-LatticeTower-TucohyTower-Wooden
Faster RCNN [8]59.454.524.1
FCOS [18]62.860.831.9
ATTS [28]59.556.928.9
YOLOx [17]40.032.510.9
YOLOv5 [22]33.123.75.5
YOLOv6 [24]52.947.924.2
YOLOv8 [23]62.055.228.9
YOLOv11 [25]67.264.128.5
YOLOv12 [26]64.663.730.0
CenterNet [12]57.351.728.5
CenterNet (Swin) [29]64.357.331.2
CornerNet [19]48.843.915.7
RTMDet [42]58.355.129.3
CentripetalNet [27]56.147.820.2
CGDA (ours)65.562.939.0
Table 2. Performance of different models on TTPLA-tower. The best and the secondary results are marked in bold and underline, respectively.
MethodAPavgAP50%AP75%PRF1-Score
Faster RCNN [8]46.066.250.668.864.466.5
FCOS [18]51.871.151.175.862.468.5
ATTS [28]48.468.652.868.767.868.3
YOLOx [17]27.853.526.363.752.357.4
YOLOv5 [22]20.739.519.374.629.642.4
YOLOv6 [24]41.762.344.968.663.766.1
YOLOv8 [23]48.767.053.274.266.069.8
YOLOv11 [25]53.370.257.172.767.570.0
YOLOv12 [26]52.869.458.275.165.670.0
CenterNet [12]45.969.049.765.960.463.0
CenterNet (Swin) [29]51.070.256.871.270.370.7
CornerNet [19]36.243.936.240.247.143.4
RTMDet [42]47.669.852.467.362.049.4
CentripetalNet [27]41.452.142.371.543.854.3
CGDA (ours)55.872.958.469.374.271.7
Table 3. Real-time performance comparison of different detectors.
MethodTraining Time (h)Params (M)Inference Time (ms)
Faster RCNN [8]3.441.445.7
FCOS [18]2.632.151.0
ATTS [28]2.532.150.9
YOLOx [17]1.88.911.9
YOLOv5 [22]1.27.08.6
YOLOv6 [24]2.018.524.7
YOLOv8 [23]1.611.19.7
YOLOv11 [25]1.49.49.9
YOLOv12 [26]2.49.312.4
CenterNet [12]1.929.230.4
CenterNet (Swin) [29]2.535.659.2
CornerNet [19]11.7201232.6
RTMDet [42]1.28.920.8
CentripetalNet [27]14.7206285.7
CGDA (ours)3.634.148.1
Table 4. Paired t-test results on APavg.
Method1st APavg2nd APavg3rd APavgMean Valuet-Valuep-Value
CenterNet45.9245.2646.6645.94−36.837.37 × 10−4
CGDA55.4155.6356.3455.79
Table 5. The effect of different types of regression losses.
Loss TypeAPavgAP50%AP75%
IoU48.169.151.8
GIoU52.675.355.3
DIoU53.172.056.3
CIoU52.774.158.1
EIoU52.571.556.3
SIoU53.971.359.3
Table 6. The influence of different numbers of dynamic attention blocks.
APavgAP50%AP75%
154.772.560.4
253.772.256.8
453.270.757.2
655.872.958.4
855.373.456.9
1054.671.359.8
Table 7. Ablation studies on TTPLA-tower.
Two-Stage Detection HeadDynamic AttentionSIoU LossAPavgAP50%AP75%
45.959.049.7
48.169.151.8
49.265.052.2
53.971.359.3
52.372.556.8
55.872.958.4
Disclaimer/Publisher’s Note: The statements, opinions and data contained in all publications are solely those of the individual author(s) and contributor(s) and not of MDPI and/or the editor(s). MDPI and/or the editor(s) disclaim responsibility for any injury to people or property resulting from any ideas, methods, instructions or products referred to in the content.

