Abstract
In recent years, the passenger flow volume of conventional transit in major cities has declined steadily. Ground public transit often suffers from congestion during rush hours caused by frequent stops (e.g., conventional fixed-route buses) or excessively high operating costs (e.g., demand-responsive transit). While rail transit offers reliable service with dedicated right-of-way, its high capital and operational costs pose challenges for integrated planning with other transit modes. The joint design of rail, conventional buses, and DRT remains underexplored. To bridge this gap, this paper proposes and analyses a new hybrid transit system that integrates conventional transit service with demand-adaptive transit (DAT) to feed urban rail transit (the system hence called hybrid microtransit system). The main task is to optimally design the hybrid microtransit system to allocate resources efficiently across different modes. Both the conventional transit and DAT connect passengers from their origin/destination to the rail transit stations. Travelers can choose one of the services to access urban rail transit, or directly walk. Accordingly, we divide the service area into three parts and compute the user costs to access rail transit by conventional transit and DAT. The optimal design problem is hence formulated as a mixed integer program by minimizing the total system cost, which includes both the user and agency (operating) costs. Numerical experiment results demonstrate that the hybrid microtransit system performs better than the system that only has conventional transit to feed under all demand levels, achieving up to a 7% reduction in total system cost. These may provide some evidence to resolve the “first-mile” challenges of rail transit in megacities by designing better conventional transit and DAT.
1. Introduction
1.1. Motivation
With the acceleration of urbanization, urban clusters expand rapidly. Rail transit, with its large capacity, fast speed, and minimal delay, is well suited for medium and long-distance travel for urban residents. Therefore, many cities have launched large-scale rail transit construction projects, and the demand for rail transit continues to rise [1]. However, due to the high costs associated with its construction, operation, and maintenance, urban rail transit alone cannot fully meet travelers’ public transport needs. One key challenge faced by urban rail transit is the “first- and last-mile” problem, which refers to the distance between the metro station and the passengers’ trip origin or destination. The first- and last-mile can be covered by walking, bike sharing, cabs, private cars, etc. Some of these options are weather-sensitive, costly, or limited in accessibility. In contrast, both conventional bus services and demand-adaptive transit (DAT) offer more cost-effective and reliable alternatives for first- and last-mile connections. Thus, integrating these two transit services to provide enhanced transfer connections and feeder systems exhibits strong potential in improving the overall efficiency and accessibility of urban transit systems.
For conventional transit, due to increasing competition from expanding urban rail transit and the resulting significant decline in ridership, conventional transit operators must make timely adjustments to their service planning and operational strategies. This involves considering the impact of the metro network on ground transit network and focusing on the optimization of low-ridership routes or sections. Therefore, the service function of conventional transit is repositioned as a feeder mode for rail transit, which is beneficial to promote the operational conditions of ground transit. As a result, rail transit and conventional transit will be able to better take their respective advantages.
For demand-adaptive transit, characterized by its flexibility—no fixed schedules, routes, or stops—the likelihood of vehicle detours increases as the service area expands, leading to longer in-vehicle travel times and decreased passenger satisfaction. In high-demand areas, insufficient vehicle capacity can result in longer response times and extended passenger waiting periods. Demand-adaptive transit thus delivers poor services in high demand areas. We caution that the integration between demand-adaptive transit and conventional transit can readily cover the weakness of each other.
In summary, this study proposes a hybrid microtransit system which integrates conventional transit and demand-adaptive transit to feed urban rail transit for big cities. This is in response to the fact that neither conventional nor demand-adaptive transit can, in a cost-efficient manner, resolve the first- and last-mile problem of rail transit on its own. An optimal design model is thereby needed to optimize the microtransit system. Such integration could provide implications to enhance public transit services.
1.2. Problem Description and Contributions
The above analysis shows that the problem under study pertains to the optimal design of a hybrid transit network, which involves two key components. One focuses on the service modes, including the relationships between different services and the operational modes in which transit vehicles provide services to passengers. (While various transit modes coexist within the system, they operate independently in terms of routing, scheduling, and dispatching. The integration considered in this paper focuses on system-level design aspects such as coordinated resource allocation and service area partitioning, rather than real-time operational coordination.) Another is the optimal network structure through mathematical modeling. To address the first problem, it is necessary to construct a foundational transit network model in the context of the urban morphology. This involves defining the concepts and terminologies relevant to the system, as well as their symbolic meanings, while giving the necessary assumptions in order to simplify subsequent mathematical modeling. After that, this study indicates how those transit services are operated in the system and how passengers make route choices during their journeys. This ensures the model aligns closely with real-world travel behaviors and provides a solid basis for effective mathematical modeling and analysis.
In the mathematical modeling section, we construct the objective function which includes all of relevant costs (e.g., user costs and agency costs). Accordingly, we can calculate the optimal results of the system with different parameter values, allowing us to simulate the characteristics of different cities and the travel behaviors of passengers. Based on the modeling result, we could analyze the impact of a variable on the results of the whole system, or compare the cost with alternative transit systems, and identify areas for improvement. By constructing and analyzing the mathematical model, we can gain a deeper understanding of the key factors driving system performance and the extent to which specific aspects have been optimized, and the remaining potential for further improvements. These insights can provide a reference point for the construction of real-world hybrid public transit systems.
An urban public transit system often consists of two overlapping and interweaving single-mode networks: (1) a local bus network that features dense networks of lines and stops, low speed, and relatively low operating costs and (2) an express transit network characterized by high speed and capacity but sparsely spaced due to the high costs, which is often operated by Bus Rapid Transit (BRT) or rail transit. Many cities worldwide, such as Beijing, London, San Francisco (combining buses with metro systems), and Bogota (integrating buses with BRT), exemplify this bimodal transit structure. These interwoven local and express networks furnish multiple route options, so that patrons with distinct OD can choose the routes that best suit their needs. For example, short-distance travelers can travel by local lines only, while long-distance travelers can take the local service as a feeder to access the express lines.
Therefore, how to optimize the design of multiple modes of public transit in the same network is a pressing issue. Through the construction of service mode and mathematical modeling, we can clearly explain the operation of the hybrid microtransit system and then substitute specific parameters, i.e., numerical analysis can be carried out to verify the application value of the system.
The structure of the paper is organized as follows. Section 2 is the literature review. Section 3 presents the proposed hybrid microtransit system. In the first subsection of Section 3, it explains the specific service mode of rail transit, conventional transit, and demand-adaptive transit vehicles; the second subsection derives the formulation of the optimal design problem. Section 4 presents results of numerical experiments. Section 5 concludes the paper with a summary of main findings and suggestions for future research.
2. Related Work
Studies on transit network optimization can be divided into two main categories: discrete models and continuum models (see the detailed reviews by [2,3,4,5]). Based on previous studies, the continuum models are often used to examine the optimal network designs for a wide range of operating conditions and to explore general insights into the cause-and-effect relations between key parameters and the optimal design. Thus, this approach is ideal for examining the fundamental question described above.
As a mode of mass transport, the public transport system performs more effectively in areas with dense population. However, in areas with low demand or when people’s willingness to take public transport decreases, it will lead to higher operating costs. Therefore, various forms of demand-adaptive transit service models are put forward, among which dial-a-ride transit (DART) is the most widely studied [6,7]. The high-coverage point-to-point transit system (HCPPT) proposed by Cortés and Jayakrishnan [8] can be viewed as a variant of the zone-based system of Stein [6]. Instead of using line-haul buses to connect zones, HCPPT connects them with the same vehicles that make pickup and delivery trips to eliminate the outbound transfer. However, using the same vehicle to collect passengers and provide line-haul travel may also lead to the use of a large number of small vehicles and extended in-vehicle time at low speeds, especially for high demand levels.
To address the challenges of the “first- and last-mile” problem while balancing the high operational costs associated with point-to-point services, many previous studies have focused on integrating conventional and flexible transit operations. Malucelli et al. [9] and Crainic et al. [7] propose a demand adaptive system (DAS) that combines a fixed-route service (FRS) with a restricted DART [9,10]. In this system, DART operates under constraints requiring vehicles to adhere to schedules at mandatory stops, which serve as designated transfer points. Chen proposed and analyzed a new bus system (DAPL-HT) that combines conventional transit with demand-adaptive transit [11]. The demand-adaptive vehicles are used as a feeder between the passenger’s origin/destination and the conventional bus stop and operate in parallel with its paired conventional bus routes. Compared to previous zone-based hybrid transit systems, pairing fixed-route and demand-adaptive lines simplifies the complexity of on-demand routing, because demand-adaptive vehicles can follow a more predictable path and can be dispatched in coordinated with the headway of fixed-service lines. Meanwhile, bus operators can easily adjust to respond to changes in demand by reallocating vehicle resources between conventional and demand-responsive buses to improve operational efficiency. They also proposed the same model in radial route structure [11]. Fan proposes a bimodal transit network consisting of conventional buses and rail transit based on a square grid network structure and provided multiple route options for travelers [12]. This allows travelers with different O-D characteristics to choose the route that best suits their needs.
In addition, Song constructs a two-layer planning model for the last-mile service blind spot of rail transit, considering the characteristics of a micro-circulation bus and rail transit [13]. Yuan studies the route optimization model of demand-adaptive transit that feeds into rail transit, analyzing the rules of station location design and elaborating on the connection mode between the rail transit and feeder transit, as well as the operation rules of demand-adaptive transit [14]. A survey is also conducted to analyze passengers’ willingness to travel at bus stops near rail transit stations. Some key research on the optimal design of a public transit network is shown in the Table 1.

Table 1.
Representative studies on public transit network optimization.
In conclusion, a lot of research has been conducted on the optimization design of a bus network, with optimization modeling under different transit modes, service modes and, line-network structures. In fact, achieving integrated optimization among multiple transit modes is far from straightforward. This complexity arises from the need to consider how changes in the spatial extent of the three types of service areas influence overall system costs and underlying operational mechanisms. Existing studies rarely address these interactions simultaneously at a system level. However, few studies have considered the integrated optimization design of rail transit, conventional transit, and demand-adaptive transit, as defined in this research.
3. Methodology
3.1. Demand and Supply of Hybrid Microtransit Network
3.1.1. Network Configuration
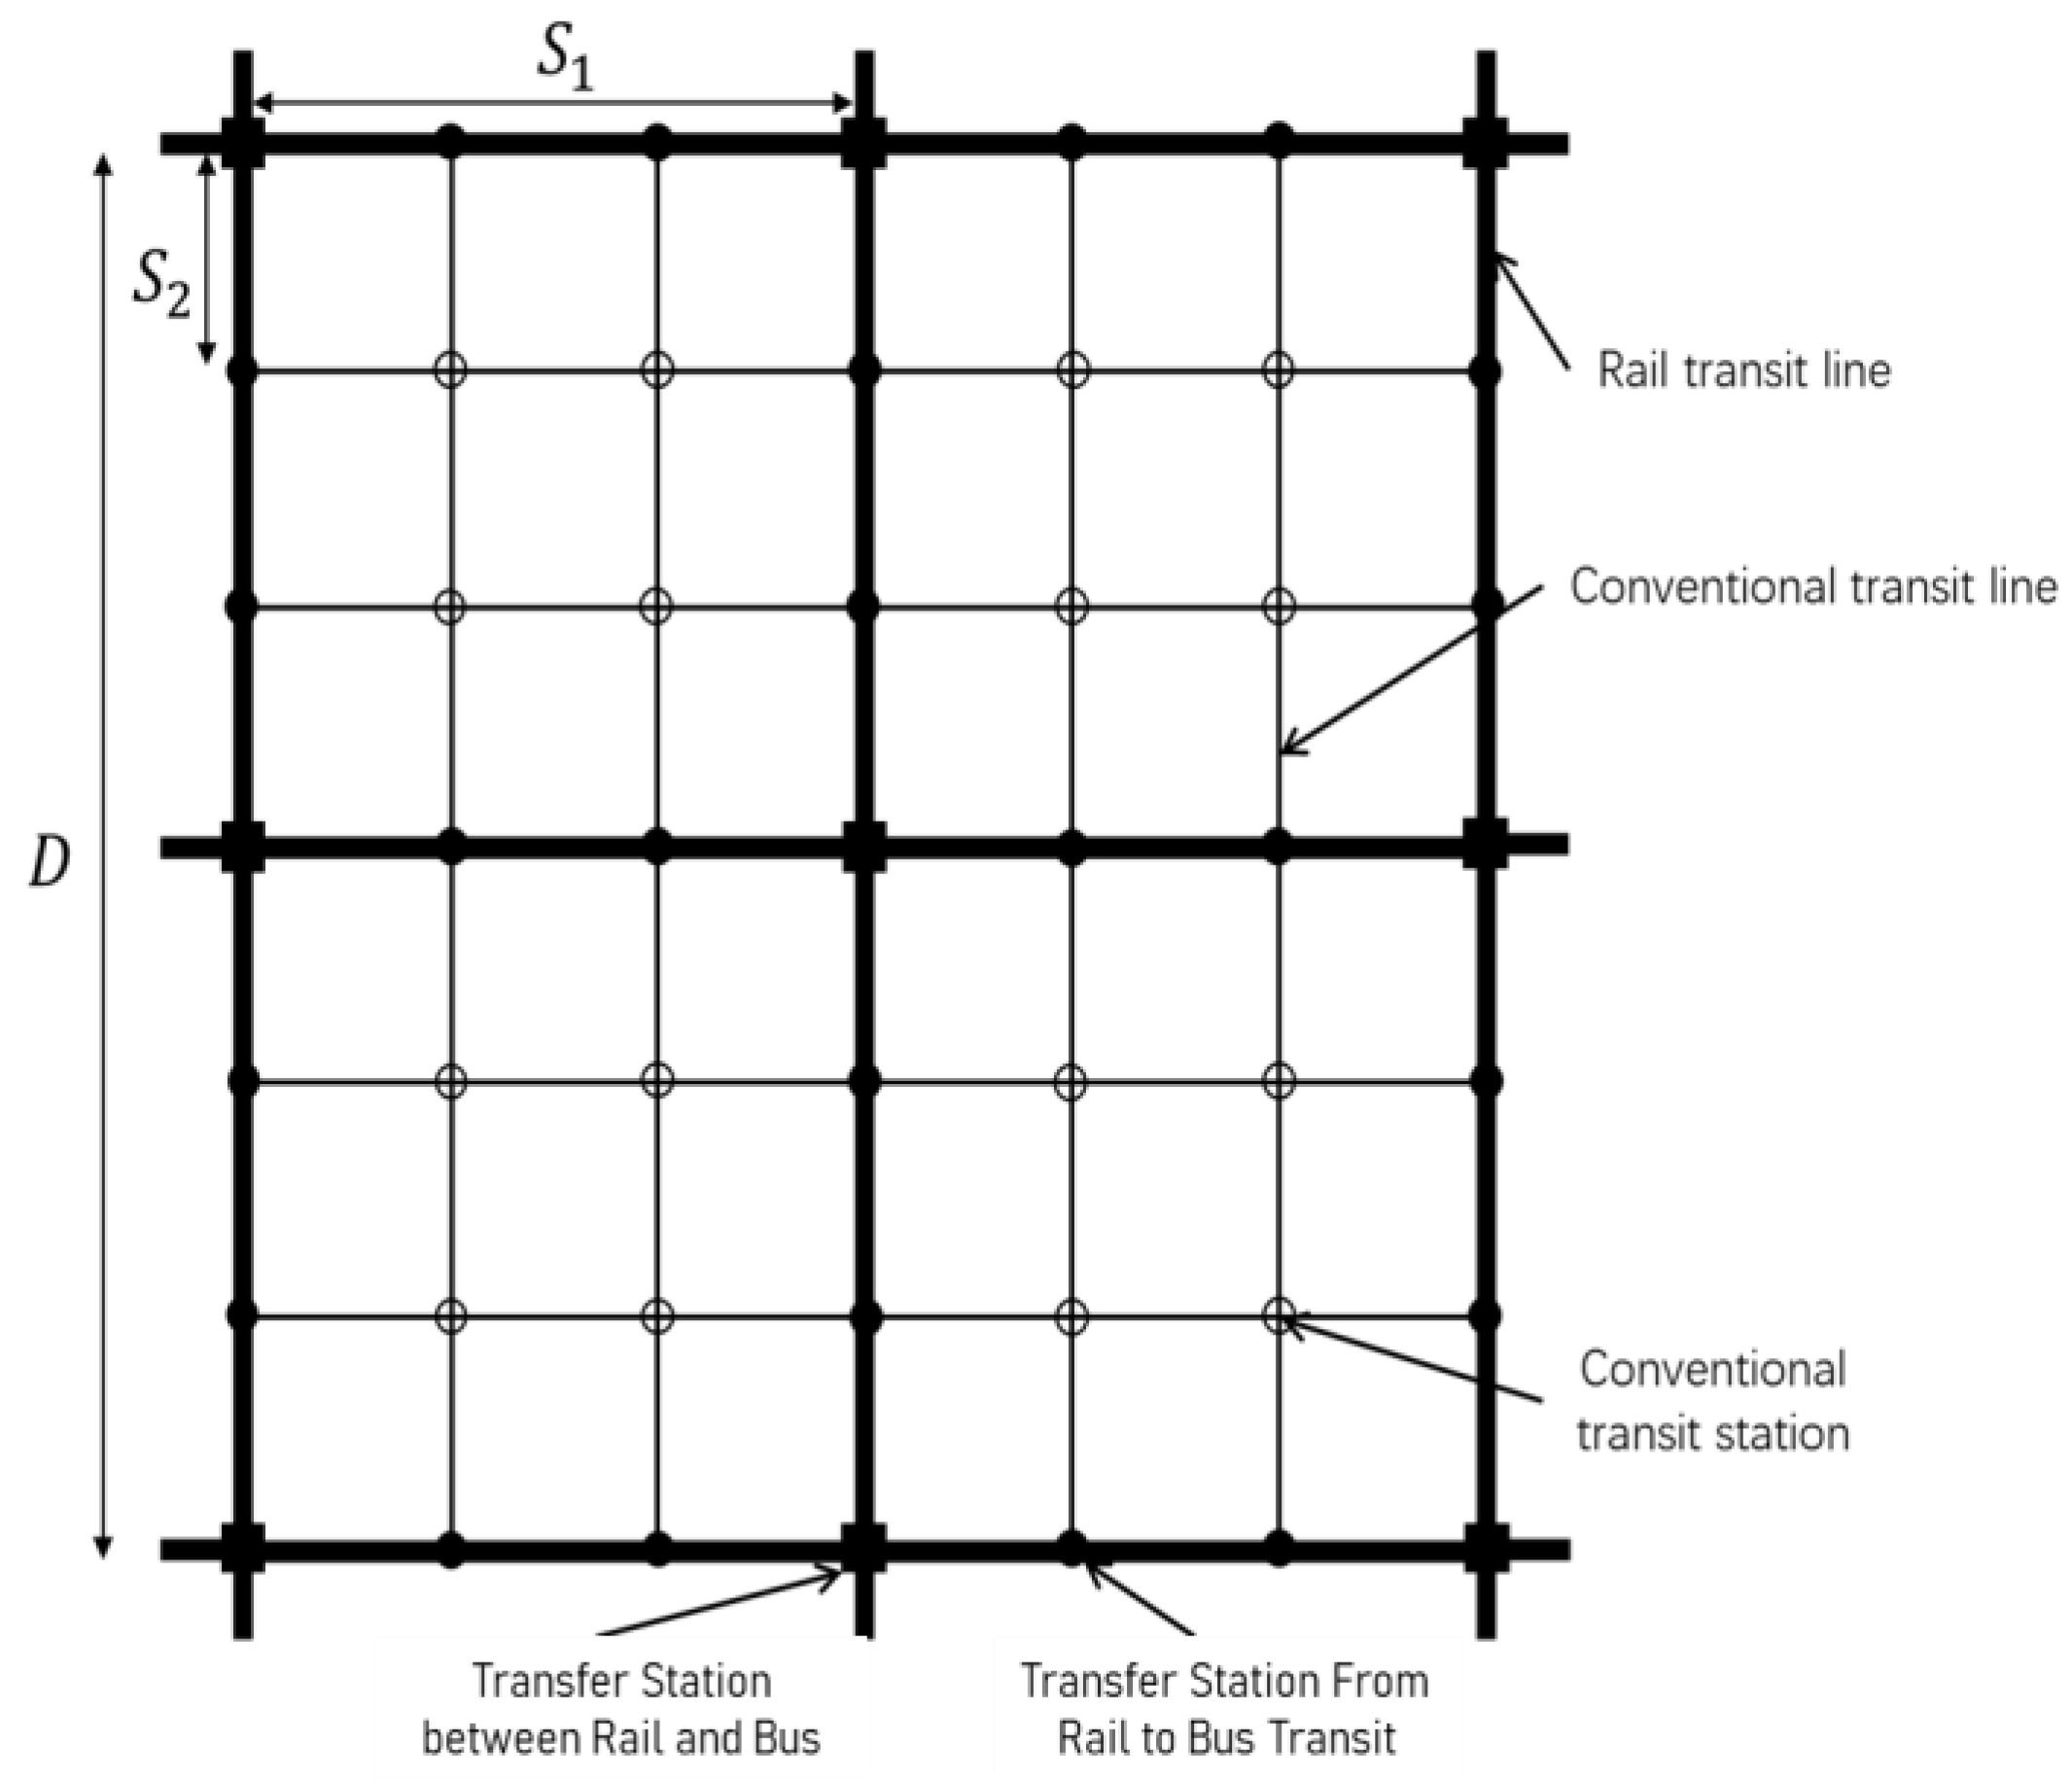
Consider a square service area of side length . The hybrid microtransit system consists of conventional transit and demand-adaptive transit services which both feed urban rail transit. As shown in Figure 1, the urban rail transit lines and conventional transit lines in the service area form a grid network with constant spacing. There are rail transit lines in the service area and conventional transit lines between two adjacent rail transit lines in either north–south or east–west directions. The distances between two adjacent rail transit and two adjacent conventional lines are and , respectively. Both rail transit and conventional transit travel along fixed routes and make pre-scheduled stops. The service area generates passenger trips per hour per unit area. The trip origins and destinations are uniformly and independently distributed in the service area according to a homogeneous spatial Poisson process [18]. For the reader’s convenience, Table 2 lists the important notations used in the paper.
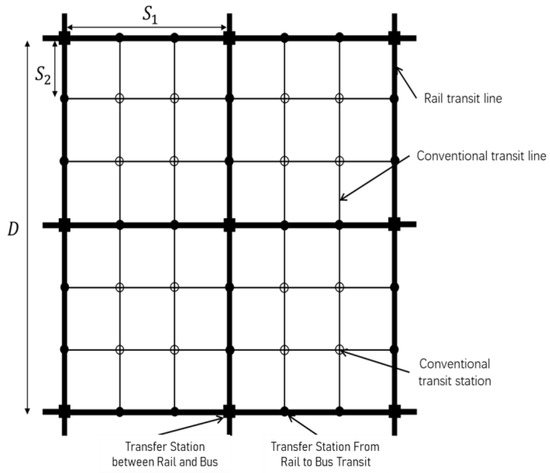
Figure 1.
Overview of structured system.

Table 2.
Description of notations used in the paper.
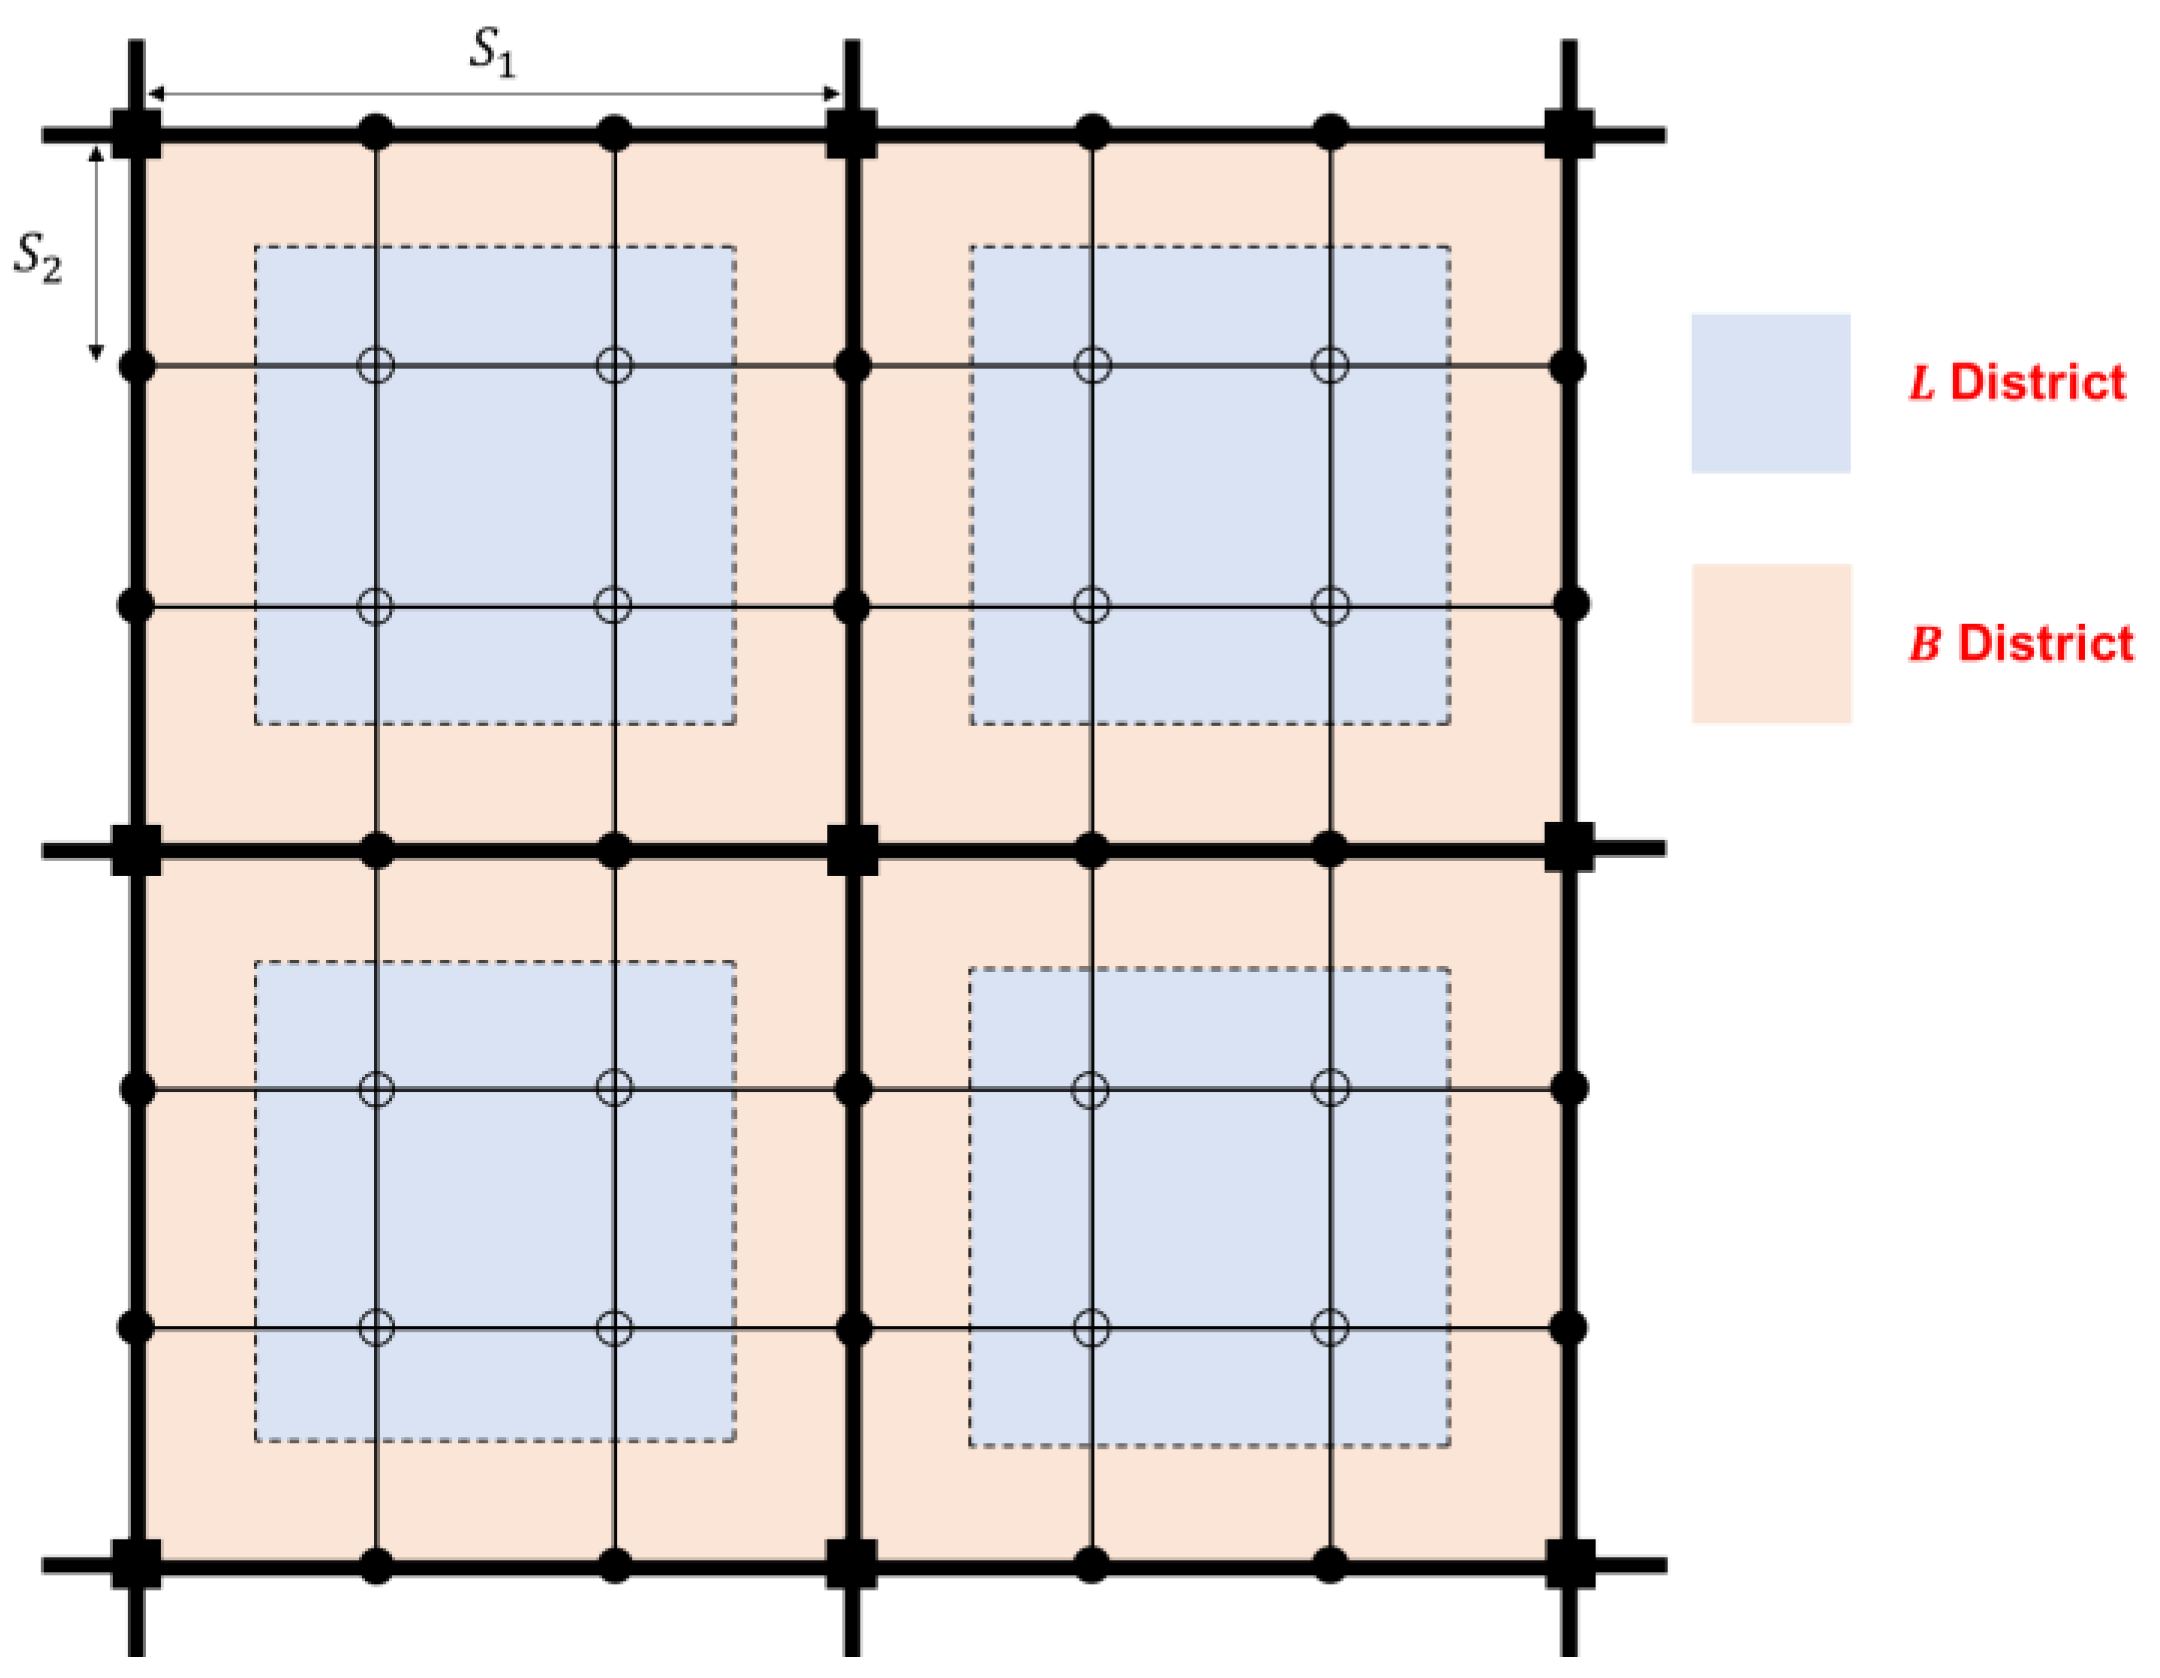
The whole service area is divided into a demand-adaptive service area ( district, which is represented in orange) and conventional transit service area ( district, which is represented in blue); see Figure 2. The square area surrounded by adjacent rail transit lines is denoted as the unit service area. As an example, there are four-unit zones in Figure 2.
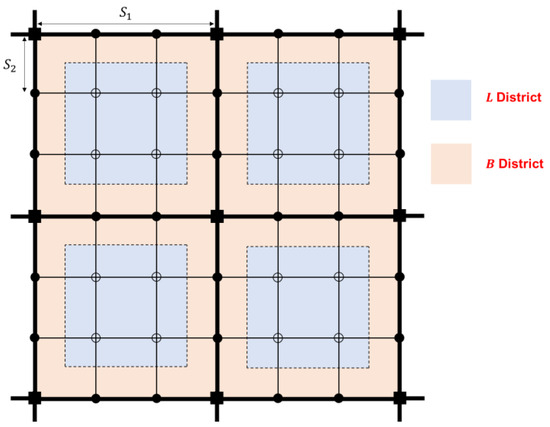
Figure 2.
The division of service areas.
To simplify the analysis, the following assumptions are introduced to define how passengers plan their trips [18].
Assumption 1.
If the access distance is less than (where is a decision variable), passengers cannot use the demand-adaptive service and have to walk to the rail transit station; otherwise, passengers always request the demand-adaptive service in districts. Note that both the maximum walking distance and the access distance determined by transit coverage density are optimized by the model, rather than modeling passengers’ detailed choices in the macrodesign. Similar assumptions have been applied in numerous previous studies [17,19,20].
Assumption 2.
Passengers always use the stops closest to their origin and destination.
Assumption 3.
Based on Assumption 2, passengers travel between rail transit stops or conventional transit stops with the fewest transfers and the most direct route.
Assumption 4.
The conventional transit only operates within a single unit, which means each conventional transit vehicle does not cross rail lines and barely serves long-distance trips.
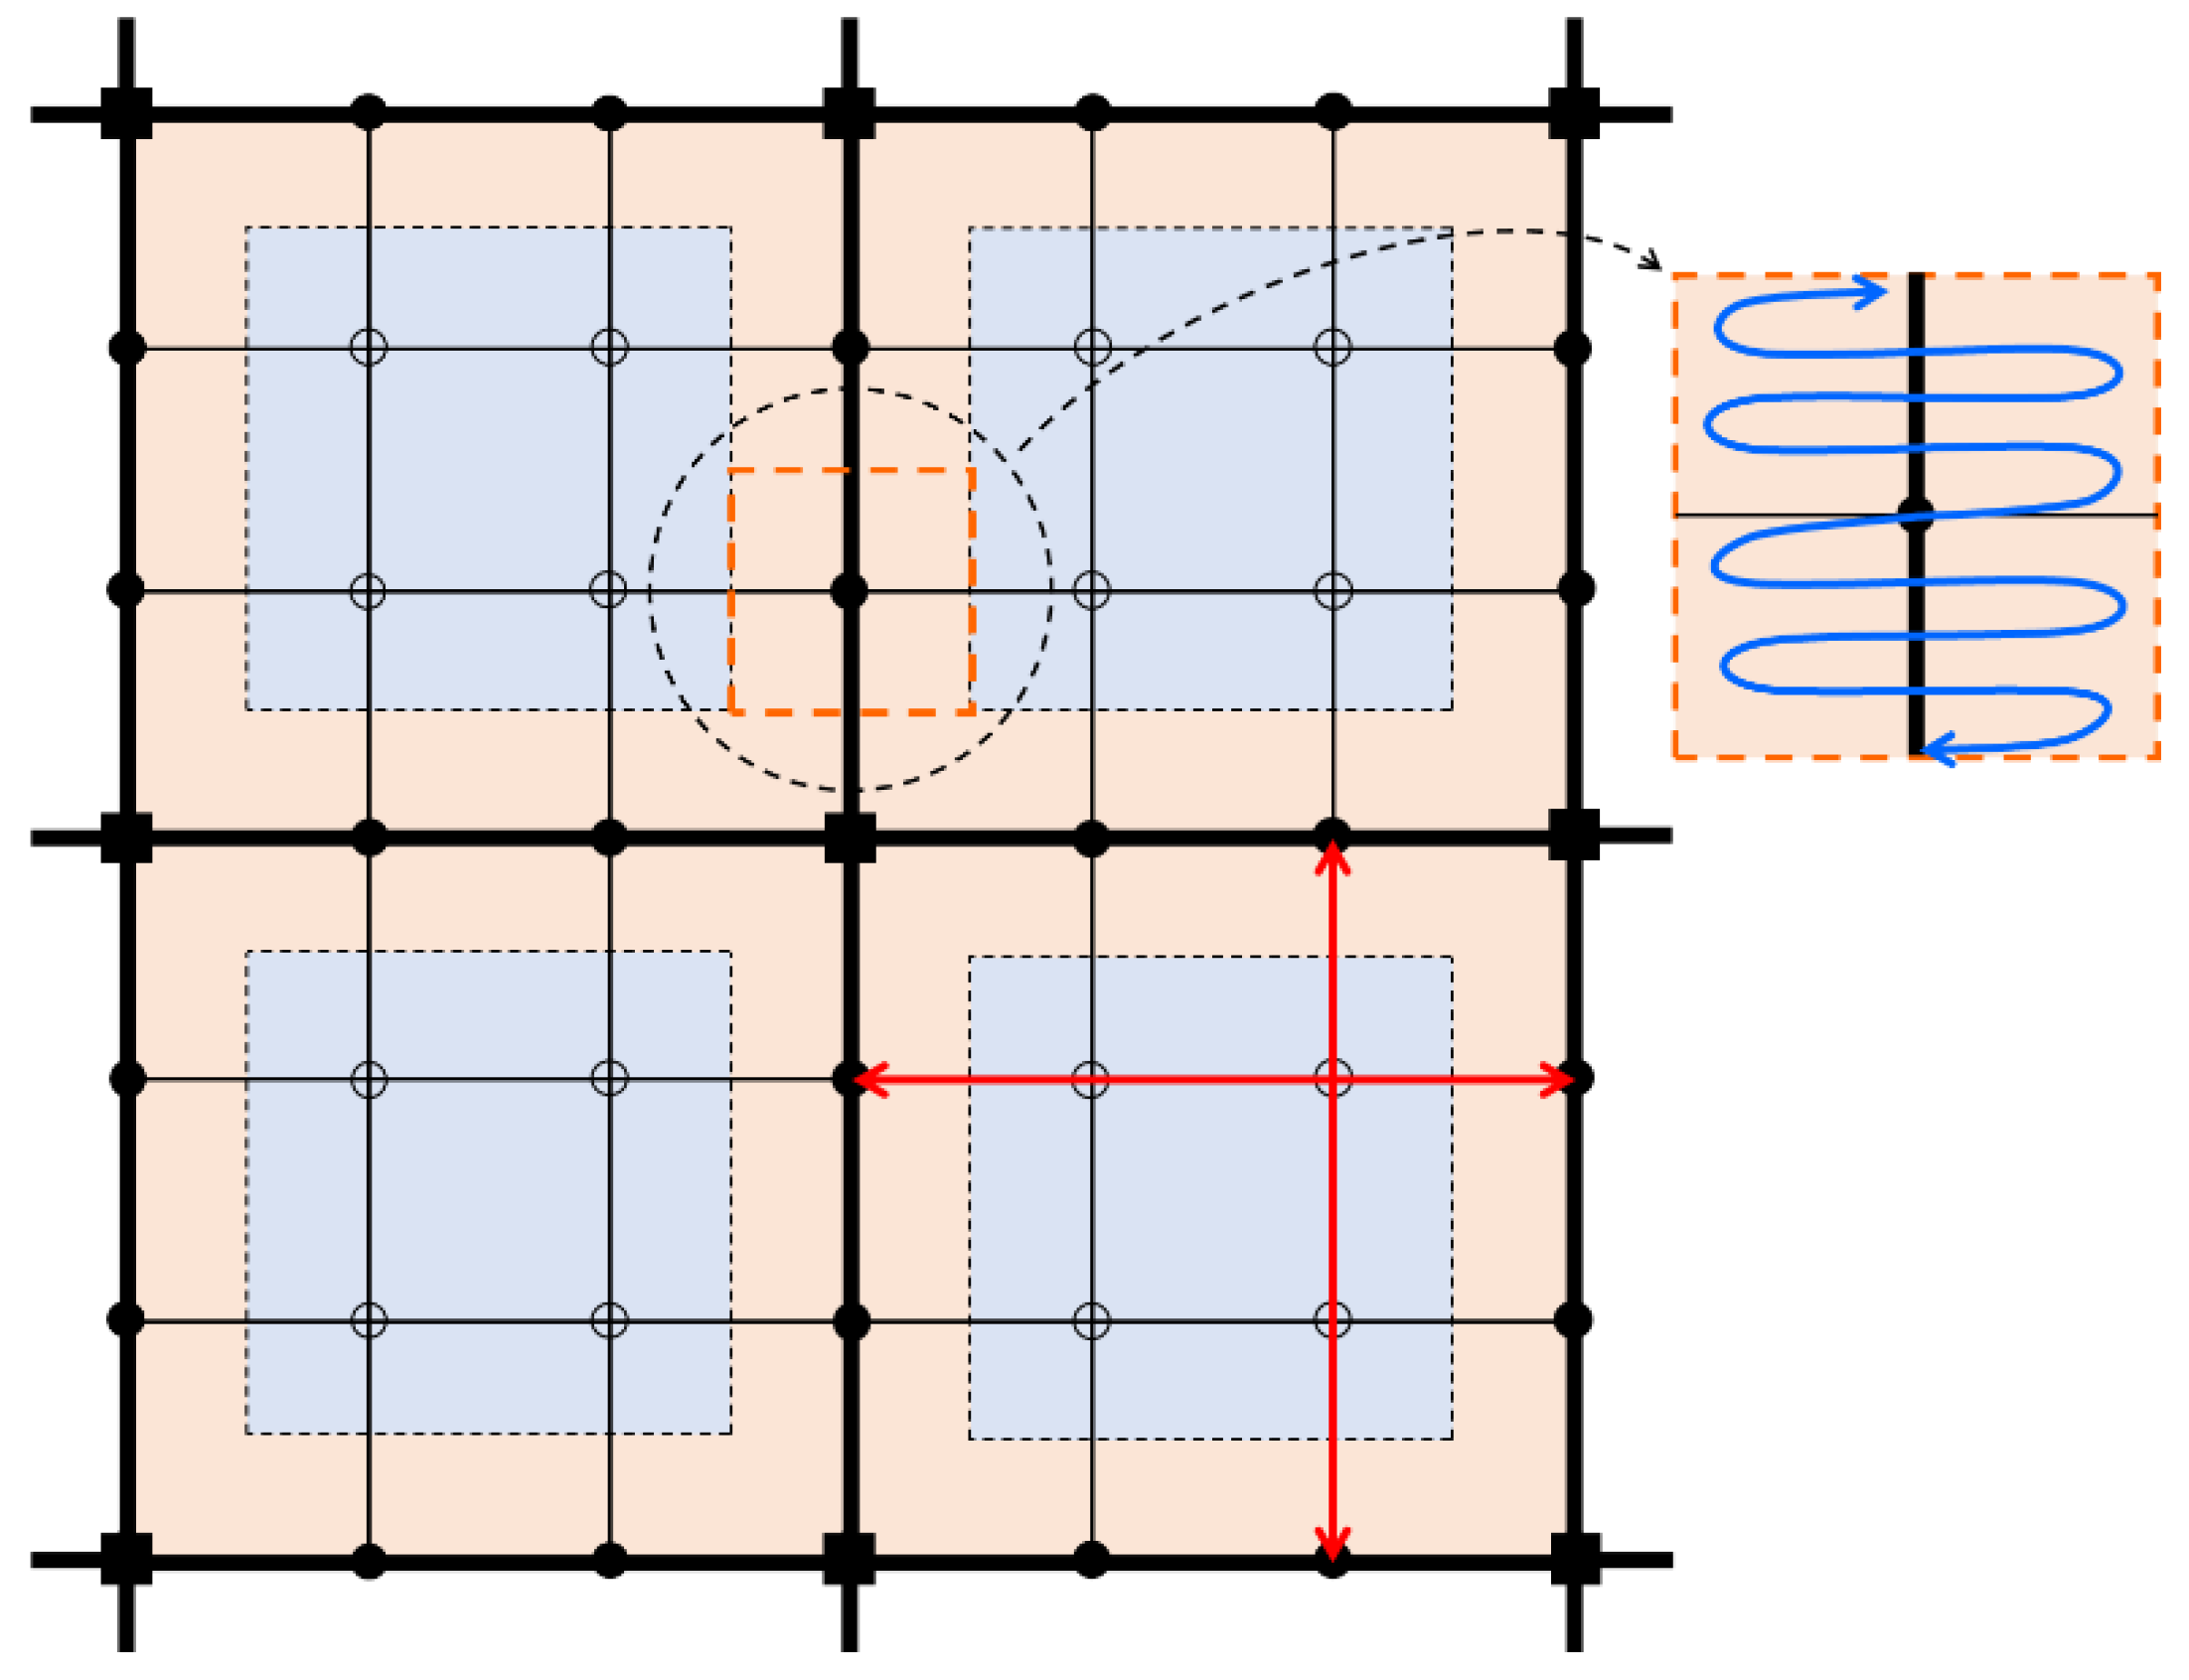
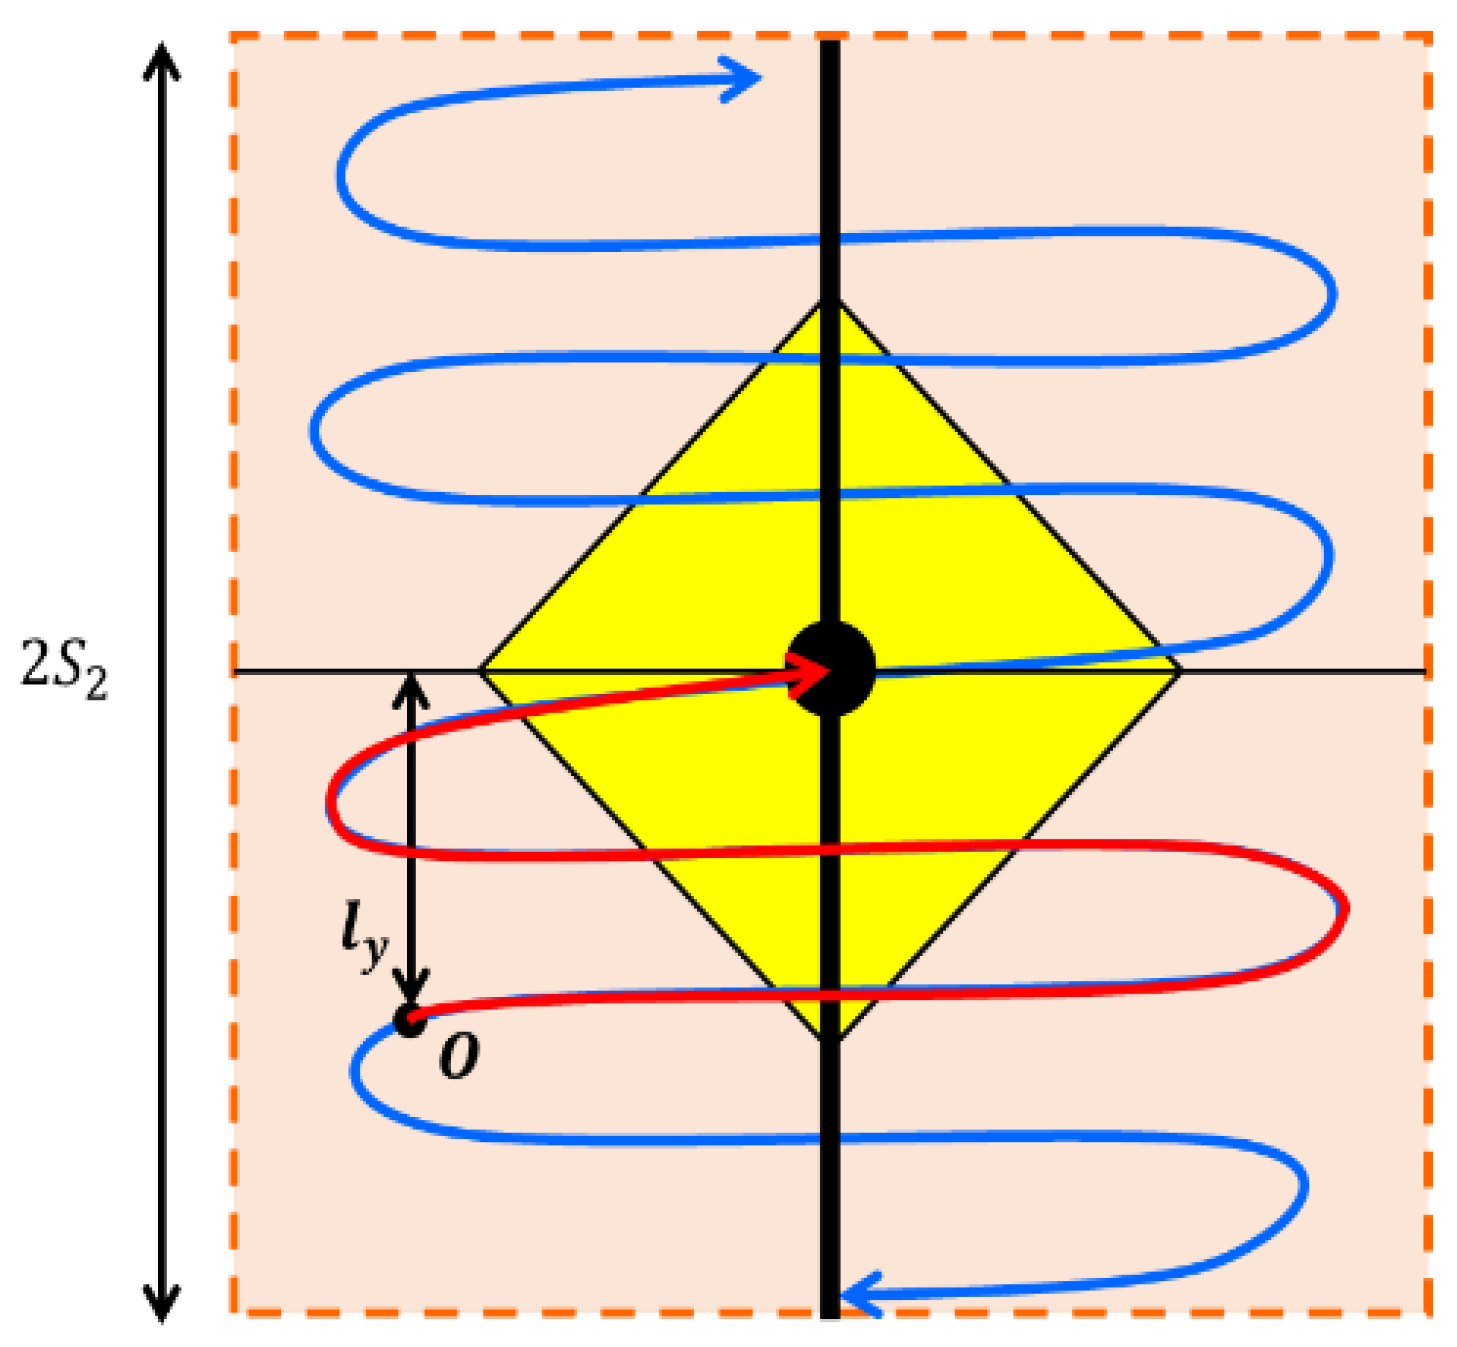
Demand-adaptive transit serves within the catchment area of the rail transit station (Figure 3). The vehicle makes and executes an optimal routing plan to satisfy all requests it received, and it always returns to the same station to start a new service cycle afterwards. The exact trajectory of the vehicle depends on the requests and route planning. The approximate trajectory of demand-adaptive transit vehicle is shown by the curved trajectory in Figure 3.
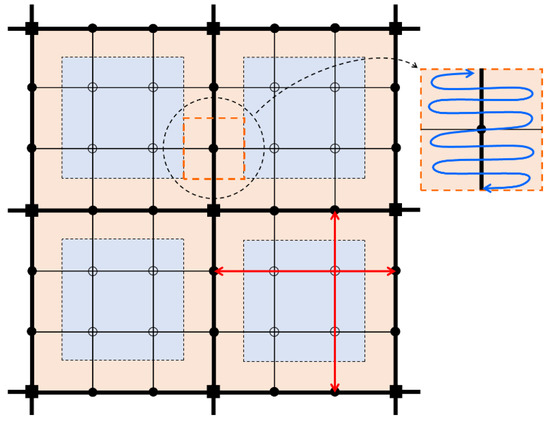
Figure 3.
Demand and supply of conventional transit and demand-adaptive transit.
3.1.2. Passenger Route Choices
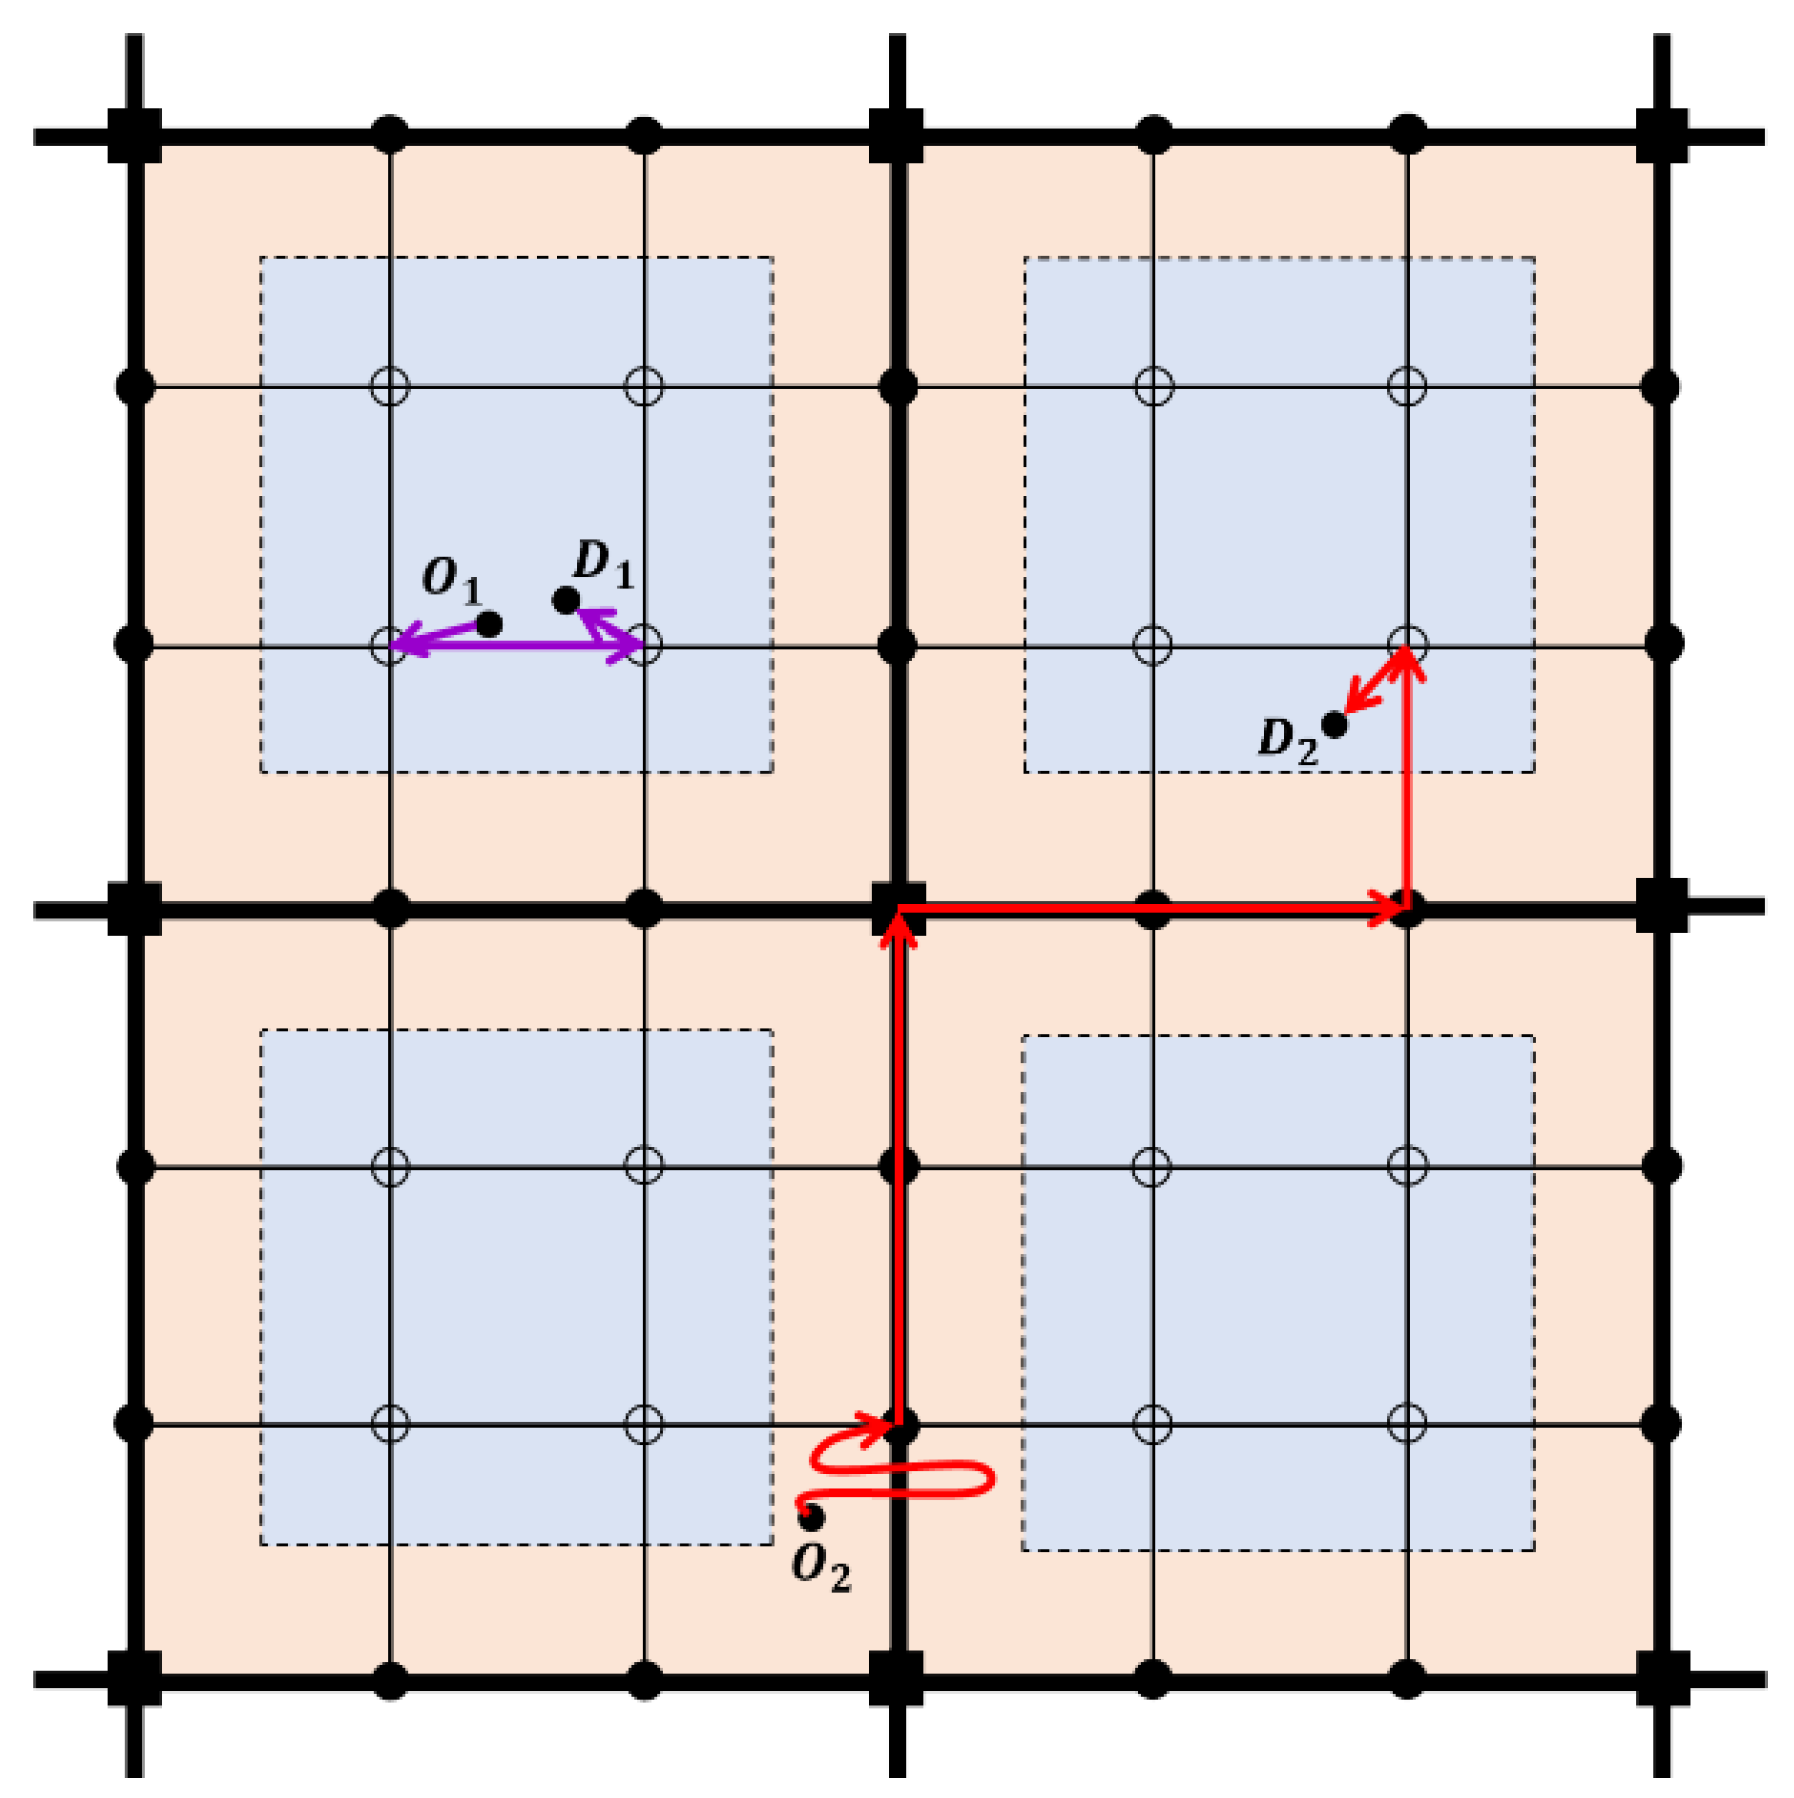
From the perspective of passengers, we divide passenger trips into two categories: those traveling within a unit zone and those traveling between unit zones (the origin and destination belong to two different unit zones). For passengers traveling within a unit zone, they need to walk to the nearest conventional transit stop, travel by conventional transit to the stop closest to destination, and then walk to the destination. For example, the route from to is shown in Figure 4. For inter-zone passengers, the location of the origin and destination determines which rail transit stations they will choose. If their origins or destinations are located in district, they need to walk to the nearest conventional transit stop and then take conventional transit to the rail transit station. If their origin or destinations are located in district, they need to take demand-adaptive transit to the rail transit station. For example, the route from to is shown in Figure 4.
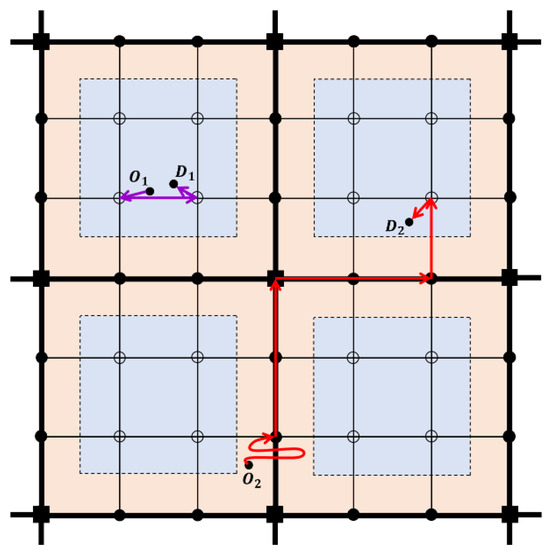
Figure 4.
Examples of passenger travel routes.
The route of inter-zone passengers is divided into three parts: front part (from the origin to the origin rail transit station), middle part (rail transit), and after part (from the destination station to the destination). We set to represent “trip segments by rail transit”, for trip segments by demand-adaptive transit, for trip segments by conventional transit, and for trip segments to/from the rail transit station. Then, we define a travel route in the form of “front-end feeder–rail transit–back-end feeder”. For example, “ means that a passenger takes demand-adaptive transit from the origin to the rail transit station, travels by rail transit, takes conventional transit to the nearest conventional transit stop, and finally walks to the destination. All possible travel routes for passengers are summarized in Table 3.

Table 3.
All travel routes for passengers.
3.2. Optimal Design Problem
The design problem aims to determine the optimal value of decision variables, namely, the number of rail lines , conventional lines between two adjacent rial lines , the headway of the rail lines , the headway of the conventional lines , the headway of the demand-adaptive lines , and the parameter that determines the maximum walking distance , so that the total system cost is minimized. The total system cost consists of two components: agency and user costs. A couple of analytical results must be established first before these costs can be estimated.
We first examine the percentage of passengers traveling within a unit zone, , which also means their origins and destinations are located in the same unit. Accordingly, denotes the percentage of passengers traveling between different units. Thus, we have
For inter-zone passengers, the percentage of passengers who access the nearest rail station by demand-adaptive transit is , which equals to the proportion of district in a unit zone. The percentage of who need to be fed by conventional transit is , which equals to the proportion of district in a unit zone. Hence, we have
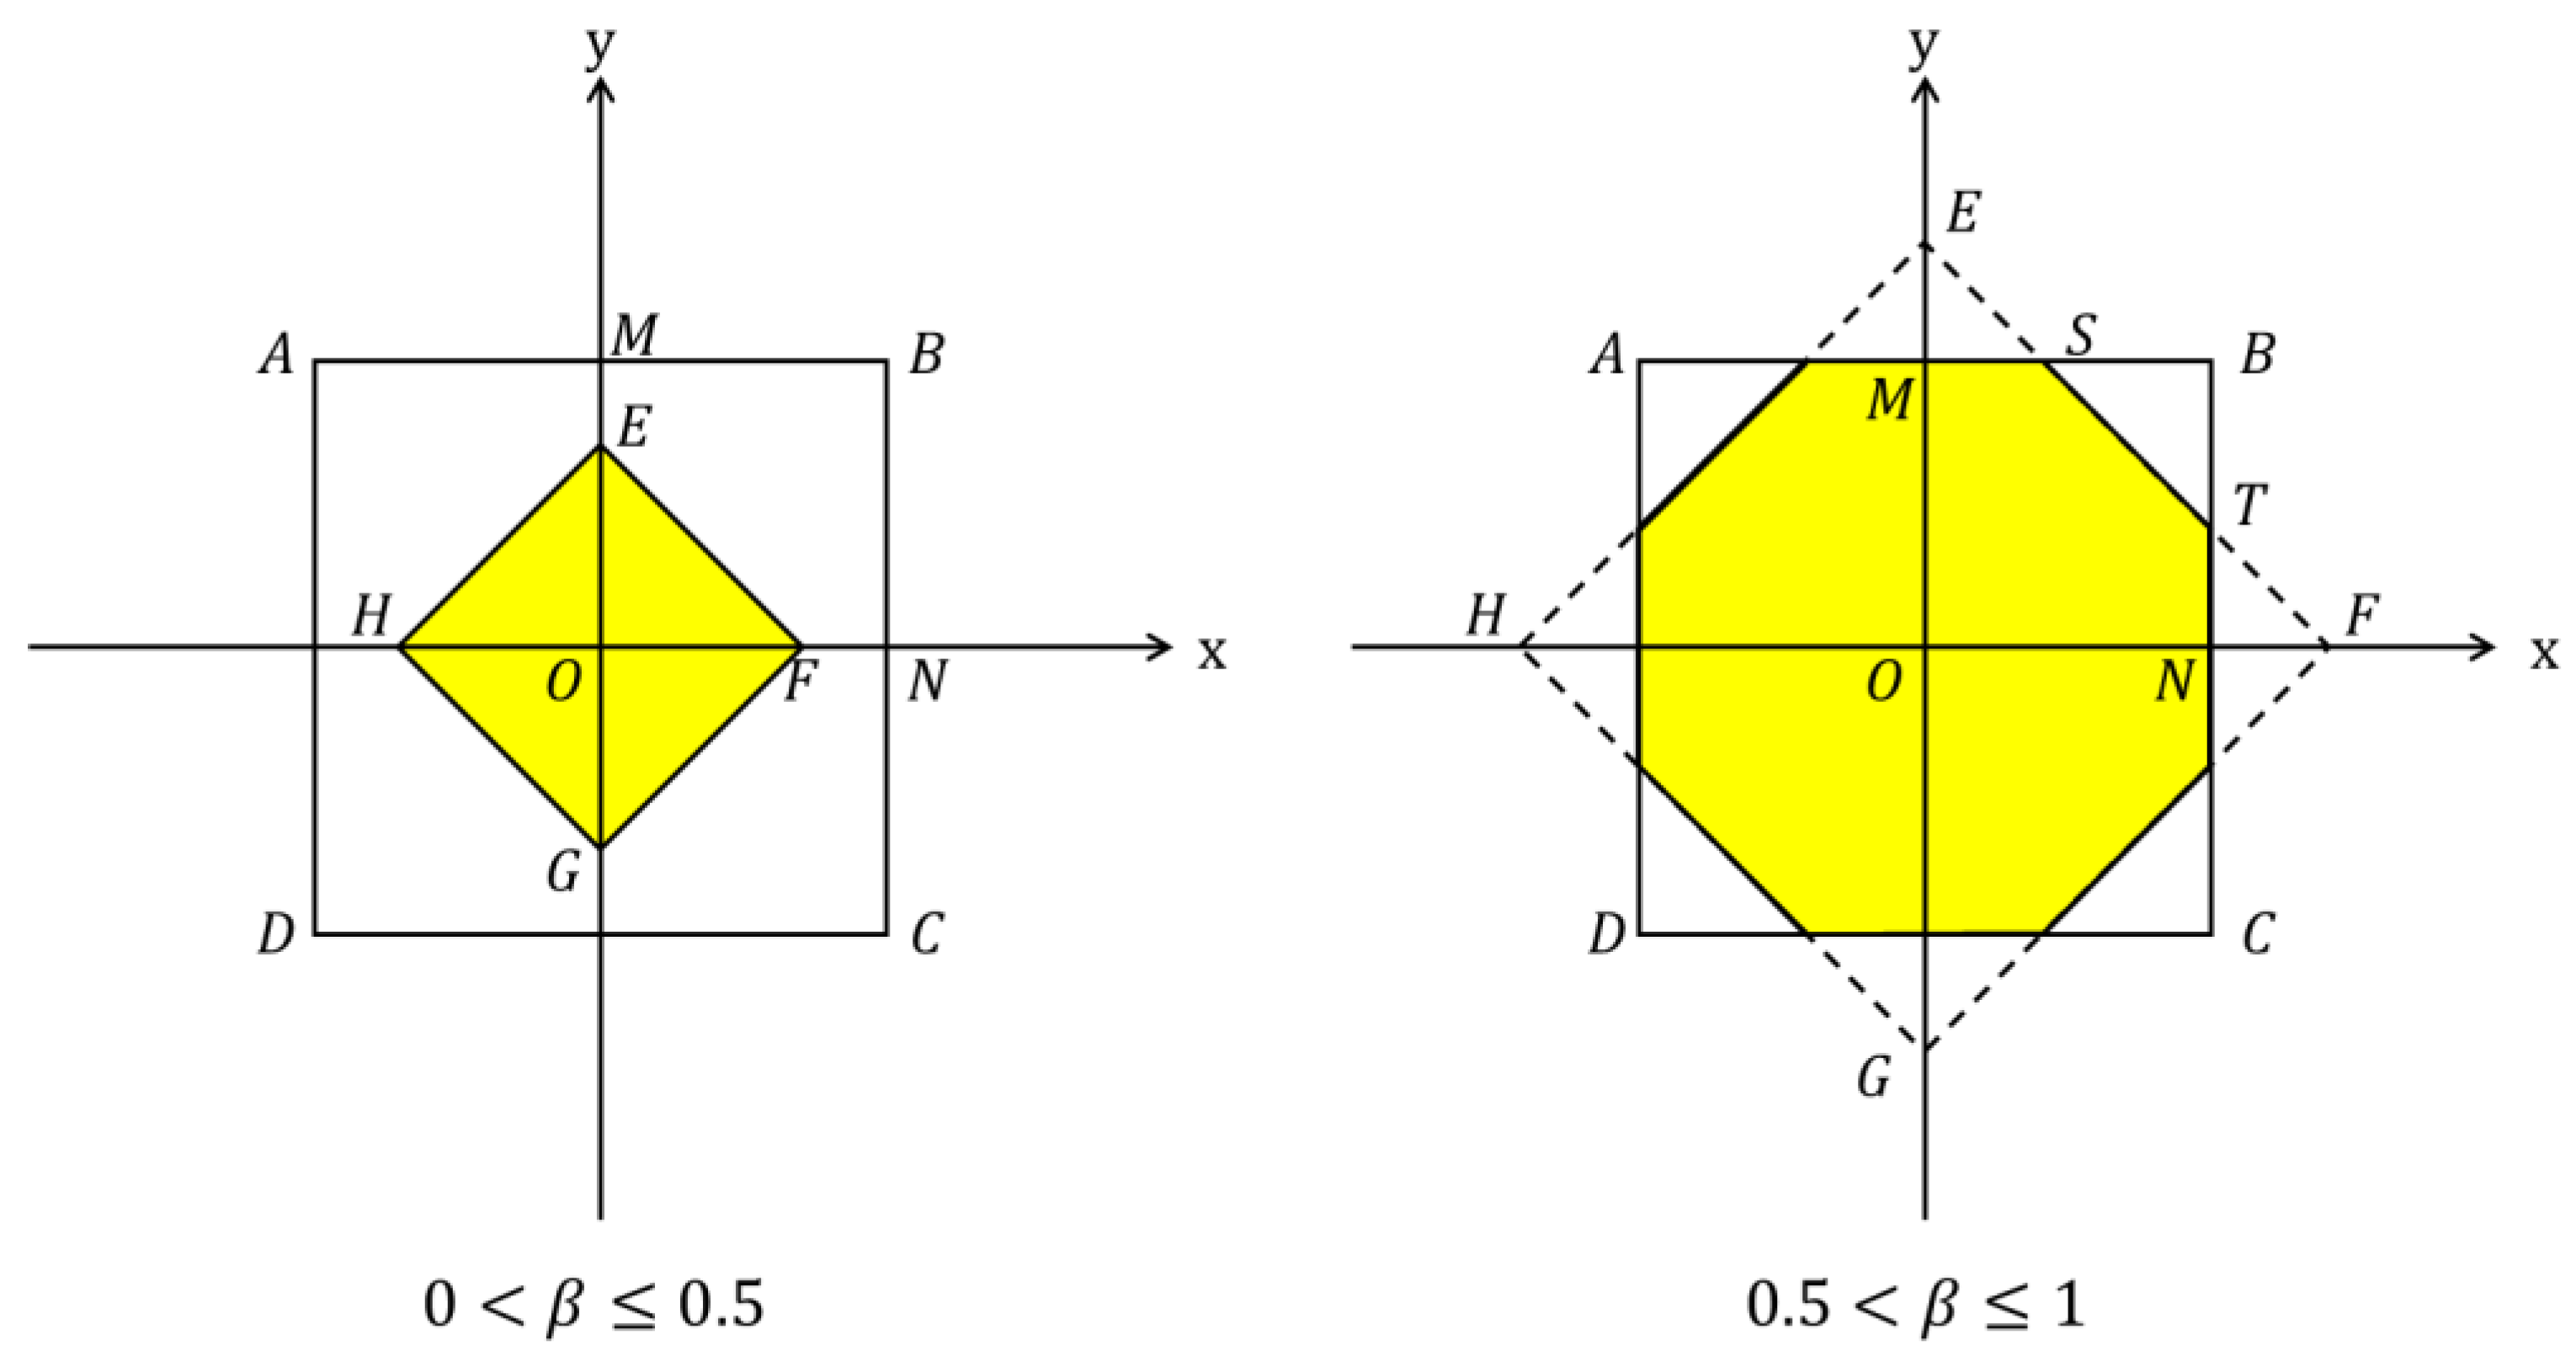
In district, the percentage of passengers who need to walk to the rail station, , is determined by the decision variables and the stop spacing . According to Assumption 1, passengers will choose walking if the walking distance is less than . Therefore, can be approximated by the portion of walking-feasible area around the rail station; see Figure 5 for illustration [11]. In Figure 5, the shaded area represents the walking-feasible areas when and . Thus for , we have
and for , we have
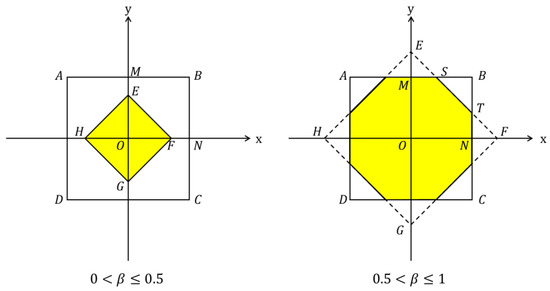
Figure 5.
Illustration of walking area around a rail transit station.
Then, the percentage of passengers who use demand-adaptive service is given by
Based on this, the probability of passengers choosing each route could be calculated and illustrated in Table 4.

Table 4.
The route choice probability of each inter-zone passenger.
We now turn to another important measure: the expected number of transfers for a passenger using the rail transit and conventional transit service. Note that transfers required to connect between different transit service are not included. These can be separately estimated in the transfer penalty section. The number of total lines including both the rail transit routes and conventional transit routes in this system is calculated by .
For the expected number of transfers for inter-zone passengers, no transfer or only one transfer is required when passengers are departing from a transfer station between rail and bus. In contrast, zero, one, or two transfers may be needed when passengers are departing from transfer stations from rail to bus transit. In total, there are stops over the network. The no-transfer probability can be calculated as
where represents the number of total rail stations and reprensents the number of stops that can be reached by any stop with zero transfer
The number of stops for any passenger to reach with one transfer is , and similarly for the number of stops requiring two transfers, see, e.g., Fan et al. [12] for related derivations.
The probability of requiring one transfer for a trip is
The probability of requiring two transfers for a trip is
Hence, the expected number of transfers can be computed as
Then, we can calculate the expected number of transfers for passengers traveling within a unit. These passengers only need to travel by conventional transit. The no-transfer probability can be calculated as
Accordingly, the probability of requiring one transfer for a trip is
Therefore, the expected number of transfers can be computed as
3.2.1. Agency Costs
The agency costs are determined by the expected total vehicle distance traveled per hour of operation, , and the expected total fleet size in operation .
In the system, includes three parts: the expected total vehicle distance traveled per hour of operation by rail transit vehicle , that by conventional buses , and that by demand-adaptive vehicles .
The total vehicle distance is given by the product of the number of lines, the expected travel distance per vehicle per round trip, and the inverse of the vehicle headway [15]. For the rail transit vehicles, the distance per round-trip per line is , and the number of the rail lines is , and thus the expected distance traveled per hour by the rail transit vehicles is
For the conventional buses, the distance per round-trip per line is , and the number of conventional transit lines is , and thus the expected distance traveled per hour by the conventional buses is
For the demand-adaptive vehicles, since each vehicle only serves a fixed area around a rail transit station, the number of lines is . The total distance per round trip includes two components: (i) the necessary longitudinal distance to traverse from north to south and then back forth. Note that, the direction to the destination is generally defined as longitudinal, and the direction to pick up or drop off passengers is defined as lateral: (ii) the lateral distance to pick up and drop off passengers. For the first part, the distance is . For the second part, the expected lateral distance per passenger is , and the passenger trips generated along the route per round trip is . Thus, for demand-adaptive service passengers, the total expected lateral distance caused by picking up or dropping off passengers per round trip can be expressed as (see [21]). Since the demand-adaptive vehicles are required to stop at each station, they incur extra lateral distance. The average lateral distance between demand-adaptive vehicle and the station is simply , and thus the extra lateral distance per round trip is . Therefore, the expected distance traveled per hour by the demand-adaptive vehicles is
The overall expected vehicle distance traveled per hour is then given by
The expected total fleet size in operation includes three parts: the expected total fleet size in operation by rail transit vehicles , that by conventional buses , and that by demand-adaptive vehicles . By definition, the total fleet size is expressed as
where represents the average speed of rail transit vehicle, conventional bus, and demand-adaptive vehicle.
For the rail transit, should include the time consumed in the following: (i) overcoming distance (), in which denotes the cruising speed of rail transit vehicles, and (ii) stopping and collecting passengers () [18]. Since the stop time of rail transit vehicles is not affected by the number of passengers that are picked up and dropped off, the time of collecting passengers is fixed in each rail station. Hence, we have
For the conventional transit, includes three components: (i) overcoming distance (), in which denotes the cruising speed of conventional buses; (ii) stopping (); and (iii) collecting passengers (). Hence, we have
For the demand-adaptive vehicles, includes two components: (i) overcoming distance (), in which denotes the cruising speed of demand-adaptive vehicles, which is assumed to be equal to as demand-adaptive vehicles share a similar model with conventional buses, and (ii) picking up and dropping off passengers . Hence, we have
The required fleet size is then given by .
3.2.2. User Costs for Inter-Zonal Passengers
Walking time
As for walking, passengers are assumed to walk from their origins to the origin railway stations or conventional transit stations and/or from their destination stations to their final destinations. We need to calculate the average distance for two cases ( and ); see Figure 5. Because of the symmetry, we only need to consider the average walking distance when the origins/destinations are in the first quadrant [11]. When , denote the area and as and , respectively. Then, the average walking distance can be calculated as
When , denote the area and as and , respectively; the average walking distance can be calculated as
To derive , we have
where
By solving the above equation, the value of is given by
Then, we have
The expected walking time per passenger is equal to the ratio of walking distance to walking speed. It is simply given by
where
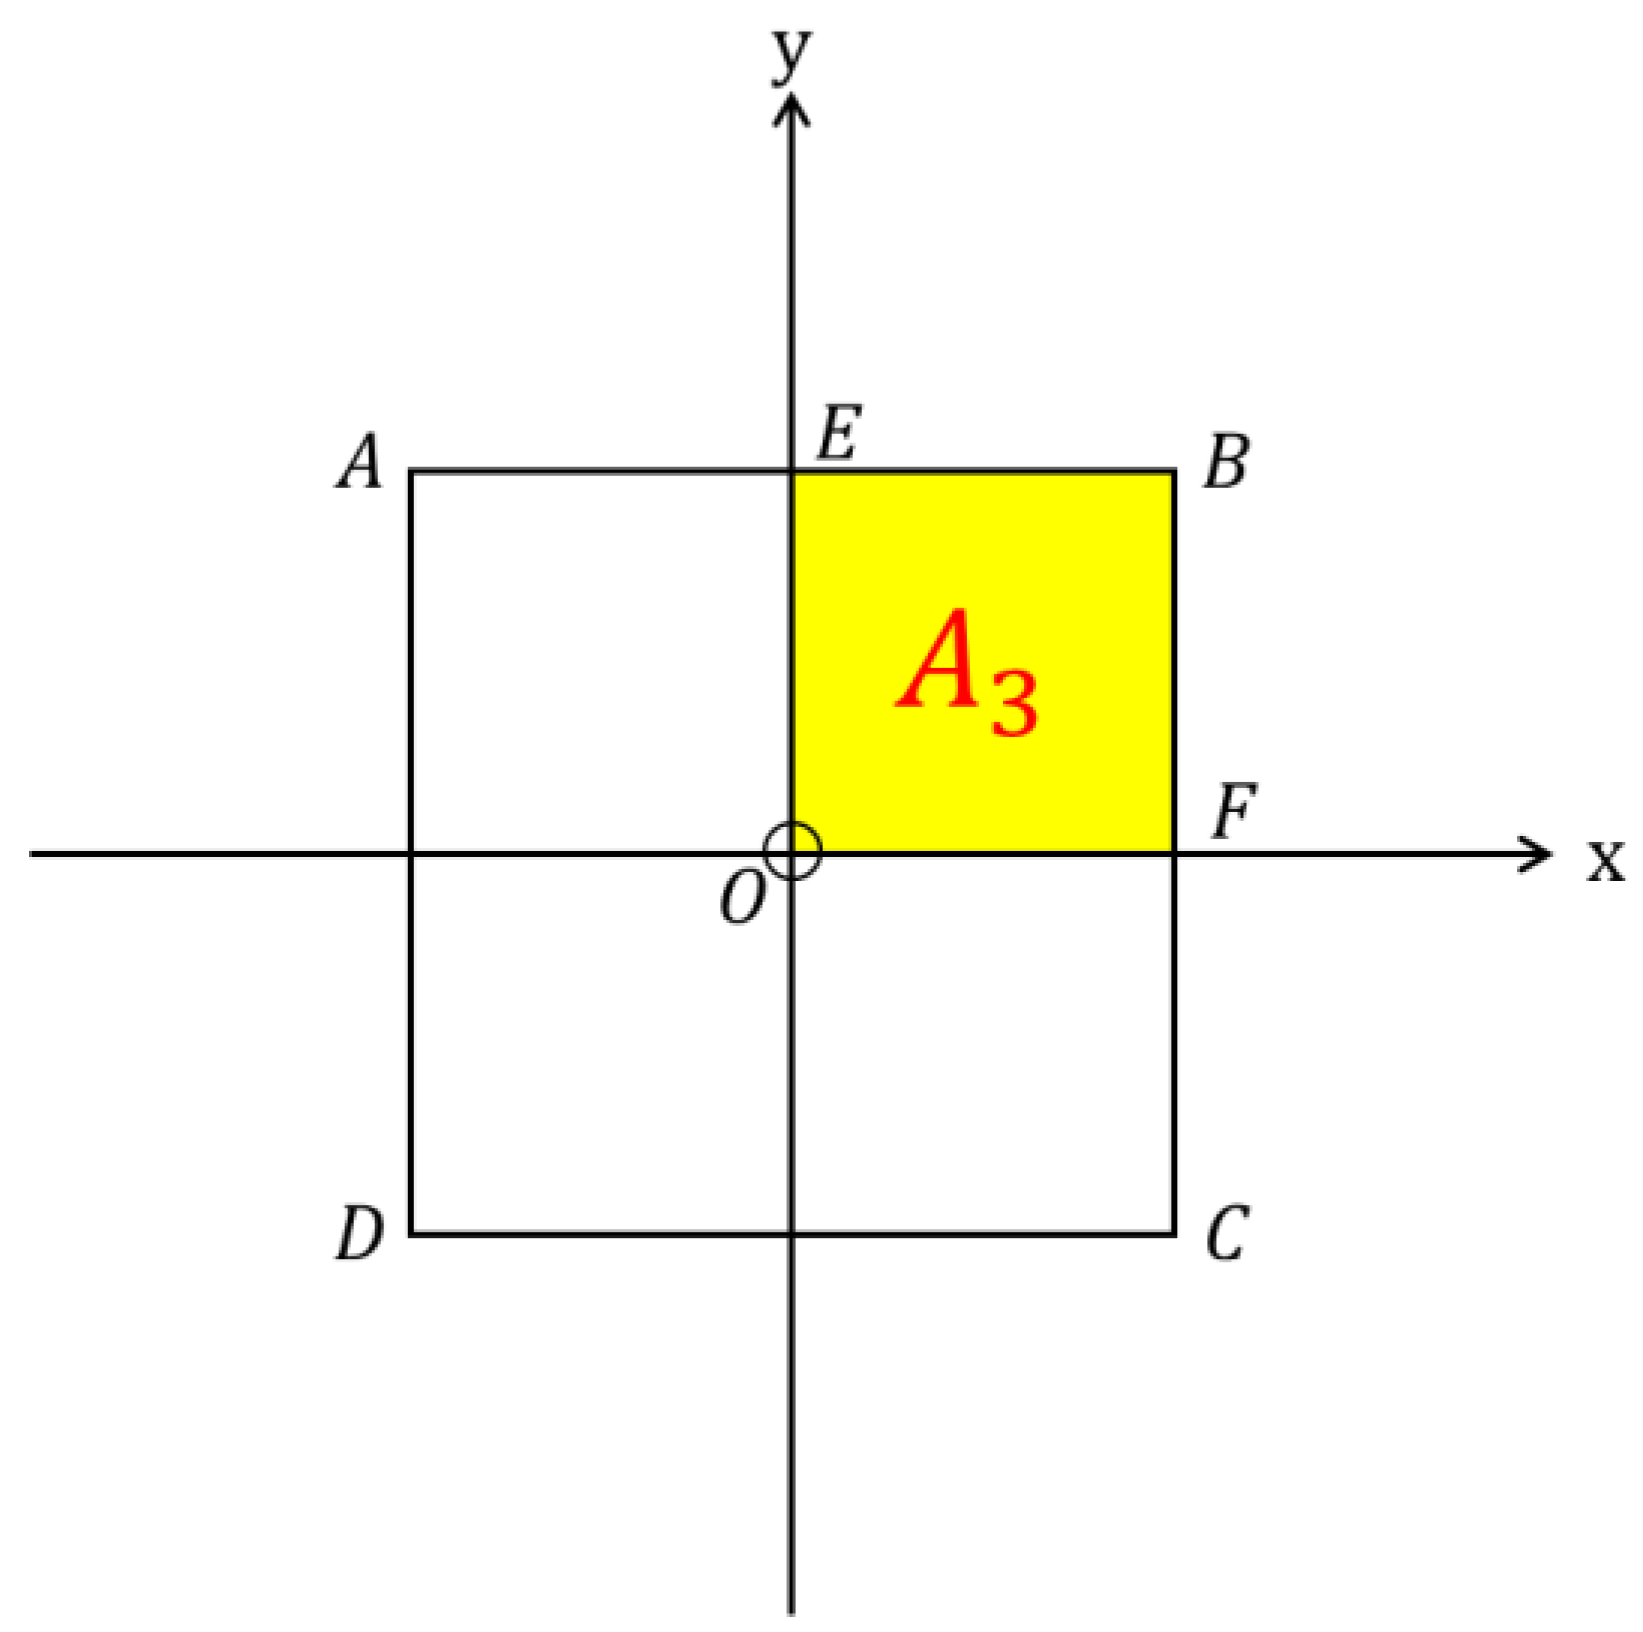
Then, we calculate the average walking distance to the conventional transit stations. All passengers in districts are required to walk to conventional transit stations; see Figure 6. Due to symmetry, we also only need to consider the first quadrant. The average walking distance can be calculated as
where is the area OEBF.
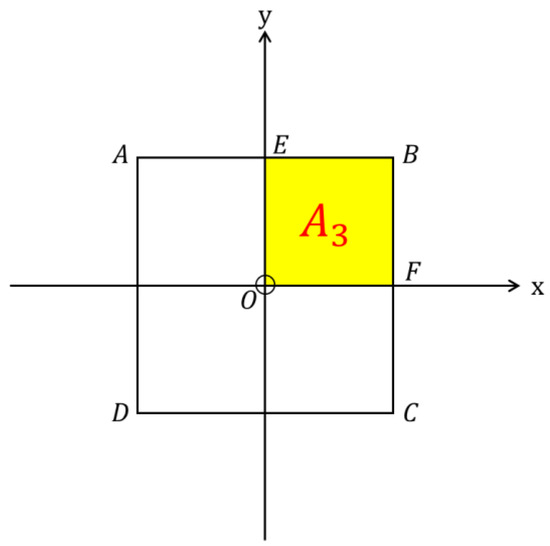
Figure 6.
Illustration of walking area around a conventional station (A3 denotes Area OEBF).
The expected walking time per passenger is simply given by
In summary, the average walking distance per passengers, depending on their route choices, is
In-vehicle travel time
In-vehicle travel distance consists three parts: (i) the distance traveled in rail transit vehicles (); (ii) the distance traveled in conventional buses (); and (iii) the distance traveled in demand-adaptive vehicles ().
For distance traveled in rail transit vehicles, let denote the average distance traveled by a passenger on a rail transit vehicle, excluding any transfers. Thus, the average distance traveled by passengers in rail transit vehicles can be , , and , depending on the number of transfers involved. The average distance converges to when gets larger. We set the average distance to its converging value of . Therefore, we have
where , , and have been calculated in Equations (8)–(10).
For distance traveled in conventional buses, according to Assumption 2, passengers should take conventional buses to the nearest rail transit station. For the convenience of calculation, the number of conventional lines within each unit zone is set to be an even. The average distance from conventional transit station to the nearest rail transit station is calculated as
For distance traveled in demand-adaptive vehicles, it is difficult to estimate the average distance travelled by the demand-adaptive vehicles, because it depends on the number and location of passenger requests. To address this problem, we assume that the ratio between the longitudinal distance and the total distance travelled by demand-adaptive vehicles can be used as a surrogate for the ratio between the passenger’s expected and total in-vehicle travel distances. Let be the ratio between the total and longitudinal distance traveled by demand-adaptive vehicles. The longitudinal distance per one vehicle per round trip is , and the total distance is , where is calculated in Equation (17). This gives as
For the average longitudinal distance, it is also calculated in two cases (see Figure 5). When , the average longitudinal distance (Figure 7) can be expressed as
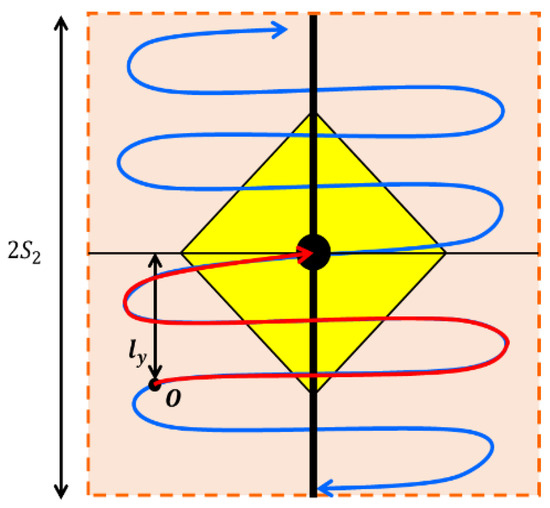
Figure 7.
Travel route of demand-adaptive transit vehicle.
Note that, again, and here represent the areas of the triangle and polygon . Then, we have
where
Solving the above equation gives
For , with the same method to calculate, we have
Therefore, the average distance for the demand-adaptive vehicle to the nearest rail transit station is calculated as
The expected in-vehicle time per passenger is equal to the ratio of the in-vehicle distance to the operating speed of each type of vehicle. The expected in-vehicle time with different travel routes is shown in Table 5.

Table 5.
In-vehicle time per passengers with different route choices.
In summary, the total expected in-vehicle time per passengers is
Waiting time
The expected total waiting time includes the expected waiting time at the origin, at the origin rail transit station, at the transfer station, and at the destination station. Waiting time at each waiting location is approximately half of the headway of the corresponding transit service (see [15,18]). Thus, the waiting time of passengers in rail transit is . Considering that not all passengers need demand-adaptive or conventional transit services, the expected waiting time for these two services per passenger with different travel routes is shown in Table 6.

Table 6.
Waiting time for demand-adaptive and conventional transit services per passengers with different route choices.
In summary, the total expected waiting time per passengers is
In that, represents the average waiting time per trip for rail transit services, and is the expected number of rail transit trips, and thus denotes the total expected waiting time for rail transit. Similar, and denote the expected waiting time per trip for demand-adaptive transit (DAT) services and conventional bus services, respectively.
Transfer penalty
The transfer penalty includes the transfer penalty caused by transfers within the same transit or between different transit modes. Let measure the transfer penalty, expressed in terms of the equivalent walking distance. Then, represents the equivalent travel time per transfer per passenger. Therefore, the transfer penalty per passenger with different travel routes is shown in Table 7.

Table 7.
Transfer penalty per passengers with different route choices.
In summary, the total transfer penalty per passengers is
where represents the transfer penalty due to transfers within the same transit mode, denotes the transfer penalty caused by transfers between feeder modes and rail transit, and , , and are the corresponding transfer penalty parameters for each type of transfer.
3.2.3. User Costs for Intra-Zonal Passengers
We can use the same method to calculate the user costs for passengers traveling in unit zone. Passengers who travel within a single unit just need to take conventional transit.
Walking time
The total expected walking time per passengers is
In-vehicle travel time
Let denote the average distance traveled by a passenger on a conventional bus, excluding any transfers. Hence, the average distance traveled by passengers without transfer and with one transfer in conventional buses are and , respectively. Similarly, we set the average distance to its converging value of . Therefore, we have
Waiting time
The total expected waiting time per passengers is
Transfer penalty
The total transfer penalty per passengers is
3.3. Formulation
In this section we present the optimal design model. To define the objective function consistently, all cost components are converted into travel time equivalents. Let and convert the corresponding agency costs into the equivalent travel time per passenger for rail transit (see [18]). Similarly, and are for conventional and demand-adaptive transit. The total generalized cost of the system can be summarized as
The corresponding constraints are as follows:
For this mixed-integer program, it can be solved both by the continuous relaxation method and global optimization method. Refer to [11]; they have tested both the genetic algorithm (GA) and continuous relaxation (CR) methods, using MATLAB’s built-in functions (MATLAB 2019 version). Specifically, we adopted the built-in GA function, which allows for extensive customization. The crossover fraction was set to 0.7,), while the mutation rate was set to 0.1. Overall, the results produced by the GA methods for the fixed-route and demand-adaptive systems are in many cases slightly better than CR. Therefore, we chose the GA method to solve the proposed system.
4. Numerical Analysis
4.1. Cost Analysis
In this section, we compare the proposed hybrid microtransit system with a baseline configuration that relies solely on conventional transit serving as a feeder to an urban rail. To simulate the single-mode feeding scenario, we modify specific variables and formulas in the system. For the case where conventional transit is the sole feeder mode, we set and , which means passengers in district need to walk to the rail transit station, and other passengers need to take conventional bus.
Table 8 summarizes the key input parameters, which draw partly on empirical studies and partly on operational data from Suzhou.

Table 8.
Input parameters used in the numerical experiments.
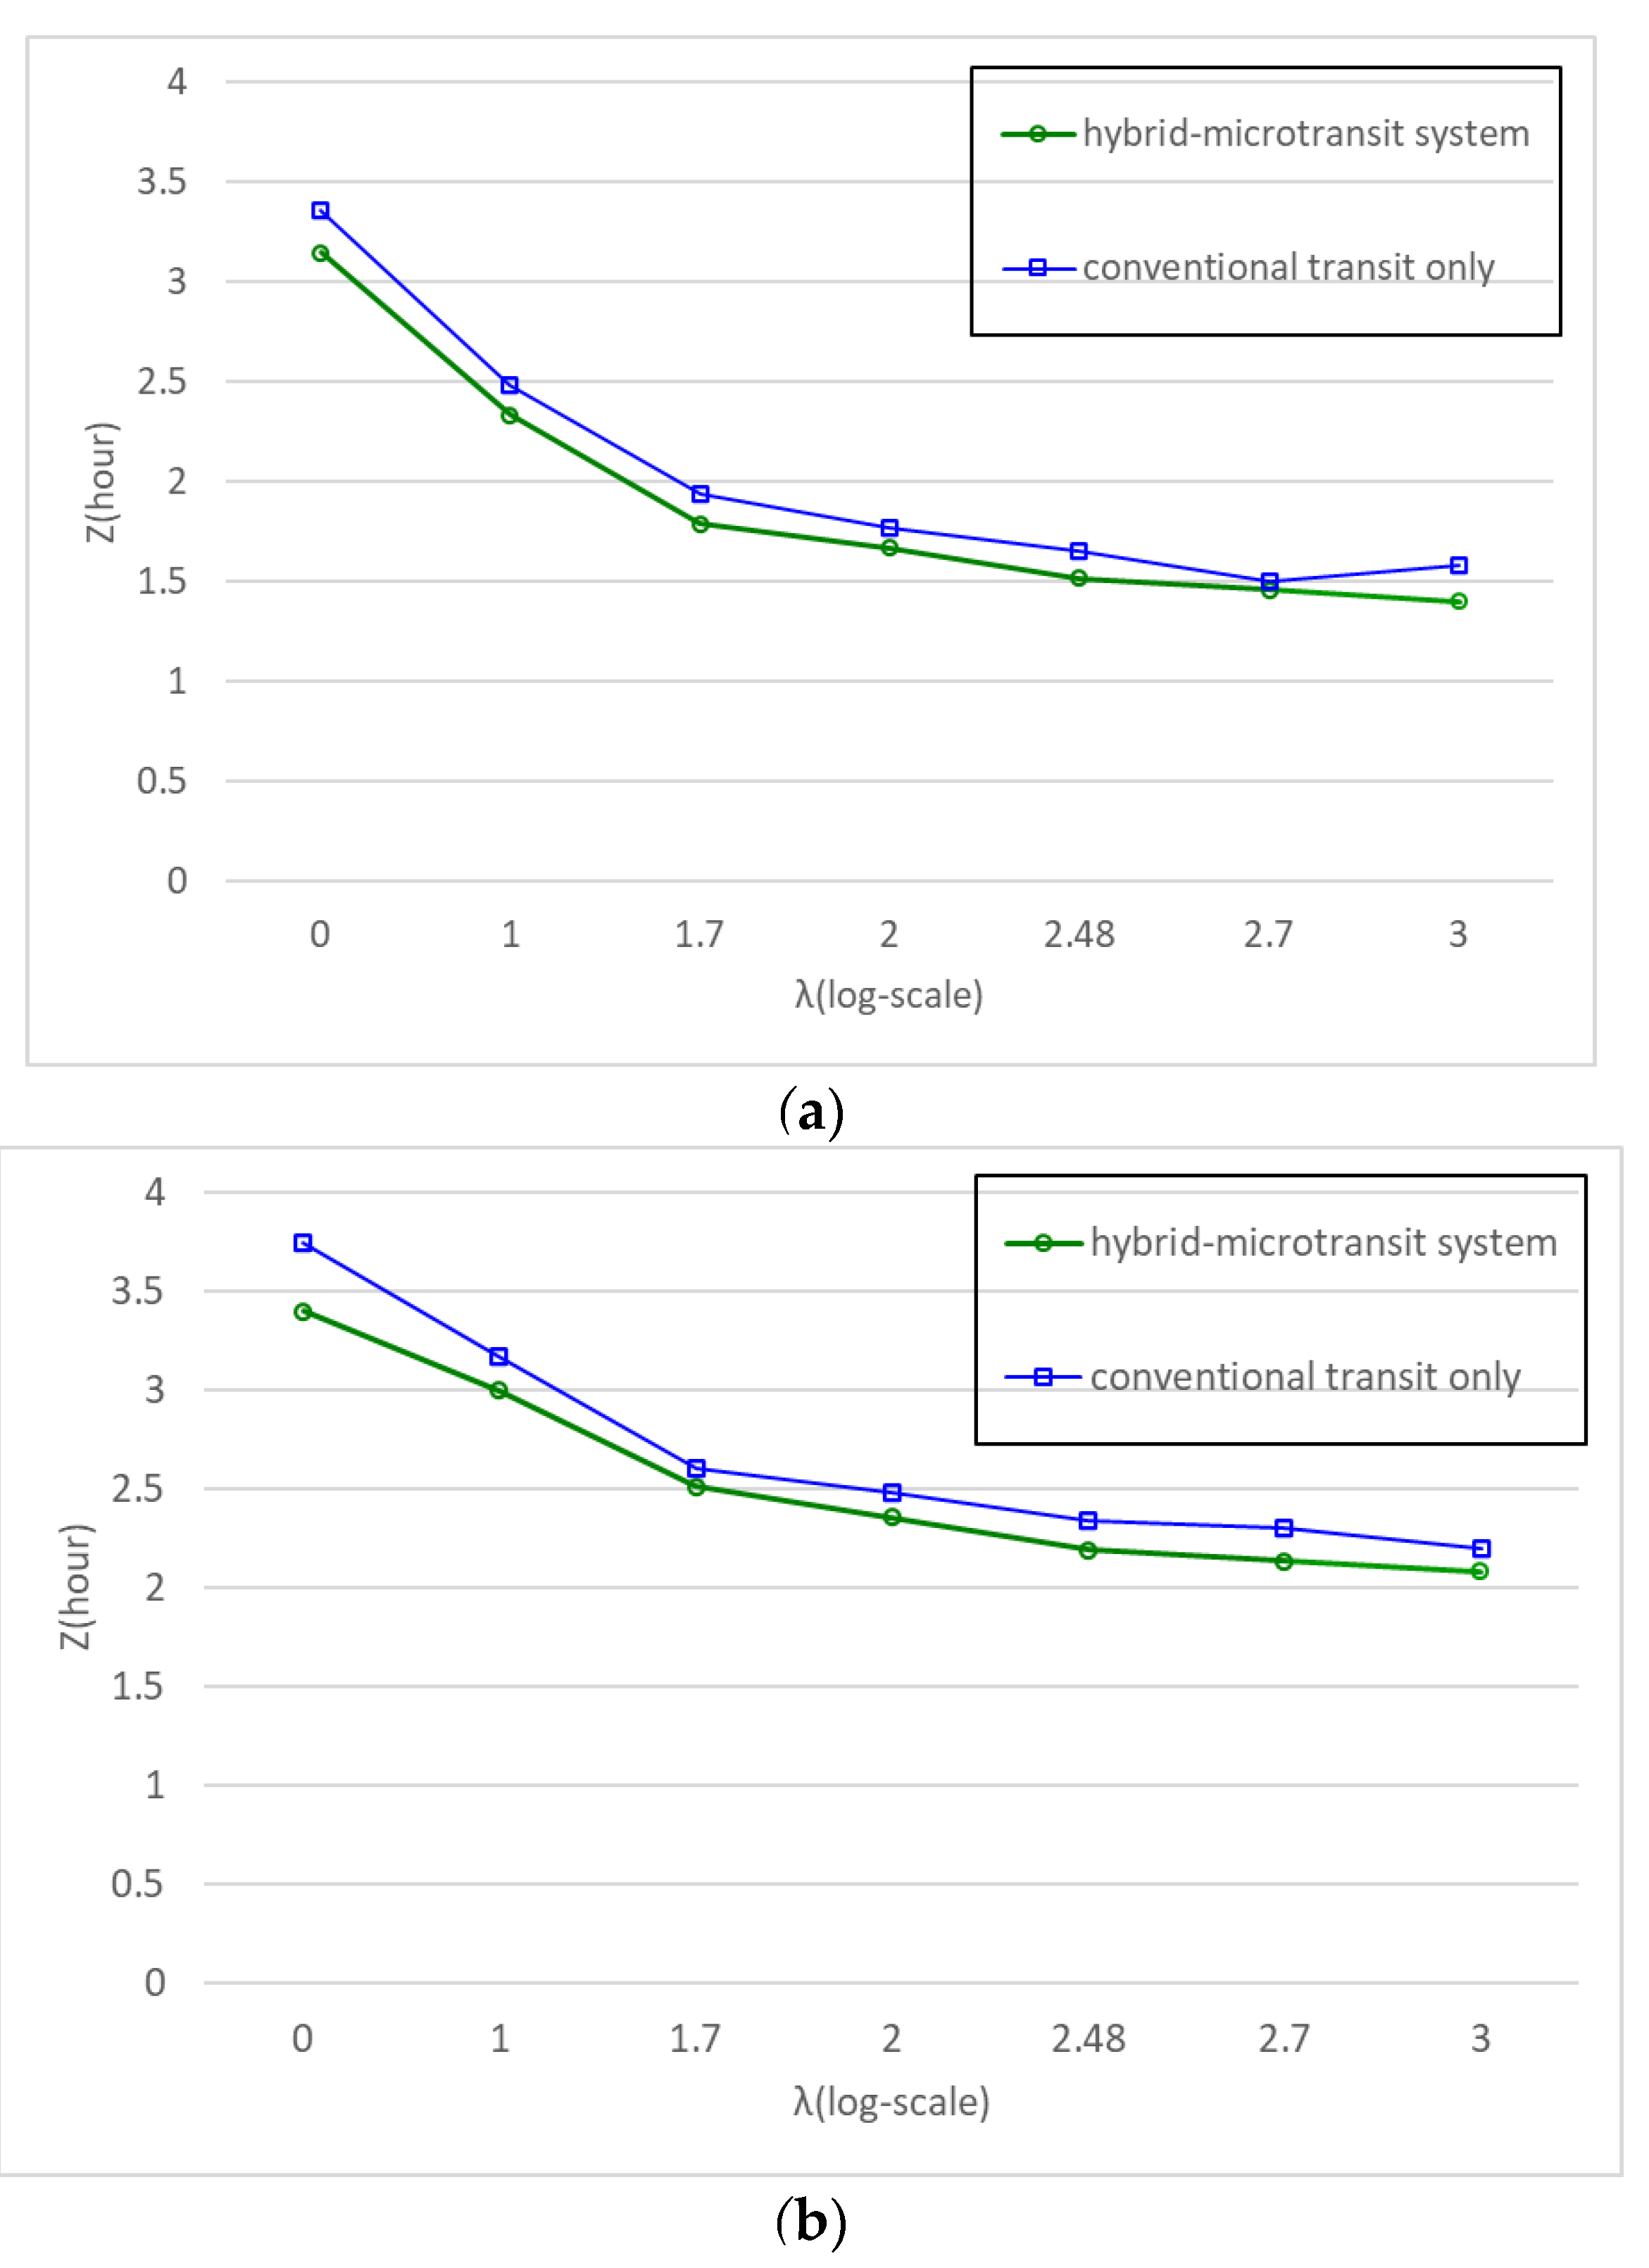
We compare the performance of the two systems with the demand level λ varying from 1 to 1000 pax/h/km2 for two different network sizes: (a) (a mid-size city) and (b) (a large city). In both cases, the hybrid microtransit system performs better than the other one transit system under all demand levels, as shown in Figure 8a,b. The agency costs in a hybrid microtransit system ( and ) are higher than those of the system only with conventional transit in feeding. Yet, the increases in the agency costs are more than offset by the reduction in the user costs.
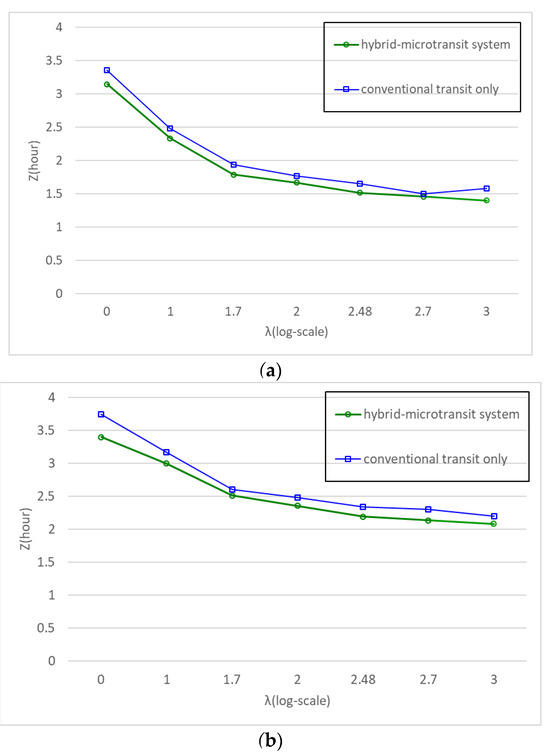
Figure 8.
(a) Optimal system cost vs. demand level with default input parameters (). (b) Optimal system cost vs. demand level with default input parameters ().
Table 9a,b show the optimal design parameters for the proposed hybrid microtransit system for and , respectively. As expected, when λ increases, the number of lines increases (i.e., the line spacing decreases), and the headway decreases considerably. The system cost also decreases monotonically with the demand increase. For comparison, Table 9c,d list optimal results for the two systems. Generally, the proposed hybrid microtransit system requires fewer transit lines.

Table 9.
(a) Optimal system design of hybrid microtransit system. (). (b) Optimal system design of the system relying solely on conventional transit as a feeder (). (c) Optimal system design of hybrid microtransit system. (). (d) Optimal system design of the system relying solely on conventional transit as a feeder ().
These observations suggest that (1) the hybrid microtransit system performs better than the system relying solely on conventional transit as a feeder under all demand levels, achieving a 7% reduction in total system cost. The hybrid microtransit system allows for a trade-off between the walking cost and the agency cost as passengers can choose their mode of access to rail transit—walking, conventional transit service, or demand-adaptive service—based on their access distance. This design flexibility is crucial to bringing down the total cost. (2) The hybrid microtransit system, by integrating DAT services, is able to maintain fewer total transit lines while offering more flexible and efficient service across all demand levels. The system continuously adjusts the layout of its existing network in response to demand variations. At extremely low demand levels (e.g., λ < 10 pax/h/km2) the network degenerates to a unit zone as the high operating costs of rail transit make it unsustainable. That means nearly all passengers rely on conventional transit. As the demand gradually increases within a certain range, the number of rail transit lines in the system remains stable while the increase in the number of total lines is attributed to the expansion of conventional transit lines to meet the growth of passenger demands. At a high demand level (e.g., λ > 300 pax/h/km2), the number of rail transit lines rises while the number of conventional transit lines in each unit zone stabilizes at two. However, the presence of DAT helps buffer these structural transitions by flexibly complementing both conventional and rail services, thus mitigating abrupt network changes and enhancing system adaptability.
4.2. Sensitivity Analysis
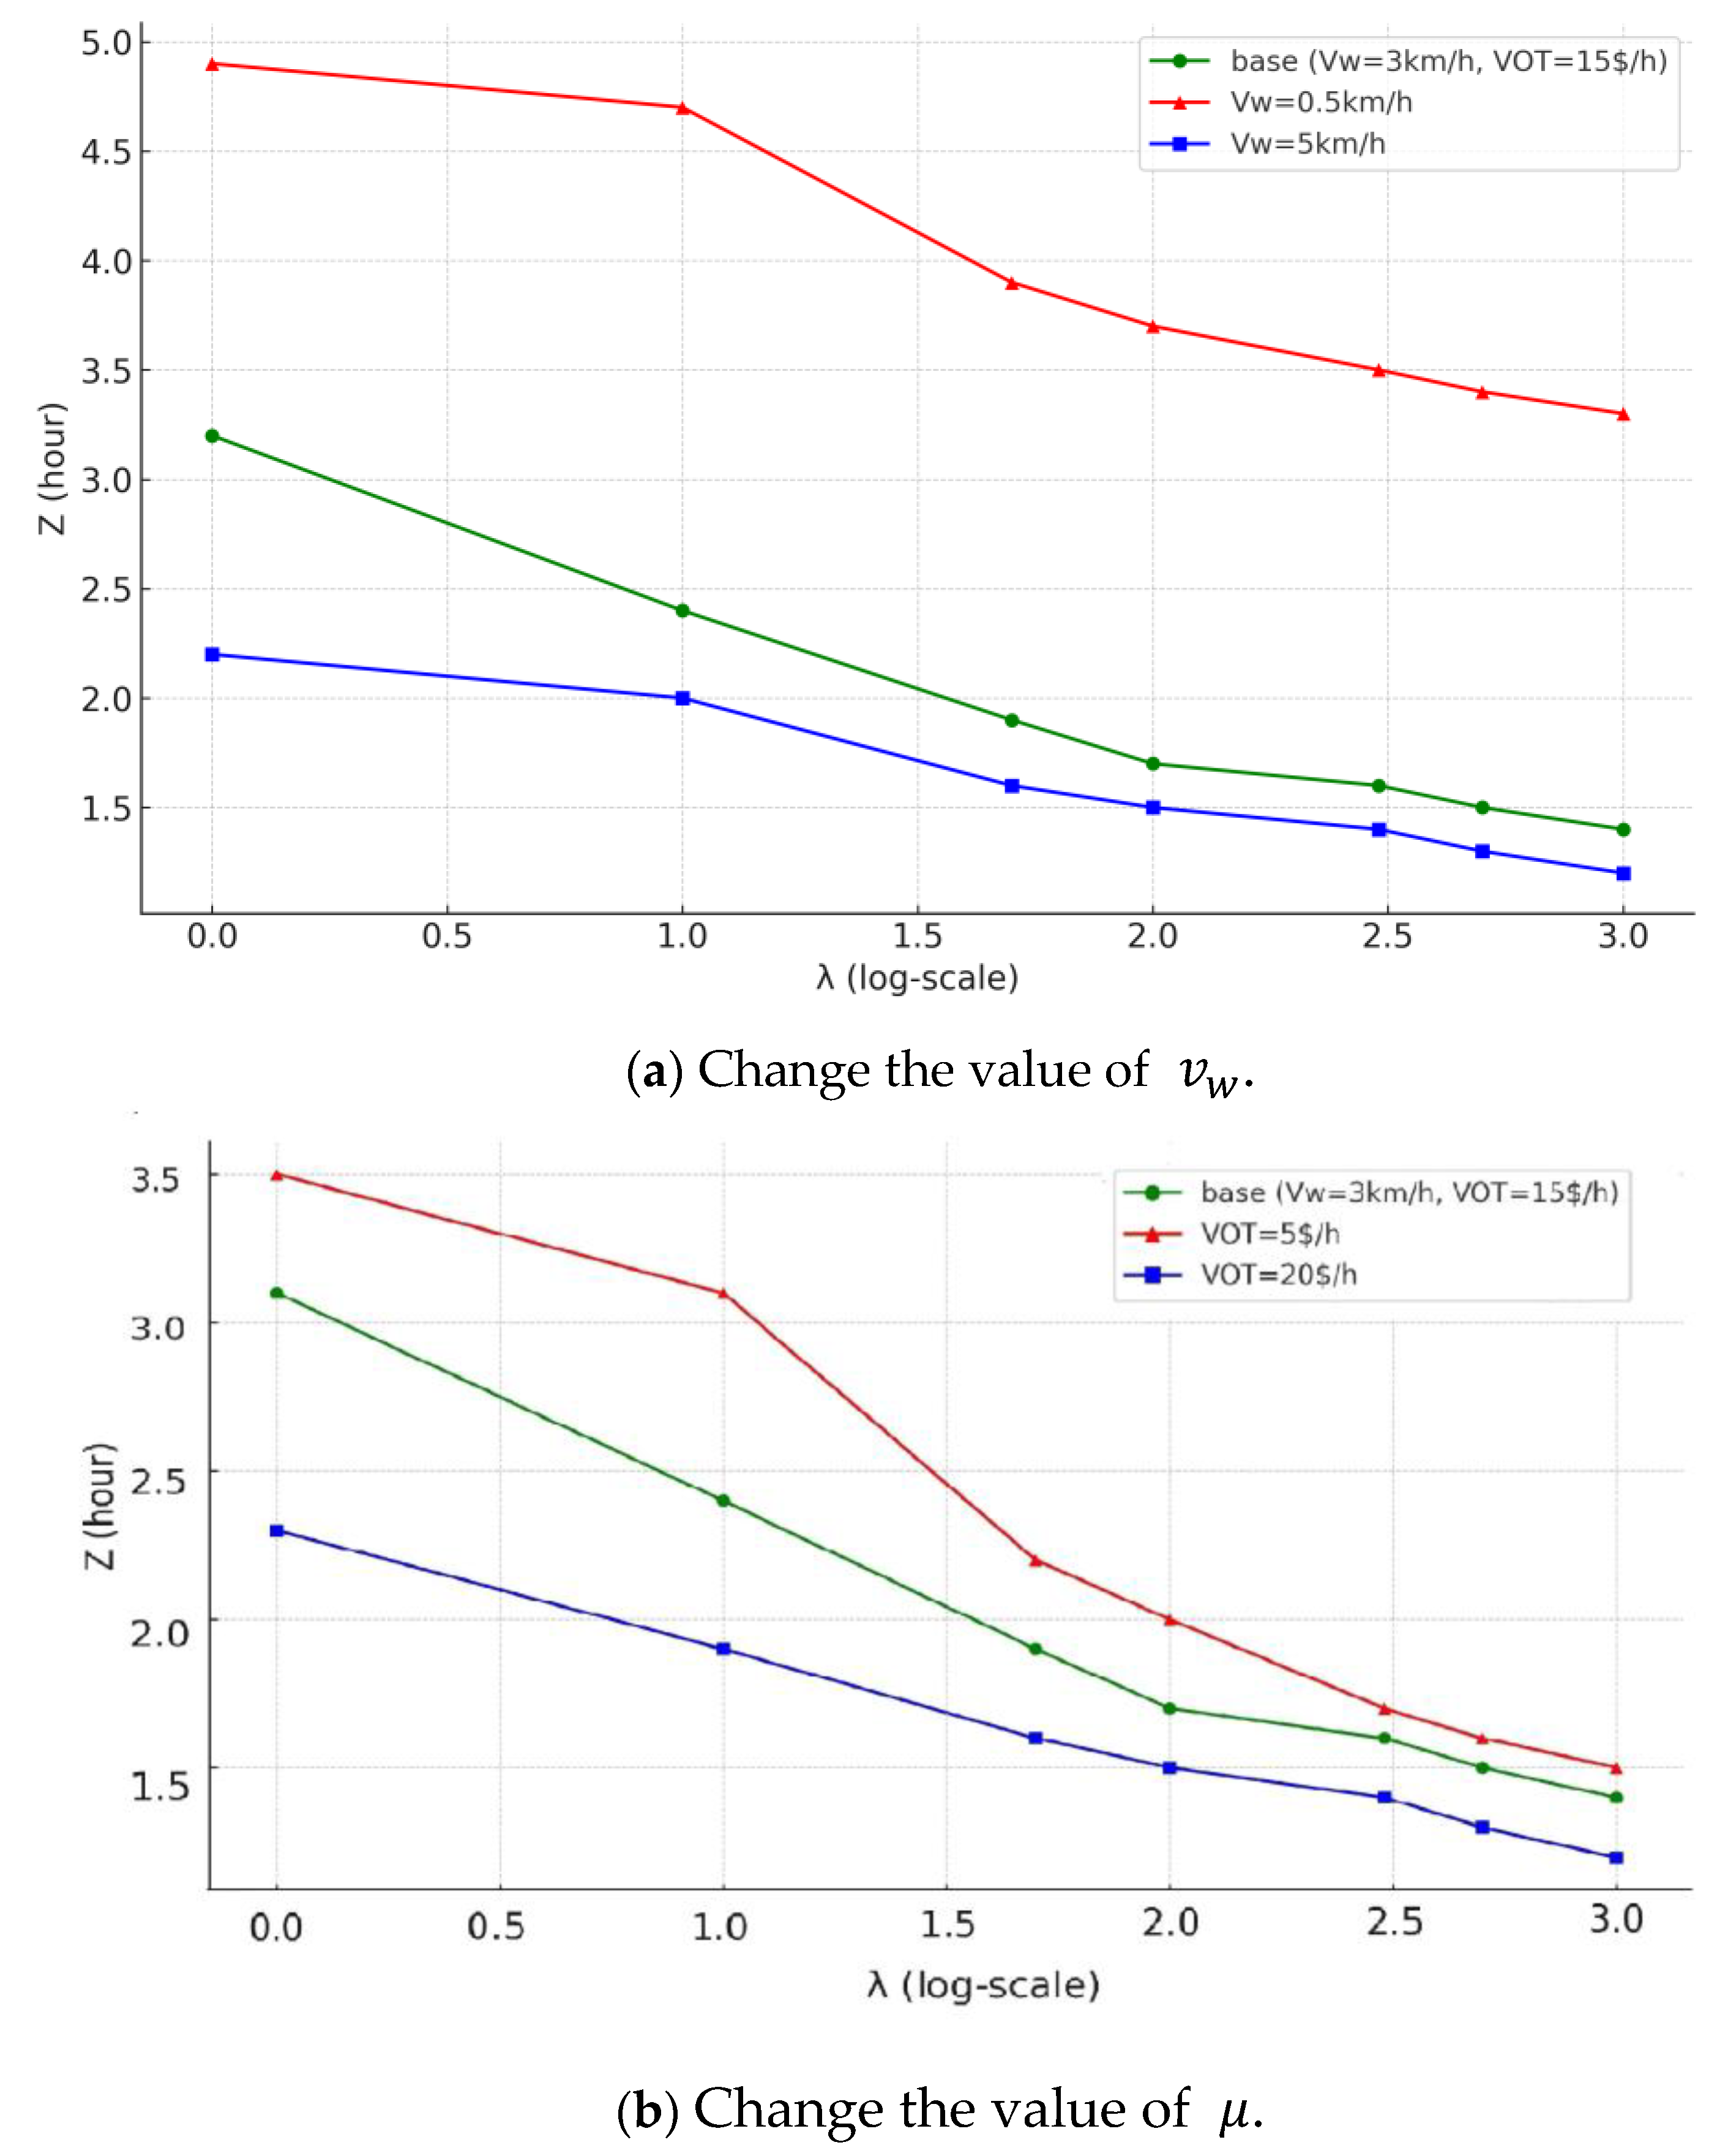
Since the walking speed and the value of time directly influence the performance of feeder modes in the system, we conduct a sensitivity analysis to observe how the system cost is affected by these two parameters. The network size is set to be for all tests. The walking speed is set to 0.5 km/h to represent scenarios where walking may be uncomfortable, such as in poor weather conditions, and 5 km/h to represent the walking speed observed in real-life conditions. And the value of time is set to 5 $/h to represent the low-wage city.
Figure 9a shows that a relatively low walking speed can significantly increase the total cost of the system, although this effect can mitigate the impact by expanding the range eligible for demand-adaptive service (). In contrast, a higher walking speed results in noticeably lower costs when demand level is under 10 pax/h/km2. However, this cost advantage diminishes as demand increase.
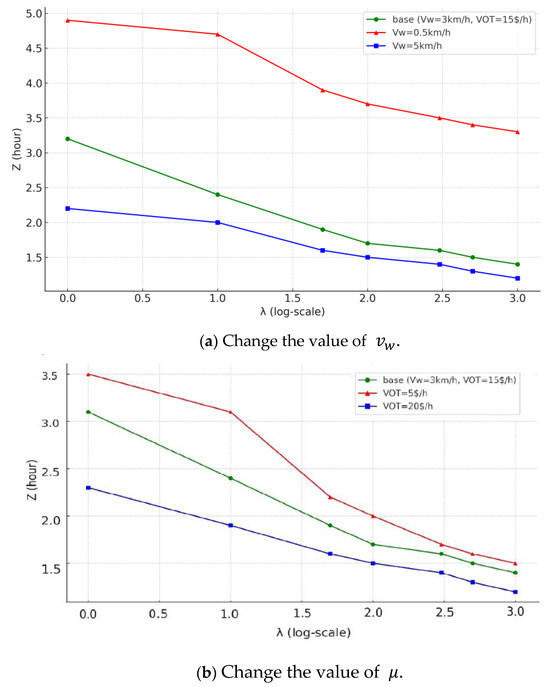
Figure 9.
Sensitivity analysis: optimal system cost with different input parameters.
Figure 9b shows that a smaller leads to an increase in system cost. Compared with the base situation, when the demand is lower than 100 pax/h/km2, the cost of system with $/h is obviously higher. When λ = 10 pax/h/km2, the total travel time increases by more than 0.5 h. When the demand approaches 1000 pax/h/km2, the change of have minimal impact on the cost.
5. Conclusions
In this paper, we propose a hybrid microtransit system that integrates conventional transit and demand-adaptive transit services as feeders to urban rail transit. The function of the feeder transit is to carry passengers from their origins or destinations to rail transit stations. Accordingly, the service area is divided into three parts. Each part corresponds to the travelers who choose conventional transit, demand-adaptive transit, or walking to access urban rail transit. The unique feature of this system is that the conventional transit no longer provides passengers with long-distance travel but serves as feeder together with demand-adaptive transit. The optimal design model is formulated as a mixed integer program to minimize the total system cost, which includes both the agency cost and the user cost. Numerical experiments are conducted to compare the hybrid microtransit system with the other system that only conventional transit serves as a feeder. We also test performance of the hybrid microtransit system under a wide range of demand levels. Main findings from these experiments are summarized below:
- (1)
- In terms of the total system cost, the hybrid microtransit system performs better than the system that only has conventional transit to feed rail transit under all demand levels, saving about 7% system costs. Although it leads to higher agency costs, these are more than offset by reductions in user costs.
- (2)
- When the demand is large, the system meets the growth of passenger demand by increasing the number of rail transit lines, while the number of conventional transit lines remains stable. When the demand is low, however, the number of rail transit lines in the system remains stable at 3, while the number of conventional transit lines rises to meet passenger demand.
- (3)
- In mid-sized cities, walking speed has a significant impact on system cost, while the value of time that reflects the income level of residents has little impact.
The hybrid microtransit system could provide some evidence to resolve the “first-mile” problem of rail transit in large cities by designing better conventional transit and demand-adaptive service. Therefore, this system can not only be applied to new town planning, but also be used to evaluate and improve existing public transport networks.
This study relies on simplifying assumptions inherent in the parsimonious continuum approach, including spatial homogeneity, constant value of time, and the exclusion of detailed environmental and infrastructure constraints. These assumptions, while enabling tractable modeling and optimization, limit the model’s realism and suggest several directions for future research to improve practical applicability. For future research, the complicated route choice of passengers could be further considered. Another possible direction is to give a thought to other network structure such as the ring-radial or hub-and-spoke structure. A future study can also address the important issue of incorporating the crowding effect in the system design. Travelers may fail to board the vehicle in the congested system during rush hours, which leads to unexpectedly long waiting time. Other promising research directions include the following: incorporating time-varying traffic demand, designing hybrid systems that accommodate heterogeneous user groups (e.g., by age or income), and integrating micromobility options into the transit system. Another important research direction is conducting a cost-benefit analysis from a policy perspective to evaluate the societal and economic implications of different system designs, especially under resource constraints.
Author Contributions
Conceptualization, Y.Z., Q.Y. and C.S.; methodology, Y.Z. and K.W.; software, K.W.; validation, Q.Y. and C.S.; formal analysis, Y.Z.; investigation, X.L.; resources, C.S.; data curation, Y.Z.; writing—original draft preparation, Y.Z. and K.W.; writing—review and editing, Q.Y. and X.L.; visualization, K.W.; supervision, C.S.; project administration, Q.Y. and C.S.; funding acquisition, Q.Y. All authors have read and agreed to the published version of the manuscript.
Funding
This research was funded by Transport Planning and Research Institute Ministry of Transport (No. 092315-907) and Ministry of Transport (No. 022515-051 and No. 022515-052). And the APC was funded by Transport Planning and Research Institute Ministry of Transport (No. 092315-907).
Data Availability Statement
The data presented in this study are available on request from the corresponding author due to privacy and legal restrictions.
Acknowledgments
This research is supported by the Transport Planning and Research Institute Ministry of Transport, Beijing Jiaotong University, The Key Laboratory of Road and Traffic Engineering Ministry of Education and Xinjiang Key Laboratory of Green Construction and Smart Traffic Control of Transportation Infrastructure.
Conflicts of Interest
The authors declare no conflict of interest.
Correction Statement
This article has been republished with a minor correction to the Data Availability Statement. This change does not affect the scientific content of the article.
References
- Jin, J.; Tang, L.C.; Sun, L.; Lee, D.-H. Enhancing metro network resilience via localized integration with bus services. Transp. Res. Part E Logist. Transp. Rev. 2014, 63, 17–30. [Google Scholar] [CrossRef]
- Chen, H.; Gu, W.; Cassidy, M.J.; Daganzo, C.F. Optimal transit service atop ring-radial and grid street networks: A continuum approximation design method and comparisons. Transp. Res. Part B Methodol. 2015, 81, 755–774. [Google Scholar] [CrossRef]
- Kepaptsoglou, K.; Karlaftis, M. Transit Route Network Design Problem: Review. J. Transp. Eng. 2009, 135, 491–505. [Google Scholar] [CrossRef]
- Wilson, N.H.M.; Weissberg, R.W.; Hauser, J. Advanced Dial-a-Ride Algorithms Research Project; Technical Report; MIT—Massachusetts Institute of Technology, Department of Materials Science and Engineering: Cambridge, MA, USA, 1976. [Google Scholar]
- Daganzo, C.F. Structure of competitive transit networks. Transp. Res. Part B Methodol. 2010, 44, 434–446. [Google Scholar] [CrossRef]
- Stein, D.M. Scheduling dial-a-ride transportation systems. Transp. Sci. 1978, 12, 232–249. [Google Scholar] [CrossRef]
- Crainic, T.; Malucelli, F.; Nonato, M. Flexible many-to-few + few-to-many = an almost personalized transit system. In Proceedings of the TRISTAN IV, Miguel Azores Islands, Portugal, 13–19 June 2001. [Google Scholar]
- Cortés, C.E.; Jayakrishnan, R. Design and operational concepts of high-coverage point-to-point transit system. Transp. Res. Rec. 2002, 1783, 178–187. [Google Scholar] [CrossRef]
- Malucelli, F.; Nonato, M.; Pallottino, S. Demand adaptive systems: Some proposals on flexible transit. In Operational Research in Industry; Palgrave Macmillan: London, UK, 1999; pp. 157–182. [Google Scholar]
- Nourbakhsh, S.M.; Ouyang, Y. A structured flexible transit system for low demand areas. Transp. Res. Part B Methodol. 2012, 46, 204–216. [Google Scholar] [CrossRef]
- Chen, P.W.; Nie, Y.M. Analysis of an idealized system of demand adaptive paired-line hybrid transit. Transp. Res. Part B Methodol. 2017, 102, 38–54. [Google Scholar] [CrossRef]
- Fan, W.; Mei, Y.; Gu, W. Optimal design of intersecting bimodal transit networks in a grid city. Transp. Res. Part B Methodol. 2018, 111, 203–226. [Google Scholar] [CrossRef]
- Song, C. Research on the Method of Urban Microcirculation Bus Route Design; Southeast University: Dhaka, Bangladesh, 2017. [Google Scholar]
- Yuan, J. Optimisation Studies of Demand Response Transit Subway Connections Microcirculation Routes; Kunming University of Science and Technology: Kunming, China, 2021. [Google Scholar]
- Daganzo, C.F. Checkpoint dial-a-ride systems. Transp. Res. Part B Methodol. 1984, 18, 315–327. [Google Scholar] [CrossRef]
- Wang, Y. Design of Competitive and Hierarchical Transit Network with Grid and Hub-and-Spoke Structure. Master’s Thesis, Beijing Jiaotong University, Beijing, China, 2016. [Google Scholar]
- Chen, P.W.; Nie, Y.M. Connecting e-hailing to mass transit platform: Analysis of relative spatial position. Transp. Res. Part C Emerg. Technol. 2017, 77, 444–461. [Google Scholar] [CrossRef]
- Hu, D.; Jin, W. Flex-route demand response transit scheduling based on station optimization. J. Shenzhen Univ. Sci. Eng. 2022, 39, 209–215. [Google Scholar] [CrossRef]
- Calabrò, G.; Araldo, A.; Oh, S.; Seshadri, R.; Inturri, G.; Ben-Akiva, M. Adaptive transit design: Optimizing fixed and demand responsive multi-modal transportation via continuous approximation. Transp. Res. Part A Policy Pract. 2023, 171, 103643. [Google Scholar] [CrossRef]
- Luo, S.; Nie, Y.M. On the role of route choice modeling in transit sketchy design. Transp. Res. Part A Policy Pract. 2020, 136, 223–243. [Google Scholar] [CrossRef]
- Daganzo, C.F. Public Transportation Systems: Basic Principles of System Design, Operations Planning and Real-Time Control; Technical Report; Institute of Transporation Studies, University of California at Berkeley: Berkeley, CA, USA, 2010. [Google Scholar]
Disclaimer/Publisher’s Note: The statements, opinions and data contained in all publications are solely those of the individual author(s) and contributor(s) and not of MDPI and/or the editor(s). MDPI and/or the editor(s) disclaim responsibility for any injury to people or property resulting from any ideas, methods, instructions or products referred to in the content. |
© 2025 by the authors. Licensee MDPI, Basel, Switzerland. This article is an open access article distributed under the terms and conditions of the Creative Commons Attribution (CC BY) license (https://creativecommons.org/licenses/by/4.0/).

