Abstract
This paper presents an experimental study that analyzes learners’ visual behaviour and brain activity in clinical reasoning. An acquisition protocol was defined to record eye tracking and EEG data from 15 participants as they interact with a computer-based learning environment called Amnesia, a medical simulation system that assesses the analytical skills of novice medicine students while they solve patient cases. We use gaze data to assess learners’ visual focus and present our methodology to track learners’ reasoning process through scanpath pattern analysis. We also describe our methodology for examining learners’ cognitive states using mental engagement and workload neural indexes. Finally, we discuss the relationship between gaze path information and EEG and how our analyses can lead to new forms of clinical diagnostic reasoning assessment.
Keywords:
EEG; engagement; eye tracking; clinical reasoning; scanpath; learning performance; workload 1. Introduction
Shedding light on how expert physicians apply clinical reasoning has always been a difficult challenge. Part of the difficulty in identifying these skills is that clinical reasoning is often described as a rapid tacit cognitive and metacognitive process that uses formal and informal strategic thinking to gather, analyze and transform the features of a clinical problem into actions and decisions [1,2,3,4]. Medical experts often have difficulty articulating these rapid decisions to medical trainees and may not have the ability to explicitly retrace all of their reasoning steps [4]. Consequently, human tutoring of novice trainees may be inefficient. Therefore, new methods have been created to supplement classical medical training activities, which include the use of serious games and immersive simulation environments, that can offer significant support for learners to further develop this core competency [5,6,7].
Serious games are interactive learning systems where learners are assigned roles within a simulation game, and in this paper, the game allows learners to practise medical reasoning [8,9]. The main objective of the game is to involve a learner in an immersive scenario that will explicitly target his ability to recognize, infer and interpret the different information and cues embedded in the scenario that will lead to an appropriate resolution of the problem.
Despite inherent strengths in using a serious game to promote clinical reasoning, there are some challenges that need to be considered. First, most serious games rely on script-driven scenarios that focus on delivering the educational content without having the necessary mechanisms that assess and support this knowledge transfer [10]. Second, previous game experiences may influence perceptions of serious games. We see in studies of games that some learners have negative learning experiences in unstructured, open-ended game environments [11]. Furthermore, learners can become disengaged if the difficulty level of the scenario is not optimally suited to their skill level [12]. Learners may also become overloaded in the game when they need to learn to control the game and understand the instructions. Many serious games lack the ability to assess learners’ reasoning skills and adapt to individual differences and are unable to identify, trace and map the process that led the learners to take these actions [13]. All these drawbacks limit the ability of serious games to compete with traditional medical training and to provide an optimal learning experience. Furthermore, most of these drawbacks require augmenting serious games with additional computational techniques that could provide these systems with continuous information about learners’ cognitive and behavioural states.
With the advent of affective computing, and more particularly physiological computing [14], learning systems are increasingly integrating sensors and features that enable collecting, processing and analyzing data about learners’ cognitive-affective states. This new paradigm, intrinsically centred on learners’ behaviour, presents new ways to understand and explain learners’ interaction experience and can serve as a promising solution for studying medical student learning in the context of medical training serious games [15].
In this paper, we propose to use sensing technology, namely, electroencephalography (EEG) and eye tracking, in a serious game to analyze medical student reasoning. These two techniques extensively used in other affective computing applications [16] have demonstrated remarkable results in assessing and understanding human behaviour. More specifically, we hypothesize that the integration of these sensors could unveil critical information needed to understand clinical reasoning. Our objective is to explore how these techniques could benefit clinical reasoning assessment. More precisely, we present a novel approach to analyzing medical students’ behaviour within a serious game’s context through recording learners’ cognitive states using mental engagement and workload neural indexes, together with visual focus and scanpath patterns using an eye tracker. We demonstrate how these features are related to clinical diagnosis and performance; then, we discuss the relationship between students’ gaze path information and EEG while solving medical cases.
The remainder of the paper is structured as follows: In Section 2, we provide a literature review of the different studies that used EEG and eye tracking to analyze learners’ behaviour. In Section 3, we describe our methodology and experimental design. In Section 4, we detail our results, and in Section 5, we provide our conclusions and outline possibilities for future work in this area.
2. Previous Work
A growing body of research in human–computer interactions, particularly within computerized learning environments, has identified and reproduced users’ behavioural and affective states through sensing technology [17,18]. Various physical and physiological sensors, including heart rate variability, galvanic skin response, facial expression, respiration, body posture and temperature, respiration, oculometry and brain activity, are being used (e.g., [19,20,21,22,23]). In this section, we describe studies with eye tracking and EEG.
Eye tracking is one of the most popular techniques to assess and analyze learners’ gaze behaviour during cognitive task resolution as it provides valuable information about the users’ visual focus and attention and how eye movements are related to the learning process [24,25,26]. Eye tracking devices are increasingly found within realistic learning settings, especially due to their non-intrusiveness and ease of use as compared to other devices, and also their high sensitivity and performance [27,28]. Various gaze properties and metrics, including gaze position, fixation, pupillometry and saccades, can be found in the literature. For instance, D’Mello et al. [29] developed a gaze-reactive tutoring system based on gaze position and probability distributions of gaze events to detect learners’ zoning-out. The system uses attention reorientation strategies to re-engage the learners in the activity by directing them towards specific relevant areas of the screen. Lallé and colleagues [30] used eye saccades, fixation and pupil dilation, together with task performance, to evaluate learners’ skill acquisition rates within visualization tasks. A predictive model was developed to assess students’ learning curves with the aim of providing adaptive support to slow learners. Lum et al. [31] investigated the relationship between learners’ mental workload and the number of fixations while completing a computer-based training program. They found statistically significant correlations implying that when the task was not challenging enough, learners’ visual attention tended to decrease over the tasks. Ben Khedher and Frasson [32] used fixation duration, the number of fixations, time to the first fixation, and gaze revisits to predict learners’ performance while interacting with a narrative-centred learning game. They were able to discriminate between two groups of learners in terms of outcomes (high and low) in different multiple-choice quizzes. Pachman and colleagues [33] also used fixation-based metrics to detect learners’ confusion within a digital learning environment. They found that confusion ratings were positively correlated with fixation duration on non-relevant areas of the screen, which helped them identify potential confusing areas with the purpose of setting self-regulatory strategies to manage confusion.
Still, the aforementioned studies rely mostly on static metrics measured locally from the observed data neglecting to some extent the sequential properties and the dynamics of the gaze behaviour underlying any cognitive process [34,35,36]. Indeed, gaze ad hoc properties such as fixation duration, pupil size or saccade length could not glean enough information to show, for instance, that focusing on a particular area for a certain period of time is the cause of performance differences [19]. Yet, some researchers are concerned with the temporal properties of eye movement patterns through the analysis of the visual scanpath, i.e., the visual trajectory of a user’s eye movement followed through a problem-solving task. This dynamic measure provides richer information about the users’ moment-to-moment visual shifts across time and across different areas of interest and hence provides valuable insights into the order in which visual data are processed in the brain [37,38,39]. For instance, in the work of Susac and colleagues [40], learners’ scanpath was recoded during mathematical solving. The goal was to analyze how students visually rearrange algebraic equations in a way that discriminates between expert and non-expert learners. Results showed that expert students followed a well-defined and organized visual trajectory as compared to non-experts who focused more on the solutions presented rather than on the mathematical statements themselves. In the same context, Byun et al. [41] used scanpath metrics to differentiate between novice and expert players of a serious game. Results showed that experts had a more organized visual path than novice players and tended to focus more on the relevant areas of the game interface as compared to the novices who had a rather random-like visual trajectory. Ho et al. [42] used learners’ scanpath to study their visual behaviour when reading web-based scientific reports. They found that students’ level of prior knowledge had an impact on their eye gaze transitions between textual and graphical content. Similarly, Lee and Wu [43] used scanpath metrics to analyze students’ eye movements when shifting between geometric text and figure descriptions. They found that although fixation duration on figures was high, students’ reading pattern was rather text-directed and that the word ordering in the geometric description had an impact on the integration of text and figures. Visual scanpath was also extensively used in the literature to assess cognitive disorders. For instance, Elbattah et al. [22] applied unsupervised machine learning to identify clusters in autism spectrum disorder using visual representations of eye tracking scanpaths with the goal of characterizing the gaze behaviour involved in autism. Mohammadhasani et al. [26] analyzed the relationship between attention deficit and eye movements among children on a visual word task. They found that children with attention deficit hyperactivity disorder do not follow a standard scanpath showing an uncoordinated and chaotic visual path as compared to typically developing children.
In this paper, we will be using both local and sequential properties of eye movements to assess learners’ visual patterns as they solve medical cases within a serious game. We will also use electroencephalography data to monitor learners’ brain activity.
Electroencephalography (EEG) is considered the only physiological signal that can reliably and precisely track restrained changes in mental alertness and effort and that can be identified and quantified in a high temporal resolution (millisecond time frame) [44]. Several works in the literature, in education notably, have integrated this sensor to monitor users’ brain activity [45,46,47,48]. EEG information and features extracted from power spectral distribution bands or event-related potential components have served as input for linear and nonlinear classification and regression models to identify learners’ mental states. Berka and colleagues developed an EEG workload index using discriminant function analysis for monitoring alertness and cognitive load within different learning environments [44,49,50]. Gevins and Smith [20] used EEG spectral features to feed a neural network for classifying users’ workload while performing memorization tasks. Mills et al. [51] also used EEG spectral features for workload assessment. Partial least squares regression was applied to predict learners’ cognitive load during interactions with an intelligent tutoring system. A mental engagement index was developed by Pope and colleagues at NASA [52] for measuring moment-to-moment changes in users’ attention and alertness. This index, calculated from EEG brainwave band powers, was used in several studies for monitoring learners’ engagement during problem-solving and listening activities [53,54,55,56,57].
EEG data were also used for performance assessment and learners’ classification [58,59,60]. For example, Van der Hiele and colleagues [59] analyzed EEG correlates of cognitive function abilities. They found that EEG power measures were associated with decreased performance on tests of global cognition, memory, language and executive functioning. Lujan-Moreno et al. [60] used EEG features extracted from power spectral density analysis to feed a random forest classifier that predicts when students are going to make mistakes while interacting with a learning environment. Moreover, EEG recording was used within computer-based learning environments as a way to both monitor learners’ mental state and adapt the learning content accordingly. For instance, Szafir and Mutlu [61] used EEG signals to monitor and recapture learners’ loss of attention while listening to lectures delivered by an embodied pedagogical agent. An engagement index was calculated from EEG brainwave band powers, and verbal and non-verbal cues (such as increasing vocal volume, gesturing or head nodding) were used to regain learners’ attention if needed. In their tutoring system, Chaouachi and colleagues [62] automatically adapt the learning material according to learners’ attention and workload, measured with EEG. A frequency band power analysis was used to assess mental engagement, and a machine-learned model to assess workload. For instance, in case of a drop of attention or overload/underload, a worked example is given as the next activity in order to re-engage students. In another study [48], EEG technology was used in an e-learning environment to detect learners’ mental efforts while watching online videos. The authors used a mental state classification system through a supervised learning technique to identify video segments where students invest high mental effort. Both students and instructors can have access to these segments in order to improve learning outcomes: students, to self-regulate their mental state and instructors, to adapt the learning content accordingly.
Although each of these measures is highly effective in unimodally assessing students’ external visual behaviour (i.e., eye tracking) or physiological brain activity (i.e., EEG) within learning tasks, more and more research in human–computer interaction and notably in technology-rich tutoring environments, opt for a multimodal approach to benefit from the advantages of both types of sensors and also overcome the possible limitations of a unique modality. These measures are found together in several works to analyze the learners’ interaction experience with the tutoring system, their behaviour or learning performance. For instance, Brouwer and colleagues [63] used fixation duration, pupil size and EEG event-related potential to assess learners’ attention in a visual search task. Slanzi et al. [64] used gaze fixation, pupil dilation and EEG responses to predict learners’ click intentions within a web search task. Alhassan and colleagues [65] applied data mining techniques to classify students’ learning styles. Data from EEG signals and eye tracking were used as input features to classify visual and verbal learning modes. In the same context, Muldner and Burleson [66] used machine learning classifiers to discriminate between high versus low creativity students using a skin conductance bracelet, an eye tracker and EEG sensors. El-Abbasy et al. [67] developed an affect-sensitive e-learning system that changes the learning materials according to the learners’ experienced emotions. Negative emotions such as sadness and frustration were recognized using eye tracking and EEG. Statistical analyses were carried out, showing that this affect-based adaptive strategy has a positive impact on learning. Makransky et al. [68] analyzed frequency band powers from EEG and fixation metrics from eye tracking to assess learners’ cognitive load during multimedia learning. Statistically significant relationships were found, showing that eye tracking measures are correlated to extraneous cognitive load and that EEG measures are correlated to intrinsic cognitive load.
In this research, we use both eye tracking and EEG sensors to analyze the analytical process of novice medicine students within clinical reasoning. Particularly, we use gaze data to assess both learners’ visual focus and scanpath pattern through patient case solving, together with neural indexes to analyze learners’ cognitive state. In our previous work [69], a preliminary study was conducted to analyze the relationship between students’ mental activity through EEG data and their clinical diagnosis performance, on the one hand, and the relationship between their gaze duration in the relevant areas of the task through eye tracking and performance, on the other hand. This analysis showed significant correlations between students’ diagnosis performance and EEG features but no significant correlation with gaze duration. This paper is a continuation of this work with two-fold objectives: (1) To explore further students’ gaze information and EEG data during the tasks, including both gaze duration and visual scanpath, which enable us to track both static and dynamic eye tracking features, together with information about students’ mental engagement and cognitive load from the EEG signal. (2) To assess the interplay between students’ visual behaviour and mental state. We demonstrate how eye tracking and EEG sensors could be used to monitor both learners’ external visual behaviour, including gaze duration and eye movements, and cognitive state, including mental attention and fatigue levels. We show how these features are related to learners’ analytical performance and how the alignment metrics of the visual scanpath are related to learners’ brain measurements. To our knowledge, this is a novel demonstration of how gaze path information and EEG are related and could be used for clinical diagnosis assessment and eventually for predictive purposes.
3. Experimental Design and Methodology
An experimental study was conducted to analyze learners’ visual behaviour and brain activity as they interact with a computer-based learning environment called Amnesia: a medical simulation system that assesses analytical skills of novice medicine students through clinical problem-solving [70]. Fifteen participants (8 males, 7 females) aged 20–27 years (M = 21.8 ± 2.73) were recruited. They were all undergraduate students from the department of medicine at the University of Montreal. Upon their arrival, they were briefed about the experimental procedure and signed an ethical agreement. They were then placed in front of an eye tracker (at 65 cm approximately) and outfitted with an EEG headset before proceeding to the experiment. Each session lasted between 30 and 45 min and ended with a post-game questionnaire to collect feedback about the systems’ ergonomics and usability. Figure 1 documents the experimental procedure.
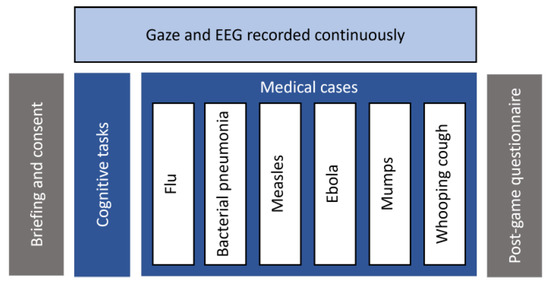
Figure 1.
Experimental procedure.
3.1. Amnesia
Amnesia is a realistic computer-based environment developed for undergraduate medical students to assess their analytical reasoning process as they explore a series of observations and make clinical decisions through patient case solving. All the curricula underlying the software material were designed by a medical professional and approved by a doctor [70].
The system features a virtual hospital where the player acts as a doctor who is mistakenly diagnosed with amnesia and find himself trapped within a hospital. To get out of this trap, the doctor needs to prove that he does not suffer from this disease by resolving first basic cognitive exercises such as visual memory, number series and analogies tests. Then he needs to prove his clinical skills by resolving six medical cases. Each case represents a different disease, namely, flu, bacterial pneumonia, measles, ebola, mumps and whooping cough, respectively. For each case, a series of observations such as patients’ demographic information, symptoms and clinical data are given. Participants are instructed to identify both the correct diagnosis and the appropriate treatment. Additional data such as analyses and antecedents can be collected with each case. For each diagnosis and treatment, different response alternatives are given, and the students have up to three attempts to find out the correct answer. For the diagnosis, there is only one correct answer, which is the current disease. For the treatment, there are up to three possible responses. After a failed attempt, students can revise the patient’s information, collect additional data and conduct further analyses to adjust their initial hypothesis and correct their answers.
3.2. Gaze Recording
A Tobii TX-300 eye tracker with a sampling rate of 300 Hz was used for gaze recording. The device includes infrared sensors and a camera that were embedded within a 23-inch computer monitor of (1920 × 1080) resolution. A nine-point calibration grid was used to assess and calibrate the quality of the measured gaze points. The calibration process was successfully completed by all respondents (N = 15) with a data quality of 92% on average. Two different metrics were computed from the eye tracker, namely fixation duration and visual scanpath.
Fixation duration is a temporal measure of the gaze direction used to assess where visual attention is focused [42,71,72]. It corresponds to the amount of time the fovea (centre of gaze) is directed towards the task-relevant elements of the screen, i.e., the Areas of Interest (AOI) in the system’s interface. In total, six AOI were defined for each medical case as follows (see Figure 2 [73]). Information includes the patient demographic information (name, age, weight and height). Antecedents presents the patient medical history of previous diseases and possible allergies. Symptoms introduces the current symptoms presented by the patient. Analysis includes data on the patient’s temperature, heart rate, and blood pressure, as well as results from additional lab tests, if applicable. Diagnosis shows different response alternatives for the disease to be identified. Treatment presents different suggestions for the treatment of the disease.
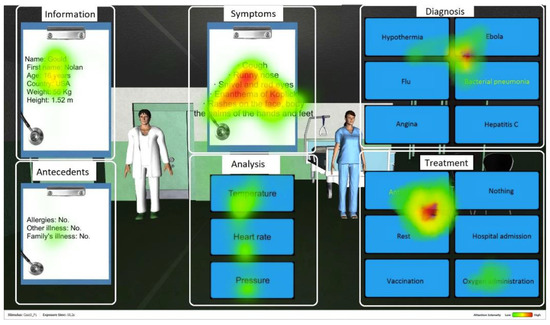
Figure 2.
Screenshot of Amnesia with the AOI. The red color represents the most fixated areas, followed by yellow and then green with lower intensity.
Visual scanpath is a spatiotemporal measure of the dynamic trajectory of the eye movements that assesses the way sensory information is selectively attended to and processed [74,75,76]. It corresponds to the sequence of foveal fixations and saccadic eye movements across the AOI, that is, the sequential visual path followed from one area of interest to another. A string-based coding schema [77,78] was used to record this pattern, where each letter denotes a visited AOI: Information (I), Antecedents (A), Symptoms (S), aNalysis (N), Diagnosis (D) and Treatment (T). Each fixation occurring within a specific area is coded with its corresponding letter. Gaze data are then filtered with a minimum threshold of 250 ms for fixation duration in each AOI [79] (e.g., IIAASSSSSNNNNSSNDDDSSDDTTDTT). Redundant characters are then collapsed to retain a unique occurrence of each area (e.g., IASNSNDSDTDT).
Smith–Waterman algorithm [80] was used to evaluate this scanpath. The algorithm, which is notably used in bioinformatics for DNA sequence alignment [81], compares the learner’s visual scanpath with a target reference sequence. This sequence, denoted as ISANDT, represents the hypothetico-deductive analytical process a novice clinician should follow in clinical reasoning [82]. In this process, the clinician starts by collecting the patient’s information and then formulates initial hypotheses according to the symptoms the patient presents. Next, additional clinical data, including medical antecedents, are collected, and further analysis (blood tests, radiography, echography, etc.) can be conducted to validate or discard these hypotheses until reaching a final diagnosis. A treatment is then prescribed according to this diagnosis. The alignment algorithm seeks to identify regions of similarity between both sequences (the learner’s scanpath and the reference sequence). Pairwise comparison is performed through a local dynamic programming procedure by optimizing a similarity score derived from the following features: number of matches, number of mismatches and number of gaps. Matches are convergent elements (i.e., identical letters) in both sequences. Mismatches are divergent elements (requiring mutations, i.e., substituting one letter for another). Gaps are missing elements (implying an insertion or a deletion in one of the two sequences). A substitution matrix is used to minimize in each iteration the number of editing operations (i.e., mutation, insertion and deletion) required to transform one sequence into another while taking into account the prior aligned subsequences with the optimal similarity score. The higher the aligned similarity score, the more the two sequences are similar, which means the closer the learner’s visual sequence is to the optimal reference sequence. We refer to [83] for more details about this procedure.
3.3. EEG Recording
Electroencephalography (EEG) is a measure of the electrical activity of the human brain resulting from synaptic voltage fluctuations of neurons. An Emotiv Epoc headset was used for EEG recording with a sampling rate of 128 Hz. The device collects EEG data from 14 electrodes placed on the scalp according to the 10–20 international electrode placement system [84]. Figure 3 depicts the recorded sites, namely AF3, AF4, F3, F4, F7, F8, FC5, FC6, P7, P8, T7, T8, O1 and O2. Two additional sites (CMS and DRL) located behind the ears are used as reference. The pads of each electrode were moistened with a saline solution to enhance the quality of the signal. An artifact rejection procedure was applied to each incoming 1 s EEG epoch to reduce artifacts from eye blinks and body movements [85,86]. If the signal amplitude exceeds 25% of the data point in a predefined threshold, then the segment is rejected. Two brain indexes were computed from the EEG recording, namely mental engagement and workload.
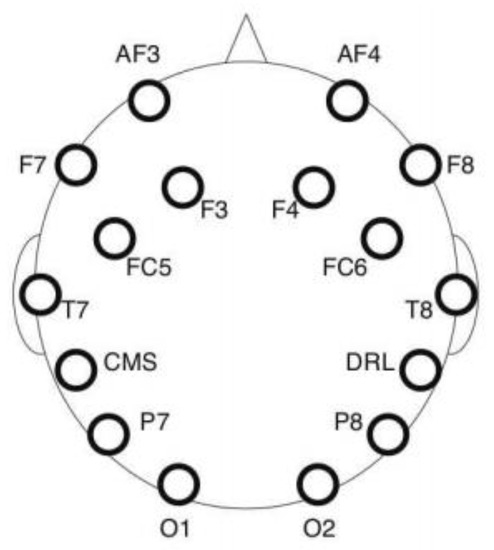
Figure 3.
EEG data channel placement.
Mental engagement refers to the level of alertness and attention allocated during a task [50]. The engagement index used in this study is a neural indicator based on brainwave band powers. It was developed at NASA and applied within a closed-loop system to modulate task allocation [52,86]. It was found that performance in a vigilance task improved when this index was used as a criterion to switch between manual and automated piloting mode. This index is computed using three frequency bands, namely θ (4–8 Hz), α (8–13 Hz) and β (13–22 Hz) as follows: β/(θ + α). These frequencies are extracted by multiplying every second of the EEG signal by a Hamming window to reduce spectral leakage and applying a Fast Fourier Transform (FFT). As the EEG headset measures 14 different regions at the same time, the values of θ, α and β were summed over all these sites. An engagement index was computed for each second. Then, a 40 s moving average mobile window was used in order to smooth the index and reduce its fluctuation. That is, the value of each index at time t corresponds to the total average of the ratios calculated on a period of 40 s preceding t.
Workload, also known as cognitive load, refers to a measurable amount of information-processing demands placed on an individual by a task [87]. It is generally related to working memory capacity and could be viewed as a measure of mental effort produced to process the quantity of information involved in a task. Unlike the engagement index, which is directly extracted from the EEG raw data, the workload index is based on a machine-learned predictive model [88]. This model was pre-trained and validated using a set of EEG data collected through brain-training exercises (digit span, reverse digit span and mental computation) with a varying level of workload induced in each task. This was performed by increasing/decreasing the number of digits in the sequence to be recalled for digit or reverse digit span and the number of digits to be used for mental computation. We refer to [88] for more details about this procedure. The model was validated with subjective workload level assessed using NASA Task load index (NASA_TLX) [89], showing statistically significant correlations between the trained workload index and NASA_TLX scores (mean correlation = 0.72, range of 0.52 to 0.82, p < 0.05). This model was also used within an intelligent tutoring system (MENtal tuTOR) [62], fully controlled by the workload and engagement indexes to automatically select the most adapted learning activity for the student. It was found that using such a strategy to switch the tutoring content had a positive effect on learners’ outcomes.
Once the training phase completed, the EEG raw data were cut into one-second segments and multiplied by a Hamming window. An FFT was then applied to transform each EEG segment into a spectral frequency and generate a set of 40 bins of 1 Hz ranging from 4 Hz to 43 Hz. The dimensionality of the data was reduced using a Principal Component Analysis, and then mean normalized. Next, a Gaussian Process Regression algorithm with an exponential squared kernel and a Gaussian noise [90] was run in order to compute the EEG workload index from the normalized data.
In order to assess the learner’s mental state based on both engagement and workload levels, a slope of each index was computed using the least squared error function of the indexes’ values throughout each medical case. For the engagement index, if the slope value is positive, then the learner is considered as mentally engaged. Otherwise, the learner is considered as mentally disengaged. For the workload index, if the slope value is between −0.03 and +0.03, then the workload is considered as optimal. Otherwise, if the slope value is above 0.03, the learner is considered as overloaded, and if the slope is below −0.03, the learner is considered as underloaded [91]. Moreover, if the learner is both mentally engaged and has an optimal workload, then the learner’s mental state is considered positive. Otherwise, the mental state is considered negative.
4. Experimental Results
The experimental results are organized as follows. First, we analyze the relationship between learners’ outcomes and gaze behaviour while resolving the medical cases. Then, we assess the relationship between learners’ outcomes and their mental state. Finally, we examine the interplay between visual behaviour and brain activity.
4.1. Gaze Behaviour
Our first objective was to analyze the relationship between fixation duration and learners’ analytical performance (i.e., correctness and number of attempts in each medical case). That is, whether focusing (visually) on the task-relevant elements of the screen has any impact on clinical outcomes. The answer is no: there was no statistically significant correlation between fixation duration and performance measures (p = ns).
We were then interested in analyzing the dynamic gaze behaviour of the learners, namely in assessing the relationship between the clinical performance measures and the alignment metrics of the learners’ visual scanpath: number of matches, mismatches and gaps, and the similarity score between the scanpath followed and the optimal reference sequence. First, with regard to the success/failure (i.e., correct diagnosis and treatment), we found that the number of mismatches was significantly lower (F(1, 75) = 13.585, p < 0.001) if the case is successfully solved (M = 0.00, SD = 0.00) compared to failed cases (M = 0.21, SD = 0.41). Furthermore, the similarity score was significantly higher (F(1, 75) = 5.879, p < 0.05) for the succeeded cases (M = 5.79, SD = 2.42) compared to the unsolved ones (M = 3.58, SD = 5.61). This implies that for the correct answers, the alignment scores between the students’ scanpath and the optimal reference sequence were significantly higher and the number of mismatches smaller.
In addition, statistically significant results were found for the number of attempts per case. A significant positive correlation was found between the number of mismatches and the number of attempts (r = 0.36, p < 0.001). This means that the more there were mismatches or deviations between the learners’ visual sequence and the reference sequence, the more there were attempts per case. That is, the more the learners had trouble finding the right answer. A negative correlation with the alignment score was also found (r = −0.26, p < 0.05): the higher the alignment score, the lower the number of attempts per case. This suggests that the more the learner’s visual sequence was close to the optimal reasoning sequence, the lower the number of attempts to answer. In other words, the more the learners’ reasoning was ‘optimal’, the faster they could solve the medical cases.
Accordingly, the analysis of the gaze behaviour showed that the fixation duration had no impact on the learning performance. A student can watch/fix the screen without being currently engaged in the task. This will be indeed confirmed through the analysis of the learners’ brain data (EEG engagement index). The analysis of the dynamic gaze behaviour allowed us to track and evaluate the visual scanpath followed by the learner while solving the medical cases. The closer the visual sequence was to the hypothetico-deductive analytical process (i.e., the reference sequence), the better the diagnostic performance. This hence validates our approach to monitoring the learners’ analytical process through the analysis of the visual scanpath followed over the areas of interest of the game and its evaluation according to the optimal reference path using a sequence alignment algorithm.
4.2. Brain Activity
Similarly, we analyzed the relationship between the EEG variables (mental state, workload and engagement) and the performance measures (correctness and number of attempts in each medical case). We found a statistically significant association between correctness and the workload variable (underload, optimal load and overload), χ(2) = 7.445, p < 0.05. In particular, more than half of the correct answers (54.10% of the cases) were associated with the state of optimal load (against 26.20% to overload and 19.70% to underload).
For the number of attempts, we found a statistically reliable relationship with the mental state variable (positive/negative): F(1, 74) = 13.725, p < 0.001. The number of attempts was significantly higher when the mental state was negative (M = 3.84, SD = 0.96), against (M = 2.96, SD = 1.02) if the state was positive. We recall that a negative mental state is associated with one of these states: disengagement, underload or overload. Two other ANOVAs were conducted to study each index separately. There was no significant relationship between workload and the number of attempts. However, a significant relationship between the engagement variable (engaged/disengaged) and the number of attempts was found: F(1, 74) = 17.27, p < 0.001. This number was significantly higher if the learners were disengaged (M = 3.95, SD = 0.89) against (M = 3.03, SD = 1.04) if the learners were mentally engaged. That is, as the engagement level dropped, the learners had more difficulty in solving the medical cases. Or, conversely, when the engagement index was high, the number of attempts to resolve the cases decreased. In other words, the more attentive the learners were, the easier they found the right answers.
To summarize, both cerebral metrics seem to have an impact on learners’ analytical performance. The cognitive load had an impact on the failure/success of the medical cases, and the engagement index had an impact on the number of attempts per case. On the one hand, we have a significant association between the optimal load interval of the workload index and the succeeded medical cases. On the other hand, we have a lower number of attempts for the positive values of the engagement index.
4.3. Relationship between Gaze and EEG Data
We started by analyzing the relationship between learners’ mental state and fixation duration in medical cases. A first ANOVA showed that the fixation duration was on average significantly higher (F(1, 74) = 5.99, p < 0.05) when the mental state was negative (M = 326.24, SD = 44.18) vs. (M = 302.82, SD = 38.62) in case of positive mental state. Two more ANOVAs were performed to analyze the engagement and the workload indices, respectively. The first analysis showed that there was no statistically significant relationship between the engagement level and the fixation duration. On the other side, the analysis of the mental load index showed that there was a significant relation between fixation duration and (underload, optimal load and overload): F(2, 73) = 4.275, p < 0.05. The post hoc analysis revealed that there was a significant difference in terms of fixation duration between the optimal load level (M = 304.06, SD = 39.97) and overload, with a higher fixation time in case of overload (M = 334.85, SD = 48.41).
This shows that the fixation duration is not a good indicator of mental engagement. One can fix or look at an area of interest on the screen without really lending focus or attention. This rather suggests that a high fixation time is a sign of overload and mental fatigue. Moreover, we found a significant negative correlation between the engagement and the workload indexes’ values (r = −0.295, p < 0.05), which means that the higher the level of attention, the lower the induced level of mental effort. Inversely also, if the mental load increased, i.e., in the case of mental fatigue, the level of attention decreased. This was observed not only during the resolution of the medical cases but throughout all the interactions with the game (r = −0.204, p < 0.05).
Our last analysis concerned the relationship between the EEG features (mental state, engagement and workload) and the alignment measurements of the visual scanpath (similarity score, number of matches, mismatches and gaps).
First, a statistically significant relationship was found between the mental state variable and the similarity score: F(1, 74) = 6.622, p < 0.05. On average, this score was statistically higher in case of positive mental states (M = 6.59, SD = 2.91) vs. (M = 4.31, SD = 4.07). A second significant ANOVA was also found (F(1, 74) = 10.063, p < 0.001) showing that the number of matches was statistically higher in case of positive mental states (M = 4.26, SD = 1.19) versus (M = 3.59, SD = 0.64) in case of negative mental states. This implies that if the learners’ mental state is positive (i.e., both engagement and workload are optimal), they are likely to have a visual sequence close to the target reference sequence, which corresponds to the optimal reasoning process. Or also, the more the learners followed the optimal reasoning steps, the more they were likely to be in a positive mental state.
Then, the analysis of each index indicated that there was also a statistically significant relationship between the alignment measures and engagement, on the one hand, and workload, on the other hand. For the engagement index, we found that it was statistically significantly related to the similarity score (F(1, 74) = 9.097, p < 0.001), the number of matches (F(1, 74) = 9.851 p < 0.001) and the number of mismatches (F(1, 74) = 4.733, p < 0.05). In particular, the similarity score and the number of matches were significantly higher and the number of mismatches significantly lower in the case of positive engagement compared to the state of disengagement (see Table 1).

Table 1.
Statistics on the scanpath alignment measures according to the engagement level.
For the workload, we found that it was statistically significantly related to the similarity score (F(2, 73) = 3.302, p < 0.05), and to the number of gaps (F(2, 73) = 3.445, p < 0.05). The post hoc analysis of the three modalities of the workload values (underload, optimal load and overload) indicated that there was a statistically significant difference between the states of underload and optimal load (there was no significant difference with regard to the overload level). Particularly in case of underload, the alignment score was significantly higher (M = 7.27, SD = 1.62) against (M = 4.47, SD = 4.24) in case of optimal load, and the number of gaps was significantly lower (M = 0.73, SD = 1.22 versus M = 3.06, SD = 3.57). This suggests that the more the visual sequence was similar to the reference, and the fewer the errors (gaps), the lower the workload level. In other words, following (visually) the optimal sequence of the hypothetico-deductive analytical process would imply the least mental effort (i.e., no mental fatigue).
This conjoint analysis of the EEG features, together with the gaze behaviour, allowed us to analyze learners’ brain activity according to the used analytical approach while resolving the medical cases. The more optimal the analytical process was, i.e., the more the visual sequence was close to the reference sequence, the higher the engagement level was. This state of attention also implied fewer errors in reasoning (lower mismatches and higher matches). For the workload, following the optimal reasoning process implied the least mental fatigue with fewer missing elements (gaps) with regard to the reference sequence.
To conclude, our experimental results showed that both students’ gaze features and brain activity were related to their analytical performance in medical case solving (i.e., correctness and number of attempts per case). More precisely, we have found that learners’ visual scanpaths’ alignment metrics (similarity score, matches, mismatches and gaps), along with EEG data (mental state, engagement and cognitive load indexes), were significantly correlated to learners’ diagnosis performance. Our results also showed that there were statistically significant correlations between learners’ gaze and mental behaviour. More specifically, we have found that learners’ visual path metrics were significantly correlated to their mental engagement and cognitive load levels.
5. Discussion and Conclusions
In this paper, we described our approach to assessing learners’ visual behaviour and brain activity during clinical reasoning. More precisely, we used gaze data to assess learners’ visual focus through fixation duration metrics on task-relevant elements of the screen: Areas of Interest (AOI) in the system’s interface, including patient information, antecedents, symptoms, and analysis diagnosis and treatment. In order to account for the sequential property of eye movements, learners’ scanpath is recorded to assess the visual path followed over the AOI while solving patient cases. This scanpath is then evaluated according to an optimal reference path (the target reference sequence) using the Smith–Waterman algorithm. From the EEG data, two brain indexes are computed, namely mental engagement and workload, through EEG frequency band power analysis and a Gaussian Regression model.
An experimental protocol was conducted to record eye tracking and EEG data from 15 undergraduate medical students while they interacted with a hospital simulation environment and solved medical cases. Results showed that both sensors provide highly valuable information for monitoring learners’ external behaviour through gaze recording and cognitive state through EEG sensing. Interesting trends were found showing how these data are related and could be used for clinical diagnosis assessment. On the one side, we found that fixation-based metrics were not effective as indices of attention or performance assessment but rather reflected mental fatigue. This supports previous research on eye tracking, showing that longer fixation duration is not always a reliable indicator of interest [92]. On the other side, the analysis of the scanpath enabled us to evaluate the analytical process followed during diagnostic reasoning. Significant correlations were found showing how the alignment metrics of the visual scanpath, namely matches, mismatches and gaps, and the similarity score between the scanpath and the optimal reference sequence are related to learners’ performance and brain measurements, including mental state, engagement and workload. Significant correlations were also found between the EEG features and performance.
In summary, both EEG and eye tracking do help understand learners’ behaviour within clinical reasoning. This remains true in the medical context but also in any other learning context. Engagement and workload neural indexes allow for monitoring learners’ cognitive state and assessing their level of mental attention and fatigue. In turn, eye movement properties allow to assess learners’ visual focus and understand the steps followed during problem-solving through scanpath analysis. Compared to previous work that used mainly training and simulation systems’ log files and outcomes to analyze students’ clinical reasoning (e.g., [1,5,6,7]), these results spotlight the effectiveness of gaze metrics tools to accurately track and measure the performance gap between the students and the experts. The interconnection found between students’ reasoning steps, as mapped from their eye focus and movements, and their overall performance proves that eye tracking data analysis has prospects to identify students’ areas of improvement (such as missing or incorrect step identification or unnecessary reasoning steps). The analysis of learners’ internal states through brain activity measurements, i.e., workload and engagement, also confirms the significant connection between optimal cognitive and optimal reasoning conditions. The extraction of such brain indexes during simulation training could also support the instructors in diagnosing students’ fatigue or loss of attention and adjust their feedback, the instruction content or the difficulty level.
These results are in line with various empirical studies that investigated how affective computing helps trace, analyze and understand learners’ behaviour while interacting with serious games [93,94,95]. The integration of cognitive and behavioural sensing technologies considerably increases the level of insight into the learners’ interaction experience. In our study, both EEG and eye tracking helped unveil significant patterns between learners’ cognitive load and attention level and their reasoning ability. Our study also highlights the potential of combining the metrics computed from both EEG and eye tracking sensors to have a multimodal assessment of learners’ behaviour. The complementary nature of the information brought by these two data channels provides a relevant indication about the learners’ internal cognitive state extracted from mental engagement and fatigue levels and external behavioural state tracked through visual focus and gaze path information. We also believe that the techniques used in this study could be generalized and replicated within a different problem-solving context and different AOI. In turn, it should be noted that this study could be enhanced, and several improvements could be made in future research. For instance, at the individual level, although the recruited participants were all novice undergraduate medical students, it is important to mention that the relationships found between students’ performance, eye tracking features and EEG indexes could be mediated by learners’ prior knowledge and performance. For example, better learners would tend to have better performance in general regardless of this particular experiment; they might also tend to be more attentive/less overloaded during the tasks. Other individual characteristics such as gaming skills, personality or gender could cause between-subject variability. Although it is out of the scope of this paper, controlling for such factors could lead to further research on potential mediators of the relationship between diagnosis performance, gaze behaviour and mental state. Further possible inherent factors such as the loss of attention due to the experiment or to external stimuli (such as raising the head, dizziness, etc.) should be controlled as they could impact the correlational results. Another obvious limitation in this work is the rather low sample size; a larger experimental study involving more participants could be conducted to validate these results on a higher sampling. Furthermore, our approach could be revised with the goal of building a tutoring system using both EEG and eye tracking sensors to actively adapt the game’s interventions in order to reduce human error in diagnostic formulations according to the learners’ visual behaviour and brain activity.
Author Contributions
Conceptualization, I.J. and A.B.K.; Data curation, I.J.; Investigation, I.J.; Methodology, I.J. and A.B.K.; Supervision, S.P.L. and C.F.; Validation, C.F.; Writing–original draft, I.J. and M.C.; Writing–review & editing, A.B.K. and S.P.L. All authors have read and agreed to the published version of the manuscript.
Funding
This research was supported by funding from the Social Sciences and Humanities Research Council of Canada (SSHRC), the Natural Sciences and Engineering Research Council of Canada-Collaborative Research and Development (NSERC-CRD) and Beam Me Up (BMU) Inc.
Institutional Review Board Statement
The study was conducted in accordance with the Declaration of Helsinki, and approved by the Ethics Committee of the University of Montreal (protocol CERAS, Comité d’éthique de la recherche en arts et en sciences, certificate CERAS-2015-16-288-D, of 7 April 2016) for studies involving humans.
Informed Consent Statement
Informed consent was obtained from all subjects involved in the study.
Data Availability Statement
The data presented in this study are available in the article.
Conflicts of Interest
The authors declare no conflict of interest.
References
- Coyne, E.; Calleja, P.; Forster, E.; Lin, F. A review of virtual-simulation for assessing healthcare students’ clinical competency. Nurse Educ. Today 2020, 96, 104623. [Google Scholar] [CrossRef] [PubMed]
- Thomas, A.; Lubarsky, S.; Varpio, L.; Durning, S.J.; Young, M.E. Scoping reviews in health professions education: Challenges, considerations and lessons learned about epistemology and methodology. Adv. Health Sci. Educ. 2019, 25, 989–1002. [Google Scholar] [CrossRef] [PubMed]
- Singh, M.; Collins, L.; Farrington, R.; Jones, M.; Thampy, H.; Watson, P.; Warner, C.; Wilson, K.; Grundy, J. From principles to practice: Embedding clinical reasoning as a longitudinal curriculum theme in a medical school programme. Diagnosis 2021, 9, 184–194. [Google Scholar] [CrossRef]
- Charlin, B.; Lubarsky, S.; Millette, B.; Crevier, F.; Audétat, M.-C.; Charbonneau, A.; Fon, N.C.; Hoff, L.; Bourdy, C. Clinical reasoning processes: Unravelling complexity through graphical representation. Med Educ. 2012, 46, 454–463. [Google Scholar] [CrossRef]
- Chon, S.-H.; Timmermann, F.; Dratsch, T.; Schuelper, N.; Plum, P.; Berlth, F.; Datta, R.R.; Schramm, C.; Haneder, S.; Späth, M.R.; et al. Serious Games in Surgical Medical Education: A Virtual Emergency Department as a Tool for Teaching Clinical Reasoning to Medical Students. JMIR Serious Games 2019, 7, 13028. [Google Scholar] [CrossRef] [PubMed]
- Mäkinen, H.; Haavisto, E.; Havola, S.; Koivisto, J.-M. User experiences of virtual reality technologies for healthcare in learning: An integrative review. Behav. Inf. Technol. 2020, 41, 1–17. [Google Scholar] [CrossRef]
- Stenseth, H.V.; Steindal, S.A.; Solberg, M.T.; Ølnes, M.A.; Mohallem, A.; Sørensen, A.L.; Strandell-Laine, C.; Olaussen, C.; Aure, C.F.; Riegel, F.; et al. Simulation-Based Learning Supported by Technology to Enhance Critical Thinking in Nursing Students: Protocol for a Scoping Review. JMIR Res. Protoc. 2022, 11, 36725. [Google Scholar] [CrossRef]
- Zhonggen, Y. A Meta-Analysis of Use of Serious Games in Education over a Decade. Int. J. Comput. Games Technol. 2019, 2019, 4797032. [Google Scholar] [CrossRef]
- Havola, S.; Haavisto, E.; Mäkinen, H.; Engblom, J.; Koivisto, J.-M. The Effects of Computer-Based Simulation Game and Virtual Reality Simulation in Nursing Students’ Self-evaluated Clinical Reasoning Skills. CIN Comput. Inform. Nurs. 2021, 39, 725–735. [Google Scholar] [CrossRef]
- Streicher, A.; Smeddinck, J.D. Personalized and adaptive serious games. In Entertainment Computing and Serious Games; Dörner, R., Göbel, S., Kickmeier-Rust, M., Masuch, M., Zweig, K., Eds.; Springer: Cham, Switzerland, 2016; pp. 332–377. [Google Scholar]
- Wagner, C.; Liu, L. Creating Immersive Learning Experiences: A Pedagogical Design Perspective. In Creative and Collaborative Learning through Immersion. Creativity in the Twenty First Century; Hui, A., Wagner, C., Eds.; Springer: Cham, Switzerland, 2021. [Google Scholar] [CrossRef]
- Hendrix, M.; Bellamy-Wood, T.; McKay, S.; Bloom, V.; Dunwell, I. Implementing Adaptive Game Difficulty Balancing in Serious Games. IEEE Trans. Games 2018, 11, 320–327. [Google Scholar] [CrossRef]
- Bellotti, F.; Berta, R.; De Gloria, A. Designing Effective Serious Games: Opportunities and Challenges for Research. Int. J. Emerg. Technol. Learn. (IJET) 2010, 5, 22. [Google Scholar] [CrossRef]
- Hu, B.; Shen, J.; Zhu, L.; Dong, Q.; Cai, H.; Qian, K. Fundamentals of Computational Psychophysiology: Theory and Methodology. IEEE Trans. Comput. Soc. Syst. 2022, 9, 349–355. [Google Scholar] [CrossRef]
- Dalton, C. Interaction Design in the Built Environment: Designing for the ‘Universal User’. Stud. Health Technol. Inform. 2016, 229, 314–323. [Google Scholar]
- Picard, R. Affective Computing; MIT Press: Cambridge, MA, USA, 1997. [Google Scholar]
- Bosch, N.; D’Mello, S.K.; Ocumpaugh, J.; Baker, R.S.; Shute, V. Using Video to Automatically Detect Learner Affect in Computer-Enabled Classrooms. ACM Trans. Interact. Intell. Syst. 2016, 6, 1–26. [Google Scholar] [CrossRef]
- Harley, J.M.; Jarrell, A.; Lajoie, S.P. Emotion regulation tendencies, achievement emotions, and physiological arousal in a medical diagnostic reasoning simulation. Instr. Sci. 2019, 47, 151–180. [Google Scholar] [CrossRef]
- Ben Khedher, A.; Jraidi, I.; Frasson, C. Static and dynamic eye movement metrics for students’ performance assessment. Smart Learn. Environ. 2018, 5, 14. [Google Scholar] [CrossRef]
- Gevins, A.; Smith, M.E. Neurophysiological measures of cognitive workload during human-computer interaction. Theor. Issues Ergon. Sci. 2003, 4, 113–131. [Google Scholar] [CrossRef]
- Le, Y.; Liu, J.; Deng, C.; Dai, D.Y. Heart rate variability reflects the effects of emotional design principle on mental effort in multimedia learning. Comput. Hum. Behav. 2018, 89, 40–47. [Google Scholar] [CrossRef]
- Elbattah, M.; Carette, R.; Dequen, G.; Guerin, J.-L.; Cilia, F. Learning Clusters in Autism Spectrum Disorder: Image-Based Clustering of Eye-Tracking Scanpaths with Deep Autoencoder. In Proceedings of the 41st Annual International Conference of the IEEE Engineering in Medicine and Biology Society (EMBC), Berlin, Germany, 23–27 July 2019; pp. 1417–1420. [Google Scholar] [CrossRef]
- Sawyer, R.; Smith, A.; Rowe, J.; Azevedo, R.; Lester, J. Enhancing Student Models in Game-based Learning with Facial Expression Recognition. In Proceedings of the 25th Conference on User Modeling017, Adaptation and Personalization, Bratislava, Slovakia, 9–12 July 2017; pp. 192–201. [Google Scholar] [CrossRef]
- Khedher, A.B.; Jraidi, I.; Frasson, C. What can eye movement patterns reveal about learners’ performance? In Proceedings of the 14th International Conference on Intelligent Tutoring Systems (ITS 2018), Montreal, QC, Canada, 11–15 June 2018; Springer: Cham, Switzerland, 2018. [Google Scholar]
- Hunter, M.; Mach, Q.H.; Grewal, R.S. The relationship between scan path direction and cognitive processing. In Proceedings of the Third Conference on Computer Science and Software Engineering, Montréal, QC, Canada, 19 May 2010; pp. 97–100. [Google Scholar]
- Mohammadhasani, N.; Caprì, T.; Nucita, A.; Iannizzotto, G.; Fabio, R.A. Atypical Visual Scan Path Affects Remembering in ADHD. J. Int. Neuropsychol. Soc. 2020, 26, 557–566. [Google Scholar] [CrossRef] [PubMed]
- Chandra, S.; Sharma, G.; Malhotra, S.; Jha, D.; Mittal, A.P. Eye tracking based human computer interaction: Applications and their uses. In Proceedings of the International Conference on Man a1&nd Macshine Interfacing (MAMI), Bhubaneswar, India, 17–19 December 2015; pp. 1–5. [Google Scholar] [CrossRef]
- Wang, C.-Y.; Tsai, M.-J.; Tsai, C.-C. Multimedia recipe reading: Predicting learning outcomes and diagnosing cooking interest using eye-tracking measures. Comput. Hum. Behav. 2016, 62, 9–18. [Google Scholar] [CrossRef]
- D’Mello, S.; Olney, A.; Williams, C.; Hays, P. Gaze tutor: A gaze-reactive intelligent tutoring system. Int. J. Hum. Comput. Stud. 2012, 70, 377–398. [Google Scholar] [CrossRef]
- Lallé, S.; Toker, D.; Conati, C.; Carenini, G. Prediction of Users’ Learning Curves for Adaptation while Using an Information Visualization. In Proceedings of the 20th International Conference on Intelligent User Interfaces, Atlanta, GA, USA, 29 March–1 April 2015. [Google Scholar] [CrossRef]
- Lum, H.C.; Greatbatch, R.L.; Waldfogle, G.E.; Benedict, J.D.; Nembhard, D.A. The Relationship of Eye Movement, Workload, and Attention on Learning in a Computer-Based Training Program. In Proceedings of the Human Factors and Ergonomics Society Annual Meeting, Washington, DC, USA, 19–23 April 2016; pp. 1477–1481. [Google Scholar] [CrossRef]
- Ben Khedher, A.; Frasson, C. Predicting User Learning Performance From Eye Movements During Interaction With a Serious Game. In Proceedings of the EdMedia + Innovate Learning 2016, Vancouver, BC, Canada, 28 June 2016; pp. 1504–1511. [Google Scholar]
- Pachman, M.; Arguel, A.; Lockyer, L.; Kennedy, G.; Lodge, J. Eye tracking and early detection of confusion in digital learning environments: Proof of concept. Australas. J. Educ. Technol. 2016, 32, 58–71. [Google Scholar] [CrossRef]
- Day, R.-F. Examining the validity of the Needleman–Wunsch algorithm in identifying decision strategy with eye-movement data. Decis. Support Syst. 2010, 49, 396–403. [Google Scholar] [CrossRef]
- Glöckner, A.; Herbold, A.-K. An eye-tracking study on information processing in risky decisions: Evidence for compensatory strategies based on automatic processes. J. Behav. Decis. Mak. 2010, 24, 71–98. [Google Scholar] [CrossRef]
- Su, Y.; Rao, L.-L.; Sun, H.-Y.; Du, X.-L.; Li, X.; Li, S. Is making a risky choice based on a weighting and adding process? An eye-tracking investigation. J. Exp. Psychol. Learn. Mem. Cogn. 2013, 39, 1765–1780. [Google Scholar] [CrossRef] [PubMed]
- Altmann, G.T.M.; Kamide, Y. “Discourse-mediation of the mapping between language and the visual world”: Eye movements and mental representation. Cognition 2009, 111, 55–71. [Google Scholar] [CrossRef]
- Blascheck, T.; Kurzhals, K.; Raschke, M.; Burch, M.; Weiskopf, D.; Ertl, T. State-of-the-Art of Visualization for Eye Tracking Data. In Eurographics Conference on Visualization (EuroVis); The Eurographics Association: Munich, Germany, 2014. [Google Scholar]
- Duchowski, A.T.; Driver, J.; Jolaoso, S.; Tan, W.; Ramey, B.N.; Robbins, A. Scanpath comparison revisited. In Proceedings of the 2010 Symposium on Eye-Tracking Research & Applications, Austin, TX, USA, 22–24 March 2010; pp. 219–226. [Google Scholar]
- Susac, A.; Bubic, A.; Kaponja, J.; Planinic, M.; Palmovic, M. Eye Movements Reveal Students’ Strategies in Simple Equation Solving. Int. J. Sci. Math. Educ. 2014, 12, 555–577. [Google Scholar] [CrossRef]
- Byun, J.; Loh, C.; Zhou, T. Assessing play-learners’ performance in serious game environments by using In Situ data: Using eye tracking for Serious Game Analytics. In Proceedings of the Annual Conference of the Association for Educational Communications and Technology (AECT), Jacksonville, FL, USA, 4–8 November 2014. [Google Scholar]
- Ho, H.N.J.; Tsai, M.-J.; Wang, C.-Y.; Tsai, C.-C. Prior Knowledge and Online Inquiry-Based Science Reading: Evidence from Eye Tracking. Int. J. Sci. Math. Educ. 2013, 12, 525–554. [Google Scholar] [CrossRef]
- Lee, W.-K.; Wu, C.-J. Eye Movements in Integrating Geometric Text and Figure: Scanpaths and Given-New Effects. Int. J. Sci. Math. Educ. 2017, 16, 699–714. [Google Scholar] [CrossRef]
- Berka, C.; Levendowski, D.J.; Cvetinovic, M.M.; Petrovic, M.M.; Davis, G.; Lumicao, M.N.; Zivkovic, V.T.; Popovic, M.V.; Olmstead, R. Real-Time Analysis of EEG Indexes of Alertness, Cognition, and Memory Acquired With a Wireless EEG Headset. Int. J. Hum. Comput. Interact. 2004, 17, 151–170. [Google Scholar] [CrossRef]
- Wang, H.; Li, Y.; Hu, X.; Yang, Y.; Meng, Z.; Chang, K. Using EEG to Improve Massive Open Online Courses Feedback Interaction. In Proceedings of the AIED Workshops, Memphis, TN, USA, 9–13 July 2013. [Google Scholar]
- Workshop on Utilizing EEG Input in Intelligent Tutoring Systems. Available online: https://sites.google.com/site/its2014wseeg/ (accessed on 1 June 2022).
- Chen, C.-M.; Wang, J.-Y.; Yu, C.-M. Assessing the attention levels of students by using a novel attention aware system based on brainwave signals. Br. J. Educ. Technol. 2017, 48, 348–369. [Google Scholar] [CrossRef]
- Lin, F.-R.; Kao, C.-M. Mental effort detection using EEG data in E-learning contexts. Comput. Educ. 2018, 122, 63–79. [Google Scholar] [CrossRef]
- Berka, C.; Levendowski, D.J.; Ramsey, C.K.; Davis, G.; Lumicao, M.N.; Stanney, K.; Reeves, L.; Regli, S.H.; Tremoulet, P.D.; Stibler, K. Evaluation of an EEG workload model in an Aegis simulation environment. In Proceedings Volume 5797, Biomonitoring for Physiological and Cognitive Performance during Military Operations; SPIE Press: Bellingham, WA, USA, 2005; pp. 90–99. [Google Scholar] [CrossRef]
- Berka, C.; Levendowski, D.J.; Lumicao, M.N.; Alan, Y.; Davis, G.; Zivkovic, V.T.; Olmstead, R.E.; Tremoulet, P.D.; Graven, P.L. EEG Correlates of Task Engagement and Mental Workload in Vigilance, Learning, and Memory Tasks. Aviation Space Environ. Med. 2007, 78, B231–B244. [Google Scholar]
- Mills, C.; Fridman, I.; Soussou, W.; Waghray, D.; Olney, A.M.; D’Mello, S.K. Put your thinking cap on: Detecting cognitive load using EEG during learning. In Proceedings of the Seventh International Learning Analytics & Knowledge Conference, Vancouver, BC, Canada, 13–17 March 2017; pp. 80–89. [Google Scholar]
- Pope, A.T.; Bogart, E.H.; Bartolome, D.S. Biocybernetic system evaluates indices of operator engagement in automated task. Biol. Psychol. 1995, 40, 187–195. [Google Scholar] [CrossRef]
- Alimardani, M.; Braak, S.V.D.; Jouen, A.-L.; Matsunaka, R.; Hiraki, K. Assessment of Engagement and Learning During Child-Robot Interaction Using EEG Signals. In Social Robotics. ICSR 2021. Lecture Notes in Computer Science; Springer: Cham, Switzerland, 2021; pp. 671–682. [Google Scholar] [CrossRef]
- Chanel, G.; Rebetez, C.; Bétrancourt, M.; Pun, T. Emotion Assessment From Physiological Signals for Adaptation of Game Difficulty. IEEE Trans. Syst. Man Cybern.-Part A Syst. Hum. 2011, 41, 1052–1063. [Google Scholar] [CrossRef]
- Jraidi, I.; Chaouachi, M.; Frasson, C. A dynamic multimodal approach for assessing learners’ interaction experience. In Proceedings of the 15th ACM on International Conference on Multimodal Interaction, Sydney, Australia, 9–13 December 2013; pp. 271–278. [Google Scholar]
- Szafir, D.; Mutlu, B. Artful: Adaptive review technology for flipped learning. In Proceedings of the SIGCHI Conference on Human Factors in Computing Systems, Paris, France, 7 April 2013–2 May 2013; pp. 1001–1010. [Google Scholar]
- Apicella, A.; Arpaia, P.; Frosolone, M.; Improta, G.; Moccaldi, N.; Pollastro, A. EEG-based measurement system for monitoring student engagement in learning 4.0. Sci. Rep. 2022, 12, 5857. [Google Scholar] [CrossRef] [PubMed]
- Rashid, N.A.; Taib, M.N.; Lias, S.; Sulaiman, N.; Murat, Z.H.; Kadir, R.S.S.A. Learners’ Learning Style Classification related to IQ and Stress based on EEG. Procedia Soc. Behav. Sci. 2011, 29, 1061–1070. [Google Scholar] [CrossRef][Green Version]
- van der Hiele, K.; Vein, A.; Reijntjes, R.; Westendorp, R.; Bollen, E.; van Buchem, M.; van Dijk, J.; Middelkoop, H. EEG correlates in the spectrum of cognitive decline. Clin. Neurophysiol. 2007, 118, 1931–1939. [Google Scholar] [CrossRef]
- Lujan-Moreno, G.A.; Atkinson, R.; Runger, G. EEG-based user performance prediction using random forest in a dynamic learning environment. In Intelligent Tutoring Systems: Structure, Applications and Challenges; Nova Science Publishers, Inc.: Hauppauge, NY, USA, 2016; pp. 105–128. [Google Scholar]
- Szafir, D.; Mutlu, B. Pay attention! designing adaptive agents that monitor and improve user engagement. In Proceedings of the SIGCHI Conference on Human Factors in Computing Systems, Austin, TX, USA, 5–10 May 2012; pp. 11–20. [Google Scholar]
- Chaouachi, M.; Jraidi, I.; Frasson, C. MENTOR: A Physiologically Controlled Tutoring System. In User Modeling, Adaptation and Personalization, Proceedings of the 23rd International Conference, UMAP 2015, Dublin, Ireland, 29 June–3 July 2015; Ricci, F., Bontcheva, K., Conlan, O., Lawless, S., Eds.; Springer International Publishing: Cham, Switzerland, 2015; pp. 56–67. [Google Scholar]
- Brouwer, A.-M.; Hogervorst, M.A.; Oudejans, B.; Ries, A.J.; Touryan, J. EEG and Eye Tracking Signatures of Target Encoding during Structured Visual Search. Front. Hum. Neurosci. 2017, 11. [Google Scholar] [CrossRef]
- Slanzi, G.; Balazs, J.A.; Velásquez, J.D. Combining eye tracking, pupil dilation and EEG analysis for predicting web users click intention. Inf. Fusion 2017, 35, 51–57. [Google Scholar] [CrossRef]
- Alhasan, K.; Chen, L.; Chen, F. An Experimental Study of Learning Behaviour in an ELearning Environment. In Proceedings of the IEEE 20th International Conference on High Performance Computing and Communications & IEEE 16th International Conference on Smart City & IEEE 4th International Conference on Data Science and Systems (HPCC/SmartCity/DSS), Exeter, UK, 28–30 June 2018; pp. 1398–1403. [Google Scholar]
- Muldner, K.; Burleson, W. Utilizing sensor data to model students’ creativity in a digital environment. Comput. Hum. Behav. 2015, 42, 127–137. [Google Scholar] [CrossRef]
- El-Abbasy, K.; Angelopoulou, A.; Towell, T. Measuring the Engagement of the Learner in a Controlled Environment using Three Different Biosensors. In Proceedings of the 10th International Conference on Computer Supported Education, Madeira, Portugal, 15–17 March 2018; pp. 278–284. [Google Scholar] [CrossRef]
- Makransky, G.; Terkildsen, T.; Mayer, R.E. Role of subjective and objective measures of cognitive processing during learning in explaining the spatial contiguity effect. Learn. Instr. 2019, 61, 23–34. [Google Scholar] [CrossRef]
- Jraidi, I.; Khedher, A.B.; Chaouachi, M. Assessing Students’ Clinical Reasoning Using Gaze and EEG Features. Intelligent Tutoring Systems. In ITS 2019. Lecture Notes in Computer Science; Coy, A., Hayashi, Y., Chang, M., Eds.; Springer: Cham, Switzerland, 2019. [Google Scholar]
- Khedher, A.B.; Jraidi, I.; Frasson, C. Tracking Students’ Analytical Reasoning Using Visual Scan Paths. In Proceedings of the 2017 IEEE 17th International Conference on Advanced Learning Technologies (ICALT), Mumbai, India, 9–13 July 2017; pp. 53–54. [Google Scholar]
- Kardan, S.; Conati, C. Exploring Gaze Data for Determining User Learning with an Interactive Simulation. In Proceedings of the. 20th International Conference on User Modeling, Adaptation, and Personalization, Montreal, QC, Canada, 16–20 July 2012. [Google Scholar] [CrossRef]
- Toker, D.; Conati, C.; Steichen, B.; Carenini, G. Individual user characteristics and information visualization: Connecting the dots through eye tracking. In Proceedings of the SIGCHI Conference on Human Factors in Computing Systems, Paris, France, 27 April 2013; pp. 295–304. [Google Scholar]
- Khedher, A.B.; Jraidi, I.; Frasson, C. Exploring Students’ Eye Movements to Assess Learning Performance in a Serious Game. In EdMedia + Innovate Learning: Association for the Advancement of Computing in Education; Association for the Advancement of Computing in Education (AACE): Waynesville, NC, USA, 2018; pp. 394–401. [Google Scholar]
- Green, M.; Williams, L.; Davidson, D. Visual scanpaths and facial affect recognition in delusion-prone individuals: Increased sensitivity to threat? Cogn. Neuropsychiatry 2003, 8, 19–41. [Google Scholar] [CrossRef]
- Noton, D.; Stark, L. Eye movements and visual perception. Sci. Am. 1971, 224, 35–43. [Google Scholar]
- Goldberg, J.H.; Helfman, J.I. Visual scanpath representation. In Proceedings of the 2010 Symposium on Eye-Tracking Research & Applications (ETRA ‘10), Austin, TX, USA, 22–24 March 2010; Association for Computing Machinery: New York, NY, USA; pp. 203–210. [Google Scholar] [CrossRef]
- Cristino, F.; Mathôt, S.; Theeuwes, J.; Gilchrist, I.D. ScanMatch: A novel method for comparing fixation sequences. Behav. Res. Methods 2010, 42, 692–700. [Google Scholar] [CrossRef]
- Eraslan, S.; Yesilada, Y. Patterns in eyetracking scanpaths and the affecting factors. J. Web Eng. 2015, 14, 363–385. [Google Scholar]
- Liversedge, S.P.; Findlay, J.M. Saccadic eye movements and cognition. Trends Cogn. Sci. 2000, 4, 6–14. [Google Scholar] [CrossRef]
- Smith, T.F.; Waterman, M.S. Identification of common molecular subsequences. J. Mol. Biol. 1981, 147, 195–197. [Google Scholar] [CrossRef]
- Setubal, J.; Meidanis, J. Introduction to Computational Molecular; PWS Publishing Company: Biology, MA, USA, 1997. [Google Scholar]
- Swanson, H.L.; O’Connor, J.E.; Cooney, J.B. An Information Processing Analysis of Expert and Novice Teachers’ Problem Solving. Am. Educ. Res. J. 1990, 27, 533–556. [Google Scholar] [CrossRef]
- Khedher, A.B.; Jraidi, I.; Frasson, C. Local Sequence Alignment for Scan Path Similarity Assessment. Int. J. Inf. Educ. Technol. 2018, 8, 482–490. [Google Scholar] [CrossRef]
- Jasper, H.H. The ten-twenty electrode system of the International Federation. Electroencephalogr. Clin. Neurophysiol. 1958, 10, 371–375. [Google Scholar]
- Freeman, F.G.; Mikulka, P.J.; Prinzel, L.J.; Scerbo, M.W. Evaluation of an adaptive automation system using three EEG indices with a visual tracking task. Biol. Psychol. 1999, 50, 61–76. [Google Scholar] [CrossRef]
- Freeman, F.G.; Mikulka, P.J.; Scerbo, M.W.; Prinzel, L.J.; Clouatre, K. Evaluation of a Psychophysiologically Controlled Adaptive Automation System, Using Performance on a Tracking Task. Appl. Psychophysiol. Biofeedback 2000, 25, 103–115. [Google Scholar] [CrossRef] [PubMed]
- Parasuraman, R.; Caggiano, D. Mental workload. Encycl. Hum. Brain 2002, 3, 17–27. [Google Scholar]
- Chaouachi, M.; Jraidi, I.; Frasson, C. Modeling Mental Workload Using EEG Features for Intelligent Systems. In User Modeling, Adaption and Personalization, Lecture Notes in Computer Science; Konstan, J.A., Conejo, R., Marzo, J.L., Oliver, N., Eds.; Springer: Berlin/Heidelberg, Germany, 2011; pp. 50–61. [Google Scholar] [CrossRef]
- Hart, S.G.; Staveland, L.E. Development of NASA-TLX (Task Load Index): Results of Empirical and Theoretical Research. In Human mental Workload; Hancock, P.A., Meshkati, N., Eds.; North-Holland: Amsterdam, The Netherlands, 1988; pp. 139–183. [Google Scholar]
- Rasmussen, C.E.; Williams, C.K.I. Gaussian Processes for Machine Learning; MIT Press: Cambridge, MA, USA, 2006. [Google Scholar]
- Chaouachi, M.; Jraidi, I.; Lajoie, S.P.; Frasson, C. Enhancing the Learning Experience Using Real-Time Cognitive Evaluation. Int. J. Inf. Educ. Technol. 2019, 9, 678–688. [Google Scholar] [CrossRef]
- Djamasbi, S. Eye Tracking and Web Experience. AIS Trans. Hum.-Comput. Interact. 2014, 6, 37–54. [Google Scholar] [CrossRef]
- Antoniou, P.E.; Arfaras, G.; Pandria, N.; Athanasiou, A.; Ntakakis, G.; Babatsikos, E.; Nigdelis, V.; Bamidis, P. Biosensor Real-Time Affective Analytics in Virtual and Mixed Reality Medical Education Serious Games: Cohort Study. JMIR Serious Games 2020, 8, 17823. [Google Scholar] [CrossRef] [PubMed]
- Moussa, M.B.; Magnenat-Thalmann, N. Applying Affect Recognition in Serious Games: The PlayMancer Project. In Proceedings of the International Workshop on Motion in Games MIG 2009, Zeist, The Netherlands, 21–24 November 2009; Springer: Berlin/Heidelberg, Germany, 2009; pp. 53–62. [Google Scholar]
- Argasiński, J.K.; Węgrzyn, P. Affective patterns in serious games. Futur. Gener. Comput. Syst. 2019, 92, 526–538. [Google Scholar] [CrossRef]


Publisher’s Note: MDPI stays neutral with regard to jurisdictional claims in published maps and institutional affiliations. |
© 2022 by the authors. Licensee MDPI, Basel, Switzerland. This article is an open access article distributed under the terms and conditions of the Creative Commons Attribution (CC BY) license (https://creativecommons.org/licenses/by/4.0/).