Article

Multivariate Peristalsis in a Straight Rectangular Duct for Carreau Fluids

by
Iosif C. Moulinos
*,
Christos Manopoulos
and
Sokrates Tsangaris
Biofluid Mechanics & Biomedical Engineering Laboratory, School of Mechanical Engineering, National Technical University of Athens, 15780 Athens, Greece
*
Author to whom correspondence should be addressed.
Computation 2024, 12(3), 62; https://doi.org/10.3390/computation12030062
Submission received: 17 February 2024 / Revised: 11 March 2024 / Accepted: 15 March 2024 / Published: 20 March 2024
(This article belongs to the Section Computational Engineering)

Abstract

:
Peristaltic flow in a straight rectangular duct is examined imposed by contraction pulses implemented by pairs of horizontal cylindrical segments with their axes perpendicular to the flow direction. The wave propagation speed is considered in such a range that triggers a laminar fluid motion. The setting is analyzed over a set of variables which includes the propagation speed, the relative occlusion, the modality of the squeezing pulse profile and the Carreau power index. The numerical solution of the equations of motion on Cartesian meshes is grounded in the immersed boundary method. An increase in the peristaltic pulse modality leads to the reduction in the shear rate levels on the central tube axis and to the movement of the peristaltic characteristics to higher pressure values. The effect of the no slip side walls (NSSWs) is elucidated by the collation with relevant results for the flow field produced under the same assumptions though with slip side walls (SSWs). Shear thinning behavior exhibits a significantly larger effect on transport efficiency for the NSSWs duct than on the SSWs duct.

1. Introduction

Recent research on prediction of peristaltic flow comprises both theoretical and computational approaches. Kalayeh et al. [1] extend the model of Shapiro et al. [2] with a nonuniform boundary condition for the streamwise velocity component on the squeezing wave. Thus, they achieve improved prediction of ureteral peristalsis in comparison with existing models and verify the reduced reflux under the moving wall model. Retrograde flow in urine transportation from the kidneys to the bladder is addressed computationally by Hosseini et al. [3]. For an effective model of the distension contraction waves, a piecewise linear force function is introduced. Takaddus and Chandy [4] use the Eulerian–Lagrangian method for the fluid–structure interaction (FSI) of the urine with the tube wall for the estimation of the effect of the size of obstructions.
Polynomial chaos expansion is applied for uncertainty quantification of the sensitivity of peristalsis performance with respect to the Womersley number, the compression ratio and the compression frequency in a racetrack circulatory system [5]. Sharp [6] attempts to explain brain glymphatic circulation as a superposition of peristaltic motion driven by middle cerebral artery pulses and a longitudinal pressure gradient.
Peristalsis in the presence of a magnetic field has been studied for various types of fluids including such as Casson fluids [7], micropolar nanofluids [8], Prandtl fluids [9,10] Williamson nanofluids [11] and Jeffrey fluids [12]. The recently introduced Cattaneo-Christov model for heat flux, remeding the instantaneous propagation paradox in the theory of heat conduction [13], is studied in peristalsis context by Tanveer et al [14].
Deformation-controlled flow of shear thinning fluids has been considered using an apparatus comprising a straight elastic tube of circular cross-section squeezed by cylindrical rollers [15] in an attempt to mimic the flow in the small intestine [16] and to shed light on biofluid mechanics in the human body [17]. Computational approaches of these experiments has been perfomed for two dimensions [18] and for three dimensions, axisymmetrically, considering toroid peristaltic pulses [19]. The wavelike motion of a model stomach is studied by Alokaily et al. [20], focusing on the mixing flow at the beginning of the digestion. The dispersing characteristics of antral contraction are in vitro investigated using an antrum prototype by Dufour et al. [21], and the drop behavior and breakup under peristalsis are simulated computationally by Feigl and Tanner [22].
Contractive wave flows have been studied for three dimensional rectilinear settings considering slip side walls moving with the velocity of the peristaltic wave for non-Newtonian fluids [23,24,25]. The case of shear-dependent fluid peristalsis in a straight rectangular duct with steady side walls has drawn little attention. Al-Habahbeh computationally simulated such a flow induced by cylindrical rollers moving in the flow direction for a Newtonian fluid [18]. Theoretical models for the analysis of peristaltic flows in curved ducts have been presented considering shear thinning fluids [26] or a radial magnetic field originating from the center of the apparatus [27].
The curvilinear immersed boundary method is being implemented for the simulation of incompressible internal and external flows of Newtonian and non-Newtonian fluids in a variety of laminar and turbulent flow applications with either steady or moving boundaries [28,29,30,31,32]. Asgharzedeh and Borazjani, by introducing an analytical Jacobian for Newton–Krylov methods, simulate the Taylor–Green vortex, the horizontal oscillations of a cylinder initially at rest and flow in a 90 bend [33]. They validated their method by comparing with analytical solutions and experimental data, respectively, with satisfying outcomes in contrast with those of body fitted methods. Near-wall turbulence in corresponding channel flows is investigated by Liao et al. [34], and good agreement is found for velocity and pressure fluctuations with results of classical methods, where the boundary of the computational grid coincides with that of the flow domain.
In this paper, we delve into the peristaltic motion of Carreau fluids in a rectangular duct, driven by contraction pulses generated by multiple consecutive identical pairs of cylindrical segments. The results of the endeavor contribute to our knowledge on peristalsis in a rectilinear duct of fixed width with steady walls for this category of generalized Newtonian fluids and the respective medical and industrial applications. Continuing a line of research on the setting [16,18,19,20,35], a monothetic analysis of the peristaltic characteristic quantities is presented. The need for this approach is evident from the significant amount of resources demanded for dealing with a singular instance of the problem in combination with the multiple factors examined, leading to the adverse effects of the curse of dimensionality. Starting from a benchmark baseline case of a single-segment convex pulse squeezing wave with fixed wave velocity and relative occlusion (RO), for Newtonian fluids, a sensitivity analysis considering these parameters is performed. Moreover, the effect of the presence of the side walls is examined based on existing results for the analogous case in the absence of side walls. For the integration of the flow dynamics equations, the curvilinear immersed boundary method is applied [36].

2. Materials and Methods

2.1. Problem Formulation

The number of cylindrical segments of each peristaltic pulse, namely, of the peristaltic waveshape, is symbolized by m (modality). A sketch of the rectangular cross-section linear duct under the squeeze of the peristaltic wave consisting of two cylindrical segment pulses (bimodal pulse, m = 2 ) is shown in Figure 1. The upper half setting is presented as defined by the horizontal plane of symmetry, namely, the xz plane y = 0 .
With reference to relevant experiments, computational simulations are performed for carboxymethyl–cellulose aqueous solution at 1.5 % w / w with 0.1 M NaCl and M w = 2.5 · 10 5 g/mol (CMC 1.5 % ) [37]. The shape and size of the pulses and the dimensions of the straight duct are also chosen in accordance with the existing literature [18,35]. Consequently, the values of the fluid properties and of the geometric dimensions of the setting are opted for as in Table 1. Similarly, the parameters of the analysis such as the wave speed and the relative occlusion are instantiated with values for which previous research has been conducted [18,35,38].
The single cylindrical segment contraction wave in Figure 1 is described in the computational domain by the equation
x x c 2 + ( y h r ) 2 = r 2 , y < H , W 2 < z < W 2 ,
where x is the streamwise direction, y is the penetration direction, z is the spanwise direction, H is the half height of the undeformed duct, W is the width of the duct and x c is the x coordinate of the axis of the cylindrical segment, x c = L 2 . Consequently, the maximum chord of the cylindrical segment, R, takes the values 14.96 mm, 24 mm and 26.54 mm for respective values of the relative occlusion 0.2 , 0.6 and 0.8 .
In the following, two cylindrical segments are represented each by Equation (1) with respective centers x c 1 = L / 2 d / 2 R / 2 and x c 2 = L / 2 + d / 2 + R / 2 , for L = 180 mm. Similarly, for three cylindrical segments, the centers for Equation (1) are x c 1 = L / 2 d R , x c 2 = L / 2 and x c 3 = L / 2 + d + R for L = 180 mm.
Considering the base case for the wave propagation speed of the analysis, c = 5 mm/s, the Reynolds number is
R e = ρ c D h μ 0.69 ,
where D h is the hydraulic diameter of the duct
D h = 8 W H 4 H + 2 W = 20 mm .
Hence, no demand for taking into account turbulence arises.

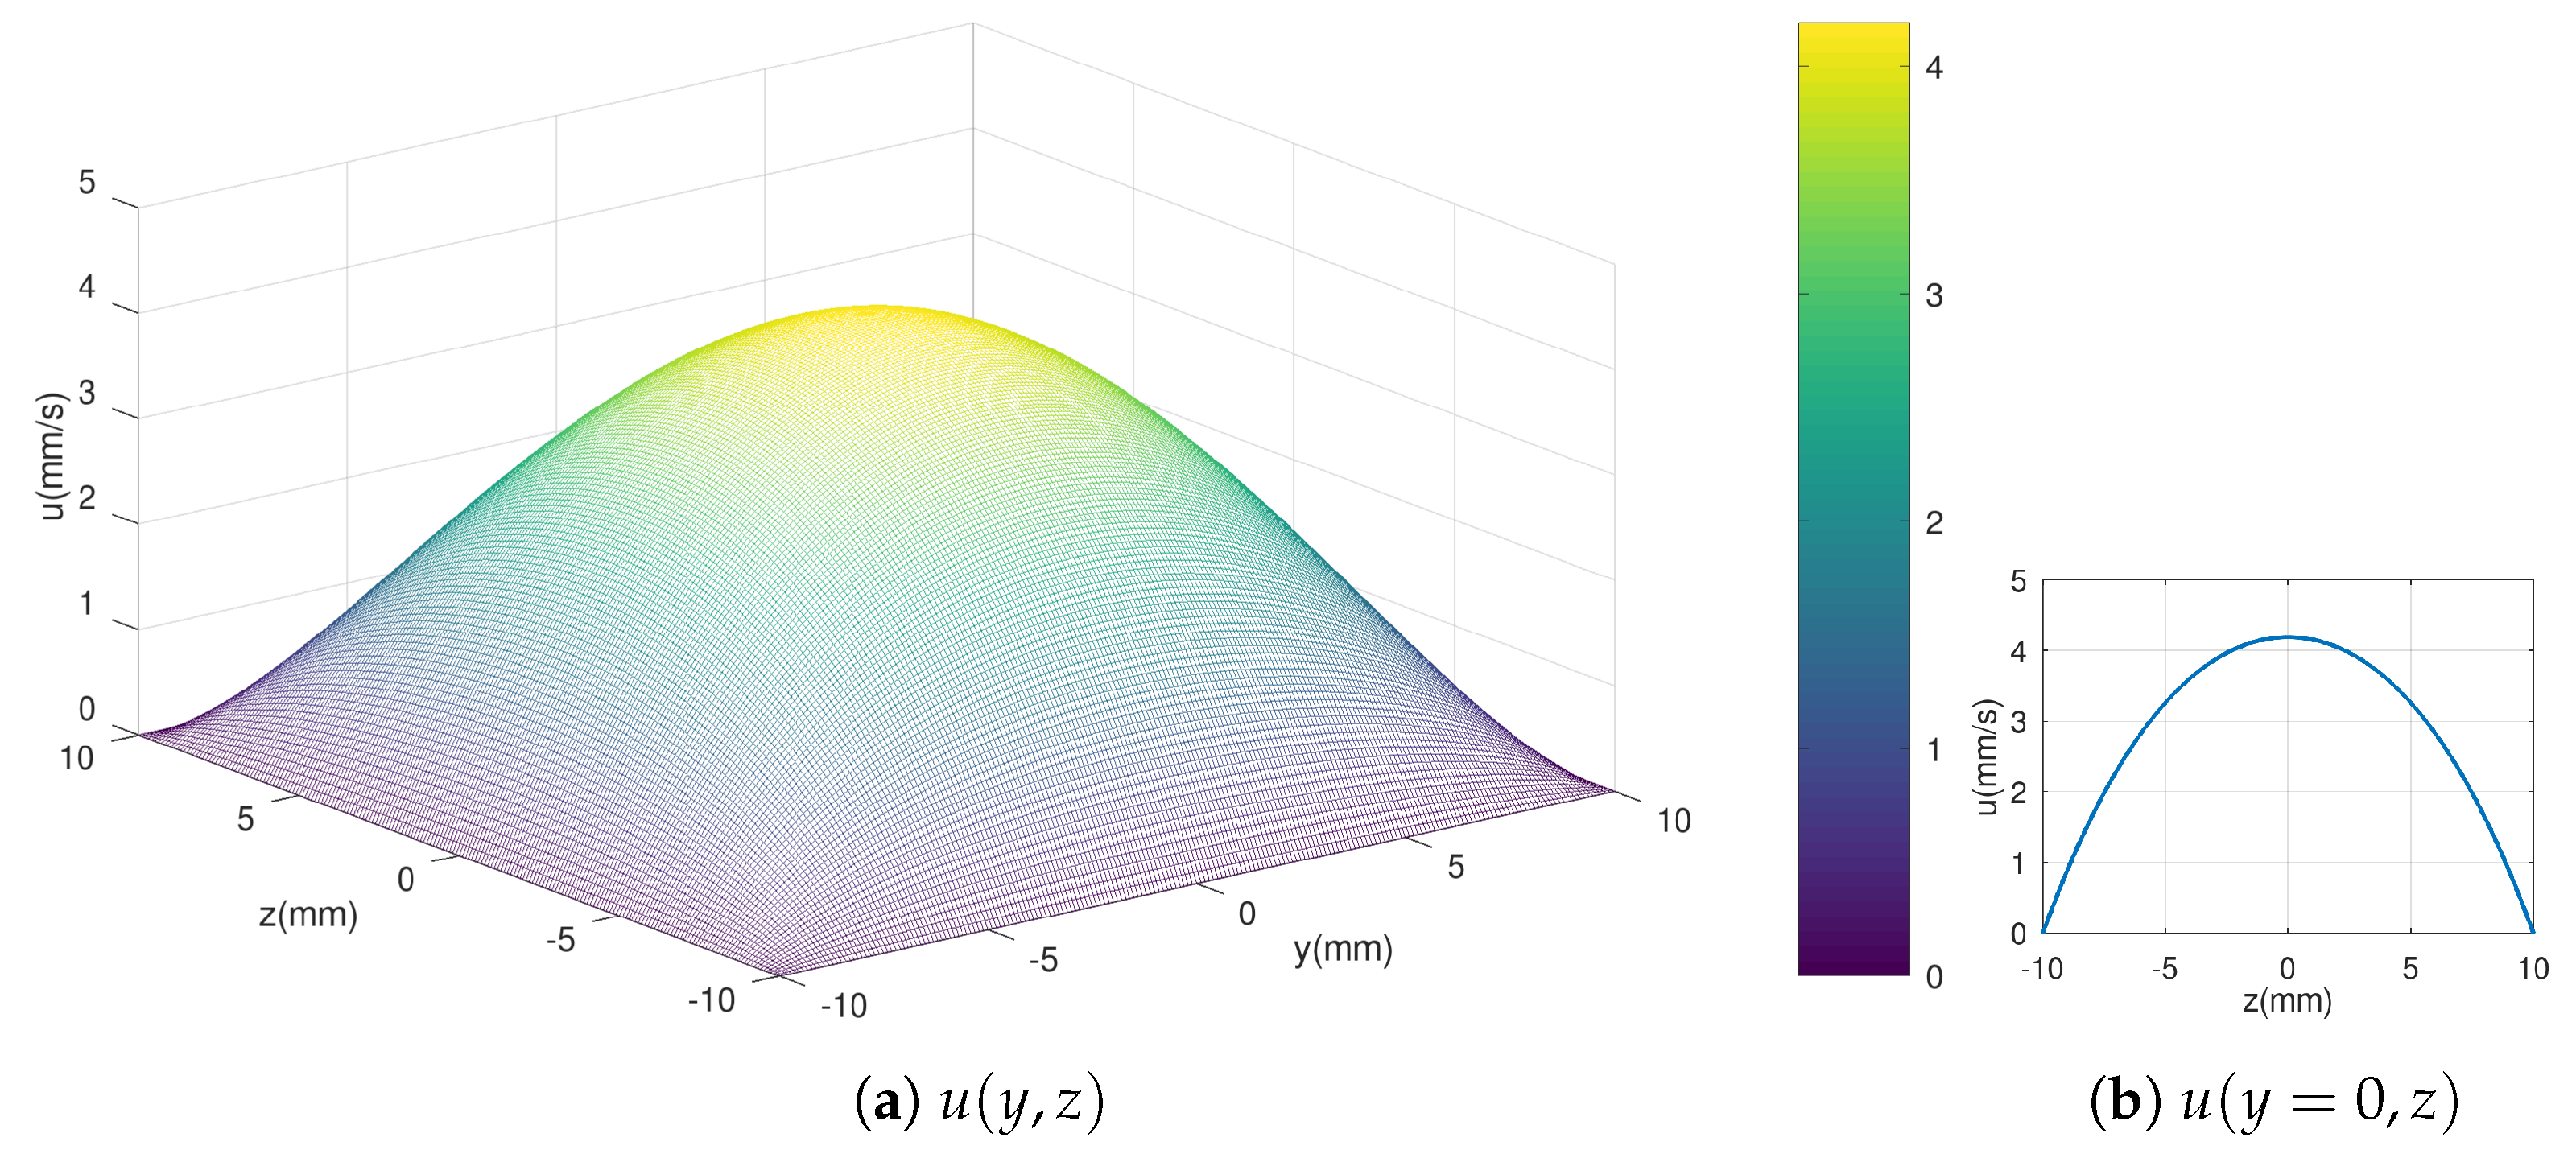
2.2. Governing Equations and Boundary Conditions

The flow is governed by the equations of mass conservation
x y z u v w = 0
and momentum conservation for shear-dependent dynamic viscosity
t u v w + u v w · u x v x w x u y v y w y u z v z w z = 1 ρ p x p y p z + x 2 μ ( γ ˙ ) u x + y μ ( γ ˙ ) u y + v x + z μ ( γ ˙ ) u z + w x x μ ( γ ˙ ) v x + u y + y 2 μ ( γ ˙ ) v y + z μ ( γ ˙ ) v z + w y x μ ( γ ˙ ) w x + u z + y μ ( γ ˙ ) w y + v z + z 2 μ ( γ ˙ ) w z .
In the above expressions, u = ( u , v , w ) is the fluid velocity vector, x = ( x , y , z ) is the position vector, t is time, ρ is the constant density, p is pressure, μ is the dynamic viscosity of the fluid and γ ˙ is the shear rate given as
γ ˙ = 2 ( D : D ) = 2 t r ( D 2 )
where
D = 1 2 ( u ) + u
is the strain rate tensor.
Due to the steady speed of the contraction waveshape propagation, the simulation can be simplified significantly considering the frame of reference of the squeezing curve [39]. At this frame of reference, the velocity of the rigid walls except for the region of the squeezing pulses are equal to minus the wave speed
u ( x , H , z ) = u ( x , H , z ) = c , x { x | y w ( x , z ) < H }
u W 2 , y , z = u W 2 , y , z = c ,
where y w : [ 0 , L ] × [ W 2 , W 2 ] ( 0 , H ] is the function describing the peristaltic waveshape, which is taken as steady with respect to z, and c is the speed of the traveling peristaltic wave. On the region of the peristaltic pulse of the upper and lower wall, the velocity is set to be zero, coinciding with the velocity of the cylindrical segments in the moving frame
u ( x p p , y p p , z p p ) = 0 v ( x p p , y p p , z p p ) = 0 w ( x p p , y p p , z p p ) = 0 ( x p p , y p p , z p p ) S ,
where S is the surface of the cylindrical segments that materialize the peristaltic wave. In the following, cases where on the side walls a no slip boundary condition holds are described with the abbreviation NSSWs, and cases where the side walls are slippery with SSWs.
The examination of the phenomenon of interest is focused on a period of the peristaltic wave, thus reducing the computational domain and consequently the corresponding work (see also [40], Section 2.3). To this end, periodic boundary conditions are applied at the streamwise extreme cross-sections
u ( 0 , y , z ) = u ( L , y , z ) v ( 0 , y , z ) = v ( L , y , z ) w ( 0 , y , z ) = w ( L , y , z ) .
The viscosity and the deformation rate are related through the Carreau–Yasuda model
μ ( γ ˙ ) μ μ 0 μ = ( 1 + ( λ γ ˙ ) α ) n 1 α ,
where μ stands for the infinite shear rate dynamic viscosity, μ 0 stands for the zero shear rate dynamic viscosity and λ stands for the consistency parameter which signifies the shear rate level at which shear dependence emerges. The value α = 2 is chosen as in the initial form of the Carreau equation, as this constant α is only of limited relevance for low shear rates [41]. By this model, the nature of many fluids of interest, such as that of the shear thinning behavior of blood [42] and blood expanders [43] and the shear dilating response of several cryobiologically relevant agents, is captured [44].
The ability of the various peristaltic pulses to create discharge fluid volume rate is estimated by means of the transport efficiency (TE) metric. This ratio compares the outflow end velocity profile to the wave speed uniform velocity profile
T E = W / 2 W / 2 H H u ( L , y , z ) d y d z 2 c H W .
In order for the pumping potential to be examined, the relevant characteristic curves are computed. To achieve this goal, developed velocity profiles are applied at the upstream end of the duct, and the respective pressure elevations across the vessel are predicted. The Poiseuille flow through the geometry under study, derived by solving the Navier–Stokes equations, has the form [45]
u ( 0 , y , z ) = 24 Q π 3 W H 1 96 W π 5 H i { 2 n + 1 | n N } tanh i π H W i 5 1 i { 2 n + 1 | n N } ( 1 ) i 1 2 1 cosh i π y W cosh i π H W cos i π z W i 3 v ( 0 , y , z ) = 0 w ( 0 , y , z ) = 0 ,
where the symbol Q stands for the flow rate through the inlet of the duct. A depiction of the profile is given in Figure 2. At the moving frame of reference, the applied inlet velocity is the profile of Equation (14) minus the relative velocity, that is u ( 0 , y , z ) c .
By applying Equation (14) for varying values of Q along with the zero-velocity derivative at the flow direction at its outlet, we derived the respective characteristic peristaltic curves for the considered configuration.

2.3. Computational Method

The governing equations are handled by use of the immersed boundary method applied with the Virtual Flow Simulator software [46] with the additional feature of Carreau–Yasuda shear dependence for viscosity. Spatial discretization is accomplished via Cartesian meshes with uniform inflation in the region of the contracting pulse excitation area, e.g., for unimodal wave, the region 31 mm x 59 mm. For the cases where the duct length is L = 90 mm, 297 points are placed at the stream direction, and for those with L = 180 mm, 647 points discretize the length of the setting. In the finer part of the grid, its longitudinal density is two times that of the far of the cylindrical segment’s region. A subset of the computational predictions are performed in the half geometry and the rest in the quarter geometry. Proper conditions are chosen at the respective bounding planes
u ( x , y , z ) = u ( x , y , z ) v ( x , y , z ) = v ( x , y , z ) w ( x , y , z ) = w ( x , y , z )
u ( x , y , z ) = u ( x , y , z ) v ( x , y , z ) = v ( x , y , z ) w ( x , y , z ) = w ( x , y , z ) ,
which, under the assumption of continuity of the first partial derivatives with respect to space coordinates of the velocity component functions, lead to
u y x , 0 , z = w y x , 0 , z = v x , 0 , z = 0
u z x , y , 0 = v z x , y , 0 = w x , y , 0 = 0 .
At transverse planes, 104 or 53 points partition the width for half or quarter geometry computation, respectively, and 53 points discretize the half height H of the duct cross-section. Near-wall local inflation is applied for better precision at regions with large flow variable gradients. The time domain is marched with a step size of Δ t = 0.00005 s. The solutions achieved with the implemented space and time discretization are found to be independent of the increase in its resolution.
Simulations were performed via parallel computation using the message passing interface protocol (MPI) on a high-performance computing (HPC) cluster node with 2 physical processors consisting of 8 Intel(R) Xeon(R) CPU E5-2630 v3 @ 2.40 GHz cores each, hyperthreaded (32 logical processors in total) with a cache size of 20,480 kB. Eight to twenty-four logical processors were used for each case. A simulation of Newtonian fluid peristalsis for a single cylindrical segment pulse and L = 90 mm for half geometry demanded a processing time of approximately 240 h.
The convergence rate of the momentum equations for the base case (relative occlusion R O = 0.6 , peristaltic wave speed c = 5 mm s , power index n = 1 , modality m = 1 and length L = 90 mm) is shown in Figure 3.

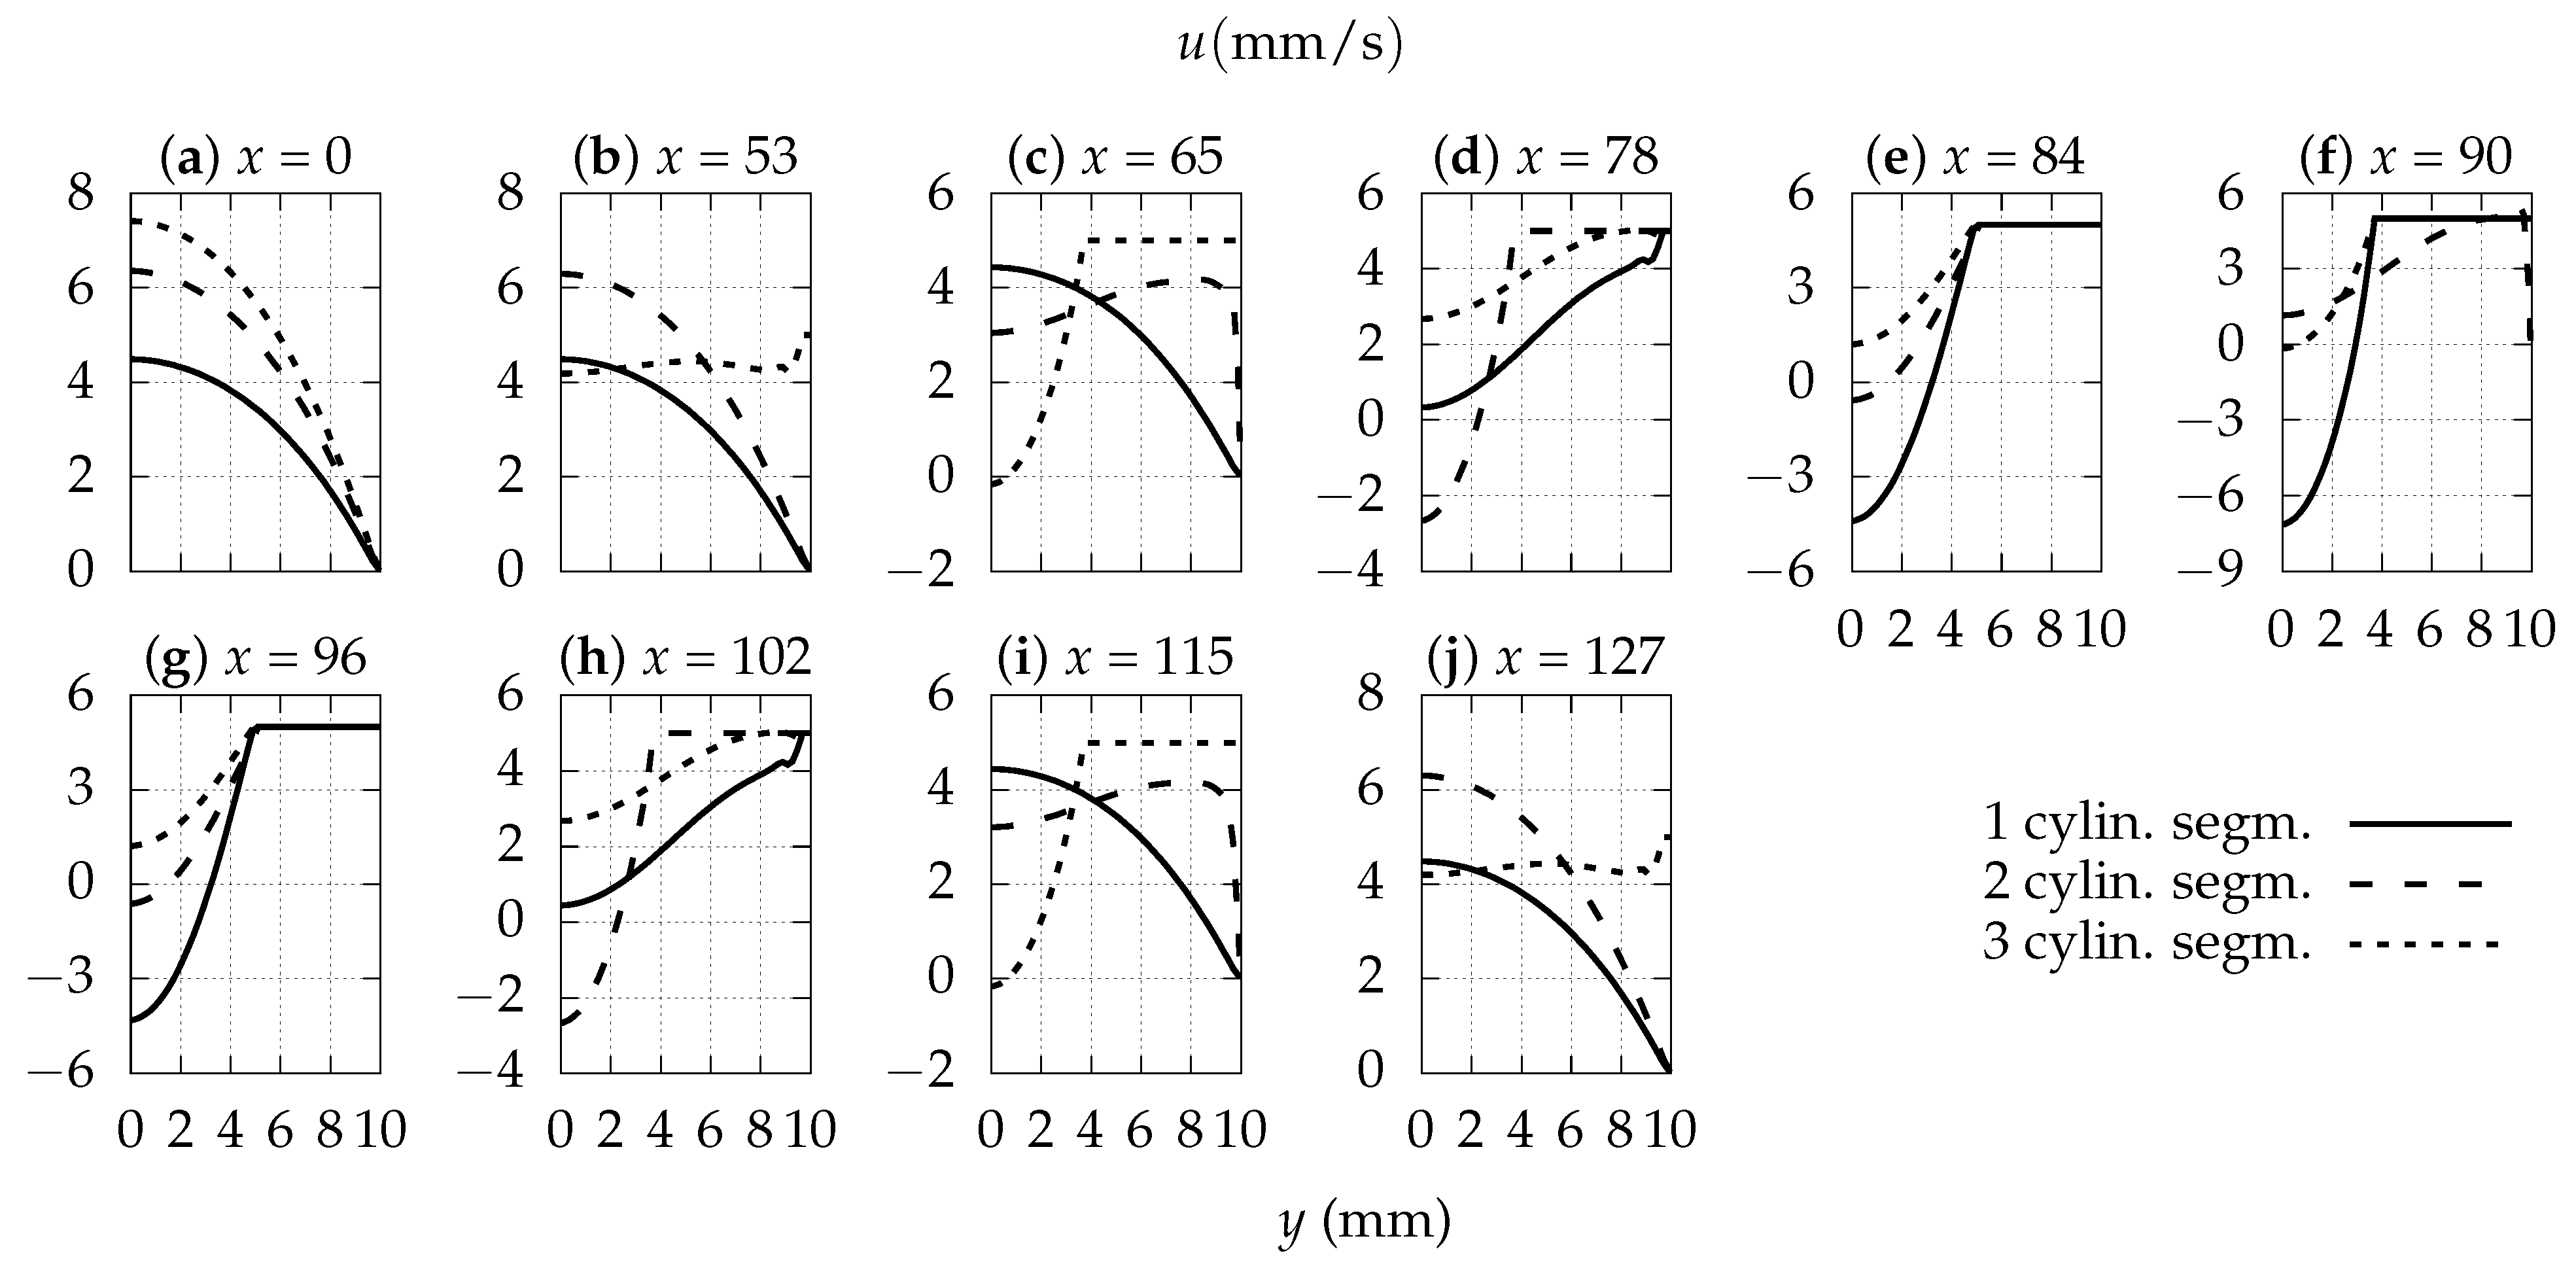
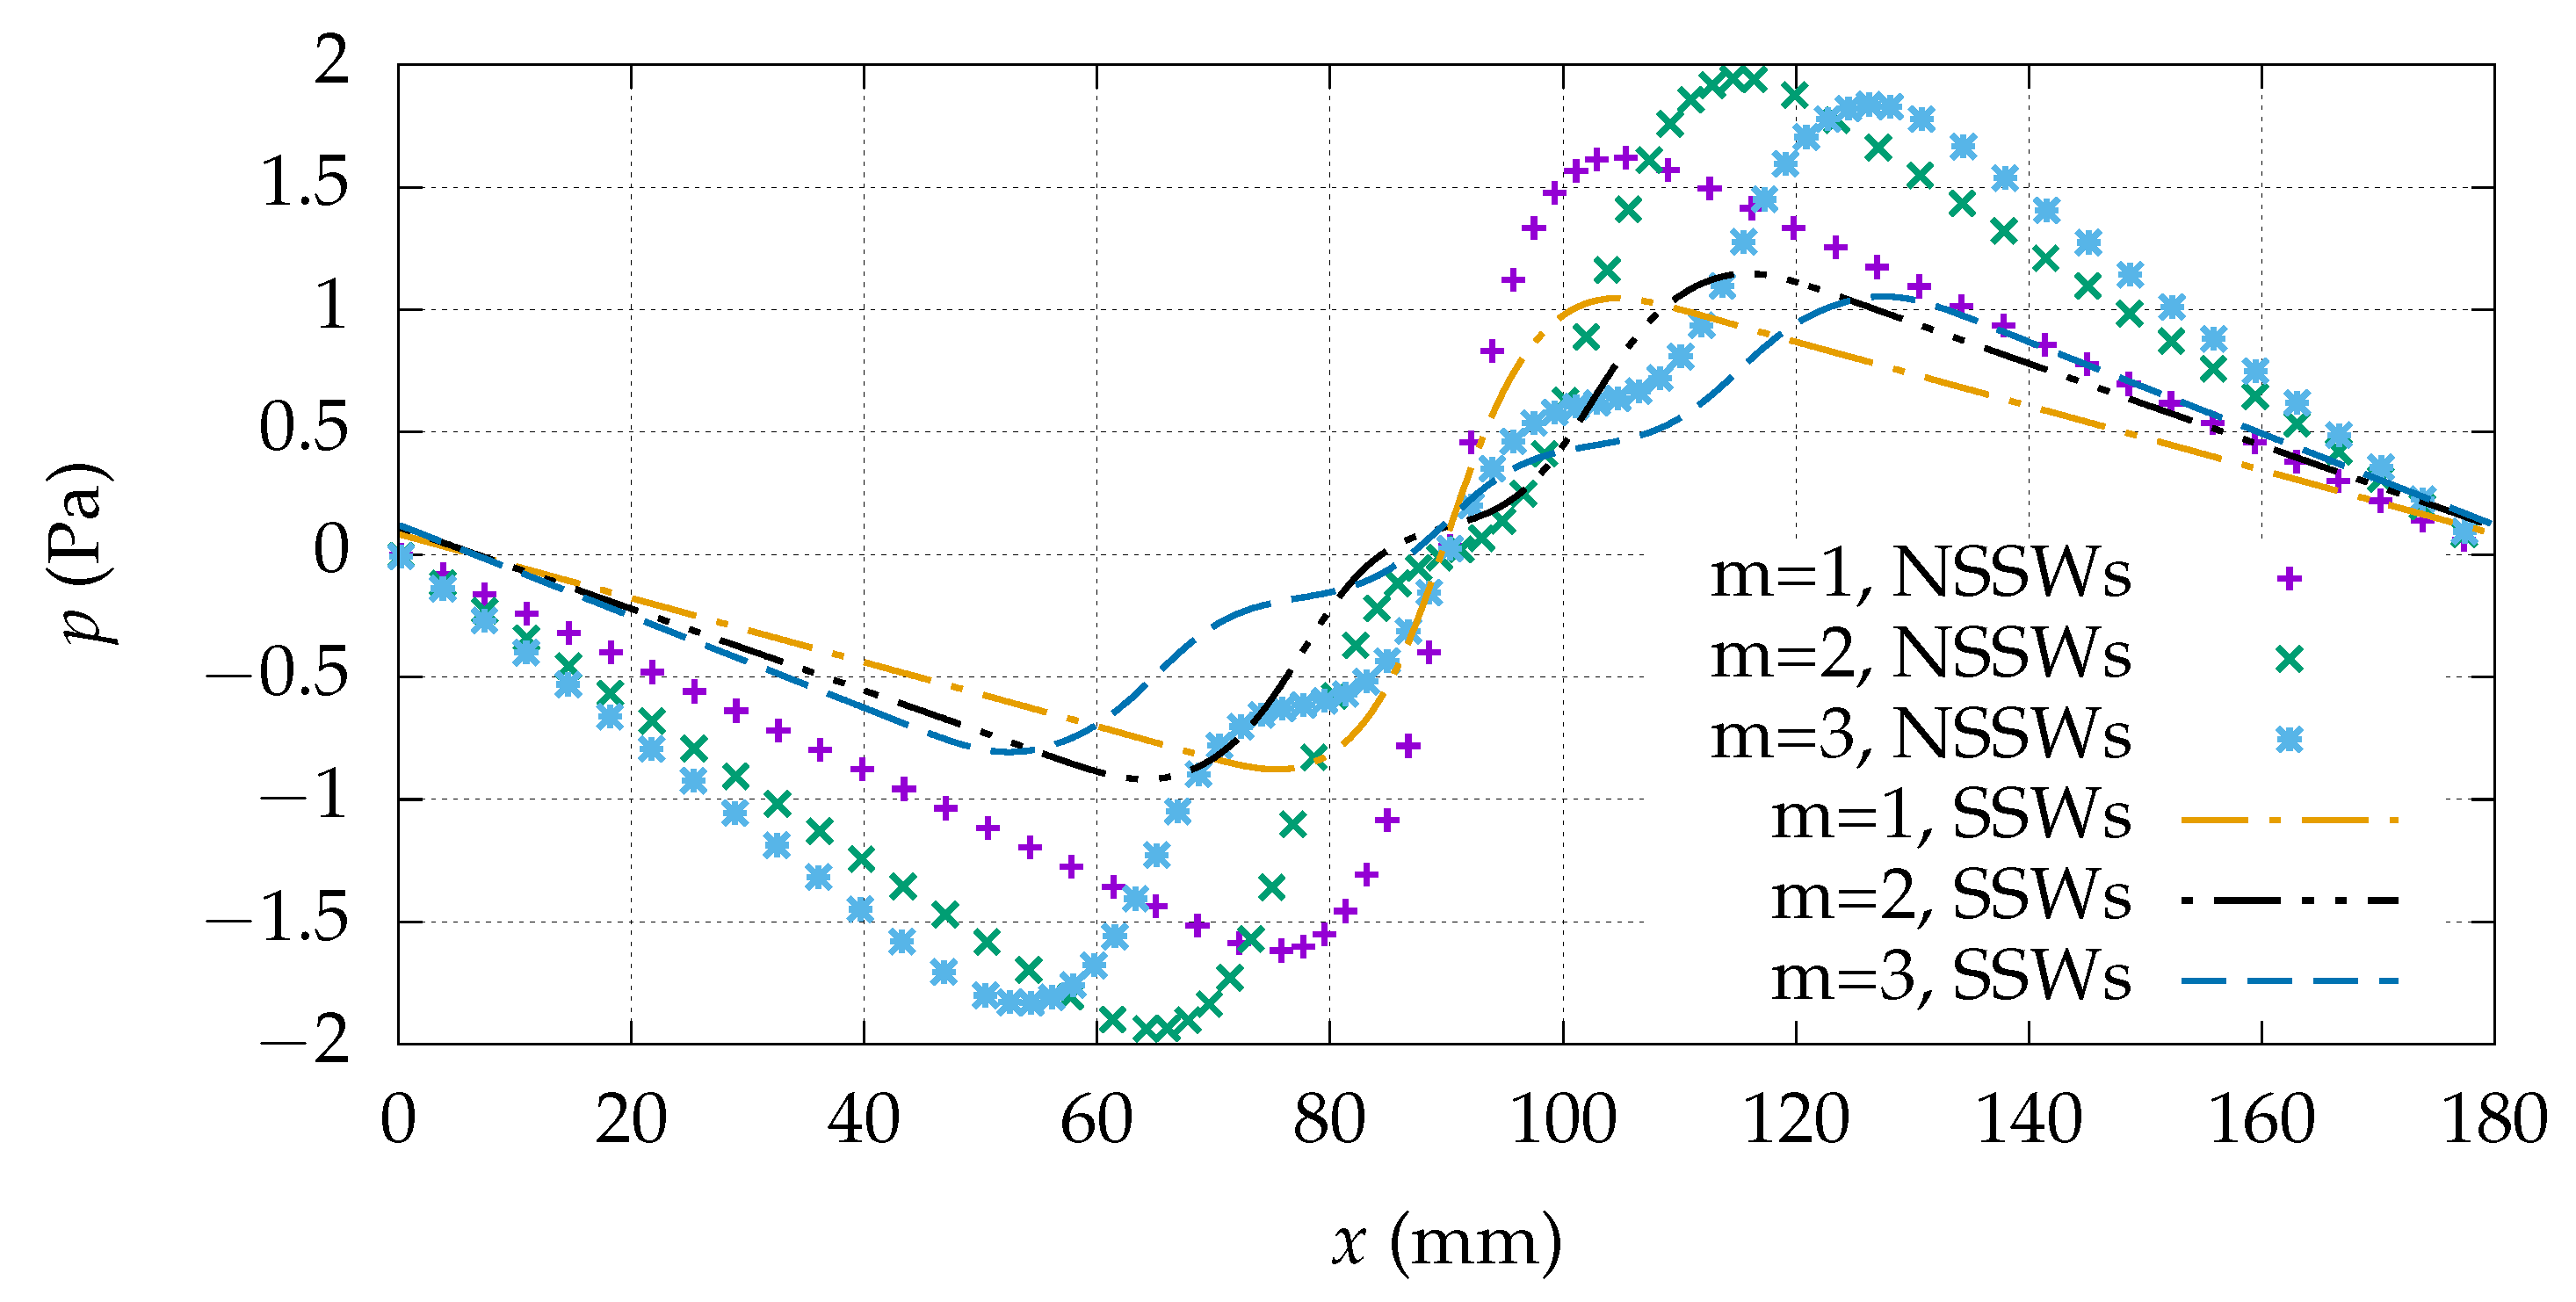
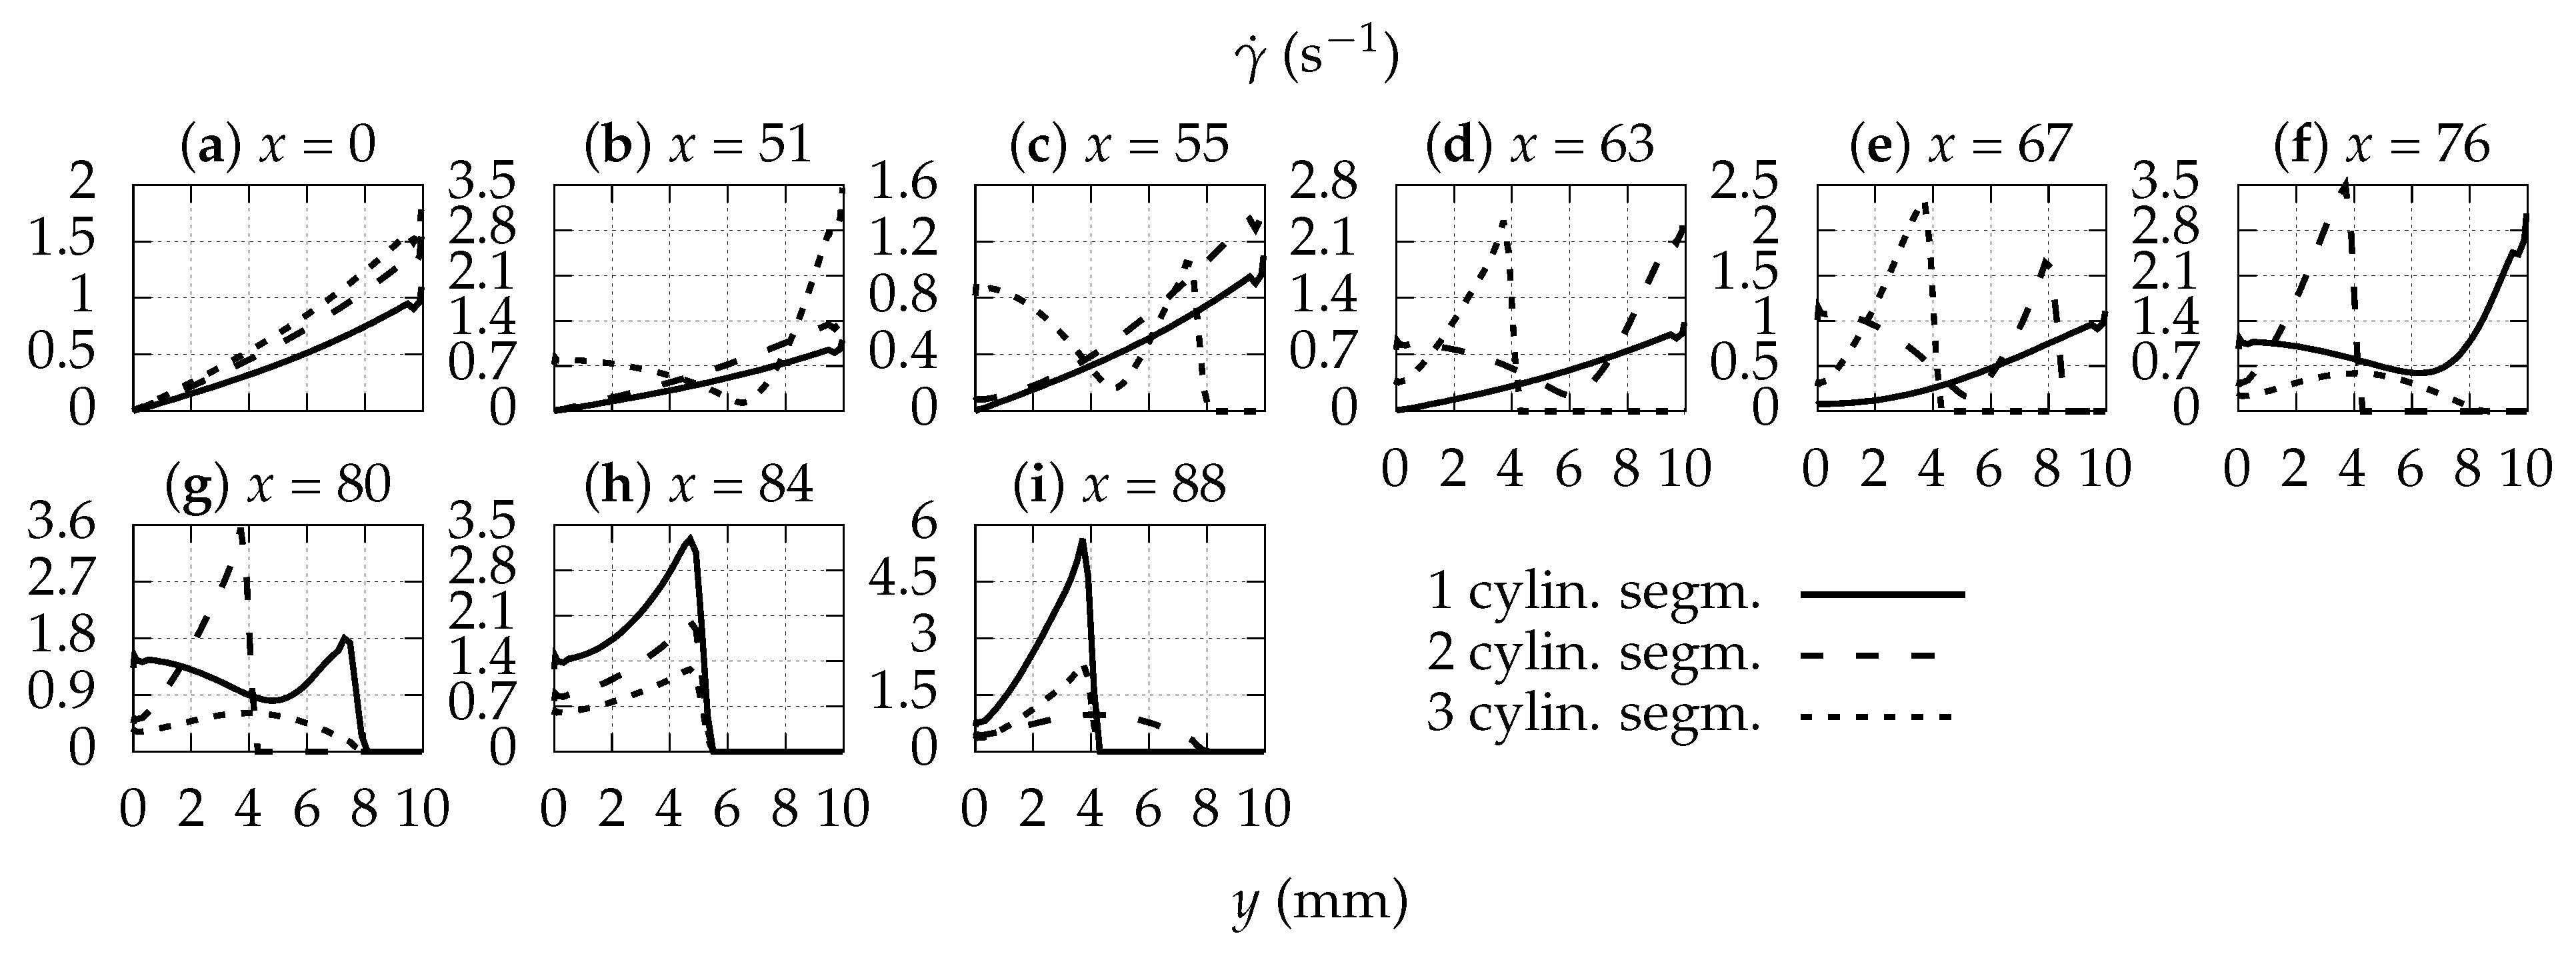
3. Results and Discussion

3.1. Transport Efficiency

The transport efficiency is estimated as a function of variable wave speed, relative occlusion (RO)
R O = W / 2 W / 2 H H d y d z W / 2 W / 2 h h d y d z W / 2 W / 2 H H d y d z = H h H ,
Carreau power index, and number of cylindrical segments in the squeezing pulse, namely, its modality. The respective results are reported in Table 2, Table 3, Table 4 and Table 5.
Transport efficiency is found to not depend on the wave speed. However, it depends crucially on the relative occlusion.
As the results suggest, a significant role is played by the power-law index, a 25% reduction in which leads to a 10% reduction in T E . Transport efficiency increases with a diminishing rate for every additional cylindrical segment of the squeezing pulse.
As shown in Figure 4, the velocity at the peristalsis direction on the spanwise middle plane and y = 0.05 mm takes negative values of magnitude greater than the wave speed for a single peak pulse. The presence of an extra cylindrical segment reduces this quantity below the propagation velocity c and of a third one nearly keeps it on the positive region. Towards both ends of the duct, a value close to c arises when the pulse consists of a single segment. This value increases in a concave manner above c for more segments.
The velocity profiles at the width central plane in streamwise positions of interest are presented in detail in Figure 5 and Figure 6.
The larger magnitude of the flow direction velocity component is noted on the surface of the cylindrical segments as expected from the Dirichlet boundary condition imposed on them. The flow field is found to be symmetric with respect to the transverse cross-section passing through the middle of the duct length in terms of the streamwise component and antisymmetric in terms of the other components. More intense vertical movement is observed at the ends of the peristaltic pulse independently of its modality.
Along the same line (intersection of planes y = 0.05 mm and z = 0 ), the peak-to-peak value of the pressure wave has 17% fluctuation with its minimum for a single segment and its maximum for bimodal pulses produced by twin horizontal cylindrical segments (Figure 7).
Velocity patterns depicted in Figure 4, Figure 5 and Figure 6 incline towards the trends shown in Figure 8. Notably higher values of shear rate are observed for a single cylindrical segment in comparison with multi-segment pulses.
Figure 9 visualizes the shear rate profiles at the spanwise central plane ( z = 0 ). The maximum values are observed near the maximum penetration cross-section for a unimodal pulse ( x = 88 mm, x = 92 mm).
The function graph of longitudinal velocity on the line E = { y = 0.05 mm, z = 0 } for Newtonian fluids lies above the corresponding curve for shear thinning Carreau–Yasuda fluids for n = 0.75 (Figure 10). In positions at sufficient distances from the peristaltic pulse, the stream moves approximately with the velocity of peristalsis for the n = 0.75 case, and for the Newtonian case, a value around 1.3 c is obtained.
On the sampling line of interest ( y = 0.05 mm, z = 0 ), pressure is roughly double for Newtonian fluids than for shear thinning fluids, p n = 1 ( x , y = 0.05 , z = 0 ) 2 · p n = 0.75 ( x , y = 0.05 , z = 0 ) (Figure 11).

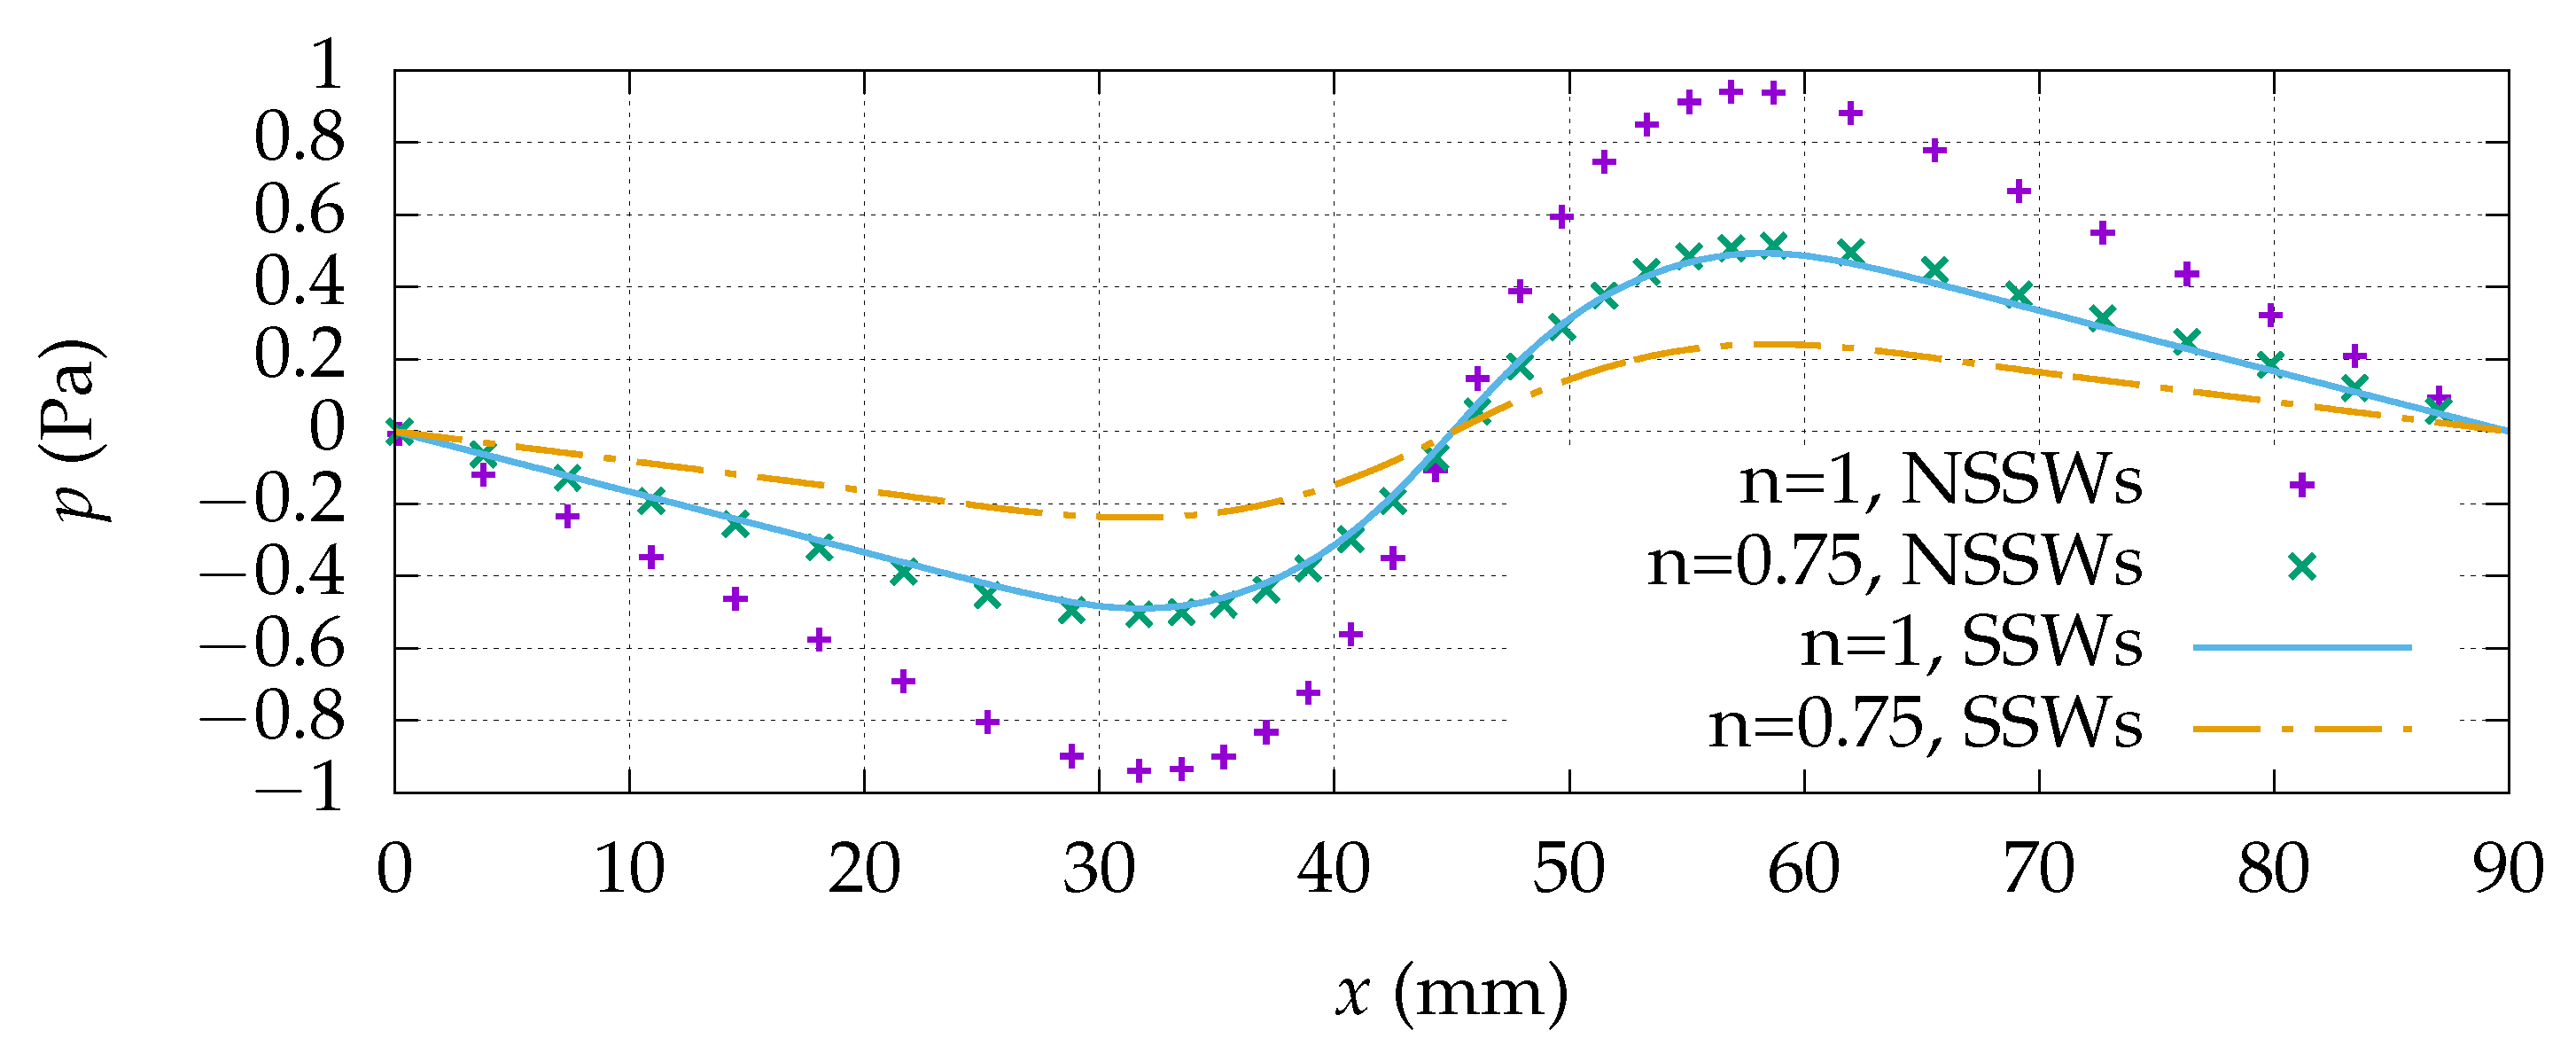
3.2. Peristaltic Characteristic Curves

The discharge pressure, namely, the pressure at the downstream end of the simulated period of the duct, p ( x = L ) , is acquired as described in Section 2.3 for given developed velocity profile at the inlet. The graph of the pressure rise across the length of the peristaltic wave as a function of the flow volume rate through the orthogonal duct, can be seen in Figure 12.
Independently of the modality of the penetrating pulse, the shape of the peristaltic characteristic curve is linear and exhibits negative inclination. As the pulse elongates after appending more cylindrical segments, the characteristic moves upwards with diminishing marginal pressure augmentation and a slight inclination reduction for every supplementary segment. For a smaller length and similar single-segment pulse, the discharge pressure potential increases for given volume flow rate ( R O = 0.6 , n = 1 , L = 180 mm and R O = 0.6 , n = 1 , L = 90 mm cases). For fluids with less ability to resist the shear stresses as the shear rate increases, the flow volume rate reduces as shown for n = 0.75 . On the contrary, for shear thickening fluids, significant augmentation of pumping potential is noted ( n = 1.25 case).

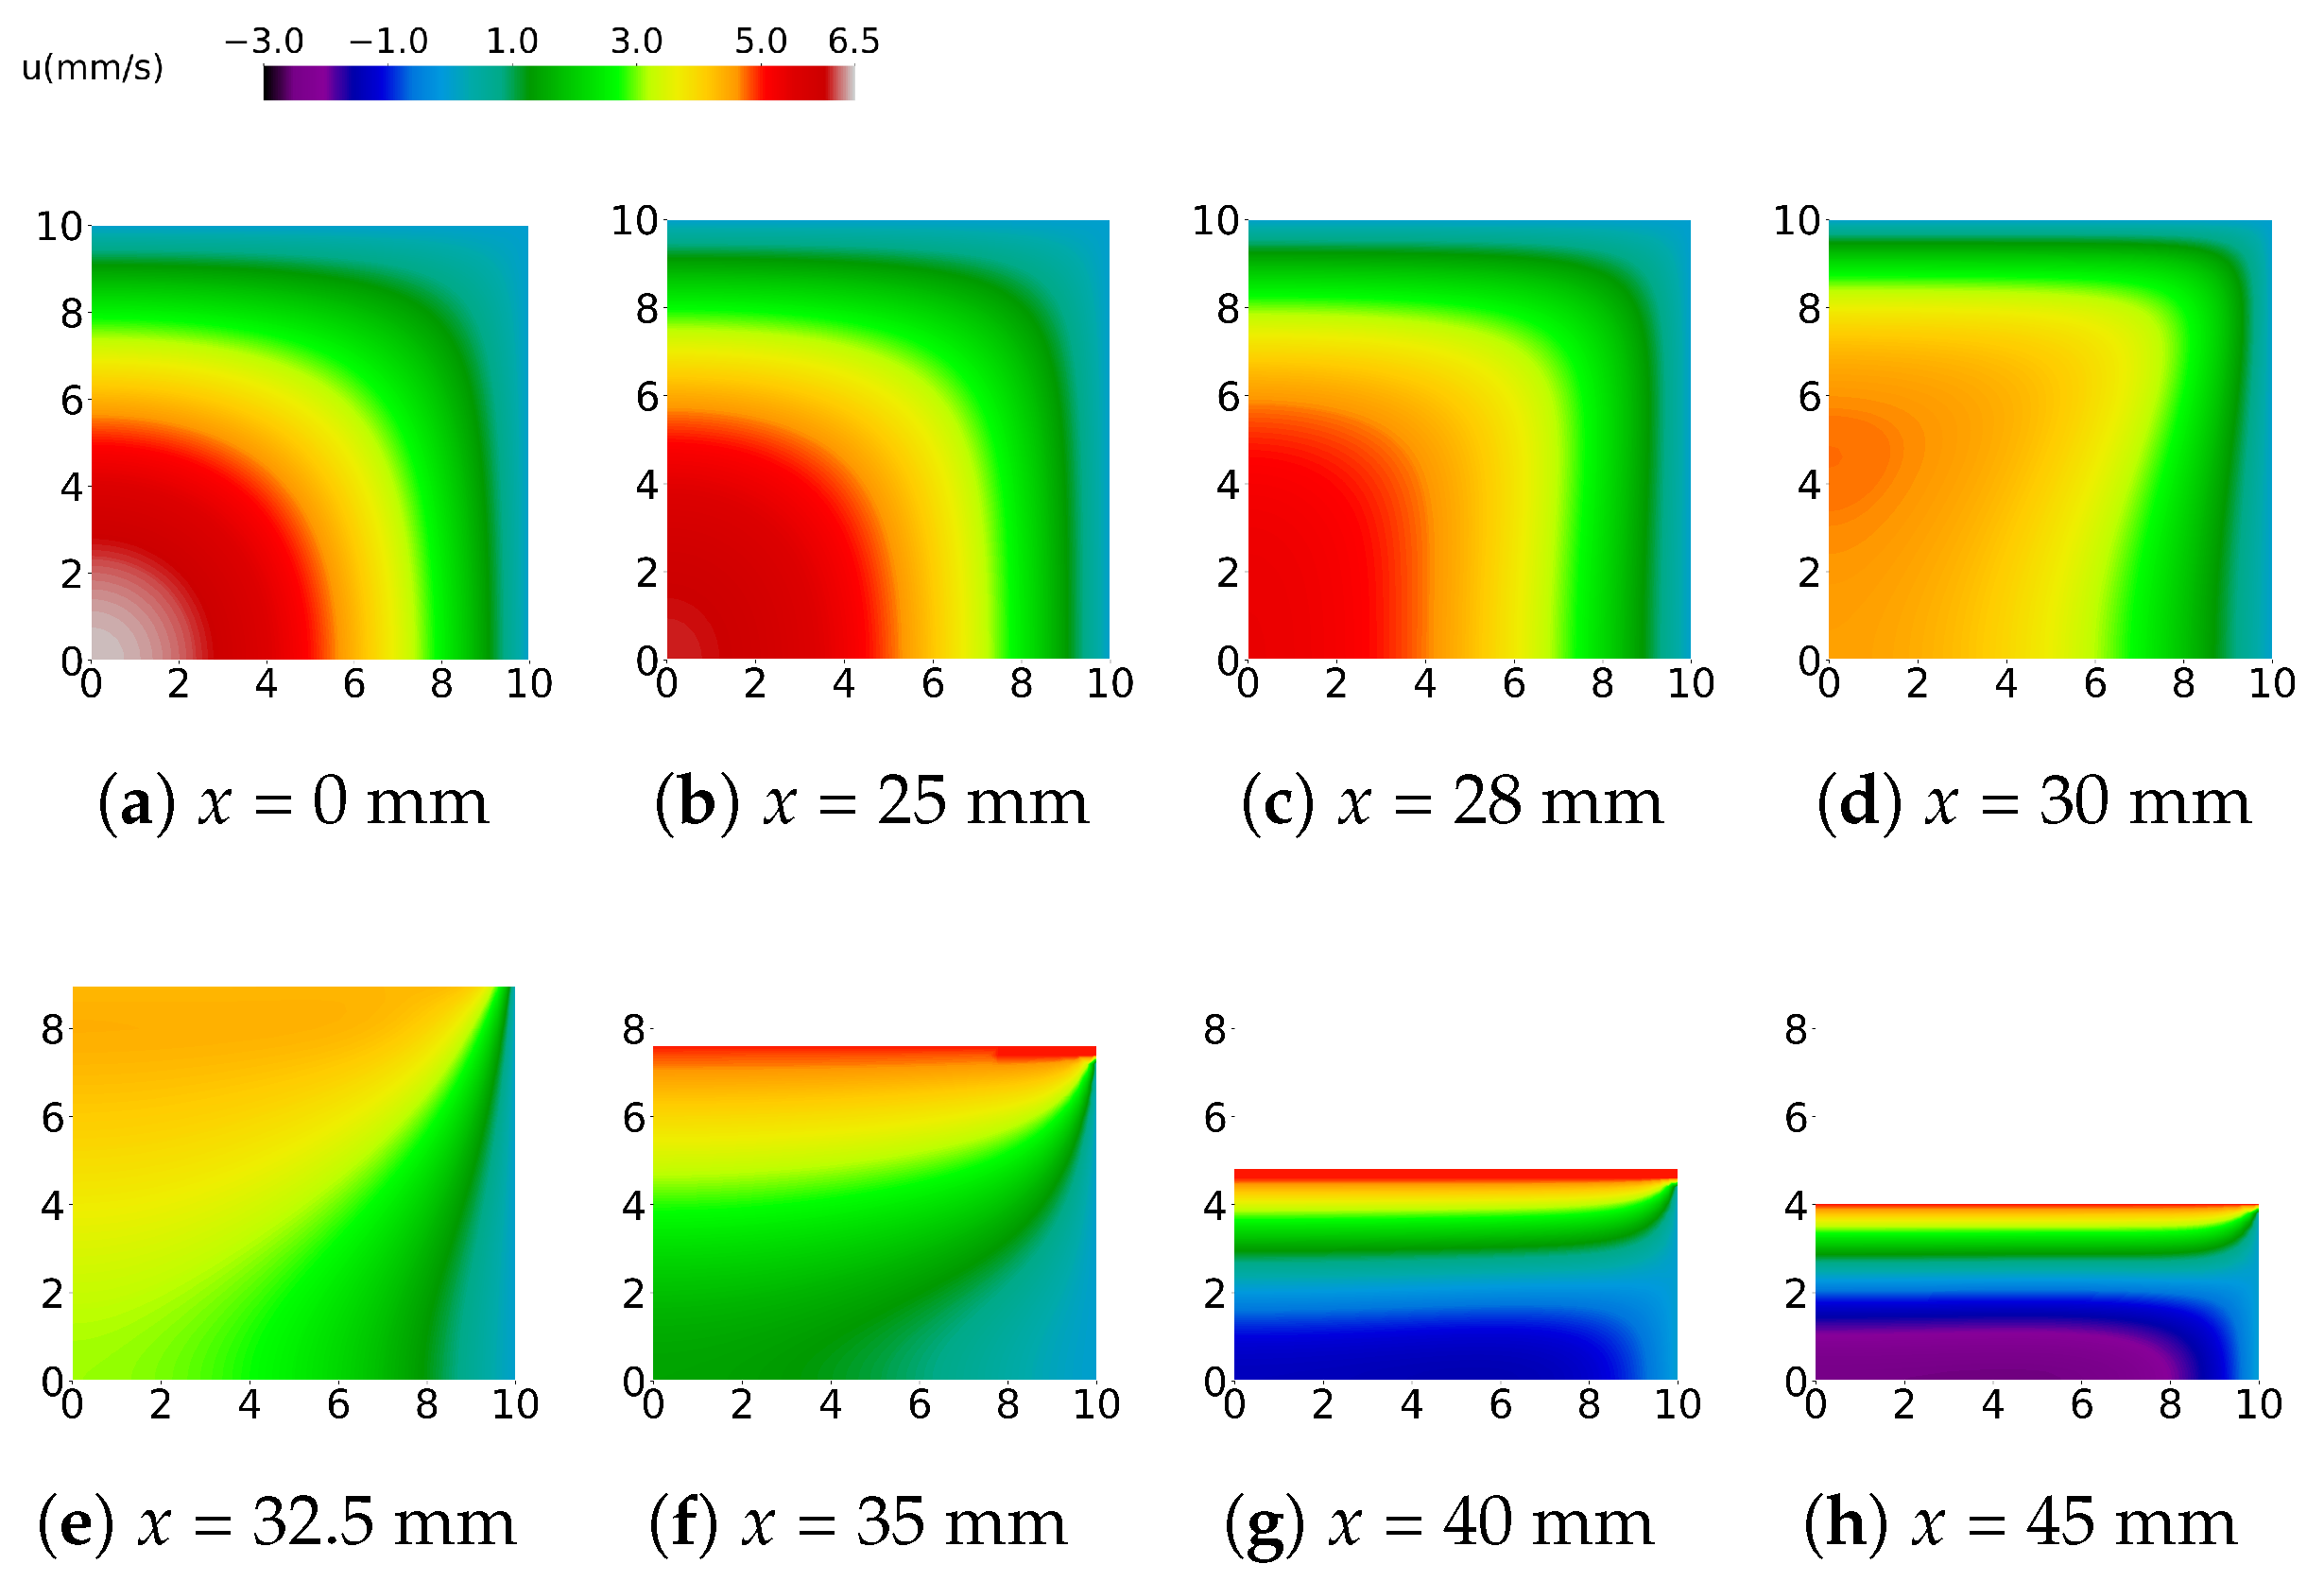
3.3. Effect of Finite Width

The flow field of the baseline case of the one-at-a-time analysis is depicted in Figure 13. Away from the peristaltic pulse, the steady wall imposes a low-velocity near-wall boundary layer, while at the vicinity of the pulse the low-velocity boundary layer becomes gradually thinner (Figure 13d) until it transitions to a high-velocity layer under the influence of the peristaltic wave.
As a consequence of the shrinking of the cross-section area due to the segments’ presence, the high-velocity boundary layer has diminishing height towards the maximum penetration cross-section. In terms of transport efficiency, the presence of no slip side walls incurs a 21.8% reduction and does not change the independence from the wave propagation speed. The T E domain stretches for the no slip side wall case roughly 6%. A higher influence grade of the frictional side walls is observed for the shear thinning behavior case ( n = 0.75 ). The slight reduction of 0.9% for the infinite width case inflates to 11% for that of the finite width. Quite similar tendencies of the reduction magnitude in absolute numbers for the SSWs and NSSWs cases is observed for the effect of the number of cylindrical segments.
A point of interest in the study of peristaltic pumping is the existence or not of backflow under the squeezing pulse, for in many applications, upstream motion is undesirable [47]. Intenser reversed flow at the middleplane is noted for the unimodal pulse case. Though for the SSWs case no retrograde flow is noted for multimodal pulses, for the NSSWs case backflow hardly reaches zero for a trimodal squeezing pulse. Furthermore, for the L = 90 mm duct, significant upstream velocity at the middle spanwise plane and y = 0.05 mm at the peristaltic pulse longitudinal position emerges. This retrograde flow is strengthened for shear-thinning fluids (Figure 10). For the infinite width case, the velocity at the same region is slightly greater for shear thinning fluids than for Newtonian fluids.
The pressure curves are of similar shape for the SSWs and the NSSWs cases; however, the peak-to-peak value for the NSSWs is at least 1.5 times that of SSWs.
The spanwise bounded peristalsis characteristics are found to lie over the counterpart for the spanwise unbounded duct up to some critical point where an inversion occurs (Figure 12).

4. Conclusions

A simulation of the peristaltic motion in a rectilinear square tube is presented with an analysis of a subset of the factors which affect the fluid dynamics. The squeezing wave is assumed to consist of pulses of consecutive parallel horizontal cylindrical segments. The inter-pulse distance defines the length L, and the computation takes place at such a domain, using periodic boundary conditions. The set of examined parameters includes the number of cylindrical segments in the pulse, the wave speed, the relative occlusion and the rheological constitutive equation power index. Flow equations are manipulated by immersing the solid boundaries in a Cartesian mesh and using finite differences for the discretization of the spatial and temporal derivatives. For the incorporation of the non-Newtonian behavior, the Carreau–Yasuda model is employed.
The ratio of the discharge volume to the product of the wave speed with the duct cross-section area is found to be significantly lower than in the slip wall case. The correlation of the parameters with T E is similar with the slip wall variant except for the Carreau–Yasuda power index. A significantly higher plunge is observed for the NSSWs tube in comparison with the SSWs duct in response to transition from Newtonian to shear thinning behavior.
Backflow is an undesirable factor in peristaltic implementation such as blood transfusion. Negative streamwise velocity for the finite width case at the core of the duct ( y = 0.05 mm, z = 0 ) is of larger magnitude than that of the infinite width case. Furthermore, the pressure rise across the squeezing pulse is notably higher for the laterally frictionally confined setting compared with the infinite width one.
Maximum shear levels are higher for unimodal waves than for bi- and multimodal waves. Therefore, large values of m are more adequate for blood propulsion using this mechanism as they present less erythrocyte damage risk [48,49]. Uniformity of the streamwise velocity and retrograde flow elimination are also enhanced by the augmentation of modality m. For shear thinning fluid peristalsis in an NSSWs duct, the longitudinal negative velocity magnitude is higher than for shear independent fluids. The downstream the train of cylindrical segments, surplus of pressure over the upstream segment pressure is more or less 100% larger for Newtonian fluids to that for n = 0.75 fluids. Hence, for the increase in the pressure of pseudoplastic fluids, the half gap should be reduced in comparison with its value for fluids with viscosity that is not a function of shear rate. In agreement with the previous remark, each additional cylindrical segment in the squeezing pulse raises the peristaltic characteristic. Fluids with shear dilating behavior are found to be more prone to a rise in pressure by contraction waves.

Author Contributions

I.C.M., C.M. and S.T. provided equal contributions to this research paper. All authors have read and agreed to the published version of the manuscript.

Funding

This research received no external funding.

Data Availability Statement

No new data were created or analyzed in this study. Data sharing is not applicable to this article.

Acknowledgments

The authors are thankful for being provided with processing time by the Parallel CFD and Optimization Unit of the Laboratory of Thermal Turbomachines of NTUA.

Conflicts of Interest

The authors declare no conflicts of interest.

References

  1. Kalayeh, K.; Xie, H.; Fowlkes, B.; Sack, B.; Schultz, W. Longitudinal wall motion during peristalsis and its effect on reflux. J. Fluid Mech. 2023, 964, A30. [Google Scholar] [CrossRef]
  2. Shapiro, A.H.; Jaffrin, M.Y.; Weinberg, S.L. Peristaltic pumping with long wavelengths at low Reynolds number. J. Fluid Mech. 1969, 37, 799–825. [Google Scholar] [CrossRef]
  3. Hosseini, G.; Ji, C.; Xu, D.; Rezaienia, M.A.; Avital, E.; Munjiza, A.; Williams, J.J.R.; Green, J.S.A. A computational model of ureteral peristalsis and an investigation into ureteral reflux. Biomed. Eng. Lett. 2018, 8, 117–125. [Google Scholar]
  4. Takaddus, A.T.; Chandy, A.J. A three-dimensional (3D) two-way coupled fluid–structure interaction (FSI) study of peristaltic flow in obstructed ureters. Int. J. Numer. Methods Biomed. Eng. 2018, 34, e3122. [Google Scholar] [CrossRef]
  5. Waldrop, L.D.; He, Y.; Battista, N.A.; Peterman, T.N.; Miller, L.A. Uncertainty quantification reveals the physical constraints on pumping by peristaltic hearts. J. R. Soc. Interface 2020, 17, 20200232. [Google Scholar]
  6. Sharp, M.K. Pulsatile cerebral paraarterial flow by peristalsis, pressure and directional resistance. Fluids Barriers CNS 2023, 20, 41. [Google Scholar]
  7. Javed, T.; Ahmed, B.; Hamid, A.H.; Sajid, M. Numerical analysis of peristaltic transport of Casson fluid for non-zero Reynolds number in presence of the magnetic field. Nonlinear Eng. 2018, 7, 183–193. [Google Scholar] [CrossRef]
  8. Abd-Alla, A.M.; Abo-Dahab, S.M.; Thabet, E.N.; Abdelhafez, M.A. Heat and mass transfer for MHD peristaltic flow in a micropolar nanofluid: Mathematical model with thermophysical features. Sci. Rep. 2022, 12, 21540. [Google Scholar] [CrossRef] [PubMed]
  9. Prakash, J.; Yadav, A.; Tripathi, D.; Kumar Tiwari, A. Computer modelling of peristalsis-driven intrauterine fluid flow in the presence of electromagnetohydrodynamics. Eur. Phys. J. Plus 2019, 134, 81. [Google Scholar] [CrossRef]
  10. Akram, S.; Athar, M.; Saeed, K.; Razia, A. Influence of an induced magnetic field on double diffusion convection for peristaltic flow of thermally radiative Prandtl nanofluid in non-uniform channel. Tribol. Int. 2023, 187, 108719. [Google Scholar]
  11. Alharbi, K.A.M.; Adnan, A.; Eldin, S.M.; Akgul, A. Investigation of Williamson nanofluid in a convectively heated peristaltic channel and magnetic field via method of moments. AIP Adv. 2023, 13, 065313. [Google Scholar] [CrossRef]
  12. Rafiq, M.; Shaheen, A.; Trabelsi, Y.; Eldin, S.M.; Khan, M.I.; Suker, D.K. Impact of activation energy and variable properties on peristaltic flow through porous wall channel. Sci. Rep. 2023, 13, 3219. [Google Scholar]
  13. Christov, C.I. On frame indifferent formulation of the Maxwell–Cattaneo model of finite-speed heat conduction. Mech. Res. Commun. 2009, 36, 481–486. [Google Scholar]
  14. Tanveer, A.; Hina, S.; Hayat, T.; Mustafa, M.; Ahmad, B. Effects of the Cattaneo–Christov heat flux model on peristalsis. Eng. Appl. Comput. Fluid Mech. 2016, 10, 373–383. [Google Scholar] [CrossRef]
  15. Tanner, F.X.; Al-Habahbeh, A.A.; Feigl, K.A.; Nahar, S.; Jeelani, S.A.K.; Case, W.R.; Windhab, E.J. Numerical and experimental investigation of a non-Newtonian flow in a collapsed elastic tube. Appl. Rheol. 2012, 22, 63910. [Google Scholar]
  16. Nahar, S.; Jeelani, S.A.K.; Windhab, E.J. Peristaltic flow characterization of a shear thinning fluid through an elastic tube by UVP. Appl. Rheol. 2012, 22, 43941. [Google Scholar]
  17. Nahar, S.; Dubey, B.N.; Windhab, E.J. Influence of flowing fluid property through an elastic tube on various deformations along the tube length. Phys. Fluids 2019, 31, 101905. [Google Scholar]
  18. Al-Habahbeh, A.A. Simulations of Newtonian and Non–Newtonian Flows in Deformable Tubes. Ph.D. Thesis, Michigan Technological University, Houghton, MI, USA, 2013. [Google Scholar]
  19. Alokaily, S.; Feigl, K.; Tanner, F.X.; Windhab, E.J. Numerical simulations of the transport of Newtonian and non-Newtonian fluids via peristaltic motion. Appl. Rheol. 2018, 28, 32832. [Google Scholar]
  20. Alokaily, S.; Feigl, K.; Tanner, F.X. Characterization of peristaltic flow during the mixing process in a model human stomach. Phys. Fluids 2019, 31, 103105. [Google Scholar]
  21. Dufour, D.; Tanner, F.X.; Feigl, K.A.; Windhab, E.J. Investigation of the dispersing characteristics of antral contraction wave flow in a simplified model of the distal stomach. Phys. Fluids 2021, 33, 083101. [Google Scholar]
  22. Feigl, K.; Tanner, F.X. Computational investigation of drop behavior and breakup in peristaltic flow. Phys. Fluids 2022, 34, 012111. [Google Scholar]
  23. Ellahi, R.; Riaz, A.; Nadeem, S. Three dimensional peristaltic flow of Williamson fluid in a rectangular duct. Indian J. Phys. 2013, 87, 1275–1281. [Google Scholar] [CrossRef]
  24. Ali Abbas, A.; Bai, Y.Q.; Bhatti, M.M.; Rashidi, M.M. Three dimensional peristaltic flow of hyperbolic tangent fluid in non-uniform channel having flexible walls. Alex. Eng. J. 2016, 55, 653–662. [Google Scholar]
  25. Ellahi, R.; Hussain, F.; Ishtiaq, F.; Hussain, A. Peristaltic transport of Jeffrey fluid in a rectangular duct through a porous medium under the effect of partial slip: An application to upgrade industrial sieves/filters. Pramana J. Phys. 2019, 93, 34. [Google Scholar]
  26. Ali, N.; Javid, K.; Sajid, M.; Anwar Bég, O. Numerical simulation of peristaltic flow of a biorheological fluid with shear-dependent viscosity in a curved channel. Comput. Methods Biomech. Biomed. Eng. 2016, 19, 614–627. [Google Scholar]
  27. Narla, V.K.; Prasad, K.M.; Ramana Murthy, J.V. Time-dependent peristaltic analysis in a curved conduit: Application to chyme movement through intestine. Math. Biosci. 2017, 293, 21–28. [Google Scholar]
  28. Liao, F.; Yang, X.; Wang, S.; He, G. Grid-dependence study for simulating propeller crashback using large-eddy simulation with immersed boundary method. Ocean. Eng. 2020, 218, 108211. [Google Scholar]
  29. Khosronejad, A.; Kang, S.; Flora, K. Fully coupled free-surface flow and sediment transport modelling of flash floods in a desert stream in the Mojave Desert, California. Hydrol. Process. 2019, 33, 2772–2791. [Google Scholar]
  30. Moulinos, I.; Manopoulos, C.; Tsangaris, S. Computational analysis of active and passive flow control for backward facing step. Computation 2022, 10, 12. [Google Scholar]
  31. Moulinos, I.; Manopoulos, C.; Tsangaris, S. Modification of Poiseuille flow to a pulsating flow using a periodically expanding-contracting balloon. Fluids 2023, 8, 129. [Google Scholar]
  32. Santoni, C.; Khosronejad, A.; Seiler, P.; Sotiropoulos, F. Toward control co-design of utility-scale wind turbines: Collective vs. individual blade pitch control. Energy Rep. 2023, 9, 793–806. [Google Scholar]
  33. Asgharzadeh, H.; Borazjani, I. A Newton–Krylov method with an approximate analytical Jacobian for implicit solution of Navier–Stokes equations on staggered overset-curvilinear grids with immersed boundaries. J. Comput. Phys. 2017, 331, 227–256. [Google Scholar]
  34. Liao, F.; Yang, X. On the capability of the curvilinear immersed boundary method in predicting near-wall turbulence of turbulent channel flows. Theor. Appl. Mech. Lett. 2021, 11, 100279. [Google Scholar] [CrossRef]
  35. Moulinos, I.; Manopoulos, C.; Tsangaris, S. A computational analysis for active flow and pressure control using moving roller peristalsis. Computation 2021, 9, 144. [Google Scholar]
  36. Ge, L.; Sotiropoulos, F. A numerical method for solving the 3D unsteady incompressible Navier—Stokes equations in curvilinear domains with complex immersed boundaries. J. Comput. Phys. 2007, 225, 1782–1809. [Google Scholar] [PubMed]
  37. Nahar, S. Steady and Unsteady Flow Characteristics of Non–Newtonian Fluids in Deformed Elastic Tubes. Ph.D. Thesis, ETH Zurich, Zürich, Switzerland, 2012. [Google Scholar]
  38. Alokaily, S. Modeling and Simulation of the Peristaltic Flow of Newtonian and Non–Newtonian Fluids with Application to the Human Body. Ph.D. Thesis, Michigan Technological University, Houghton, MI, USA, 2017. [Google Scholar]
  39. Latham, T.W. Fluid Motion in a Peristaltic Pump. Master’s Thesis, Massachusetts Institute of Technology, Cambridge, MA, USA, 1966. [Google Scholar]
  40. Esmaily, M.; Villafane, L.; Banko, A.J.; Iaccarino, G.; Eaton, J.K.; Mani, A. A benchmark for particle-laden turbulent duct flow: A joint computational and experimental study. Int. J. Multiph. Flow 2020, 132, 103410. [Google Scholar]
  41. Yasuda, K.; Armstrong, R.C. and Cohen, R.E. Shear flow properties of concentrated solutions of linear and star branched polystyrenes. Rheol. Acta 1981, 20, 163–178. [Google Scholar]
  42. Eckmann, D.M.; Bowers, S.; Stecker, M.; Cheung, A.T. Hematocrit, volume expander, temperature, and shear rate effects on blood viscosity. Anesth. Analg. 2000, 91, 539–545. [Google Scholar] [PubMed]
  43. Walker, A.M.; Xiao, Y.; Johnston, C.R.; Rival, D.E. The viscous characterization of hydroxyethyl starch (HES) plasma volume expanders in a non-Newtonian blood analog. Biorheology 2013, 50, 177–190. [Google Scholar] [CrossRef]
  44. Kilbride, P.; Rull, M.V.; Townsend, A.; Wilson, H.; Morris, J. Shear-thickening fluids in biologically relevant agents. Biorheology 2019, 56, 39–50. [Google Scholar]
  45. White, F.M. Viscous Fluid Flow; McGraw-Hill: New York, NY, USA, 2006. [Google Scholar]
  46. Yang, X.; Angelidis, D.; Khosronejad, A.; Le, T.; Kang, S.; Gilmanov, A.; Ge, L.; Borazjani, I.; Calderer, A. Virtual Flow Simulator v1.0. Computer Software; USDOE Office of Energy Efficiency and Renewable Energy (EERE): Washington, DC, USA, 2015. Available online: https://github.com/SAFL-CFD-Lab/VFS-Wind (accessed on 10 January 2021).
  47. Manopoulos, C.; Savva, G.; Tsoukalis, A.; Vasileiou, G.; Rogkas, N.; Spitas, V.; Tsangaris, S. Optimal design in roller pump system applications for linear infusion. Computation 2020, 8, 35. [Google Scholar] [CrossRef]
  48. Capata, R. Peristaltic roller pump: Parametric optimization for hemolysis control. In Proceedings of the ASME 2020 International Mechanical Engineering Congress and Exposition (IMECE2020), Portland, OR, USA, 15–18 November 2020; 21681. [Google Scholar]
  49. Hadjesfandiari, N.; Serrano, K.; Levin, E.; Johal., P.; Feenstra, S.; Shih, A.W.; Devine, D.V. Effect of modern infusion pumps on RBC quality. Transfusion 2022, 62, 797–808. [Google Scholar] [CrossRef] [PubMed]
Figure 1. Rectangular duct and the contraction wave in a trimetric view. The upper symmetric half with reference to the y = 0 plane is depicted. The squeezing pulse profile is a bimodal function of x with respect to the y direction. Yellow: inlet, green: wall, orange: excitation area of peristaltic wave.
Computation 12 00062 g001
Figure 2. Shape of the developed velocity profile, u ( y , z ) in the rectangular duct under consideration, with H = 10 mm and W = 20 mm and for Q = 800 m m 3 s .
Computation 12 00062 g002
Figure 3. The convergence rate with respect to the number (#) of iterations. The relative occlusion is R O = 0.6 , the peristaltic wave speed is c = 5 mm s , the power index is n = 1 , the modality is m = 1 and the length is L = 90 mm.
Computation 12 00062 g003
Figure 4. Streamwise velocity component magnitude for multiple squeezing cylindrical segments pulse at the middle of the width and y = 0.05 mm for the case with no slip side walls (NSSWs) and for the case with slip side walls (SSWs) [35]. The relative occlusion is R O = 0.6 , the peristaltic wave speed is c = 5 mm s , the power index is n = 1 and the length is L = 180 mm.
Computation 12 00062 g004
Figure 5. The streamwise velocity profile at x direction for a set of streamwise positions in the middle plane z = 0 . The relative occlusion is R O = 0.6 , the peristaltic wave speed is c = 5 mm s , the power index is n = 1 and the length is L = 180 mm. The unit for x is also mm.
Computation 12 00062 g005
Figure 6. The vertical velocity profile at y direction for a set of streamwise positions in the middle plane z = 0 . The relative occlusion is R O = 0.6 , the peristaltic wave speed is c = 5 mm s , the power index is n = 1 and the length is L = 180 mm. The unit for x is also mm.
Computation 12 00062 g006
Figure 7. Pressure for multiple squeezing cylindrical segments pulse at the middle of the width and y = 0.05 mm for the case with no slip side walls (NSSWs) and for the case with slip side walls (SSWs) [35]. The relative occlusion is R O = 0.6 , the peristaltic wave speed is c = 5 mm s , the power index is n = 1 and the length is L = 180 mm.
Computation 12 00062 g007
Figure 8. Shear rate for multiple squeezing cylindrical segments pulse at the middle of the width and y = 0.05 mm for the case with no slip side walls (NSSWs) and for the case with slip side walls (SSWs) [35]. The relative occlusion is R O = 0.6 , the peristaltic wave speed is c = 5 mm s , the power index is n = 1 and the length is L = 180 mm.
Computation 12 00062 g008
Figure 9. Shear rate as a function of height for various x positions in the middle plane z = 0 . The relative occlusion is R O = 0.6 , the peristaltic wave speed is c = 5 mm s , the power index is n = 1 and the length is L = 180 mm. The unit for x is also mm.
Computation 12 00062 g009
Figure 10. Streamwise velocity component magnitude for Carreau–Yasuda fluids, at the middle of the width and y = 0.05 mm for the case with no slip side walls (NSSWs) and for the case with slip side walls (SSWs) [35]. The relative occlusion is R O = 0.6 , the peristaltic wave speed is c = 5 mm s , the modality is m = 1 and the length is L = 90 mm.
Computation 12 00062 g010
Figure 11. Pressure for Carreau–Yasuda fluids, at the middle of the width and y = 0.05 mm for the case with no slip side walls (NSSWs) and for the case with slip side walls (SSWs) [35]. The relative occlusion is R O = 0.6 , the peristaltic wave speed is c = 5 mm s , the modality is m = 1 and the length is L = 90 mm.
Computation 12 00062 g011
Figure 12. Peristaltic characteristics for various combinations of the values of the parameters. Results for duct of the same geometry with slip side walls are presented [35].
Computation 12 00062 g012
Figure 13. The streamwise velocity field at selected crosswise sections for Newtonian fluids. One cylindrical segment centered at x = 45 mm is placed at an L = 90 mm duct. The wave speed is c = 5 mm/s, and the relative occlusion is R O = 0.6 . A quarter of the cross-section is presented.
Computation 12 00062 g013
Table 1. Geometric, kinematic and fluidic parameters of peristalsis.
QuantitySymbolValueUnit
Half heightH10mm
WidthW20mm
LengthL90 or 180mm
Radius of cylindrical segmentr15mm
Inter cylindrical segment distanced1mm
Fluid density ρ 1000 kg m 3
Dynamic viscosity μ 0.1452 kg m · s
Table 2. Transport efficiency for peristaltic pump with infinite [35] and with finite width for variable wave speed. The relative occlusion is R O = 0.6 , the power index is n = 1 , the modality is m = 1 and the length is L = 90 mm.
c (mm/s)TE IW (%)TE FW (%)
2.578.861.3
578.461.3
1078.861.3
Table 3. Transport efficiency for peristaltic pump with infinite [35] and with finite width for variable relative occlusion. The peristaltic wave speed is c = 5 mm s , the power index is n = 1 , the modality is m = 1 and the length is L = 90 mm.
ROTE IW (%)TE FW (%)
0.228.416.5
0.4-34.9
0.678.461.3
0.895.689.4
Table 4. Transport efficiency for peristaltic pump with infinite [35] and with finite width for variable power-law index. The relative occlusion is R O = 0.6 , the peristaltic wave speed is c = 5 mm s , the modality is m = 1 and the length is L = 90 mm.
Power-Law IndexTE IW (%)TE FW (%)
178.461.3
0.7577.550.3
Table 5. Transport efficiency for peristaltic pump with infinite [35] and with finite width for variable number of cylindrical segments consisting the peristaltic pulse. The relative occlusion is R O = 0.6 , the peristaltic wave speed is c = 5 mm s , the power index is n = 1 and the length is L = 180 mm.
Pulse ModalityTE IW (%)TE FW (%)
16042.8
27860.7
38770.8
Disclaimer/Publisher’s Note: The statements, opinions and data contained in all publications are solely those of the individual author(s) and contributor(s) and not of MDPI and/or the editor(s). MDPI and/or the editor(s) disclaim responsibility for any injury to people or property resulting from any ideas, methods, instructions or products referred to in the content.

