
Graph-Based Interpretability for Fake News Detection through Topic- and Propagation-Aware Visualization

1
Graduate School of Science and Engineering, Kansai University, 3-3-35 Yamate-cho, Suita-shi 564-8680, Japan
2
Faculty of Engineering Science, Kansai University, Suita-shi 564-8680, Japan
*
Author to whom correspondence should be addressed.
†
These authors contributed equally to this work.
Computation 2024, 12(4), 82; https://doi.org/10.3390/computation12040082
Submission received: 22 March 2024
/
Revised: 3 April 2024
/
Accepted: 8 April 2024
/
Published: 15 April 2024
(This article belongs to the Special Issue Computational Social Science and Complex Systems)
Abstract
:In the context of the increasing spread of misinformation via social network services, in this study, we addressed the critical challenge of detecting and explaining the spread of fake news. Early detection methods focused on content analysis, whereas recent approaches have exploited the distinctive propagation patterns of fake news to analyze network graphs of news sharing. However, these accurate methods lack accountability and provide little insight into the reasoning behind their classifications. We aimed to fill this gap by elucidating the structural differences in the spread of fake and real news, with a focus on opinion consensus within these structures. We present a novel method that improves the interpretability of graph-based propagation detectors by visualizing article topics and propagation structures using BERTopic for topic classification and analyzing the effect of topic agreement on propagation patterns. By applying this method to a real-world dataset and conducting a comprehensive case study, we not only demonstrated the effectiveness of the method in identifying characteristic propagation paths but also propose new metrics for evaluating the interpretability of the detection methods. Our results provide valuable insights into the structural behavior and patterns of news propagation, contributing to the development of more transparent and explainable fake news detection systems.
1. Introduction
In the digital age, the proliferation of social network services (SNSs) has fundamentally transformed how information is shared and consumed. SNSs offer unprecedented opportunities for information dissemination; however, they have also become fertile grounds for the spread of fake news, thereby posing significant social and economic risks. For example, the false claim that Hillary Clinton led a human trafficking ring resulted in a shooting incident at the alleged headquarters of the organization, namely, a pizzeria (https://www.nytimes.com/2016/12/05/business/media/comet-ping-pong-pizza-shooting-fake-news-consequences.html (accessed on 21 March 2024)). Similarly, false information suggesting Barack Obama had been injured in an explosion led to a significant economic loss, wiping out USD 130 billion in stock market value (https://www.forbes.com/sites/kenrapoza/2017/02/26/can-fake-news-impact-the-stock-market/?sh=5e7bd2b22fac (accessed on 21 March 2024)). More recently, the spread of misinformation about COVID-19 has exacerbated societal divisions, such as those between vaccine proponents and opponents [1]. For example, it has been reported that Republican Party members in the United States tend to support misinformation about anti-vaccination more than Democratic Party members [2]. Fake news has been found to spread faster than factual news [3]. Therefore, it is difficult to effectively curb its spread through manual fact checking alone to prevent such harm and societal division.
Early fake news detection strategies primarily analyzed news content to automate fact checking, whereas subsequent approaches have exploited the unique propagation patterns of news on social networks by using network graphs to represent the spread of news articles. The basis of these approaches is to represent article propagation on SNSs as a network graph, where posts are nodes and sharing relationships are edges. Using graph neural networks (GNNs) to learn this graph structure, the approach goes beyond simply examining the content of articles to identify unique features of fake news spread in the propagation process, thereby improving the detection capabilities. Additionally, previously, we proposed a fake news detection method that considers chains of similar stances or interaction patterns [4]. This method takes advantage of confirmation bias, in which individuals perceive opinions that align with their beliefs as more persuasive, and the psychological tendency toward homophily [5]. The method is based on studies in which researchers examined how information spreads through interactions between users with similar views [6]. Note that the term “opinion” in this paper means “an idea or view formed about something” and is sometimes paraphrased as “stance” or a similar term. By tracking the formation of propagation between users with similar opinions while accounting for psychological characteristics, we successfully captured the complex structure of fake news spread, which led to improved detection accuracy.
Propagation-based methods offer high accuracy in detecting fake news but lack interpretability in their inferences. These models can identify fake news, but they do not provide clear, human-understandable justifications based on the analysis of propagation structures. The visualization techniques of Lu et al. [7] and Ni et al. [8] highlight key users and attributes in discrimination through attention weight visualization from models with a transformer-based backbone network. The efforts by Jin et al. [9] and Yang et al. [10] to incorporate topic, user, and network information into knowledge graphs provide external knowledge for discrimination. However, these approaches primarily visualize information emphasized during model training. They fall short of providing a consistent explanation for judging news as fake or real, in particular, a logical and systematic explanation of why the propagation structures of fake and real news differ.
Because propagation-based methods focus solely on inference without providing structure-based explanations, post-inference analysis of the propagation graph is the only alternative. Understanding the geometric characteristics of the propagation structures of fake and real news is crucial, but first, a detailed analysis of the factors that shape these structures is necessary to understand why these structural differences occur. Vosoughi et al. [3] and Zhao et al. [11] analyzed the depth of fake news propagation structures and reached similar conclusions. They did not identify the specific factors that lead to the formation of different propagation structures between fake and real news; however, in previous studies, researchers suggested that chains of similar opinions are closely related to the formation of fake news propagation [5,6,12]. Understanding these interactions has contributed to the accuracy of propagation-based detection methods [4]. Therefore, to improve the interpretability of propagation-based detection methods from a structural perspective, it is essential to elucidate the similarity of opinions within propagation structures.
The main goal of this study was to clarify how the propagation patterns of fake and real news differ, to identify the factors behind these differences, and to better understand the methods used to detect fake news based on these patterns. In particular, we examined the alignment of opinions within propagation structures and its relevance in the creation of fake news. This work did not aim to directly reveal the structural patterns that propagation-based detectors learn by analyzing their model parameters. Rather, it visualized the differences in propagation structures between fake and real news by analyzing opinion similarities and graph metrics within these structures, ensuring that the derived observations were statistically grounded rather than subjective. As a result, we revealed structural differences between the propagation graphs of fake news and real news, and inductively identify the predictive basis for the graph structure characterized by the propagation-based detector.
Based on the research background described above, in this paper, we propose an explanation method based on the visualization of article topics and propagation structures to improve the interpretability of graph-based fake news detectors. The proposed module provides visualization information that represents structural elements of the graph (e.g., large hubs of adjacent nodes or the depth of paths) and cluster numbers that represent document topics based on text clustering. Specifically, using BERTopic [13], which is a state-of-the-art topic classification method, we automatically identified topics from text data and analyzed how these topics influenced patterns of news propagation. The similarity of topics could contribute to the formation of specific structural patterns in the propagation of fake news. Understanding this could improve the effectiveness of propagation-based detection methods and play a crucial role in interpreting their reasoning process. Our proposed method helped to analyze the significant structural patterns in these news propagation graphs in a form that was easily understandable by humans.
To validate the effectiveness of our proposed method, we applied the visualization module to several news propagation graphs selected from a real-world dataset and conducted a case study to observe characteristic propagation paths. We then investigated the differences in propagation structures between fake and real news and formulated hypotheses regarding the discriminative patterns of graph-based detectors. By quantifying the results and performing statistical tests based on these metrics, we verified the validity of our hypotheses and demonstrated that our proposed method provides a basis for graph-based identification of fake news.
Our contributions are threefold:
- We propose a visualization method that supports the interpretation of graph-based fake news detection. This method classifies posts (i.e., nodes) in the news propagation graph by topic using BERTopic, thereby revealing chains of similar opinions, similarities within the propagation structure, and their contribution to the formation of fake news.
- We provide details of an evaluation method for interpretability using the proposed method. We conducted a case study using a large-scale fake news dataset constructed from Twitter (now X) post data, observing large networks of news propagation involving many users, tweets, and quote retweets. We expressed the explanations obtained from the observations in terms of metrics, and evaluated the metrics through statistical tests. The novelty of this study lay in proposing a method to visualize the factors that form different propagation structures for fake and real news, and in defining and verifying new metrics to ensure the reliability of the provided inference base.
- The observations and statistical tests provided new insights into the factors that contribute to the formation of news propagation structures, thereby contributing to the analysis of structural factors in news propagation.
In this study, we did not focus on user interface development and did not directly verify whether the proposed method contributed to improving users’ ability to identify fake news and real news, which is a future research topic. However, the reliability of the proposed method was supported by statistical validation using a large real-world dataset.
This paper is organized as follows: Section 2 provides a comprehensive and detailed review of related studies; Section 3 proposes a visualization module using topic classification; Section 4 validates the proposed method with a case study on the Twitter dataset; Section 5 provides a discussion and derives new metrics based on the insights gained. Finally, Section 6 presents the conclusions.
2. Related Work
2.1. Content-Based Detection Methods
Content-based detection methods identify fake news based on the content of articles. These methods primarily focus on analyzing the text of articles, but some also use attached images or videos [14,15]. Collectively, these approaches are known as content-based detection methods. Within this category, style-based detection methods pay particular attention to the emotional language characteristic of fake news [16], using sentiment analysis to identify words or phrases that convey strong emotions [17]. Stance analysis, which assesses the speaker’s position or judgment on a statement, can also be performed based on content [18]. It was suggested that a stance reflects the emotional intensity of the attitude toward a news topic [19,20,21]. Recent advances in content-based methods have seen the application of transformers to text analysis [15], although they face challenges in effectively processing long texts [22]. However, content-based methods struggle to detect fake news, which mimics the writing style of real news, based solely on the content of the news. Therefore, the incorporation of additional features, including social context, was deemed necessary to improve the detection accuracy [23].
2.2. Propagation-Based Detection Methods
Propagation-based methods take advantage of the social context created by news sharing on SNSs, not only the news content itself. These methods distinguish fake from real news by identifying different structural patterns in their propagation [3]. Before GNNs became popular, recurrent neural networks were used to model the sequence of news sharing [24]; however, this approach struggled to capture structural features. GNN-based methods have since gained traction because of their ability to model these complex structures. For example, when a news story is published on Twitter, it is shared by users through posts and further disseminated through retweets. This chain forms a graph with nodes that represent news, tweets, and retweets, and edges that represent sharing interactions. Learning this graph requires unique node features, such as user attributes like follower counts and profile descriptions, to detect users spreading fake news [7,8]. By contrast, news detection uses text features extracted from posts and these features associated with the corresponding post nodes are fed into the GNN for structure learning.
GNNs can learn structure through neighborhood aggregation, aggregating features of neighboring nodes through edges to the focal node for structure-aware learning. The graph convolutional network (GCN) [25] updates a node by convolving its features with those of its neighbors and represents a basic form of a GNN. The graph transformer network (GTN) [26] uses the transformer architecture [27] for neighborhood aggregation by focusing on important nodes based on feature similarity between the focal node and its neighbors.
Monti et al. [28] proposed the first propagation-based method to use a GNN. It uses GCN to learn the structure of news propagation graphs and then uses global average pooling to extract the overall graph structure for detection. Recent developments include not only extracting network features but also combining content-based detection methods to highlight textual features of news content [8,29] and adaptively controlling the news propagation of manipulated nodes to improve the performance [30]. Methods that consider sociologically analyzed characteristics of fake news propagation to improve structural discrimination are also effective. User-preference-aware fake news detection (UPFD) [31] extracts user preferences for information based on the past post history. The authors used stance analysis for feature extraction and GTN to compute the similarity of opinions between neighboring users, with the psychological phenomenon of confirmation bias playing a role in these methods [4]. Confirmation bias, where information that supports one’s own beliefs is considered more persuasive [5], is conceptualized as “preference” in UPFD and “homophily” in our previous research [12]. Since opinion similarity between posts improves the performance of propagation-based methods, these results suggest that GNNs may implicitly capture opinion similarity between posts. Nevertheless, GNNs face a challenge known as the over-smoothing effect, where the distinction between user features becomes blurred due to the aggregation of neighborhood information, potentially obscuring the representation of user homophily. To solve this problem, the integration of learning strategies that account for heterophily [32]—the potential for interactions between users from different viewpoints—was identified as a promising way to improve the performance of graph learning.
2.3. Explainable Detection Methods
Some fake news detection methods aim to visualize the model’s reasoning process. Evidence-based methods, which are derived from content-based approaches, explore similarities and differences between claim statements and texts from multiple sites used as evidence for fact checking. Recent models have become popular for highlighting these similarities and differences by visualizing the intensity of attention to texts, thereby exhibiting the importance of focused sentences or words in interpreting the dubiousness of claims [33]. However, a limitation of evidence-based methods is their reliance on the availability of clear and reliable evidence for each claim, which becomes particularly challenging for claims with ambiguous veracity.
In this study, we focused on the implementation of interpretability within propagation-based methods; however, no existing models can explain inferences from the structure of propagation networks. We present detection methods that can visualize inference over networks, which are broadly categorized into attention-based and knowledge-graph-based methods.
Attention-based methods identify the tendencies of users who spread fake news by assigning user attributes within the propagation network. For example, Propagation2Vec [34], which is categorized as a propagation-based method, identifies key user attributes in tweet-to-retweet cascades. The graph co-attention network (GCAN) [7] visualizes critical user behaviors by linking user interactions with content and posting order. The multi-view attention network (MVAN) [8] uses the graph attention network [35] to identify user attributes that contribute to detection. GCAN focuses on words or phrases that users pay attention to, whereas MVAN highlights words that are considered indicative of falsehood.
By contrast, knowledge-graph-based methods use collective intelligence that aggregates multiple pieces of information, including user attributes and frequently occurring words in articles, to visualize reasoning behavior in detail. Jin et al. proposed a graph-kernel-dependent method, which moved toward fine-grained reasoning [9], and its improvement, reinforcement subgraph reasoning [10]. These methods divide the knowledge graph into subgraphs and display those composed of knowledge groups that ease news discrimination. Yang et al. discussed the effectiveness of visualization in these methods, with subject evaluations based on the visualization information, calculation of accuracy, and aggregation of confidence levels during judgment using Likert scales in [10].
However, these methods still encounter interpretability challenges. User attributes are useful for identifying users spreading fake news; however, the attributes used for learning are not consistent across methods, and the types of user attributes to focus on differ between fake and real news, which makes it difficult to provide consistent explanations for inference. In particular, in Propagation2Vec, focusing on the same user attributes for both individual-level and cascade-level attention blurs the distinction between the attention of different individuals, which makes it difficult to determine consistent explanations.
GCAN and MVAN visualize significant words through word clouds, highlighting words that contribute to fake news judgment. MVAN and knowledge-graph-based methods [9,10] enable referencing sentences or words that facilitate fake news judgment. However, they focus on sentences in which users explicitly judge the content as fake, such as “confirmed” or “Sorry fake news”, which prevents the direct identification of the reasons for the news being fake from the visualization information. Supervised deep learning models learn to fit data that represent correct labels, which can contribute to increased confidence in the visualized information. However, in ambiguous truth conditions, this may only reinforce biases, such as “it’s fake news because a user said so”.
In the context of improving interpretability, our goal was to provide users with the ability to understand the reasoning behind the classification of news as fake using visualized data. This capability will empower users to assess the credibility of news stories, potentially before they are widely disseminated. By fostering a culture of critical thinking in the evaluation of information and opinions, we aimed to help mitigate the spread of fake news. However, existing methods encounter obstacles in providing explanations that are consistent and reliable across cases when distinguishing between fake and real news. “Consistent explanations” refers to the provision of reasoning that remains stable and coherent across cases.
2.4. Propagation Patterns of Fake News
Currently, no methods have been explicitly designed to elucidate propagation structures, and the factors that form different propagation structures are not fully understood. Vosoughi et al. analyzed propagation networks with convergent diffusion and reported that false information spreads from one user to another, involving many users and forming deep propagation structures [3]. Similarly, Zhao et al. analyzed networks observed in the early stages of diffusion and showed that real news propagation tends to form dense structures, as users cluster around the disseminated information, whereas fake news forms sparser networks, with connections between users becoming more pronounced [11]. A commonality in these reports is that fake news propagation is formed by the exchange of information transmitters from one user (A) to another (B), and from B to another user (C), and so on. Vosoughi et al. described this user-to-user sharing chain as viral and associated such propagation with a viral branching process. By contrast, dense structures in which many users share the same information, similar to the way television shows or newspapers disseminate information to a large audience, are referred to as broadcast [3]. Viral propagation suggests a link to confirmation bias, where users share opinions that align with their own beliefs. The analysis of the factors that drive these viral-like user propagation chains remains inadequate.
There are exceptions to the findings reported by Vosoughi et al. [3]. Notably, Jang et al. reported instances in propagation graphs used to learn fake news detection methods where real news was spread more deeply and to more users than fake news [36]. This suggests that both real and fake news can form deep pathways as user engagement increases.
In this study, we quantified and verified patterns that can distinguish fake news propagation graphs based on insights gained from the efficient visualization of complex graph structures as the number of nodes increase. In particular, the interaction between users sharing similar opinions is believed to be deeply related to the propagation of fake news, particularly at points where user sharing is facilitated. Therefore, to explain the veracity based on structure, it is necessary to analyze not only the structural differences but also their formation through user interactions and post content. For example, the visualization might reveal that fake news often spreads through tightly knit clusters of users with high opinion alignment, whereas real news tends to spread more broadly across diverse user groups. Such insights could improve the interpretability of traditional propagation-based detection methods.
3. Proposed Method
In this section, we elaborate on a visualization method specifically designed to enhance the interpretability of results derived from propagation-based fake news detection strategies. The conceptual framework of our proposed approach is shown in Figure 1. It systematically extracts and visualizes relevant information from the news propagation graph—which includes both news articles and their associated posts—guided by a set of rules based on graph metrics. This structured approach helps to demystify the inference process used by propagation-based detectors. A key and novel feature of the module is a focus on the consensus of opinions within the propagation structure and the subsequent effect of this consensus on the emergence of fake news. Using text clustering, the module classifies nodes according to their textual content, thereby facilitating a deeper understanding of the underlying patterns that may indicate the presence of fake news. Although our framework is compatible with various text-clustering methods, for this investigation, we chose BERTopic, which is a state-of-the-art text-clustering technique for topic modeling, because of its robustness and accuracy. In recent years, BERTopic has been employed as a method for various data analyses of news and social media posts, such as the topic analysis of profiles of users who mentioned QAnon [37], topic analysis as a comparison material for the veracity of news sources [38], and temporal changes in posts with topics of vaccine skepticism and denial [39]. In the following section, we review text clustering via BERTopic and explain the functionalities of our visualization method.
3.1. Text Clustering Using BERTopic
BERTopic is a text-clustering method that uses text vectors based on the transformer architecture to generate topic representations. We describe a BERTopic algorithm using general notation. First, each document is fed into the bi-directional encoder representations from transformers (BERT) [40], which is a pre-trained language model, to obtain the text embedding of document d. D is the set of documents and H is the dimensionality of the embedding vector.
Then, to reduce the dimensionality of the document embeddings , the uniform manifold approximation and projection for dimension reduction (UMAP) [41] is used to obtain lower-dimensional embeddings , where L is the dimension after the UMAP transformation. This is represented by the projection function as .
Finally, hierarchical density-based spatial clustering of applications with noise (HDBSCAN) [42] is applied to the lower-dimensional embeddings for clustering. HDBSCAN, which is an extension of DBSCAN, uses density-based clustering to detect dense regions in the document embeddings and forms groups of similar topics through hierarchical clustering. The HDBSCAN process starts by setting a minimum cluster size MinClustSize, which defines the minimum number of data points that are recognized as a cluster. For the projected embedding set , density estimation is performed using the nearest MinClustSize data points, thereby identifying high-density areas (centers of clusters). Then, starting from these high-density areas, hierarchical clustering is performed to group data points with similar densities. After the clustering is complete, each document d is assigned a topic label based on the clustering results. This is defined as the clustering function as , where data within a cluster belong to the same topic and data outside the clusters are treated as noise. Unlike traditional clustering methods, such as k-means, HDBSCAN does not require the number of clusters to be predetermined, which makes it suitable for the topic modeling of text data.
3.2. Visualization for Interpretability
First, we define a news propagation graph, which is the basis of the proposed method. A propagation network consists of a specific news article and its related social media posts and quote retweets, where V represents the set of nodes and E denotes the set of edges. We consider nodes corresponding to the news article , related post (tweet) nodes , and retweet nodes . represents the set of news article nodes, the set of post nodes, and the set of retweet nodes. Note that to monitor information propagation, this study was limited to quote retweeting, which is a function that allows users to post tweets of other users with their own comments added to them. The propagation network G includes one news article node . The post node set is associated with this news article node, denoted by for simplicity. The edge indicates the relationship between the news article node and the post node , and the edge represents the quote retweet relationship between the post node and retweet node . No edges are set between post nodes, and each edge represents diffusion from the news article or direct sharing between posts. This propagation network structure clearly illustrates how a specific news article spreads and proliferates on social media. The propagation network is defined mathematically as follows:
where represents the set of edges between the news article node and post nodes, and represents the set of edges between post nodes and retweet nodes. This definition allows for a detailed understanding of news propagation patterns on social media through the analysis of the propagation network.
Information from the many posts that make up the propagation network, such as user opinions on current events, viral memes, news article shares, and social commentary, provides insight into what cascades propagation-based methods focus on during the inference process. However, it is impractical to meticulously read every post. Our approach used BERTopic to categorize posts and retweets from the set into topic-specific clusters based on content similarity, treating each post as d, as described in Section 3.1. This provides an opportunity for an a posteriori analysis of the correlation between graph structure patterns and post content identified by black box models, such as GNNs, which learn to prioritize interactions between similar opinions in the inference process. This approach streamlines the analysis by focusing on aggregated clusters of similar content, such as discussions around political events or public health guidelines, and then improves our understanding of how propagation-based detectors discriminate between real and fake news based on observed propagation patterns.
As the graph grows larger, the nodes that represent posts and the edges connected to them become denser, which increases the effort to count the number of shares and makes it visually difficult to determine which path originated from which post by following the edges. The proposed method focuses on four types of graph metrics when analyzing propagation graphs for visualization:
- (1)
- Number of adjacent nodes: This metric is key to exploring the factors that shape broadcast-type propagation structures and can capture the influence of a particular node in the network. The number of nodes adjacent to the target node v is defined aswhere is the set of nodes adjacent to node ; is an element of the adjacency matrix that is set to 1 if there is a direct link from node v to node u, and 0 otherwise.
- (2)
- Depth of the propagation paths: This metric represents the number of hops from the root node to the terminal node and is a key metric in the analysis of viral-type propagation. It helps us to understand the structure and extent of widespread propagation. Along with the number of adjacent nodes, the visualization of these structural elements focuses on significant cascades and visually captures the differences in graph structures. The depth of each propagation path , where P is the set of propagation paths, is defined aswhere is a terminal node and is the set of terminal nodes. is characterized by having no outgoing edges. Mathematically, this can be expressed as . This notation states that the set of terminal nodes consists of all nodes in the set of all nodes V for which no node exists in V such that there is an edge from to in the set of edges E. In the context of the described propagation network, most terminal nodes are likely to be in the set of retweet nodes ; however, some post nodes could also be terminal nodes if they do not lead to any retweets. calculates the shortest path from node to using Dijkstra’s algorithm.
- (3)
- Topic distribution of nodes adjacent to a hub: When investigating a hub, specifically nodes with high connectivity (), we can analyze the topic distributions among these connected nodes using BERTopic for node clustering. This analysis enables us to identify patterns and shifts in the content shared through the hub, which facilitates an understanding of how topics relate to broadcast and viral propagation cascades. To quantify this, we count the nodes of each topic among the hub’s adjacent nodes. If node u adjacent to hub v is classified under topic number , we count these occurrences for each topic t using an indicator function , which is 1 if node u is associated with topic t, and 0 otherwise. This results in a count for each topic t among nodes adjacent to v, as shown below:The topic distribution for nodes adjacent to v is represented as a vector as follows:where T is the total number of topics (in addition to clusters) determined by HDBSCAN.
- (4)
- Topic sequence derived from a hub: Visualizing the topic sequence derived from a node provides insight into the flow of topics within a propagation network, identifying how specific topics evolve and transition as information spreads from a hub node to the periphery. This topic sequence visualization module is provided to visualize the similarity of opinions as information propagates. To define the topic sequence derived from a hub to the terminal node, we introduce the concept of a topic transition path. The topic sequence along a given propagation path from the hub node to a terminal node can be represented by a sequence of topics associated with each node along this path as follows:where is a hub node with high , is a terminal node, and represents the topic of the i-th node along the path p.
4. Experiments
In the experiment, we demonstrated the effectiveness of our newly developed visualization method through an experimental setup that consisted of four distinct steps:
- Step 1.
- The proposed method was applied to the news propagation graph (Section 4.1).
- Step 2.
- Using the visualization information obtained, propagation cascades on Twitter were selected for observation within the news propagation graph and the substructures of the propagation were analyzed while interpreting the text based on the visualization information (Section 4.2).
- Step 3.
- The observations were quantified as metrics and analysis was performed over the entire graph (Section 4.3).
- Step 4.
- Statistical tests were performed based on the analysis results (Section 4.3).
We discuss the experimental results in Section 5. Step 4 focused on applying statistical tests to validate whether the visual cues related to distribution characteristics could discriminate between the distribution of fake and real news. This step involved generating hypotheses based on the visual data and testing their statistical significance. A positive result in this step would confirm the effectiveness of the visualization method in identifying structural variances in the propagation graphs of different types of news, thus providing a reliable predictive basis for propagation-based detectors.
4.1. Data Collection and Application of the Proposed Method to the News Propagation Graph
The observed news propagation graphs consisted of large-scale data collected from news stories that were verified by the fact-checking website PolitiFact (https://www.politifact.com/ (accessed on 20 June 2023)) and posts that were deemed to be related to them [4]. The data included the spread of the news on Twitter for one month after its publication, from December 2020 to July 2022. Tweets related to the news were collected using the Twitter API v2 (https://developer.twitter.com/en/docs/twitter-api (accessed on 20 June 2023)) based on search queries generated from a list of keywords based on the frequency of word occurrences in the news. To avoid selecting overly general queries, the number of keywords used to construct the query was set to four. All combinations of the four selected keywords were searched and tweets that matched multiple queries were collected without duplication. Using common words as search terms may identify tweets that are not directly related to the news. It is difficult to manually review and remove content because of the legitimacy of the content judgment and the significant effort required. Therefore, the data collected in the study may have included noisy tweets unrelated to the news. Quote retweets were collected iteratively based on the IDs of the collected tweets. Based on this collected data, news propagation graphs were constructed. Each news propagation graph required a fact-check result and a corresponding real/fake label. In this collected data, following the examples of [33,43], PolitiFact judgments of true and mostly true were labeled as real, whereas mostly false, false, and pants-on-fire were labeled as fake.
The proposed visualization method was applied to the constructed news propagation graphs to obtain visualization information. This step corresponded to step 1 of the experimental procedure. The parameter MinClustSize in BERTopic was set to the default value of 10 in the official implementation (https://github.com/MaartenGr/BERTopic (accessed on 14 December 2023)) to eliminate the parameter dependency of the proposed method. Regarding the cluster numbers in the visualization information, BERTopic outputs a special cluster number −1 for outlier data that do not belong to any clusters allowed by HDBSCAN. However, because of the transformer’s problem with long texts, BERTopic may assign the cluster number −1 to the news article text. Treating the news article text, which best represents the news propagation graph as a root node, as outlier data is inappropriate. For a fair comparison in this experiment, news propagation graphs where the news article text was assigned the cluster number −1 were excluded from the analysis.
The statistics of the graph data are shown in Table 1. The amount of the collected post data was comparable with that of the traditional representative dataset, namely, FakeNewsNet [43]. Thus, this dataset was sufficiently large and provided a foundation for exploring the generalizability of our findings. Data collection was limited to using the API according to Twitter’s privacy policy, whereas FakeNewsNet currently has a large number of data points that cannot be collected because of the deletion of posts and users; hence, it was excluded from the experiment.
The dataset contained 5696 hubs, where a hub was defined as any non-terminal node with more than one adjacent node. The distribution of the number of adjacent nodes for these hubs is shown in the histogram in Figure 2, where each bin has a width of approximately 10 from the minimum value. In addition, Figure 3 plots the number of adjacent nodes for each hub in ascending order. Figure 3 illustrates that within our collected dataset, only a few hubs exhibited explosive propagation, which was characterized by an extremely large number of adjacent nodes to a single node, as indicated by the sharp rise in the plot. Figure 2 and Figure 3 show that nodes with more than 400 neighbors were in the top 1%, while nodes with 30 or fewer neighbors represented 70% of the total. For the entire dataset, there were 164,641 paths of depth 2 and 17,184 paths of depth 3 or more.
4.2. Case Studies
In this section, we follow step 2 of our experimental framework, focusing on observing news propagation, understanding its structure, and correlating it with the textual content. The goal of these case studies was to show how our proposed visualization method can help identify the cascades that are essential for distinguishing fake news from real news, and to illustrate their role in making this distinction. To ensure a fair comparison between the spread of real and fake news, we standardized both to the same order of magnitude in terms of scale.
The selection of objects to observe from the news propagation graph must be based on visualization information. First, we focused on active cascades, which contained a large number of posts and had deep propagation. By extracting paths with deep cascades and observing changes in the number of quote retweets of posted nodes in the paths and the number of adjacent nodes following them, we could understand the characteristic structures of the cascades. By selecting deep paths with post nodes that had a high number of adjacent nodes, we selected cascades with a high volume of posts. Therefore, we extracted paths with a significant depth and hubs with a large number of adjacent nodes from the visualization information as selection criteria for structures to analyze the differences in propagation.
Next, we analyzed the process of structure formation while interpreting the content of posts based on the consensus of opinions. We used cluster numbers for this analysis. A cluster number represents a group of texts with similar content to a single topic. Selecting posts with the same cluster number among adjacent posts allowed us to analyze the presence or absence of interactions between the same opinions. In particular, considering that consensus (i.e., agreement) with the opinions of others is related to the propagation of fake news, the exploration of same-topic interactions among topic transitions of hub nodes that form a deep path representing a chain of inter-user sharing is useful for analyzing the relationship between the propagation of fake news and the consistency of opinions. However, posts that were assigned a cluster number of −1, which indicates that they did not belong to any cluster, indicated a low probability of content similarity between adjacent posts. Therefore, we did not consider them in the opinion similarity analysis.
To summarize, by using the proposed method, we selected observation paths based on three criteria:
- (1)
- Paths with significant depth.
- (2)
- Hubs with a high number of adjacent nodes.
- (3)
- Adjacent nodes with the same cluster number.
These criteria served as axes for the selection of observation paths. In the following sections, we present two cases of fake news propagation (Section 4.2.1) and real news propagation (Section 4.2.2).
4.2.1. Case Study for Fake News Propagation
First, we observed the example of fake news propagation shown in Figure 4. Before explaining the graph, we describe its components. The article section shows the context of the news story, with the claim that PolitiFact is addressing underlined (this was the focus of the assessment). In the post nodes, the green-encircled text represents tweets, whereas the blue-encircled text represents quote retweets. For each post, the cluster number, full text of the post, and number of adjacent nodes are listed from top to bottom. The cluster number is highlighted in red if it matches the number of an adjacent post. In the post text, user accounts are anonymized with (@) and URLs or links are anonymized with (URL). The yellow highlighting for the number of adjacent nodes corresponds to the highlighting in the table at the bottom-right of the image. This table lists the number of adjacent nodes in descending order down to the fifth node, with the maximum depth reachable by the path through that node in parentheses. In particular, if this depth is the maximum for the entire news propagation, it is marked as “deepest”. If the observed node appears in the table, the numbers in the table are highlighted.
Figure 4 shows a large cascade in the news propagation graph for the following false claim: “In the United Kingdom, ‘70-plus percent of people who now die from COVID are fully vaccinated’”, which consisted of 27,068 nodes and 26,734 paths. We selected this cascade because of its significant depth and number of nodes. In particular, there were only two types of paths with a depth of four: paths through quote retweet nodes with 8 or 61 adjacent nodes, as shown in Figure 4. Additionally, it is possible to visually confirm that tweets and their quote retweets in this cascade belonged to the same cluster number, and to direct attention to examining the actual content of the posts to predict the continuity of opinion, particularly when the cluster numbers were not contiguous.
The tweets that responded to this fake news introduced the content and link to a weekly report from the United States CDC [44]. The report discussed 90 to 180 days of protection against COVID-19 based on a comparison of immunity from previous infections and vaccination. However, the authors of the report did not mention that the analysis was limited to early protection, which seems to have caused controversy. The actual report, which is not shown in Figure 4, includes a graphical abstract of its contents (http://dx.doi.org/10.15585/mmwr.mm7044e1 (accessed on 21 March 2024)), with annotations such as “COVID-19-like illness hospitalizations 90–179 days after previous infection or full vaccination” and “Received two doses of an RNA vaccine and no previous infection” written in smaller type than the surrounding text. A review of the post on social media shows that an image was attached to the text of the post, which made it difficult to understand the premise that it was limited to early prevention without reading the smaller text.
The graphic abstract highlights the remainder of the statement: “A study of hospitalized patients with symptoms similar to COVID-19 found... Unvaccinated people with a previous infection were 5 times more likely to have a positive COVID-19 test than vaccinated people. Get vaccinated as soon as possible”. Regardless of this, the post alone was insufficient to provide accurate information and may have led to misleading interpretations (https://firstdraftnews.org/articles/fake-news-complicated/ (accessed on 21 March 2024)) about vaccine efficacy. Moreover, the tweet was followed by retweets of the quote that prioritized pro-vaccine claims without addressing the misconception, thereby sparking intense debate.
One path branching off from this quote retweet (the left path in Figure 4) consisted of posts questioning the validity of the experiment, implying skepticism about the research subjects and analytical methods used to support the claim. The other path (the right path in Figure 4) contained posts criticizing those who agreed with the report. The “Rochelle Walensky” mentioned in the text was the former director of the CDC. The last post in the path appeared to be supportive of the CDC; however, the context “In other words” was interpreted as sarcasm, implying “job well” for the CDC for releasing a report that undermined public trust, and categorizing it as critical of the CDC.
Based on the analysis, we found that fake posts typically had fewer nodes directly connected to the original post, but many deep paths extended from it. For example, while the maximum number of nodes directly connected to a post was about 120, the number of paths that extended three levels or more deep was significant. Specifically, there were more than 150 paths that extended from nodes with about 90 connections, including 60 from criticism of a former CDC director, indicating viral-like propagation. Notably, the number of paths of depth 3 or more in this subset accounted for 0.8729% of the 17,184 paths of depth 3 or more in the entire dataset. In contrast, the green-encircled tweet had the largest number of adjacent nodes in this cascade, and the number of depth 2 paths that consisted of this node was 0.07289% of the 164,641 depth 2 paths in the entire dataset. Therefore, the ratio of the number of paths of depth 3 or more to the size of the number of adjacent nodes was , indicating the predominance of viral features, i.e., mainly paths of depth 3 or more. Furthermore, this cascade showed agreement between adjacent posts, as evidenced by the clustering of posts with the same topic number. This clustering suggests that the repetition of certain phrases or sentences from the original post to emphasize its message led to a similarity in expression, which, in turn, was captured as agreement in the propagation structure of fake news. This observation underscored the role of agreement in shaping the spread of fake news.
4.2.2. Case Study for Real News Propagation
Next, we observed an example of real news propagation on a scale similar to that shown in Figure 4. The news in the article section of Figure 5 is an official statement made by Joe Biden, the 46th President of the United States, from the White House. The gun control law mentioned in the article text refers to the so-called Brady Bill, which was enacted in 1994 under the administration of William Jefferson Clinton, the 42nd President of the United States. This law, which was initially a five-year temporary law, was extended for another five years before expiring in 2004 under the administration of George W. Bush, the 43rd president. The news propagation graph associated with this claim consisted of 23,153 nodes and 22,936 paths.
The findings on fake news propagation presented in Section 4.2.1 suggest that real news propagation may exhibit contrasting characteristics, such as a higher number of adjacent nodes; a reduced frequency of depth 3 paths, indicating user-to-user sharing; and an absence of consensus interactions within these paths. This section presents identified instances of propagation that exhibited these characteristics. Figure 5 shows a cascade that satisfied the assumption of real news propagation characteristics and was discovered by using the proposed method. The green-encircled tweet following the article in Figure 5 shows a significant hub compared with Figure 4 and contained paths with a depth of 3, which indicates chains of user sharing. However, there were no consecutive identical cluster numbers. This tweet directly addressed the content of the claim, and notably, the poster was President Biden himself. The tweet rephrased the claim in the underlined section of the article as “The gun control law we Democrats passed was repealed by Republicans, and since then, the number of shootings has tripled”. The top two posts with the highest number of adjacent nodes among the quote retweets following this tweet are shown in Figure 5. In the cascade on the left side of Figure 5, there was a quote retweet that showed a sympathetic attitude toward the tweet. However, the quote retweet appeared to refer to a new gun control bill that the posting user (a Democrat Party member) claimed to have introduced, and therefore, the content was not directly identical to the target news, and the cluster numbers did not match. The path ended with a quote retweet that expressed a negative view of the passage of the gun control bill by referring to “Americans’ inherent rights”, which contradicted the values of the gun control bill and implied the Second Amendment to the United States Constitution. A quote retweet was observed that indicates that the argument regarding the effectiveness of the gun control bill, i.e., the contribution of the gun control bill to the reduction of shootings, could not be inferred, and was located at the node with 16 adjacent nodes in Figure 5. An investigation of the authenticity of this statement found that the referenced “An Updated Assessment of the Federal Assault Weapons Ban” [45,46] existed. This official document published by the Office of Justice Programs of the United States Department of Justice stated that the law exempted millions of assault weapons and large-capacity magazines from regulation and that it is too early to conclude that the law contributed to a reduction in gun violence. This path ended with a post that distrusted the parent post.
As shown in Figure 5, we observed that there existed propagation paths with a depth of 3, even in real news propagation. The number of nodes adjacent to the tweet node reached 414, which was the number of adjacent nodes that belonged to the top 1%, as shown in Figure 2. The path propagated from this tweet node reached a depth of 3 via the quote retweet nodes with 28 or 16 adjacent nodes. The number of adjacent nodes to these quote retweet nodes was relatively small compared with the number of adjacent nodes that the tweet node had, suggesting that this was an exceptional path. Further examination shows that if we estimated the total number of paths with depth 3 or more to be 44, based on the sum of the neighboring nodes for the quote retweet nodes, this represented 0.2561% (=) of the total dataset’s paths with depth 3 or more. On the other hand, if we estimated the total number of depth 2 paths to be 414, following the tweet node’s neighbors, this was 0.2515% (=) of the total dataset’s depth 2 paths. Therefore, the ratio of paths of depth 3 or more to the size of the adjacent nodes was 1.018 (=), which was about 1/10 of the ratio calculated in Section 4.2.1 for the case of fake news. This indicates the dominant broadcast-like characteristic, where a large number of nodes cluster around widely disseminated tweets.
Furthermore, we observed that users often made their own claims and engaged in discussions in quote retweets that were not included in the original tweets, suggesting that paths with a depth greater than 3 did not necessarily share the same stance. Figure 4 shows cases where the topic number matched between adjacent nodes due to the repetition of the original tweet’s claim. In contrast, Figure 5 demonstrates that posts with unique claims or perspectives from users in quote retweets typically did not cluster in the BERTopic analysis, thus receiving the exceptional cluster number −1.
4.3. Hypothesis and Statistical Test
Hypothesis—Summary of the hypotheses based on the observed propagation characteristics of both real and fake news:
- Characteristics of real news propagation:
- –
- A large number of quote retweets were adjacent to a single tweet.
- –
- Although a single tweet was widely viewed, few paths existed with a depth greater than 3, which indicates a lack of chains of sharing among users.
- –
- This suggests that broadcast characteristics were more pronounced than viral characteristics in real news propagation.
- Characteristics of fake news propagation:
- –
- The number of neighboring nodes tended to be lower compared with the propagation of real news.
- –
- A viral structure with many paths of depth greater than 3 was observed.
- –
- Stance consistency between posts were confirmed, which contributed to the activation of discussions through quote retweets.
To extend these hypotheses to a structural analysis of all graphs in the dataset, we converted the observations into quantitative metrics, corresponding to step 3 of the experimental procedure. According to the hypotheses, real news propagation showed a broadcast structure with a large number of adjacent nodes and fewer paths with depth greater than 3, whereas fake news propagation showed a viral structure with fewer adjacent nodes, but many paths with depth greater than 3. Furthermore, the confirmation of opinion similarity within the viral structure was crucial. When observing the visualization results, we focused on paths where post nodes with the same cluster number were consecutive. Therefore, to quantify the characteristics of fake news propagation, it was necessary to count the number of paths, i.e., , that were adjacent between posts with the same cluster number and had a depth greater than 3. The greater the number of such paths, the more likely it was that the posts along those paths shared similar opinions. The total number of paths in the news propagation graph scaled with the number . Observations about the number of adjacent nodes focused on the density of a single post, and thus, could be compared with the maximum value . Considering the lower in inferring the spread of fake news, the observations were ultimately represented by the following intuitive metric:
where is the total number of nodes in the news propagation graph, which was used to scale the number of adjacent nodes . This metric compared the ratio of the maximum number of adjacent nodes to the number of paths with a depth greater than 3 that had adjacent nodes with the same cluster number, with larger values indicating fake news.
Statistical test—We expected this metric to produce larger values for fake news propagation than real news propagation. We analyzed this assumption through statistical tests that corresponded to step 4 of the experimental procedure. The distribution of the metric calculated for each news propagation graph was not normal (Shapiro–Wilk test: ); therefore, we applied the U-test to the hypothesis that “the metric values for fake news propagation do not tend to be larger than those for real news propagation”. The result was , which allowed for rejecting the hypothesis and indicates that the metric values for fake news propagation tended to be larger than those for real news propagation. This suggests that the differences in propagation characteristics outlined in the hypotheses contributed to a structure-based explanation for distinguishing fake news from real news. Specifically, this result shows that the propagation characteristics identified in the case studies, such as the viral characteristics and consistency of opinions in fake news cascades, may be representative of broader patterns in the dataset. Furthermore, this result demonstrates the effectiveness of the proposed method in supporting an efficient search for observation targets and providing visualization information for analyzing the relationship between the graph structure and post content.
5. Discussion and Conclusions
5.1. Exceptions and Limitations
The proposed method is a tool capable of visualizing the differences in the propagation structures of fake and real news, and the factors that contribute to the formation of these structures. However, it cannot provide consistent conclusions for all cases. This limitation is evident in the propagation patterns of topics that generate social debates or complex news content. In this section, we present two examples that demonstrate the limitations of the proposed method and examine scenarios in which the hypothesis from Section 4.3 does not hold.
5.1.1. Exceptional Case of Fake News Propagation
An exceptional example of fake news propagation, as shown in Figure 6, relates to “the recommendation of gender-neutral expressions and the substitution of ‘chairman’ with ‘chair’ in the House rules”, which was adopted by the United States House of Representatives on 4 January 2021. This topic, which involves societal debates, such as the shift to gender-neutral expressions, was highlighted in a claim posted on the official site of Glenn Grothman, who was a Republican House member at the time, and was later deemed fake news by PolitiFact.
The propagation graph constructed from posts related to this claim comprised 3051 nodes and 3018 paths. Focusing first on the path shown on the left-hand side of Figure 6, the tweet from the green node on the left addressed the Democratic Party’s factual changes in House rules to eliminate gender discrimination, without directly engaging with the falsehoods highlighted by PolitiFact. This tweet garnered 1224 quote retweets, approximately one-third of the total node count, which represents a typical broadcast-type propagation of factual information according to our metrics. Most of these quote retweets responded to the tweet’s concluding question: “Can we get an amen?” To confirm this, we analyzed the topic distribution. The quote retweets responding to the question are assigned cluster number 0, where posts containing the word “amen” or “awomen” were classified. Moreover, the topic distribution of the nodes shows that out of the 1224 adjacent nodes, the largest number of 394 nodes shared the same topic number 0. However, because the source tweet claim was a fact, paths deeper than depth 3 were rare, and the number of nodes that comprised the depth 3 path shown on the left side of Figure 6 was also small. This was a complex cascade of factual claims deployed against fake news articles that did not meet the assumptions in our focused propagation-based detection method.
The path starting from the green node’s tweet on the right branched off from a tweet that disseminated false information, which mistakenly interpreted the “prohibition in the text of the House rules” as a “ban in Congress”. The subsequent quote retweet claimed the extremism of the gender-excluding Democrats. The final post agreed with this quote retweet and offered speculation about the motives behind the gender exclusion. The visualization provided by the proposed method shows that a path of depth 3 propagating from a hub with more than 100 adjacent nodes indicates the presence of virality in the structure of this propagation cascade. Specifically, approximating the number of paths at depth 2 by the number of 113 adjacent nodes accounted for 0.06863% of the entire dataset. However, the number of paths deeper than 3 passing through vertices with 40 adjacent nodes accounted for 0.2328% of all paths deeper than 3 in the dataset. The ratio of the number of paths deeper than 3 to the number of adjacent nodes was . While there were 113 adjacent nodes on the right side of Figure 2, according to Figure 3, this number did not indicate widespread diffusion around a single node. This observation was reflected in the higher ratio of the number of paths deeper than 3 to the number of adjacent nodes compared with the ratio calculated for the real news case in Section 4.2.2, suggesting that this cascade had a predominantly viral tendency. However, as mentioned earlier, we did not observe a cluster number agreement due to the presence of quote retweets that added the users’ own claims to the source news topic in the propagation path. This trend was similar to the real news case in Section 4.2.1, making it difficult to distinguish whether this cascade was fake or real. It is important to note that even if the cascade on the right side of Figure 6 was viral propagation, its size was smaller than the broadcast propagation shown on the left side of Figure 6, emphasizing the importance of the cascade on the left. Therefore, the metric identified this propagation pattern as having the characteristics of real news rather than fake news.
5.1.2. Exceptional Case of Real News Propagation
Next, an exceptional case of real news propagation is illustrated in Figure 7. The news pertains to the transcript of a town hall event that was hosted by CNN on 21 July 2021 and attended by President Biden. The propagation graph constructed from posts collected as being related to this claim comprised 3240 nodes and 3207 paths. Similar to cases accurately identified as fake, a large cascade formed from tweets with content not highly relevant to the claim. The tweet content was factual, yet it implied that President Biden made the false statement that “350 million Americans have been vaccinated against COVID-19”. The following quote retweets simply rephrase a false statement made by President Biden, suggesting an intent to emphasize his dishonesty, as analyzed in the case study on the spread of fake news in Section 4.2.2. On the left side of Figure 7, quote retweets containing the phrase “Fun fact” led to a mismatch in cluster numbers between adjacent posts, indicating that these expressions fell outside the cluster. The cascade contained tweets with a large number of adjacent nodes, placing it in the top 1%, indicating a broadcast structure. However, when examining the number of adjacent nodes in the subsequent quote retweets (112 and 8), it was clear that viral propagation through additional quote retweets was also prevalent, especially since adjacent nodes shared the same cluster number, suggesting a high likelihood of fake news propagation. Specifically, estimating the number of depth 2 paths at 534 adjacent nodes accounted for 0.3243% of the entire dataset. In contrast, estimating the number of paths deeper than depth 3 through the sum of adjacent nodes in quote retweets as 120 accounted for 0.6983% of all paths deeper than depth 3 in the dataset, with a ratio of . Despite the large number of adjacent nodes, indicating a broadcast structure, the number of paths deeper than depth 3 approached that of the fake news cases in Section 4.2.1, also suggesting a viral structure. The key indicator of fake news in this context was the presence of adjacent nodes with the same cluster number within a viral structure.
To summarize, these exceptional cases demonstrate that although the proposed method effectively revealed differences in the propagation structures of fake and real news, it encountered challenges under certain conditions. In particular, these exceptional cases that involve socially controversial topics or statements by public figures, which attract widespread attention, highlight the limitations of the proposed method in distinguishing between fake and real news propagation structures. To complement the analysis of these propagation structures and enable a more detailed examination, it is necessary to introduce external knowledge about the content of the news and its social context.
Moreover, BERTopic labels unique documents that occur infrequently as −1, indicating that they do not belong to any cluster. In our visualization framework, this classification helped to interpret unique user claims. However, a limitation of our topic modeling-based approach was its limited ability to capture the context of specific responses, as illustrated by the classification of the phrase “Fun fact” as −1.
5.2. Relationship between Similarity of Opinion and Virality
In this study, we introduced metrics that accounted for the similarity of opinions within deep propagation paths based on user sharing. In this section, we compare the analysis results based on these opinion-sensitive metrics with previous research findings and discuss the significance of opinion similarity in interpreting propagation structures. We also explore insights into the nature of news propagation revealed through this research.
In previous studies [3,11], researchers highlighted the broadcast nature of real news propagation and the viral nature of fake news propagation. These characteristics are represented by the following metric:
where is the number of paths with a depth greater than 3, is the total number of paths in the news propagation graph, is the maximum number of adjacent nodes across all nodes in the graph, and is the total number of nodes in the news propagation graph. We expected metric to yield smaller values for real news propagation with broadcast characteristics and larger values for fake news propagation with viral characteristics. We verified the effectiveness of this prediction in discrimination through statistical testing under the same conditions as those in the previous section’s statistical tests. Because the Shapiro–Wilk test results were significantly low (), we used the U-test for all subsequent tests.
The U-test result for the metric was , which indicates that the hypothesis based on previous research, that is, that the metric is higher for fake news than for real news, could not be rejected. This suggests that the metric was not conclusively effective in discrimination.
Furthermore, to gain insights, we also performed individual tests for adjacent node numbers and path counts, that is, components of the metric , to determine whether there was a significant difference between real and fake news. The test targets were as follows:
where represents the number of paths with a depth greater than three and adjacent posts sharing the same cluster number. The test results are summarized in Table 2. These results indicate that the metric that represents the observation distinguished propagation by considering both hubs and paths. Furthermore, compared with the test results for the metric based on previous findings, it was evident that focusing on stance similarity in path depth was necessary.
As we have discussed, a correlation existed between the spread of fake news and opinion similarity. In the field of research related to the viral nature of news propagation, the epidemiological approach to analyzing the spread of fake news is noteworthy [47]. This methodology considers the process by which a user, on receiving information, may then pass it on to others, thereby creating a cascade of information dissemination. During this process, the recipients become disseminators, which perpetuates the spread to new recipients [48]. Epidemiological analysis is particularly active in elucidating the echo chamber phenomenon, where users interacting with like-minded individuals lead to the intensification of opinions and pronounced divisions [48,49]. This interaction between similar opinions is also related to confirmation bias, and some studies have used an epidemiological approach to analyze the relationship between echo chambers and the spread of fake news [50].
In the example shown in Figure 7, numerous retweets were made to a tweet based on the fact that President Biden misspoke. Interpreting these subsequent retweets as a literal “fun fact” was misleading. Instead, it was plausible to interpret the use of “fun fact” in these retweets as an ironic amplification of the negative reaction to the original tweet, thereby implying that “Biden made a mistake”. This suggests a nuanced relationship between the spread of misinformation and opinion similarity. However, as discussed previously, it is important to note that this observation was visual, and the cluster number in Figure 7 was −1, which indicates a lack of precise tracking of opinion similarity.
Furthermore, another example of news propagation shown in Figure 4 revealed a phenomenon where interactions between similar opinions within a viral cascade served to reinforce those opinions, thereby deepening divisions. These observations underscored the importance of opinion similarity in distinguishing between the propagation structures of fake and real news. The confirmation of echo chambers in this study suggests the need to consider opinion similarity when analyzing the structural characteristics of news spread. Observations from an epidemiological perspective and the amplification effect within echo chambers elucidated the fundamental relationship between opinion similarity and the viral nature of fake news propagation. In particular, the amplification and polarization of opinions through the echo chamber effect helped to deepen our understanding of the mechanisms behind information dissemination.
5.3. Summary of Experiments
In this study, we proposed a novel visualization method to analyze the structural features that distinguish the propagation of fake news from real news on social media. The conclusions of the experiments using the proposed method were as follows:
- Case studies using the proposed method revealed that fake news propagation exhibited more viral characteristics, with many paths of depth greater than 3 indicating chains of sharing between users, and more agreement in opinion between adjacent posts. In contrast, real news propagation showed more broadcast characteristics, with a large number of nodes directly connected to the original post, but fewer deep propagation paths.
- Statistical tests confirmed that the metric quantifying the ratio of maximum adjacent nodes to deep propagation paths with opinion agreement was significantly higher for fake news than for real news, validating the propagation characteristics identified in the case studies.
- However, the proposed method had limitations in distinguishing fake from real news for more complex cases involving socially controversial topics or misleading implications where external context was needed.
- Comparison of the opinion agreement metric with previous findings highlighted the importance of considering opinion similarity within viral propagation paths to effectively distinguish fake news.
- The observation of opinion agreement within viral fake news cascades related to theories of how interactions in “echo chambers” can intensify opinions and deepen divisions, and underscored the link between opinion similarity and the viral spread of misinformation.
6. Conclusions
In this study, we aimed to elucidate the differences in the dissemination structures between fake news and real news, in addition to the specific factors that contributed to these structures, thereby enhancing the interpretability of propagation-based fake news detection methods. To achieve this, we proposed a visualization module that illustrates various aspects of news propagation, such as the number of adjacent nodes, the depth of propagation paths, the distribution of topics, and the sequence of topics within a propagation cascade. The initial segment of our module facilitates the identification of significant cascades, especially when analyzing large volumes of posts related to specific news, highlighting the structural differences in the spread of fake versus real news. Uniquely, the latter part of our module allows for the examination of opinion similarity within these cascades, including the level of agreement with the news content, which is a feature that was not present in previous research.
The main findings from this study were twofold:
- (1)
- Our experiments, which used the proposed visualization method, first showed that fake news tended to exhibit viral-like propagation patterns, whereas real news was more likely to spread across a wider network in a broadcast-like manner. A key factor in these propagation patterns was the similarity of opinions within the structures. Specifically, the spread of fake news was concentrated among user groups with high opinion similarity, contributing to its viral spread. By contrast, real news was disseminated by a diverse range of users, thereby showing broadcast-like characteristics.
- (2)
- Furthermore, our analysis suggests that the propagation of fake news might have been more prevalent within specific echo chambers, indicating that such news is often circulated within insular groups of like-minded individuals. Conversely, real news appears to be more widely accepted across a broader audience. These insights underscore the significance of considering opinion alignment when analyzing the propagation mechanisms of fake and real news.
We observed the insights gained through visualization in this study in case studies and validated them for the entire dataset through statistical tests.
However, this study had limitations. The analysis of propagation structures was based on statistical features and similarities, and did not fully account for the social, cultural, and psychological factors that could influence individual cases. Specifically, the text analysis using BERTopic, which is used in the proposed method, is not able to capture these factors. These factors can play a significant role in the spread of fake news and remain an area for future research.
The findings of this study contribute to the early identification of fake news and the development of prevention measures, in addition to enhancing the credibility of real news. Understanding the dissemination structures could provide new approaches for detecting and addressing fake news characteristics. For social media platforms and users, this research offers valuable insights for assessing information quality and preventing the spread of misinformation in digital environments.
Future research should address the limitations of this study by diversifying datasets, integrating social and cultural factors, and conducting more detailed analyses of dissemination structures. Understanding the psychological mechanisms involved in fake news propagation and changes in user behavior patterns also remains a crucial area of research.
Author Contributions
Conceptualization, K.S.; methodology, K.S.; software, K.S.; validation, K.S.; formal analysis, K.S.; investigation, K.S. and S.Y.; resources, S.Y.; data curation, K.S.; writing—original draft preparation, K.S. and S.Y.; writing—review and editing, S.Y. and M.M.; visualization, K.S.; supervision, S.Y. and M.M.; project administration, S.Y.; funding acquisition, S.Y. All authors read and agreed to the published version of the manuscript.
Funding
This research was financially supported by JSPS KAKENHI, grant number 22K18007, Japan.
Data Availability Statement
The data is included in the article.
Conflicts of Interest
The funders had no role in the design of the study; in the collection, analyses, or interpretation of data; in the writing of the manuscript; or in the decision to publish the results.
References
- Zimmerman, T.; Shiroma, K.; Fleischmann, K.R.; Xie, B.; Jia, C.; Verma, N.; Lee, M.K. Misinformation and COVID-19 vaccine hesitancy. Vaccine 2023, 41, 136–144. [Google Scholar] [CrossRef]
- Motta, M. Republicans, Not Democrats, Are More Likely to Endorse Anti-Vaccine Misinformation. Am. Politics Res. 2021, 49, 428–438. [Google Scholar] [CrossRef]
- Vosoughi, S.; Roy, D.; Aral, S. The spread of true and false news online. Science 2018, 359, 1146–1151. [Google Scholar] [CrossRef]
- Soga, K.; Yoshida, S.; Muneyasu, M. Exploiting stance similarity and graph neural networks for fake news detection. Pattern Recognit. Lett. 2024, 177, 26–32. [Google Scholar] [CrossRef]
- Lazer, D.M.J.; Baum, M.A.; Benkler, Y.; Berinsky, A.J.; Greenhill, K.M.; Menczer, F.; Metzger, M.J.; Nyhan, B.; Pennycook, G.; Rothschild, D.; et al. The science of fake news. Science 2018, 359, 1094–1096. [Google Scholar] [CrossRef]
- Tandoc, E.C., Jr. The facts of fake news: A research review. Sociol. Compass 2019, 13, e12724. [Google Scholar] [CrossRef]
- Lu, Y.J.; Li, C.T. GCAN: Graph-aware Co-Attention Networks for Explainable Fake News Detection on Social Media. In Proceedings of the 58th Annual Meeting of the Association for Computational Linguistics, Online, 5–10 July 2020; pp. 505–514. [Google Scholar]
- Ni, S.; Li, J.; Kao, H.Y. MVAN: Multi-View Attention Networks for Fake News Detection on Social Media. IEEE Access 2021, 9, 106907–106917. [Google Scholar] [CrossRef]
- Jin, Y.; Wang, X.; Yang, R.; Sun, Y.; Wang, W.; Liao, H.; Xie, X. Towards Fine-Grained Reasoning for Fake News Detection. Proc. AAAI Conf. Artif. Intell. 2022, 36, 5746–5754. [Google Scholar] [CrossRef]
- Yang, R.; Wang, X.; Jin, Y.; Li, C.; Lian, J.; Xie, X. Reinforcement Subgraph Reasoning for Fake News Detection. In Proceedings of the 28th ACM SIGKDD Conference on Knowledge Discovery and Data Mining, Washington, DC, USA, 14–18 August 2022; pp. 2253–2262. [Google Scholar]
- Zhao, Z.; Zhao, J.; Sano, Y.; Levy, O.; Takayasu, H.; Takayasu, M.; Li, D.; Wu, J.; Havlin, S. Fake news propagates differently from real news even at early stages of spreading. EPJ Data Sci. 2020, 9, 7. [Google Scholar] [CrossRef]
- Sun, R.; Li, C.; Millet, B.; Ali, K.I.; Petit, J. Sharing news with online friends: A study of network homophily, network size, and news type. Telemat. Inform. 2022, 67, 101763. [Google Scholar] [CrossRef]
- Grootendorst, M. BERTopic: Neural topic modeling with a class-based TF-IDF procedure. arXiv 2022, arXiv:2203.05794. [Google Scholar]
- Zhou, X.; Wu, J.; Zafarani, R. SAFE: Similarity-Aware Multi-modal Fake News Detection. In Proceedings of the Advances in Knowledge Discovery and Data Mining, Singapore, 11–14 May 2020; pp. 354–367. [Google Scholar]
- Palani, B.; Elango, S.; Viswanathan K, V. CB-Fake: A Multimodal Deep Learning Framework for Automatic Fake News Detection Using Capsule Neural Network and BERT. Multimed. Tools Appl. 2022, 81, 5587–5620. [Google Scholar] [CrossRef]
- Zhou, X.; Jain, A.; Phoha, V.V.; Zafarani, R. Fake News Early Detection: A Theory-Driven Model. Digit. Threat. 2020, 1, 1–25. [Google Scholar] [CrossRef]
- Zhou, X.; Zafarani, R. A Survey of Fake News: Fundamental Theories, Detection Methods, and Opportunities. ACM Comput. Surv. 2020, 53, 1–40. [Google Scholar] [CrossRef]
- Zhang, X.; Ghorbani, A.A. An overview of online fake news: Characterization, detection, and discussion. Inf. Process. Manag. 2020, 57, 102025. [Google Scholar] [CrossRef]
- Biber, D.; Finegan, E. Adverbial stance types in English. Discourse Process. 1988, 11, 1–34. [Google Scholar] [CrossRef]
- Benamara, F.; Taboada, M.; Mathieu, Y. Evaluative Language Beyond Bags of Words: Linguistic Insights and Computational Applications. Comput. Linguist. 2017, 43, 201–264. [Google Scholar] [CrossRef]
- Hardalov, M.; Arora, A.; Nakov, P.; Augenstein, I. A Survey on Stance Detection for Mis- and Disinformation Identification. In Proceedings of the Findings of the Association for Computational Linguistics: NAACL 2022, Seattle, WA, USA + Online, 10–15 July 2022; pp. 1259–1277. [Google Scholar]
- Shu, K.; Mahudeswaran, D.; Wang, S.; Liu, H. Hierarchical Propagation Networks for Fake News Detection: Investigation and Exploitation. Proc. Int. AAAI Conf. Web Soc. Media 2020, 14, 626–637. [Google Scholar] [CrossRef]
- Pierri, F.; Ceri, S. False News On Social Media: A Data-Driven Survey. ACM SIGMOD Rec. 2019, 48, 18–27. [Google Scholar] [CrossRef]
- Ma, J.; Gao, W.; Wong, K.F. Rumor Detection on Twitter with Tree-structured Recursive Neural Networks. In Proceedings of the 56th Annual Meeting of the Association for Computational Linguistics, Melbourne, Australia, 15–20 July 2018; Volume 1, Long Papers. pp. 1980–1989. [Google Scholar]
- Kipf, T.N.; Welling, M. Semi-Supervised Classification with Graph Convolutional Networks. In Proceedings of the International Conference on Learning Representations, Toulon, France, 24–26 April 2017. [Google Scholar]
- Shi, Y.; Huang, Z.; Feng, S.; Zhong, H.; Wang, W.; Sun, Y. Masked Label Prediction: Unified Message Passing Model for Semi-Supervised Classification. In Proceedings of the 30th International Joint Conference on Artificial Intelligence (IJCAI-21), Montreal, QC, Canada, 19–27 August 2021; pp. 1548–1554. [Google Scholar]
- Vaswani, A.; Shazeer, N.; Parmar, N.; Uszkoreit, J.; Jones, L.; Gomez, A.N.; Kaiser, L.u.; Polosukhin, I. Attention is All you Need. In Proceedings of the Advances in Neural Information Processing Systems, Long Beach, CA, USA, 4–9 December 2017; Volume 30, pp. 1–11. [Google Scholar]
- Monti, F.; Frasca, F.; Eynard, D.; Mannion, D.; Bronstein, M.M. Fake News Detection on Social Media Using Geometric Deep Learning. arXiv 2019, arXiv:1902.06673. [Google Scholar]
- Bian, T.; Xiao, X.; Xu, T.; Zhao, P.; Huang, W.; Rong, Y.; Huang, J. Rumor Detection on Social Media with Bi-Directional Graph Convolutional Networks. Proc. AAAI Conf. Artif. Intell. 2020, 34, 549–556. [Google Scholar] [CrossRef]
- Wei, L.; Hu, D.; Zhou, W.; Yue, Z.; Hu, S. Towards Propagation Uncertainty: Edge-enhanced Bayesian Graph Convolutional Networks for Rumor Detection. In Proceedings of the 59th Annual Meeting of the Association for Computational Linguistics and the 11th International Joint Conference on Natural Language Processing, Virtual Event, 1–6 August 2021; Volume 1, Long Papers. pp. 3845–3854. [Google Scholar]
- Dou, Y.; Shu, K.; Xia, C.; Yu, P.S.; Sun, L. User Preference-Aware Fake News Detection. In Proceedings of the 44th International ACM SIGIR Conference on Research and Development in Information Retrieval, Online, 11–15 July 2021; pp. 2051–2055. [Google Scholar]
- Li, Q.; Han, Z.; Wu, X.M. Deeper Insights Into Graph Convolutional Networks for Semi-Supervised Learning. Proc. AAAI Conf. Artif. Intell. 2018, 32, 3538–3545. [Google Scholar] [CrossRef]
- Popat, K.; Mukherjee, S.; Yates, A.; Weikum, G. DeClarE: Debunking Fake News and False Claims using Evidence-Aware Deep Learning. In Proceedings of the 2018 Conference on Empirical Methods in Natural Language Processing, Brussels, Belgium, 31 October–4 November 2018; pp. 22–32. [Google Scholar]
- Silva, A.; Han, Y.; Luo, L.; Karunasekera, S.; Leckie, C. Propagation2Vec: Embedding partial propagation networks for explainable fake news early detection. Inf. Process. Manag. 2021, 58, 102618. [Google Scholar] [CrossRef]
- Veličković, P.; Cucurull, G.; Casanova, A.; Romero, A.; Lià, P.; Bengio, Y. Graph Attention Networks. arXiv 2019, arXiv:1710.10903. [Google Scholar]
- Jang, Y.; Park, C.H.; Seo, Y.S. Fake News Analysis Modeling Using Quote Retweet. Electronics 2019, 8, 1377. [Google Scholar] [CrossRef]
- Anwar, A.; Ilyas, H.; Yaqub, U.; Zaman, S. Analyzing QAnon on Twitter in Context of US Elections 2020: Analysis of User Messages and Profiles Using VADER and BERT Topic modeling. In Proceedings of the DG.O2021: The 22nd Annual International Conference on Digital Government Research, Omaha, NE, USA, 9–11 June 2021; pp. 82–88. [Google Scholar]
- Alonso del Barrio, D.; Gatica-Pérez, D. How Did Europe’s Press Cover COVID-19 Vaccination News? A Five-Country Analysis. In Proceedings of the 1st International Workshop on Multimedia AI against Disinformation, Newark, NJ, USA, 27–30 June 2022; pp. 35–43. [Google Scholar]
- Lindelöf, G.; Aledavood, T.; Keller, B. Dynamics of the negative discourse toward COVID-19 vaccines: Topic modeling study and an annotated data set of Twitter posts. J. Med. Internet Res. 2023, 25, e41319. [Google Scholar] [CrossRef] [PubMed]
- Devlin, J.; Chang, M.W.; Lee, K.; Toutanova, K. BERT: Pre-training of Deep Bidirectional Transformers for Language Understanding. In Proceedings of the 2019 Conference of the North American Chapter of the Association for Computational Linguistics: Human Language Technologies, Minneapolis, MN, USA, 2–7 June 2019; Volume 1, (Long and Short Papers). pp. 4171–4186. [Google Scholar]
- McInnes, L.; Healy, J.; Saul, N.; Großberger, L. UMAP: Uniform Manifold Approximation and Projection. J. Open Source Softw. 2018, 3, 861. [Google Scholar] [CrossRef]
- McInnes, L.; Healy, J.; Astels, S. HDBSCAN: Hierarchical density based clustering. J. Open Source Softw. 2017, 2, 205. [Google Scholar] [CrossRef]
- Shu, K.; Mahudeswaran, D.; Wang, S.; Lee, D.; Liu, H. FakeNewsNet: A Data Repository with News Content, Social Context, and Spatiotemporal Information for Studying Fake News on Social Media. Big Data 2020, 8, 171–188. [Google Scholar] [CrossRef]
- Bozio, C.H.; Grannis, S.J.; Naleway, A.L.; Ong, T.C.; Butterfield, K.A.; DeSilva, M.B.; Natarajan, K.; Yang, D.H.; Rao, S.; Klein, N.P.; et al. Laboratory-confirmed COVID-19 among adults hospitalized with COVID-19–like illness with infection-induced or mRNA vaccine-induced SARS-CoV-2 immunity—nine states, January–September 2021. Morb. Mortal. Wkly. Rep. 2021, 70, 1539–1544. [Google Scholar] [CrossRef]
- Koper, C.S.; Woods, D.J.; Roth, J.A. An Updated Assessment of the Federal Assault Weapons Ban: IMPACTS on Gun Markets and Gun Violence, 1994–2003; National Institute of Justice, US Department of Justice: Washington, DC, USA, 2004. [Google Scholar]
- Pierre, J.M. The psychology of guns: Risk, fear, and motivated reasoning. Palgrave Commun. 2019, 5, 159. [Google Scholar] [CrossRef]
- Raponi, S.; Khalifa, Z.; Oligeri, G.; Di Pietro, R. Fake News Propagation: A Review of Epidemic Models, Datasets, and Insights. ACM Trans. Web 2022, 16, 1–34. [Google Scholar] [CrossRef]
- Diaz-Diaz, F.; San Miguel, M.; Meloni, S. Echo chambers and information transmission biases in homophilic and heterophilic networks. Sci. Rep. 2022, 12, 9350. [Google Scholar] [CrossRef] [PubMed]
- Cota, W.; Ferreira, S.C.; Pastor-Satorras, R.; Starnini, M. Quantifying echo chamber effects in information spreading over political communication networks. EPJ Data Sci. 2019, 8, 35. [Google Scholar] [CrossRef]
- Törnberg, P. Echo chambers and viral misinformation: Modeling fake news as complex contagion. PLoS ONE 2018, 13, e0203958. [Google Scholar] [CrossRef]
Figure 1.
Conceptual framework of the proposed method using a toy graph, where “#” means “the number of”.
Figure 1.
Conceptual framework of the proposed method using a toy graph, where “#” means “the number of”.

Figure 2.
Histogram of hub nodes indicating the distribution with respect to the number of adjacent nodes. # means ’number of’.
Figure 2.
Histogram of hub nodes indicating the distribution with respect to the number of adjacent nodes. # means ’number of’.

Figure 3.
Number of adjacent nodes for each hub in an ascending order plot. # means ’number of’.

Figure 4.
An example of fake news propagation. Partial excerpt from the 27,068 total nodes and 26,734 total paths.
Figure 4.
An example of fake news propagation. Partial excerpt from the 27,068 total nodes and 26,734 total paths.

Figure 5.
Example of real news propagation. Partial excerpt from the 23,153 total nodes and 22,936 total paths.
Figure 5.
Example of real news propagation. Partial excerpt from the 23,153 total nodes and 22,936 total paths.

Figure 6.
Exception to fake news propagation. Partial excerpt of the 3051 total nodes and 3018 total paths.
Figure 6.
Exception to fake news propagation. Partial excerpt of the 3051 total nodes and 3018 total paths.

Figure 7.
Exception to real news propagation. Partial excerpt of the 3240 total nodes and 3207 total paths.
Figure 7.
Exception to real news propagation. Partial excerpt of the 3240 total nodes and 3207 total paths.


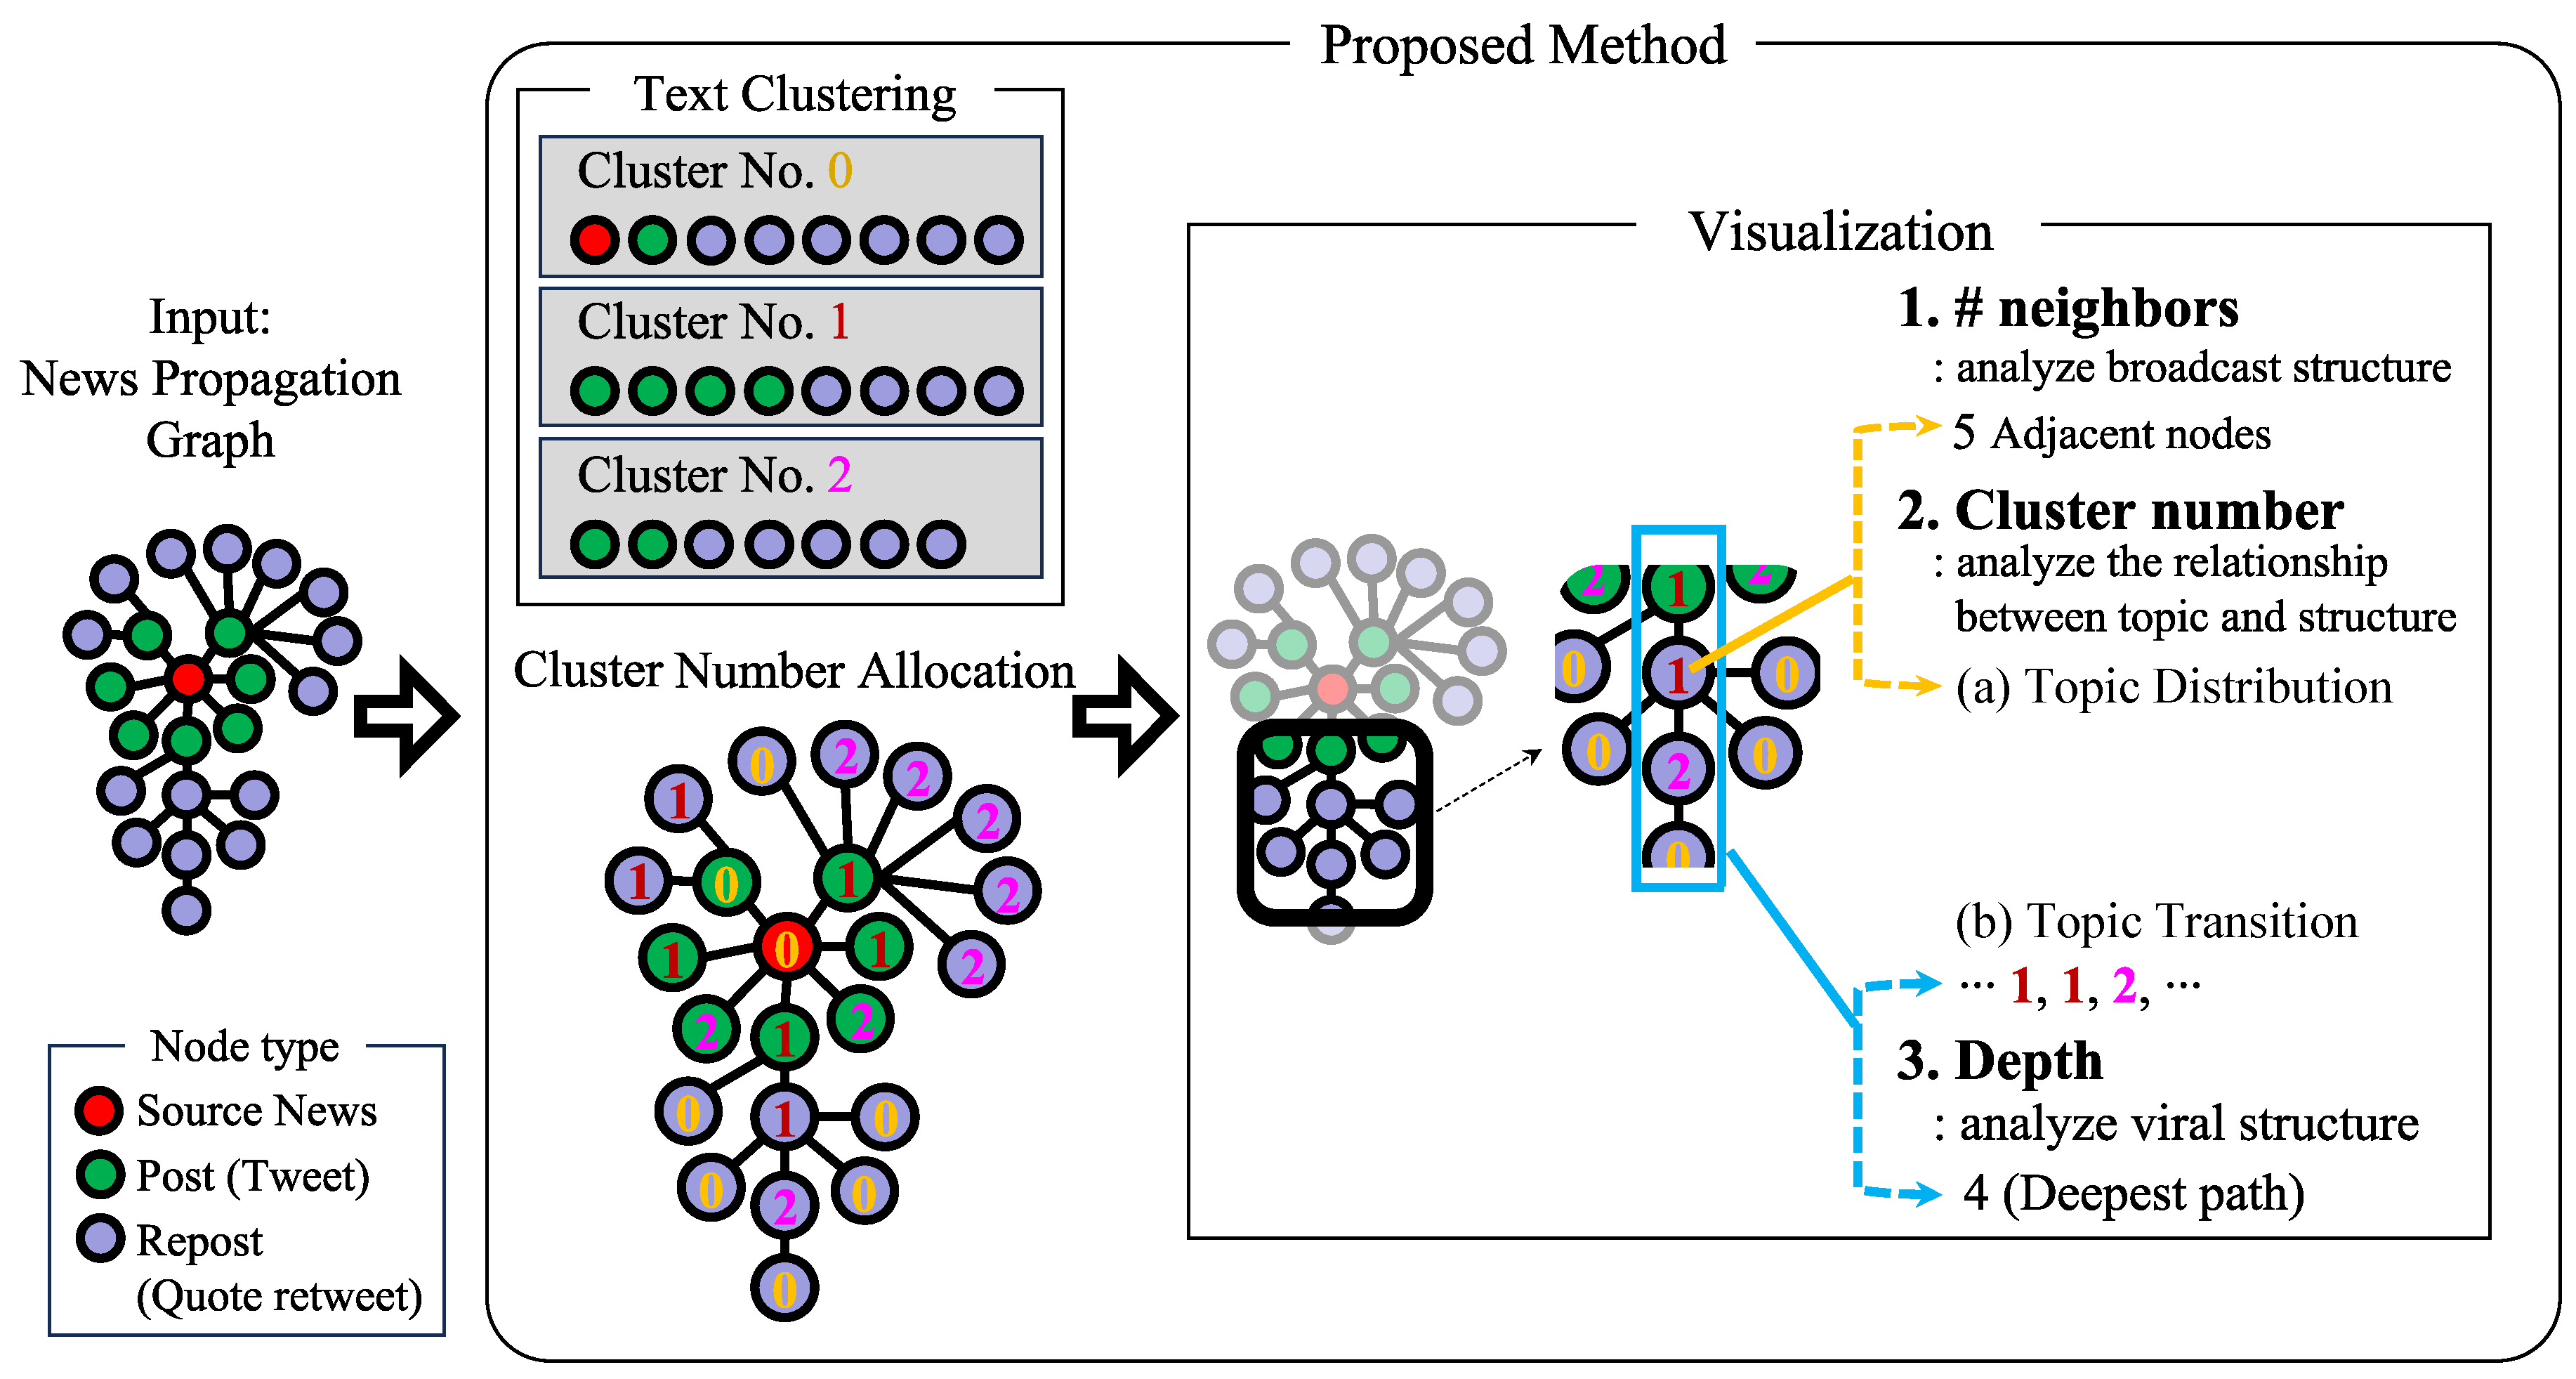
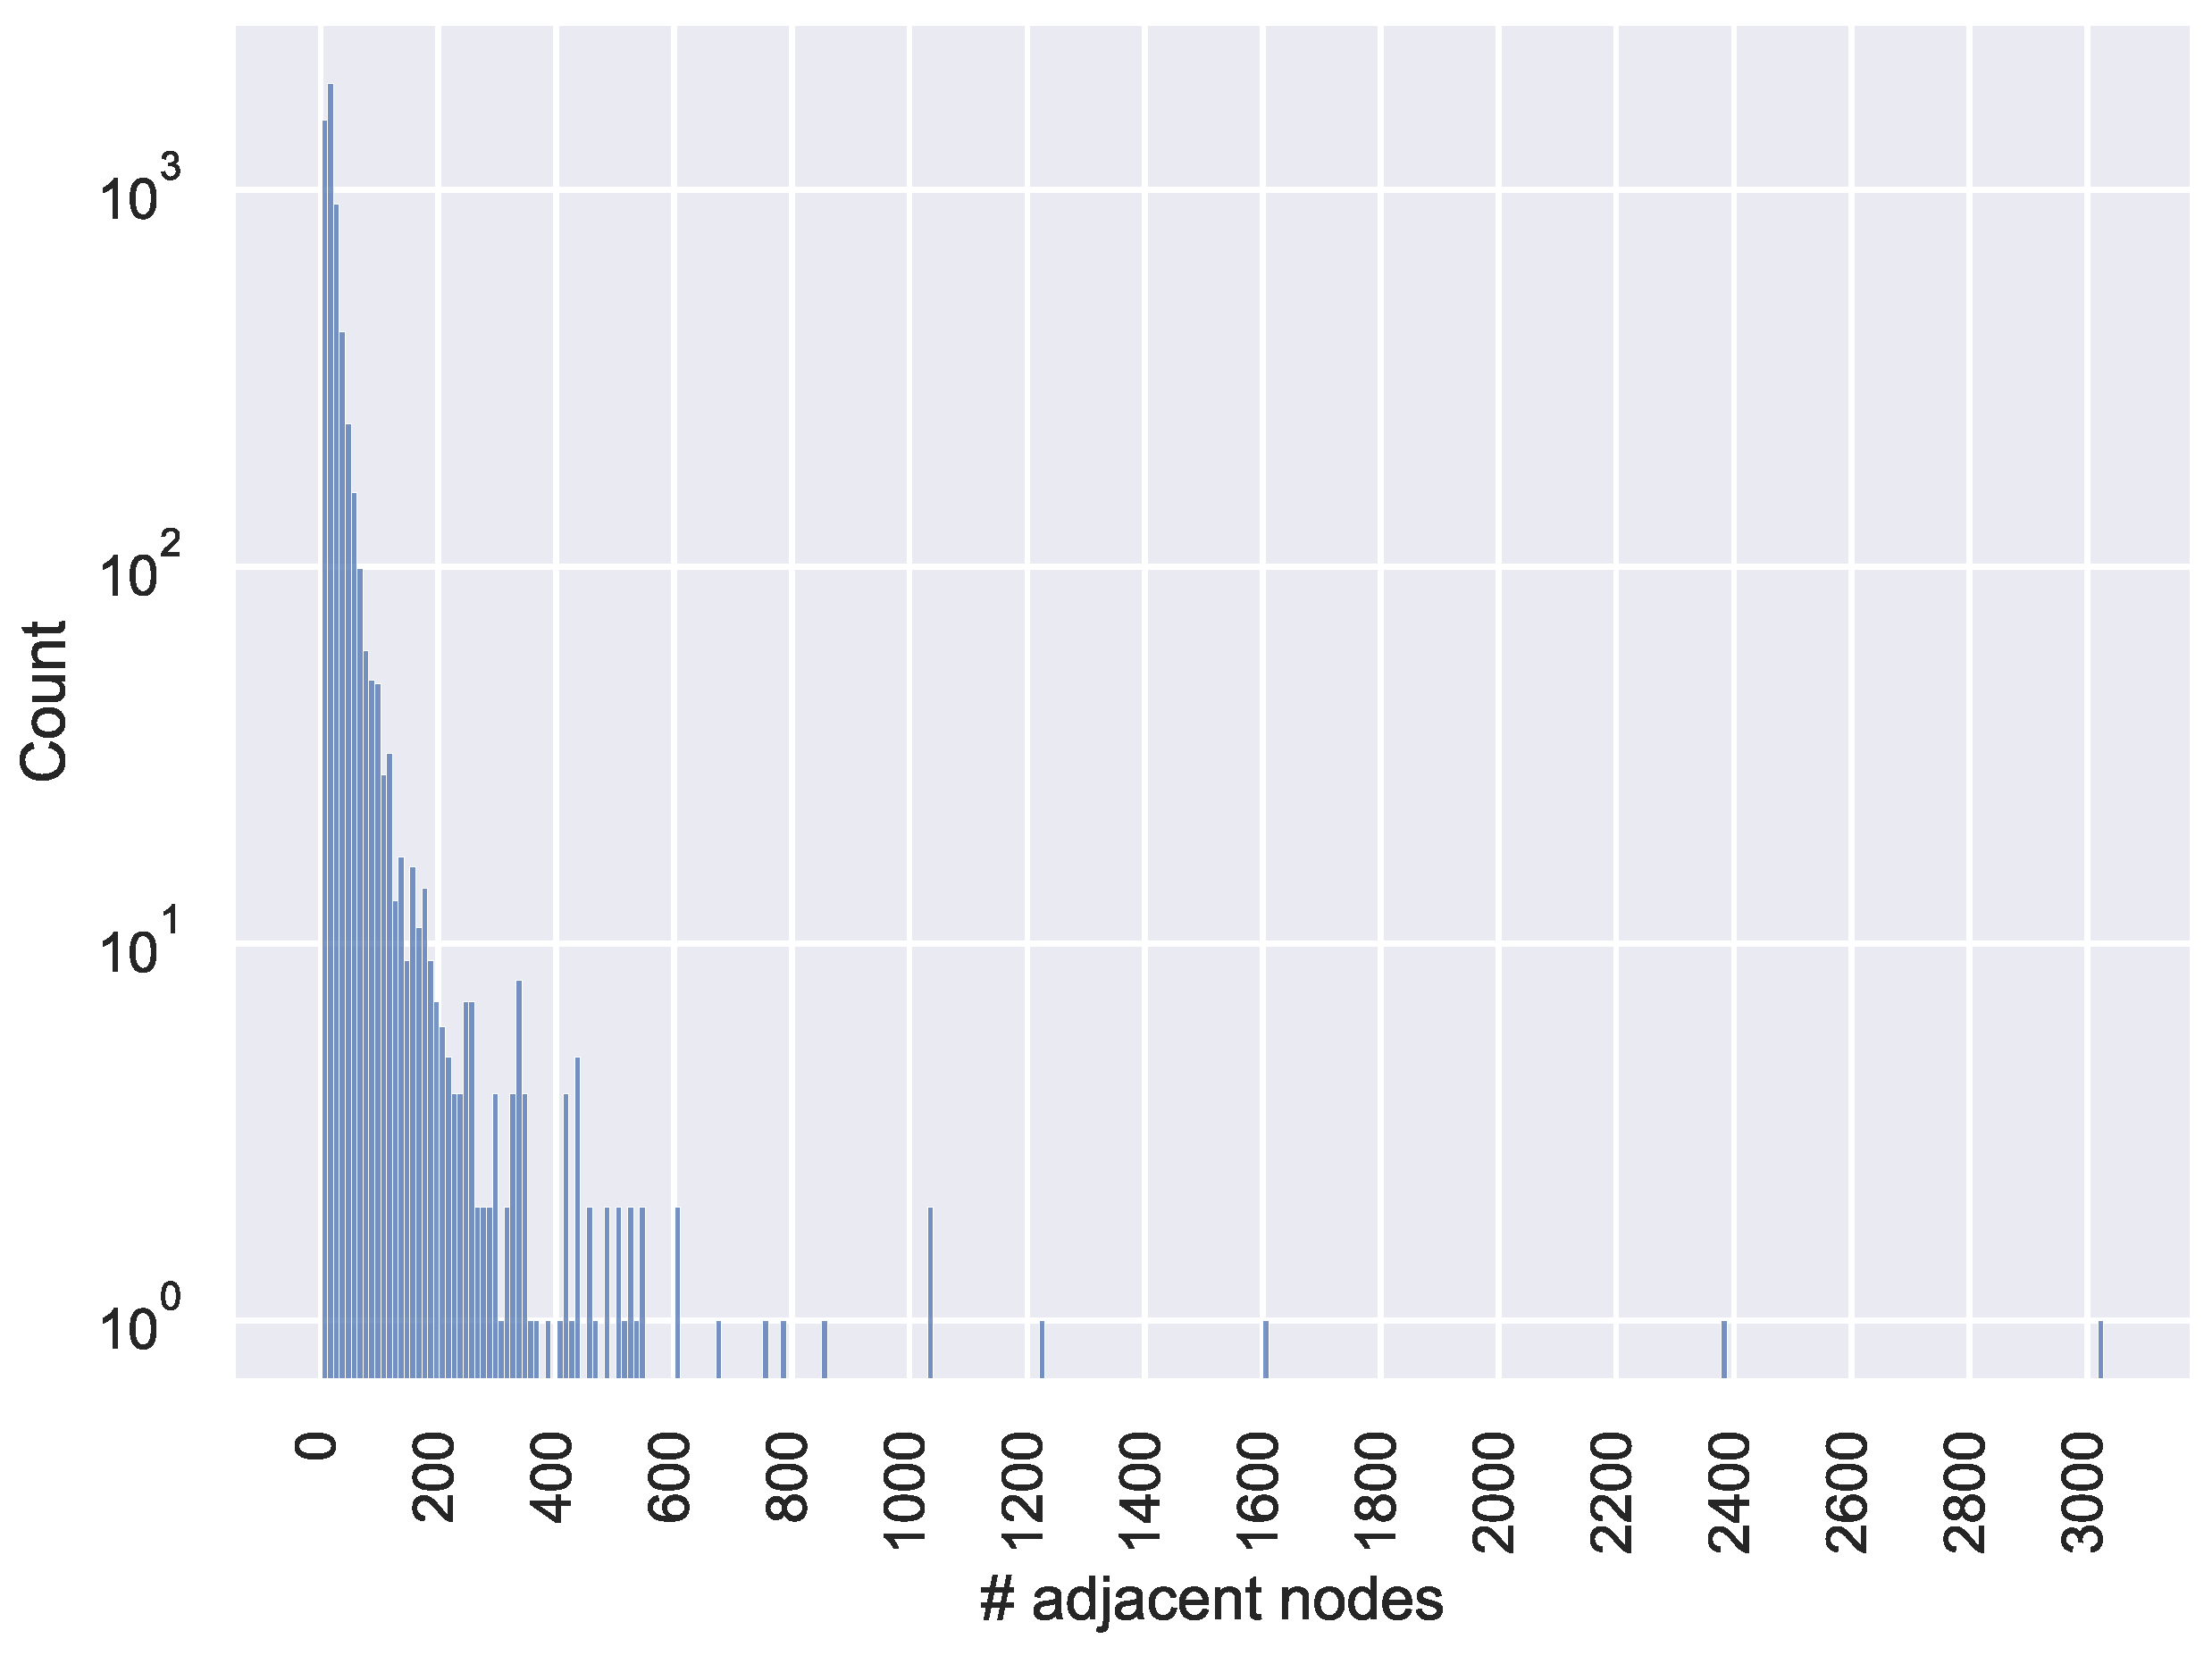
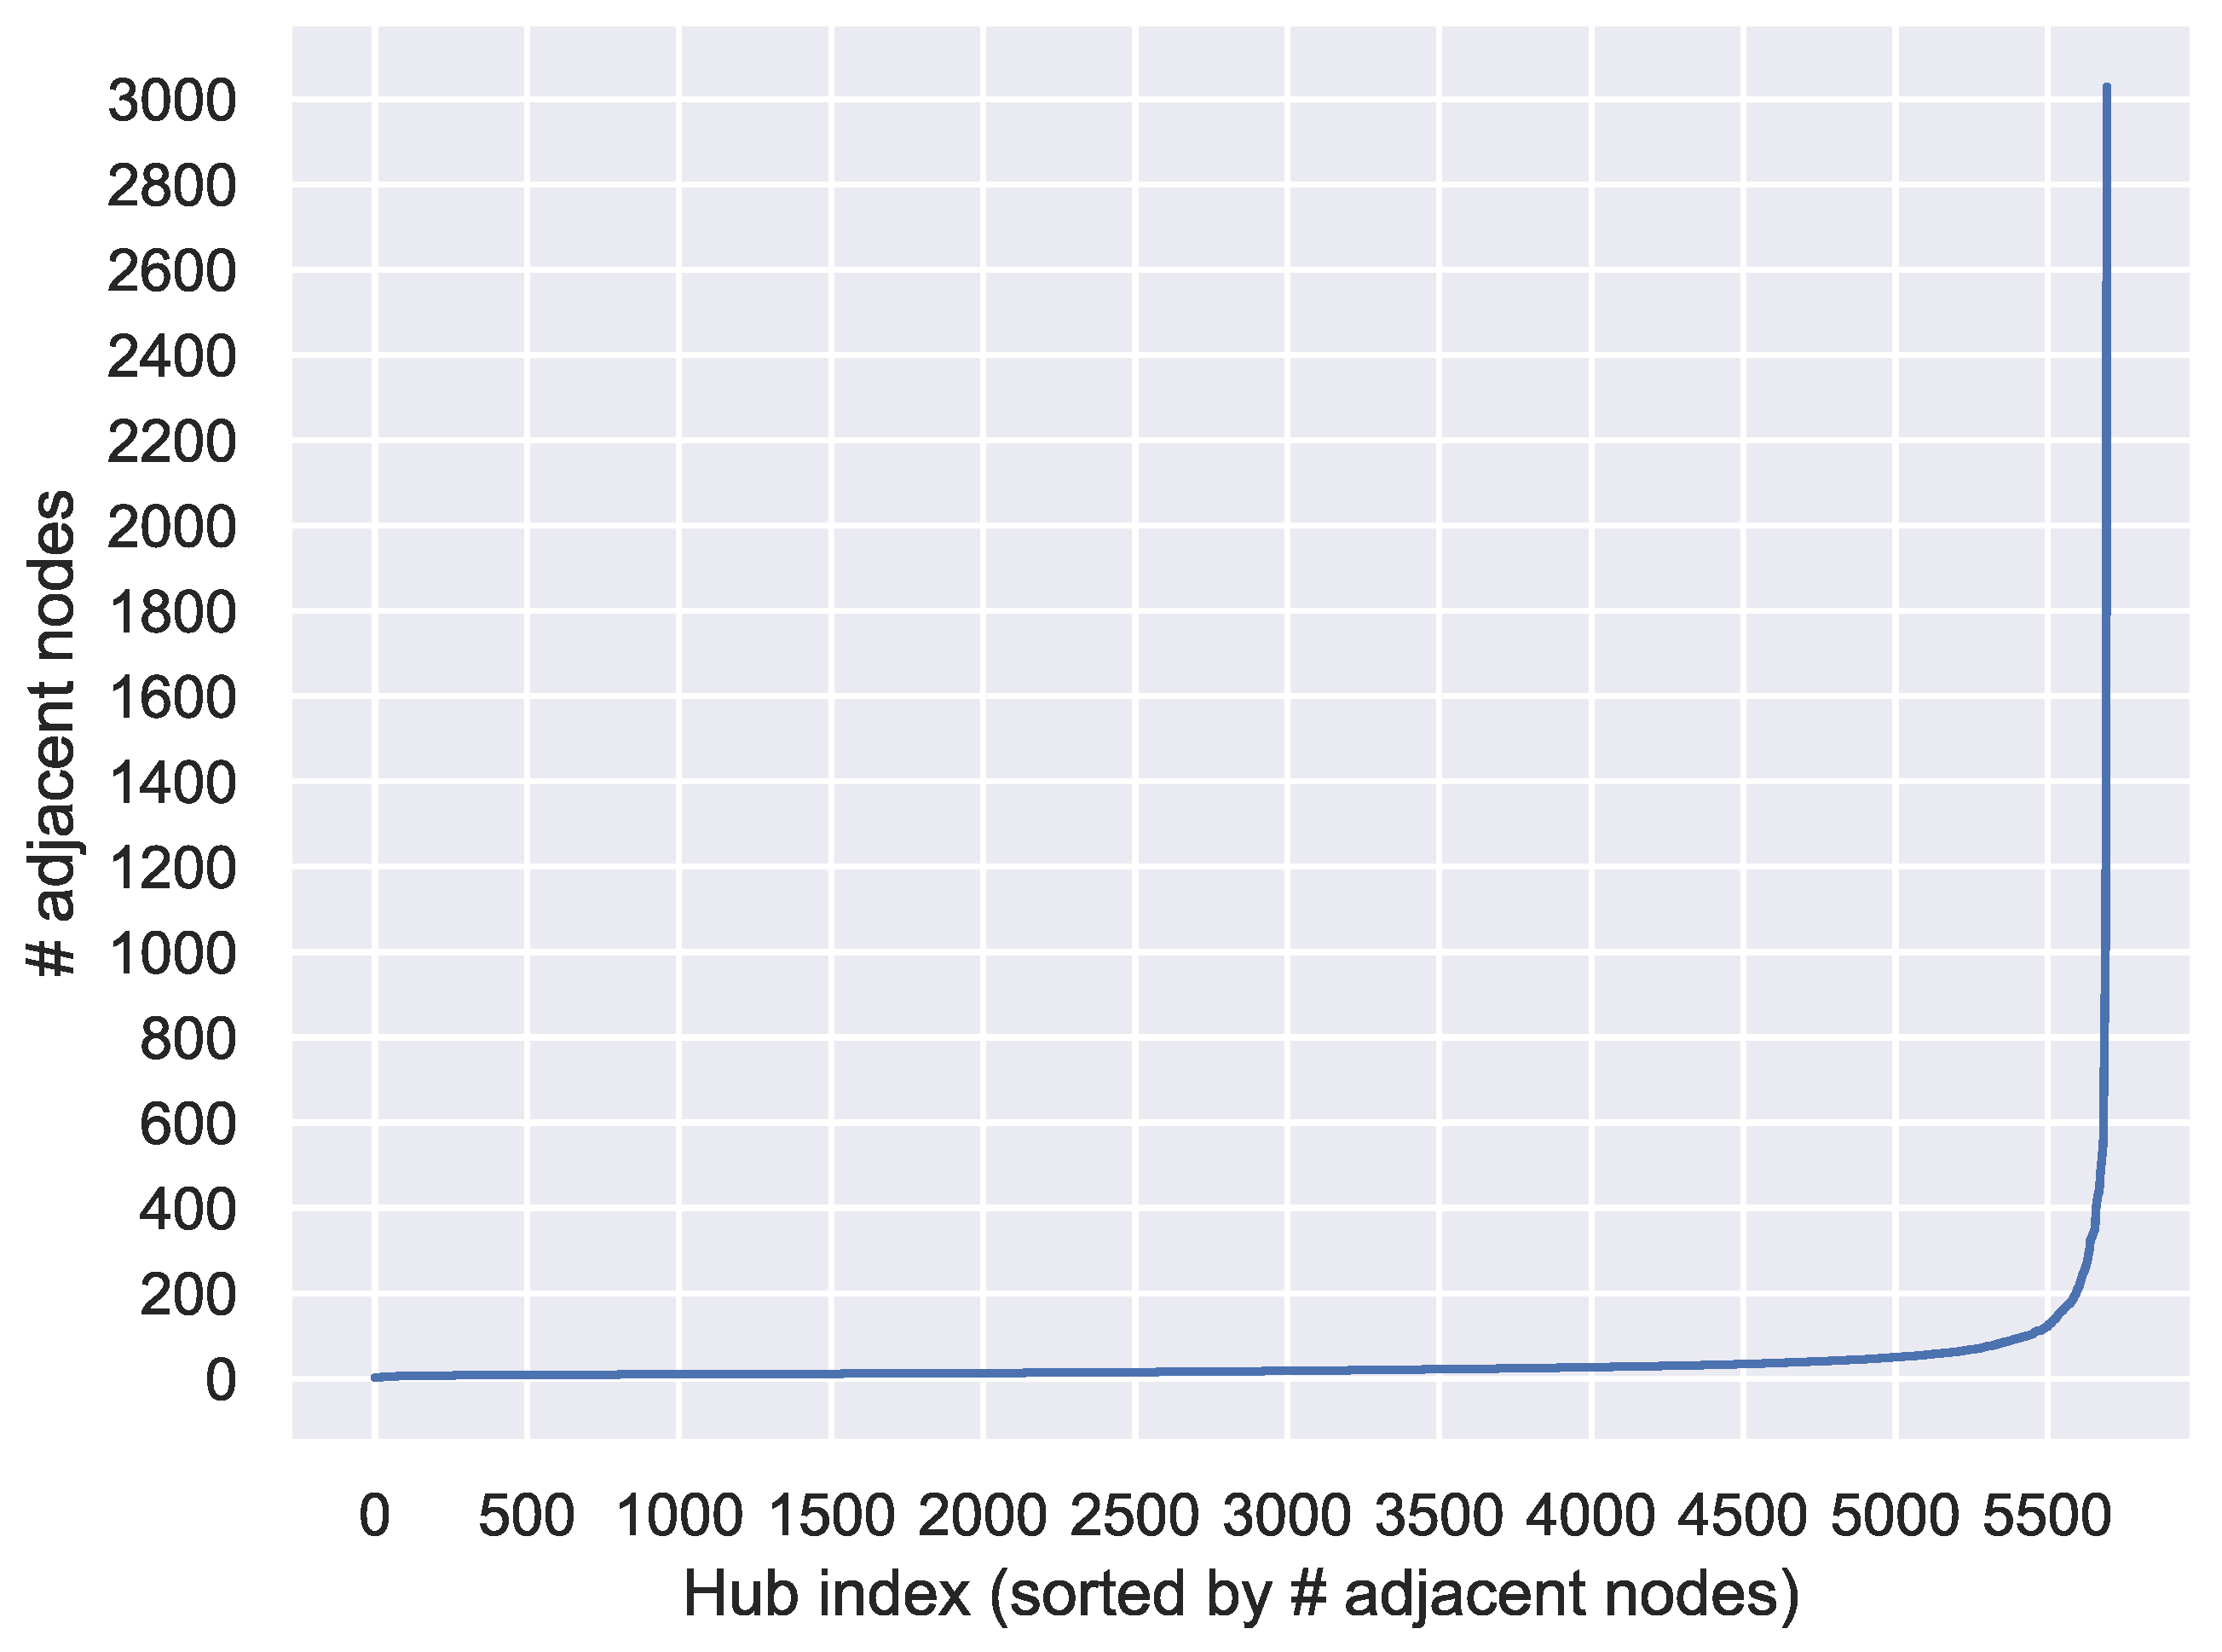
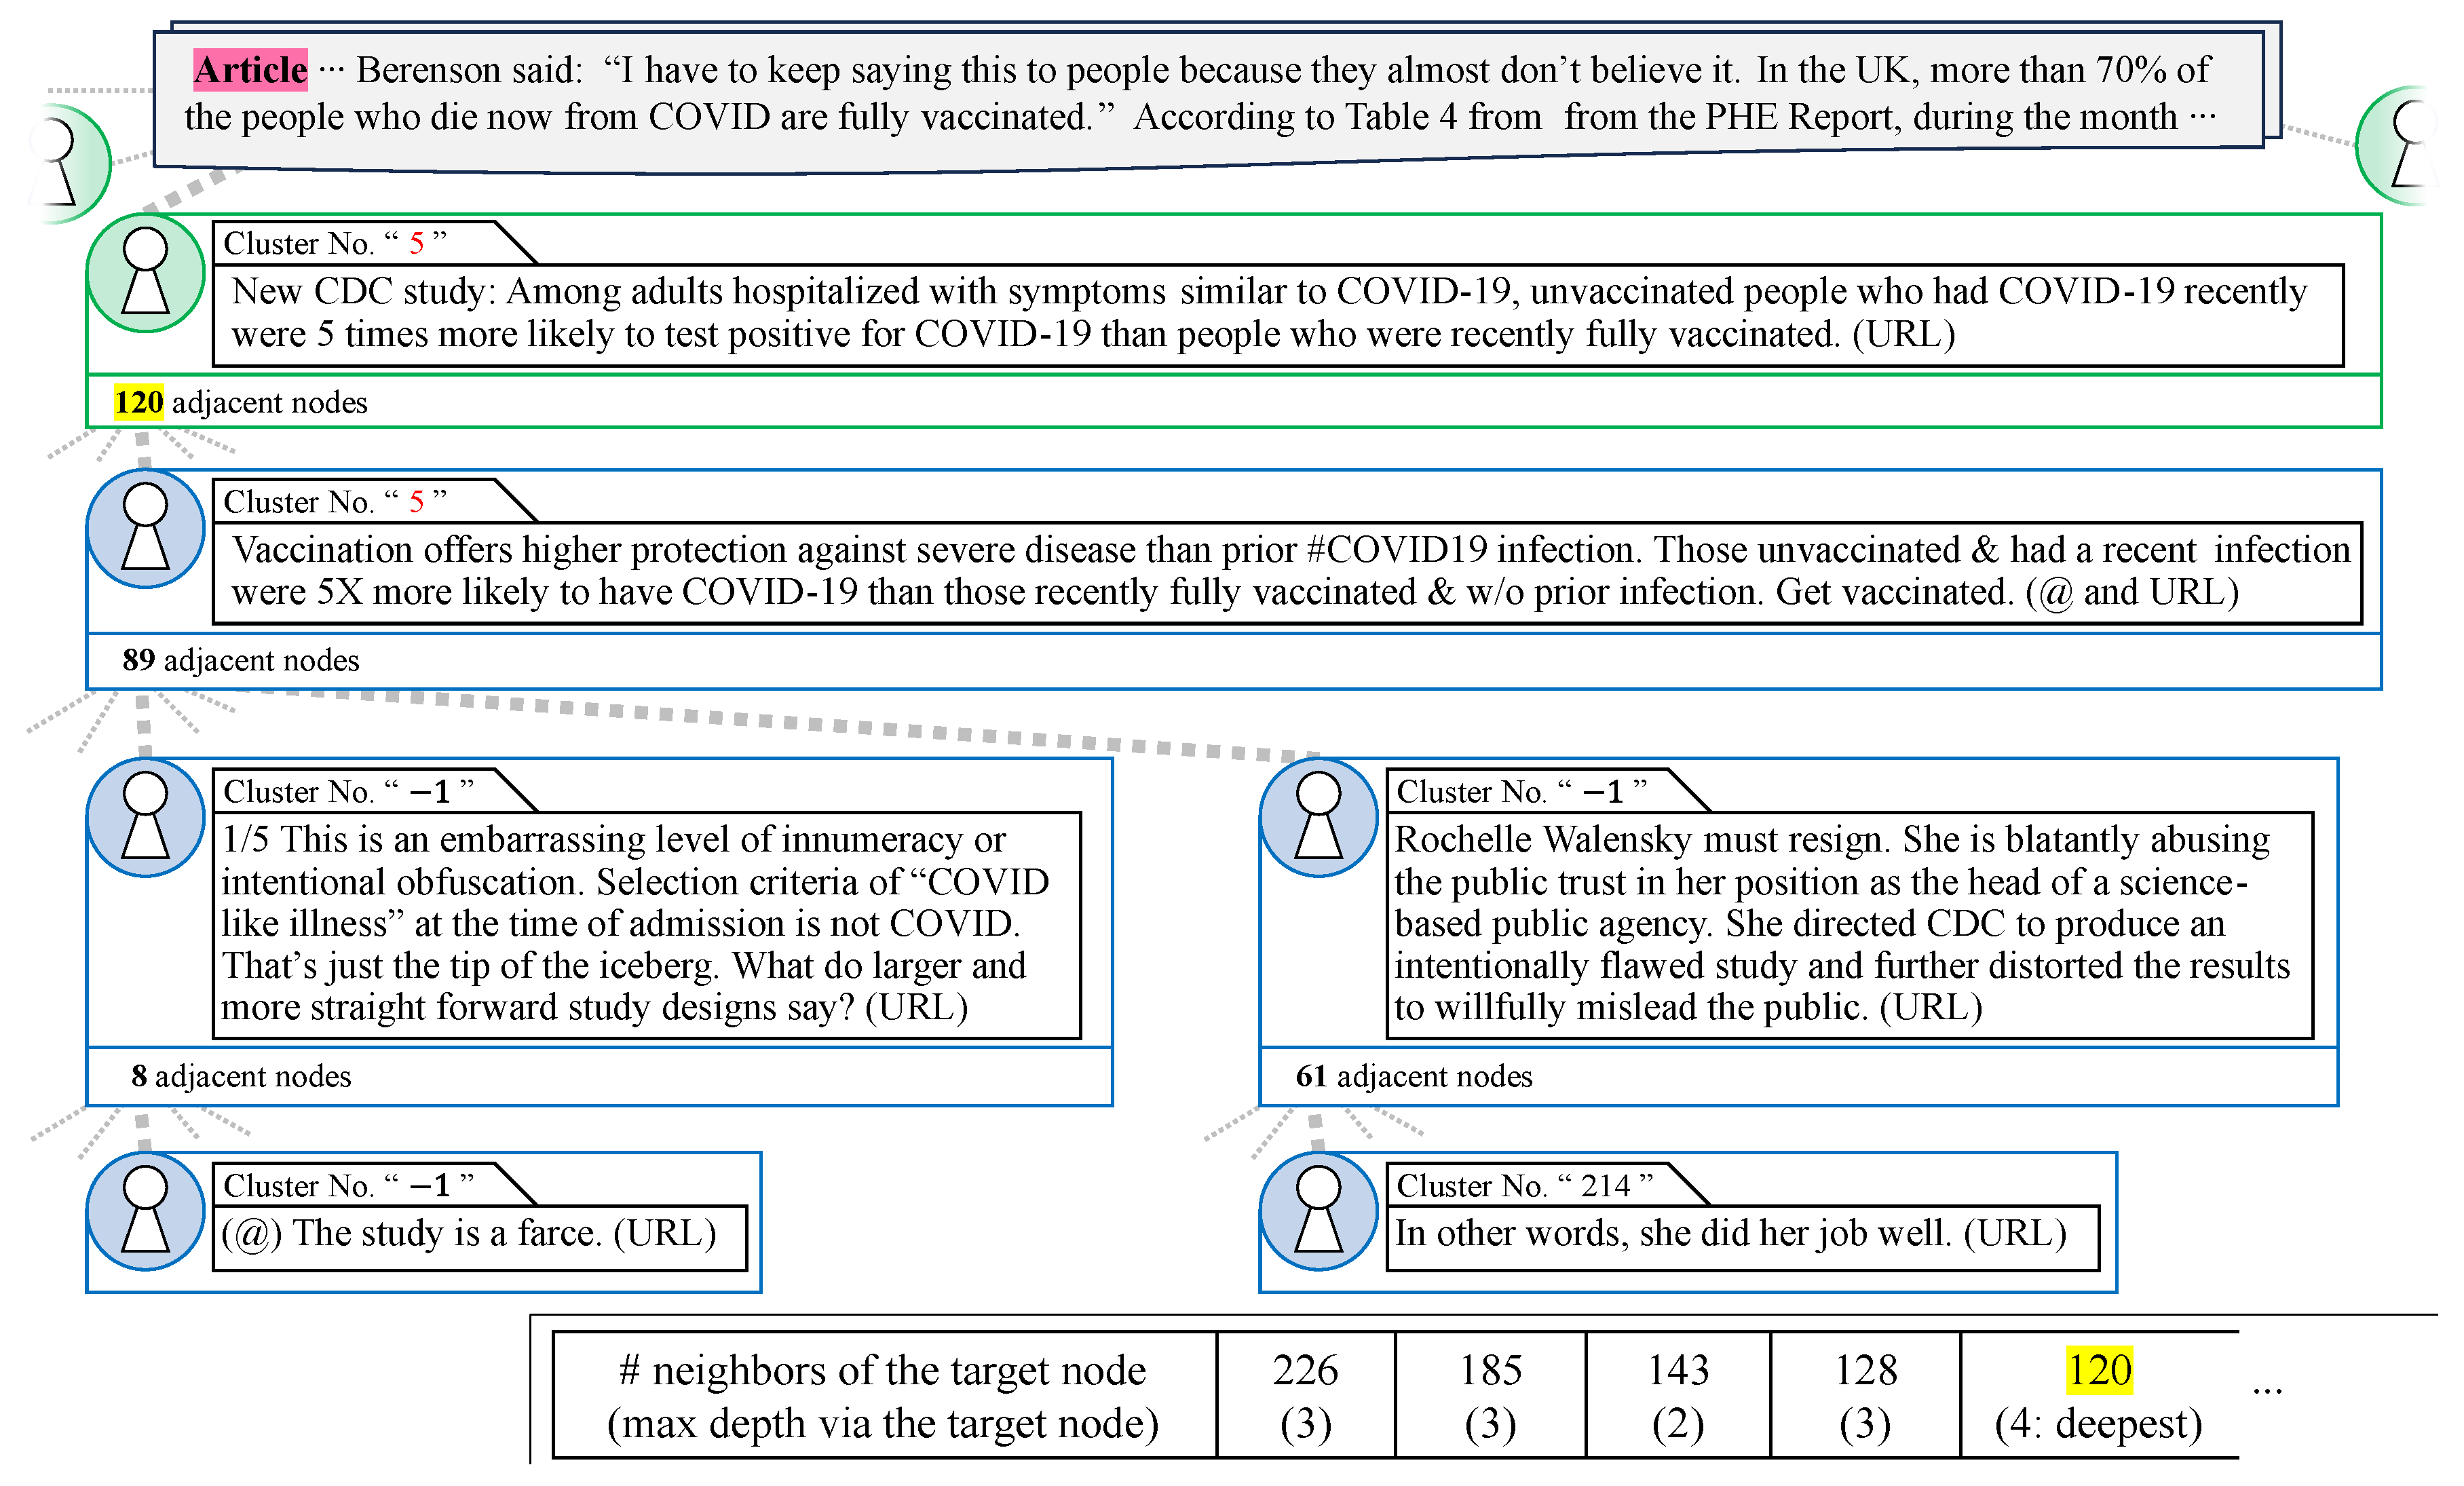
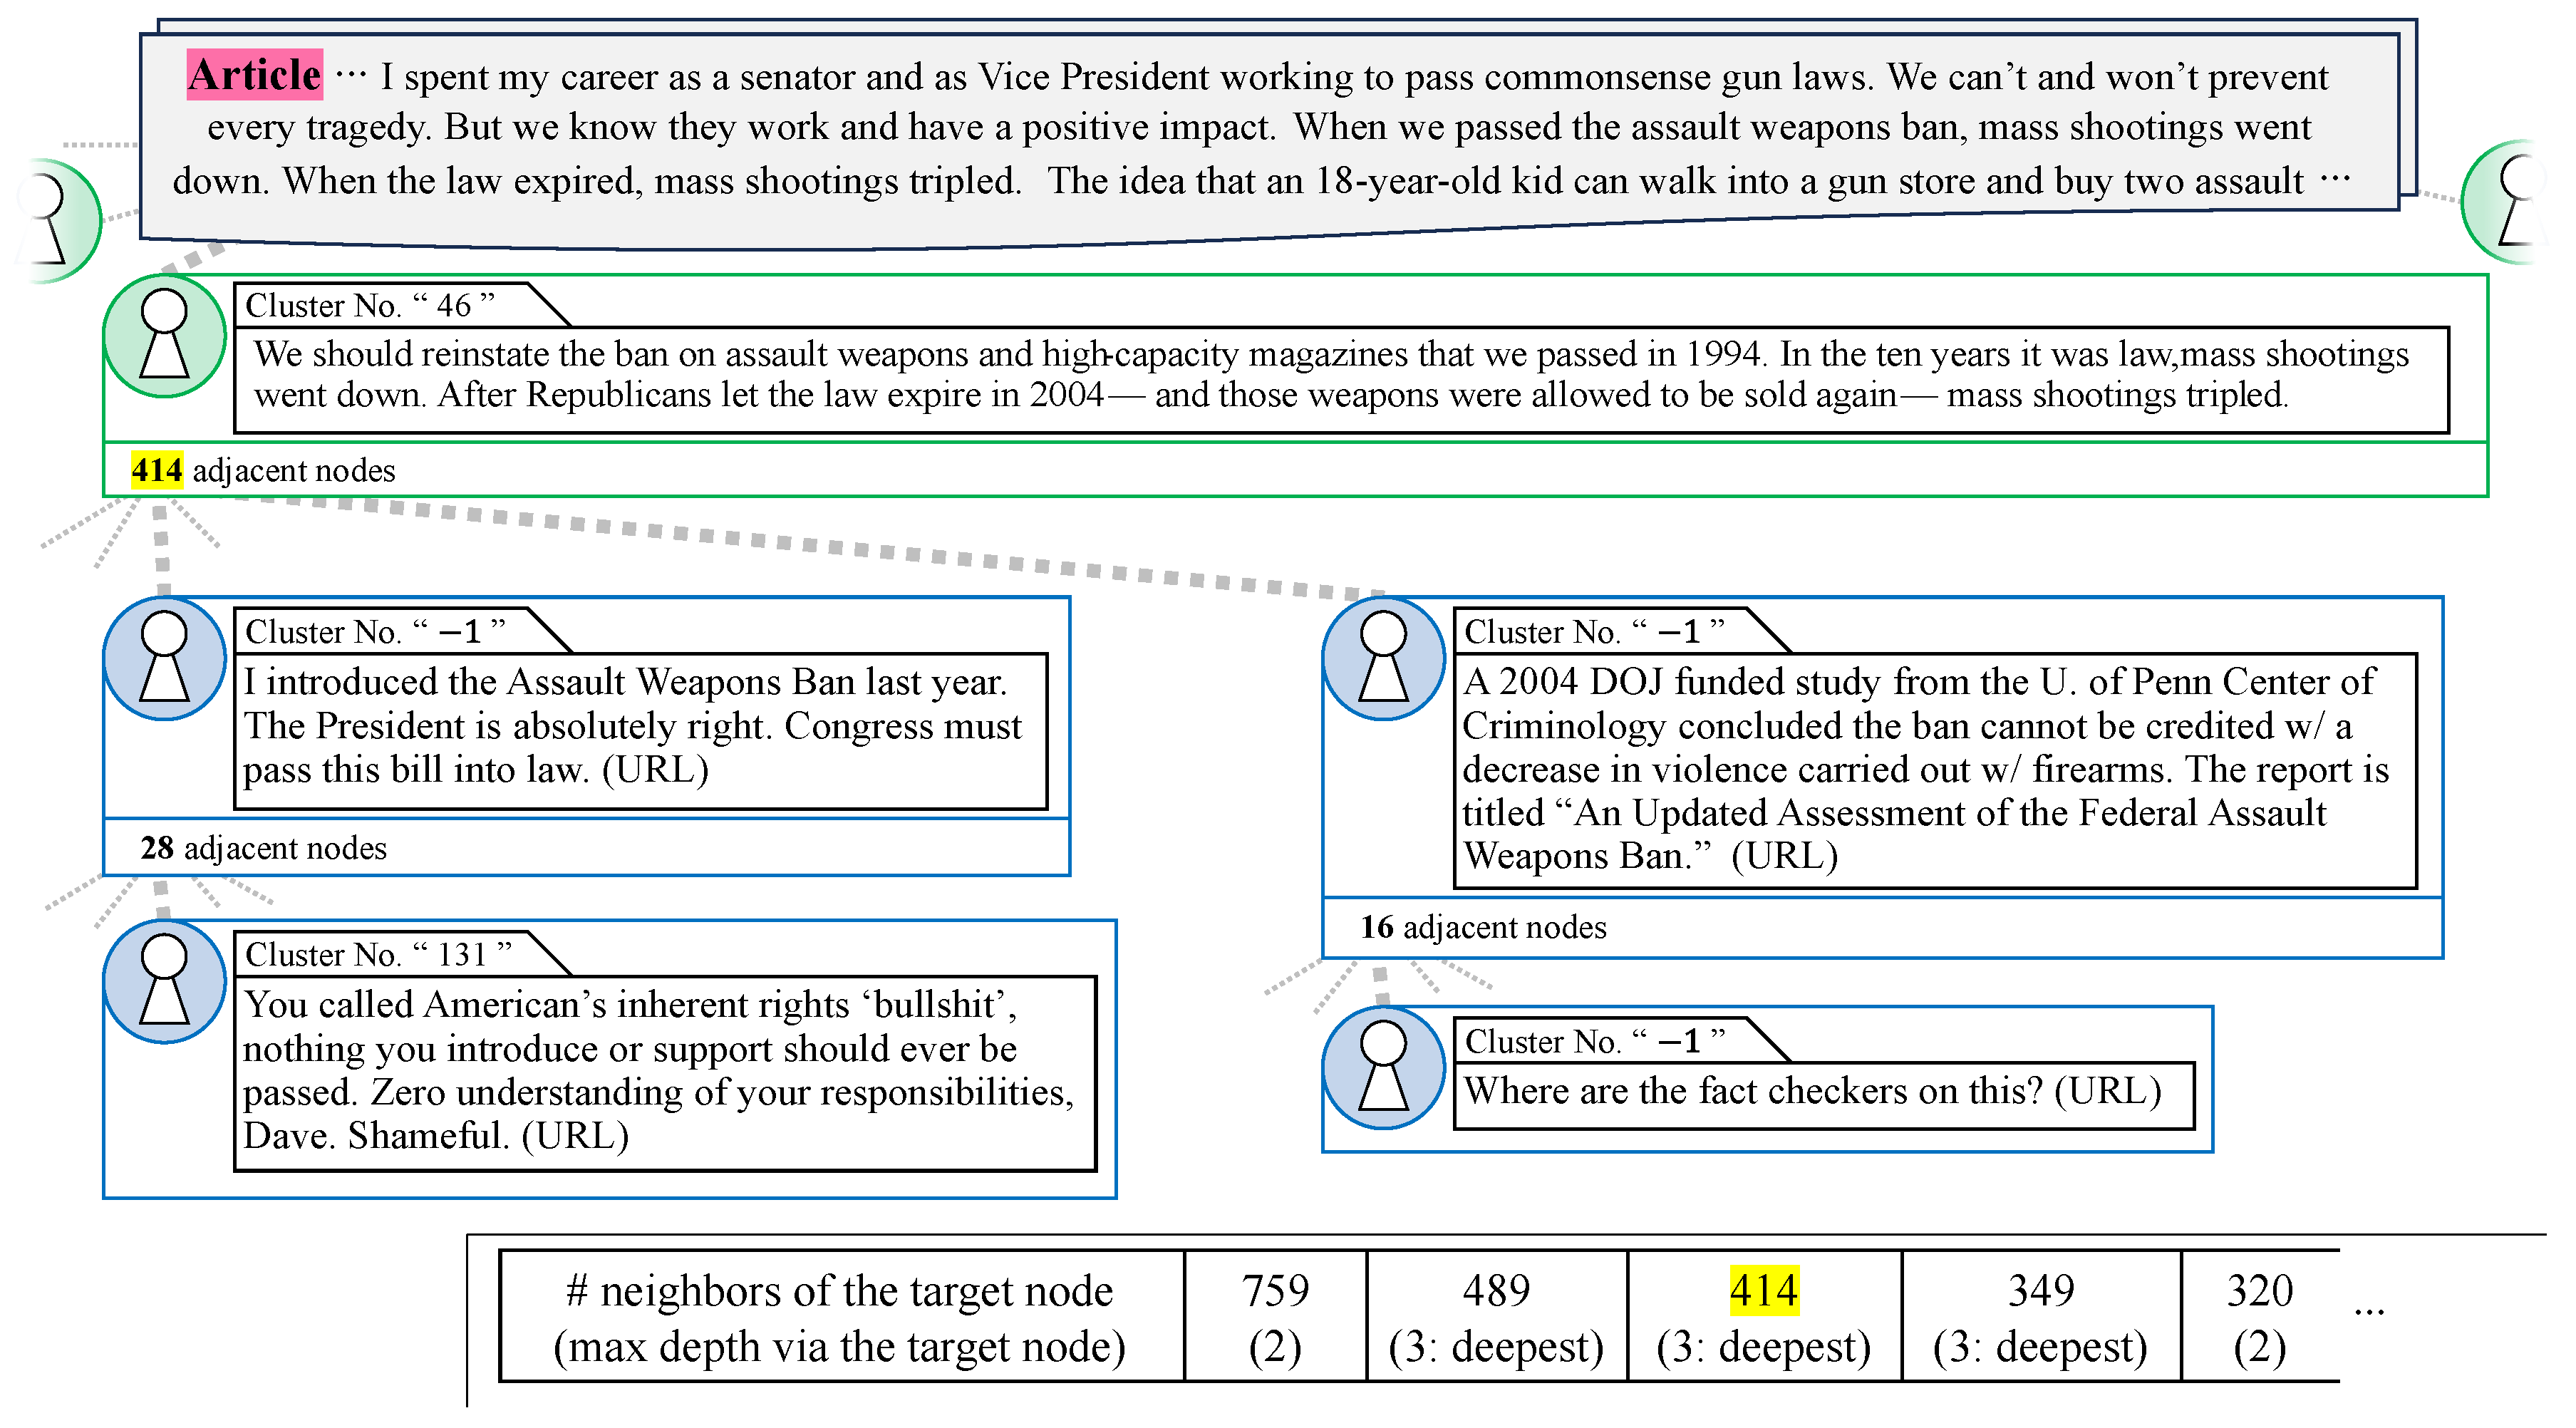
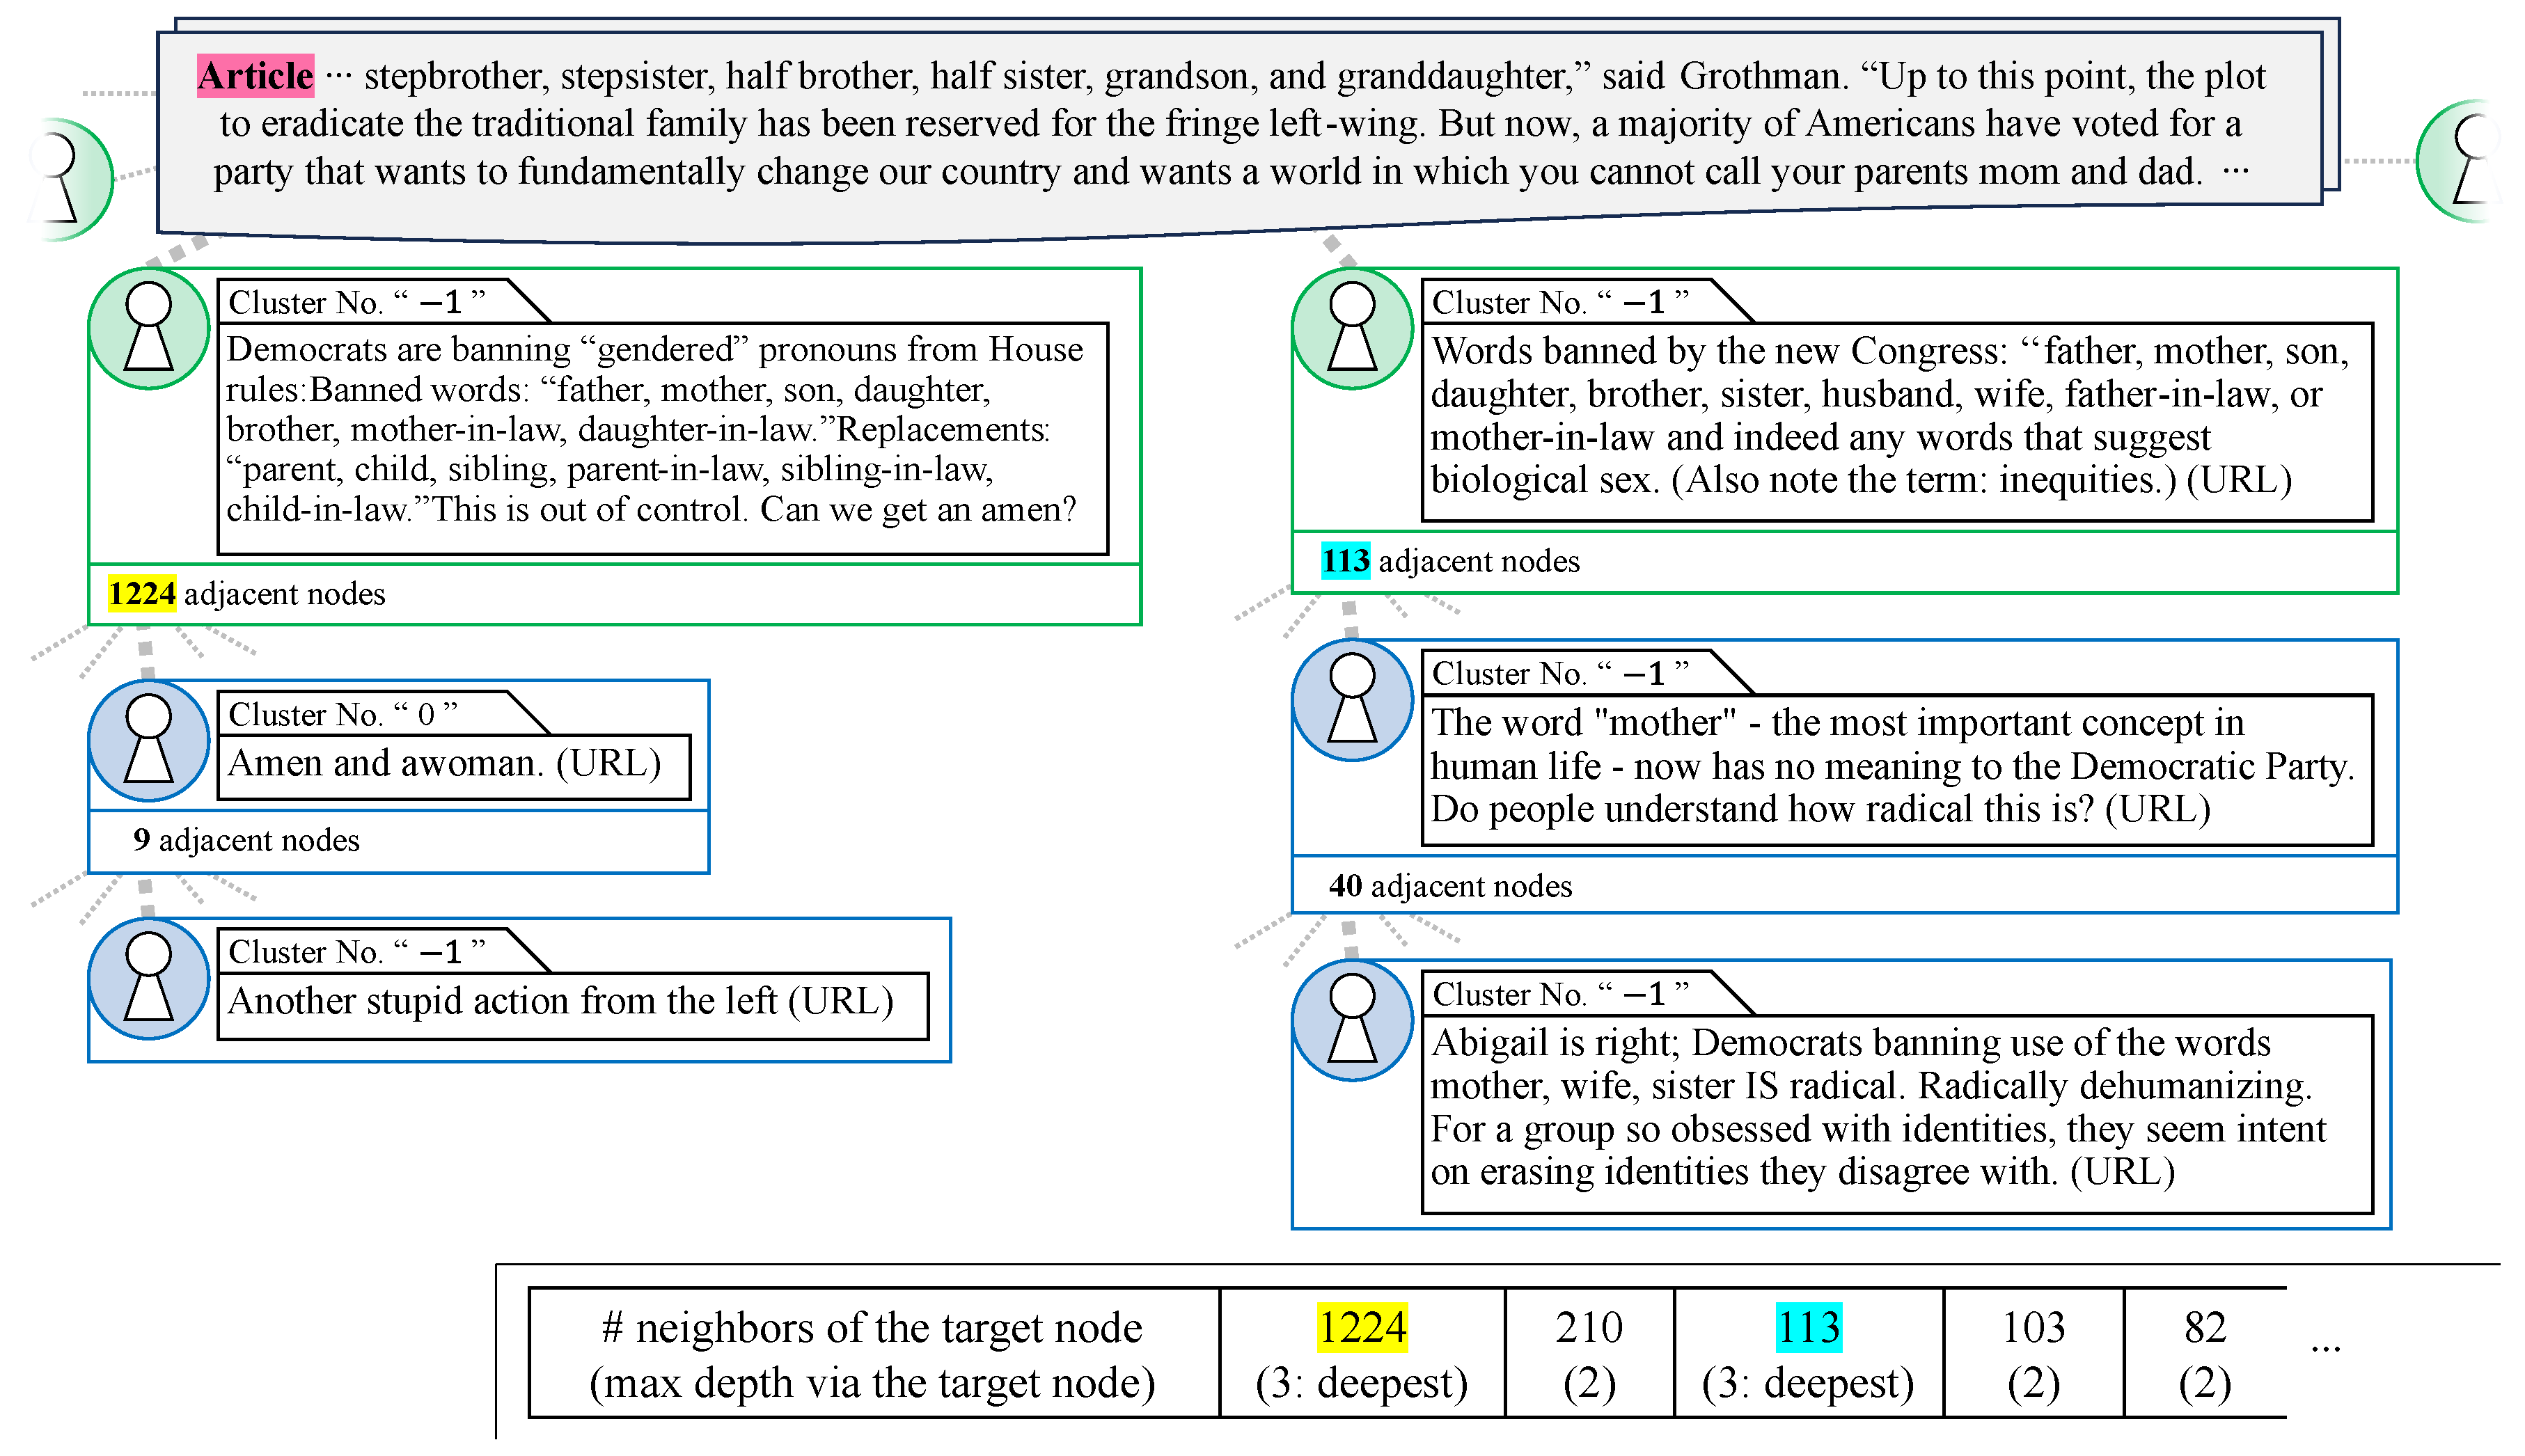
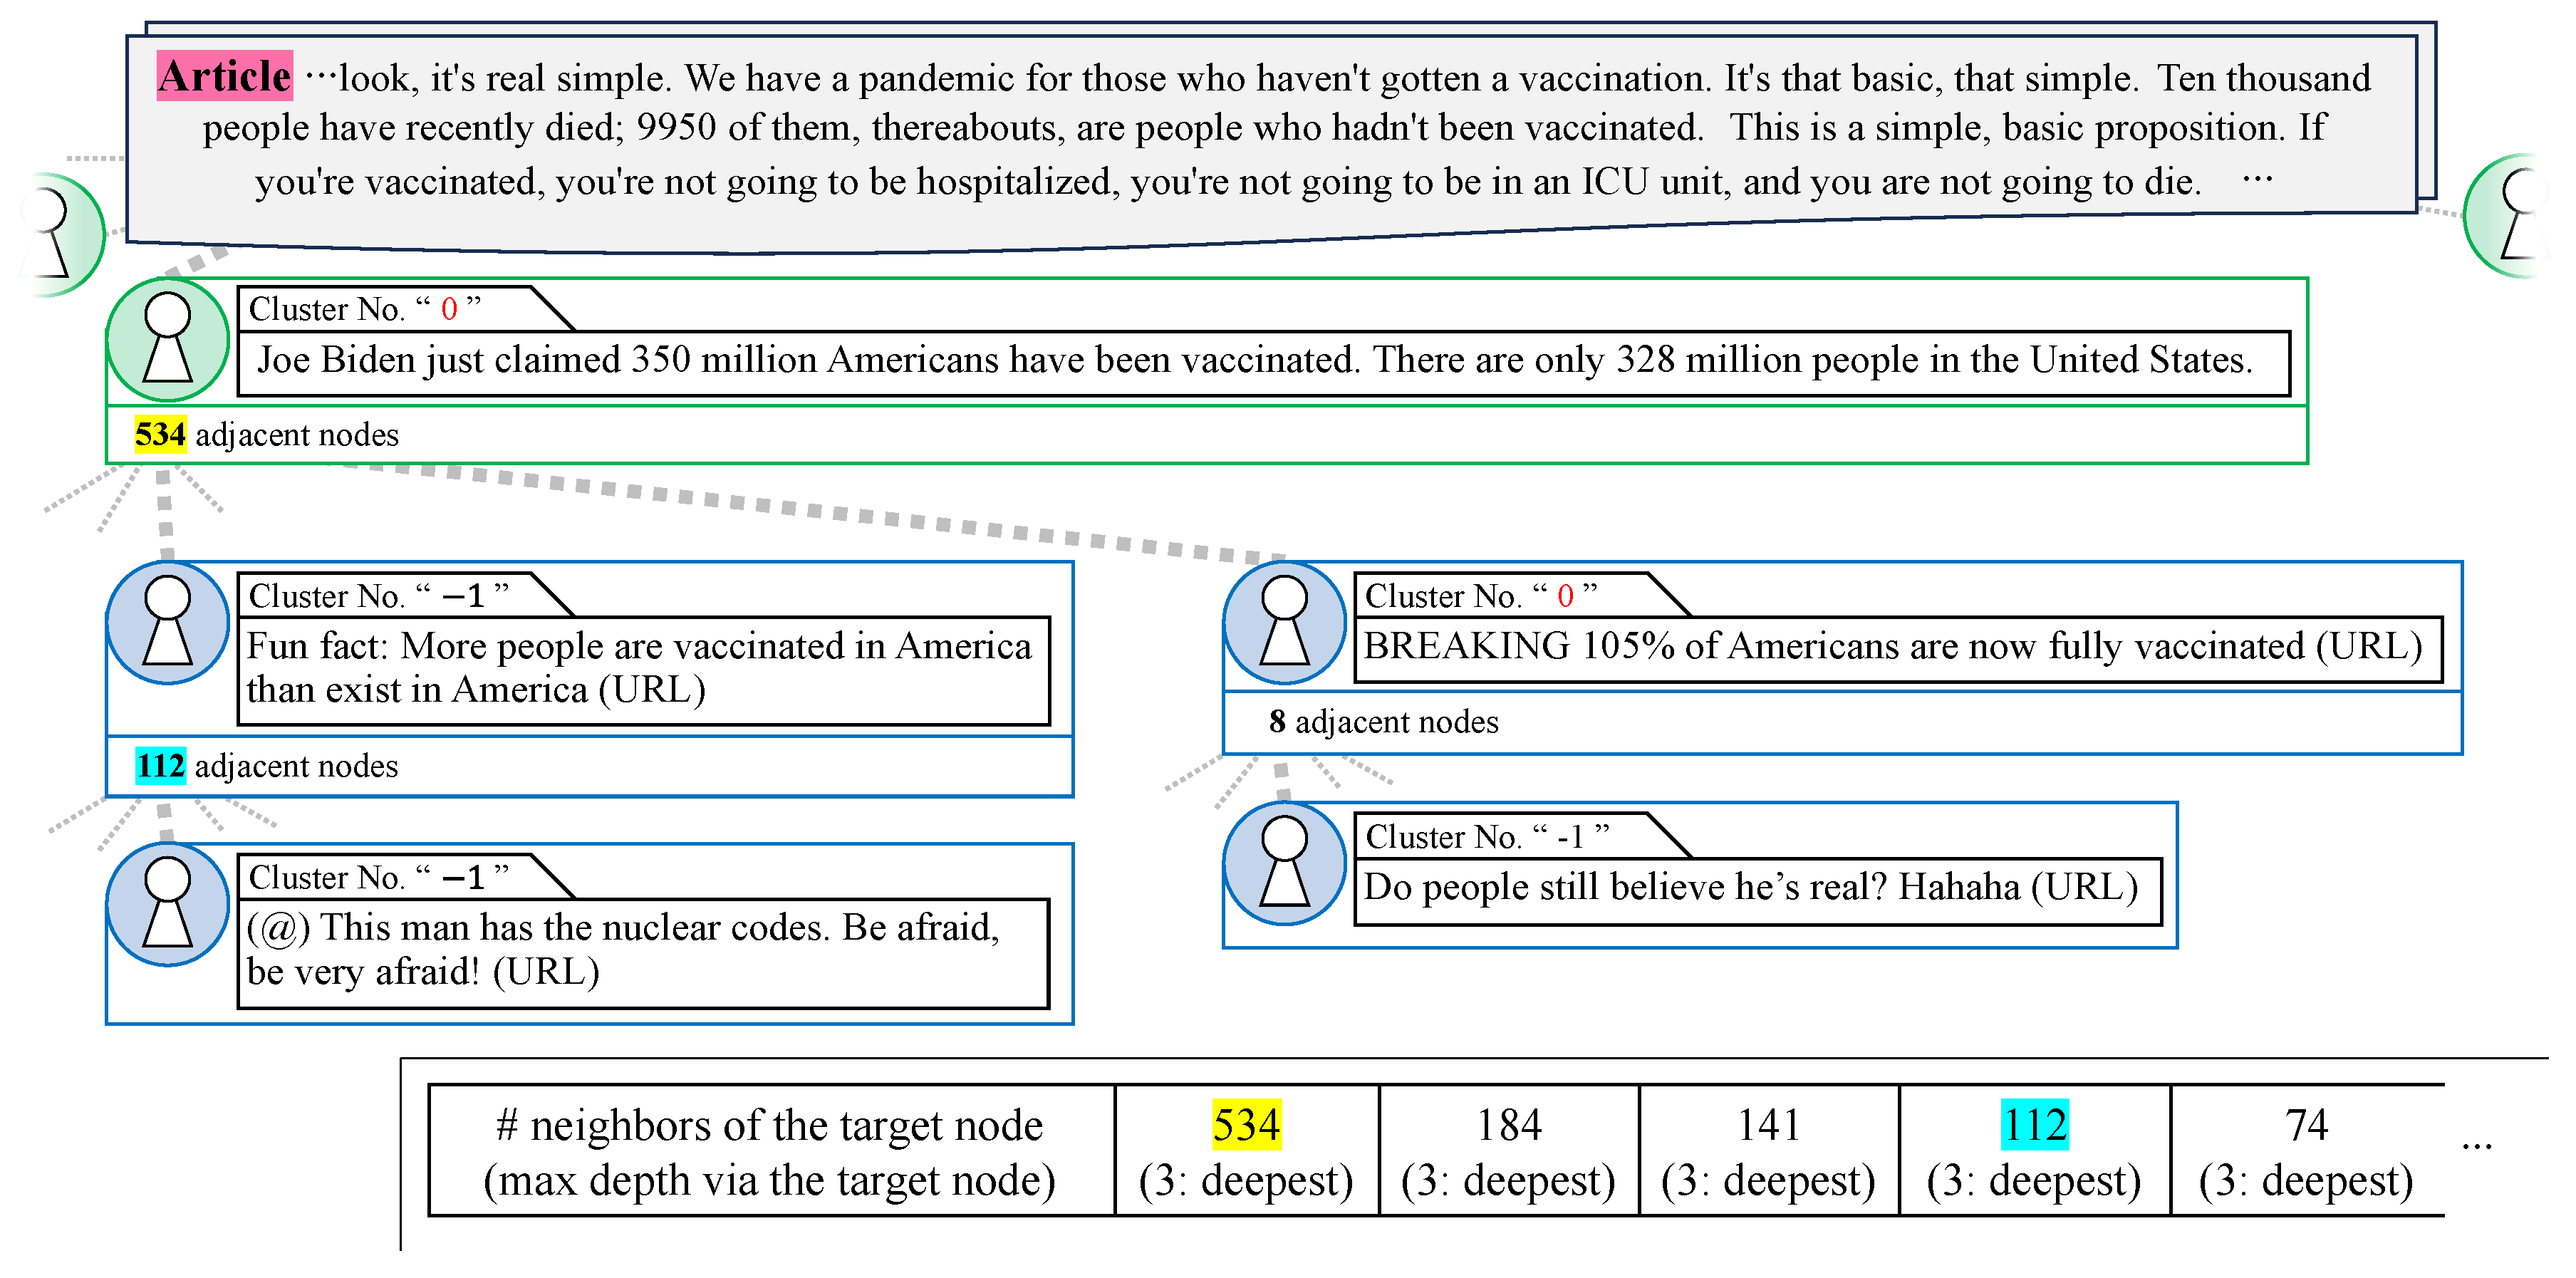
Table 1.
Statistics of graphs constructed by the Twitter dataset. # means ’number of’.
| Real | Fake | |
|---|---|---|
| # of propagation graphs | 37 | 55 |
| Total # of nodes | 193,050 | 329,979 |
| Total # of paths | 191,153 | 326,077 |
| Total # of quote retweets | 70,346 | 112,222 |
| Average max depth | 2.59459 | 2.85455 |
Table 2.
U-test results for the hypotheses.
| Metrics | p-Value |
|---|---|
| 0.03664 (<0.05) | |
| 0.09521 (>0.05) | |
| 0.01997 (<0.05) | |
| 0.2420 (>0.05) | |
| 0.1705 (>0.05) |
Disclaimer/Publisher’s Note: The statements, opinions and data contained in all publications are solely those of the individual author(s) and contributor(s) and not of MDPI and/or the editor(s). MDPI and/or the editor(s) disclaim responsibility for any injury to people or property resulting from any ideas, methods, instructions or products referred to in the content. |
© 2024 by the authors. Licensee MDPI, Basel, Switzerland. This article is an open access article distributed under the terms and conditions of the Creative Commons Attribution (CC BY) license (https://creativecommons.org/licenses/by/4.0/).
Share and Cite
MDPI and ACS Style
Soga, K.; Yoshida, S.; Muneyasu, M. Graph-Based Interpretability for Fake News Detection through Topic- and Propagation-Aware Visualization. Computation 2024, 12, 82. https://doi.org/10.3390/computation12040082
AMA Style
Soga K, Yoshida S, Muneyasu M. Graph-Based Interpretability for Fake News Detection through Topic- and Propagation-Aware Visualization. Computation. 2024; 12(4):82. https://doi.org/10.3390/computation12040082
Chicago/Turabian StyleSoga, Kayato, Soh Yoshida, and Mitsuji Muneyasu. 2024. "Graph-Based Interpretability for Fake News Detection through Topic- and Propagation-Aware Visualization" Computation 12, no. 4: 82. https://doi.org/10.3390/computation12040082
Note that from the first issue of 2016, this journal uses article numbers instead of page numbers. See further details here.