Article

Air–Water Two-Phase Flow Dynamics Analysis in Complex U-Bend Systems through Numerical Modeling

1
Faculty of Mechanical Engineering, Istanbul Technical University, Beyoglu, Istanbul 34437, Türkiye
2
Mechanical Engineering Department, Istanbul Bilgi University, Eyüp, Istanbul 34060, Türkiye
*
Author to whom correspondence should be addressed.
Computation 2024, 12(4), 81; https://doi.org/10.3390/computation12040081
Submission received: 8 March 2024 / Revised: 6 April 2024 / Accepted: 10 April 2024 / Published: 12 April 2024

Abstract

:
This study aims to provide insights into the intricate interactions between gas and liquid phases within flow components, which are pivotal in various industrial sectors such as nuclear reactors, oil and gas pipelines, and thermal management systems. Employing the Eulerian–Eulerian approach, our computational model incorporates interphase relations, including drag and non-drag forces, to analyze phase distribution and velocities within a complex U-bend system. Comprising two horizontal-to-vertical bends and one vertical 180-degree elbow, the U-bend system’s behavior concerning bend geometry and airflow rates is scrutinized, highlighting their significant impact on multiphase flow dynamics. The study not only presents a detailed exposition of the numerical modeling techniques tailored for this complex geometry but also discusses the results obtained. Detailed analyses of local void fraction and phase velocities for each phase are provided. Furthermore, experimental validation enhances the reliability of our computational findings, with close agreement observed between computational and experimental results. Overall, the study underscores the efficacy of the Eulerian approach with interphase relations in capturing the complex behavior of the multiphase flow in U-bend systems, offering valuable insights for hydraulic system design and optimization in industrial applications.

1. Introduction

Gas–liquid two-phase flows, characterized by the simultaneous transport of gas and liquid phases within various flow components, represent a fundamental yet challenging phenomenon critical to a wide range of industrial applications. These applications span a broad spectrum, including nuclear reactors [1,2], oil and gas pipelines [3,4,5], bio/chemical processes [6,7], and thermal management systems [8]. A comprehensive understanding and characterization of two-phase flow phenomena is necessary due to the critical role that the dynamic interaction between gas and liquid phases within flow components plays in determining system behavior, performance, and safety.
In many applications, flow components can have a range of geometries. Multiphase flow can occur in various configurations, including ducts and straight channels [9], U-bends [10,11], manifolds with collectors [12,13], or expansion/contraction sections [14,15]. Industrial flow systems comprise components of varying geometries, leading to singularities and complexities that require comprehensive analysis. Among the flow components, bends and elbows are of particular interest in many studies due to the centrifugal forces, changes in pressure and velocity gradients, and the associated secondary flow conditions. The dynamics of multiphase flows in bends are influenced by factors such as boundary conditions, flow regimes and interfaces, and the distribution of phases within the flow.
Zahedi and Rad [16] examine two-phase flows in 90-degree horizontal bends, focusing on parameters such as volume fraction, velocity, pressure, turbulence intensity, and swirling intensity using the volume of fluids (VOF) approach. Kim et al. [17] assess the impact of the geometric characteristics of 90-degree bends and determine that the presence of the elbow significantly influences both the distribution of local parameters and their evolution. Dutta et al.’s study [18] explores flow separation for high Re numbers in horizontally oriented bends, while Mazumder and Siddique [19] and Aung and Yuwono [20] investigate the two-phase characteristics of horizontal to vertical orientation by employing the Eulerian approach. Abhari et al. [21] conduct a study in horizontal 90-degree elbows but for a large diameter pipe (1.1 m). Qiao et al.’s [22] study evaluates the void fraction and velocity profile development in a 90-degree vertical elbow through a combination of measurements and numerical analysis. Measurements at the elbow reveal the generation of a secondary flow due to centripetal forces and pressure gradients in the direction of the inner curvature.
Limited studies in the literature have also been conducted on 180-degree return bends (U-bends) with various orientations, highlighting a gap in the current research landscape beyond investigations on 90-degree bends. While some of the research has explored the flow regimes and characteristics [23,24,25] and heat transfer enhancements [26,27,28] in 180-degree bends, comprehensive studies on the influence of bend geometry on two and three-dimensional flow dynamics in such configurations are scarce. Furthermore, most of the studies focus solely on pressure drop characteristics [23,25,27]. However, understanding the dynamics of two-phase flows in different bend configurations is crucial for various industrial applications of hydraulic systems. The presence of multiple flow regimes, such as stratified, annular, or slug flow, along with the centrifugal forces induced by the bend, significantly influences phase distribution, flow velocities, and heat transfer characteristics. Therefore, there is a clear research gap in understanding the detailed flow patterns and scour behavior in those complex geometries, necessitating more in-depth investigations to enhance our knowledge of multiphase flows in these challenging geometries.
Based on the literature survey, most of the studies have focused solely on unidirectional (upward/downward) or vertical/horizontal orientations, treating bends and elbows as individual sections. In contrast, our study investigates the air–water two-phase flow in a complete U-bend, comprising two horizontal-to-vertical (upward and downward) 90-degree bends and one vertical 180-degree elbow. This comprehensive approach allows us to model the entire bend as a cohesive system, mirroring real-world applications. Expanding upon our preliminary work presented at the 14th International Conference on Computational Heat, Mass, and Momentum Transfer (ICCHMT 2023) [29], where we introduced the concept of transient two-phase modeling in U-bends, this extended study includes a parametric analysis of airflow rates of 30, 35, and 40 L/min. Our numerical model employs separate equations for each phase by leveraging the Eulerian–Eulerian approach and providing a grounded framework for the separated flow model. The robust computational model developed in our study facilitates a comprehensive assessment of two-phase flow dynamics in complex pipeline applications, encompassing both horizontal and vertical orientations. Additionally, experimental validation conducted at Istanbul Technical University Hydraulic Laboratories confirms the reliability of our computational results, demonstrating good agreement between numerical simulations and experimental data.

2. Materials and Methods

This section provides a detailed description of the computational model used to analyze an air–water two-phase flow in a sophisticated U-bend system. The geometry of the system, solid model, mesh structure, boundary conditions, and numerical model setup are elaborated upon to offer a clear understanding of the methodology employed in the study to simulate the complex flow behavior within the U-bend configuration.

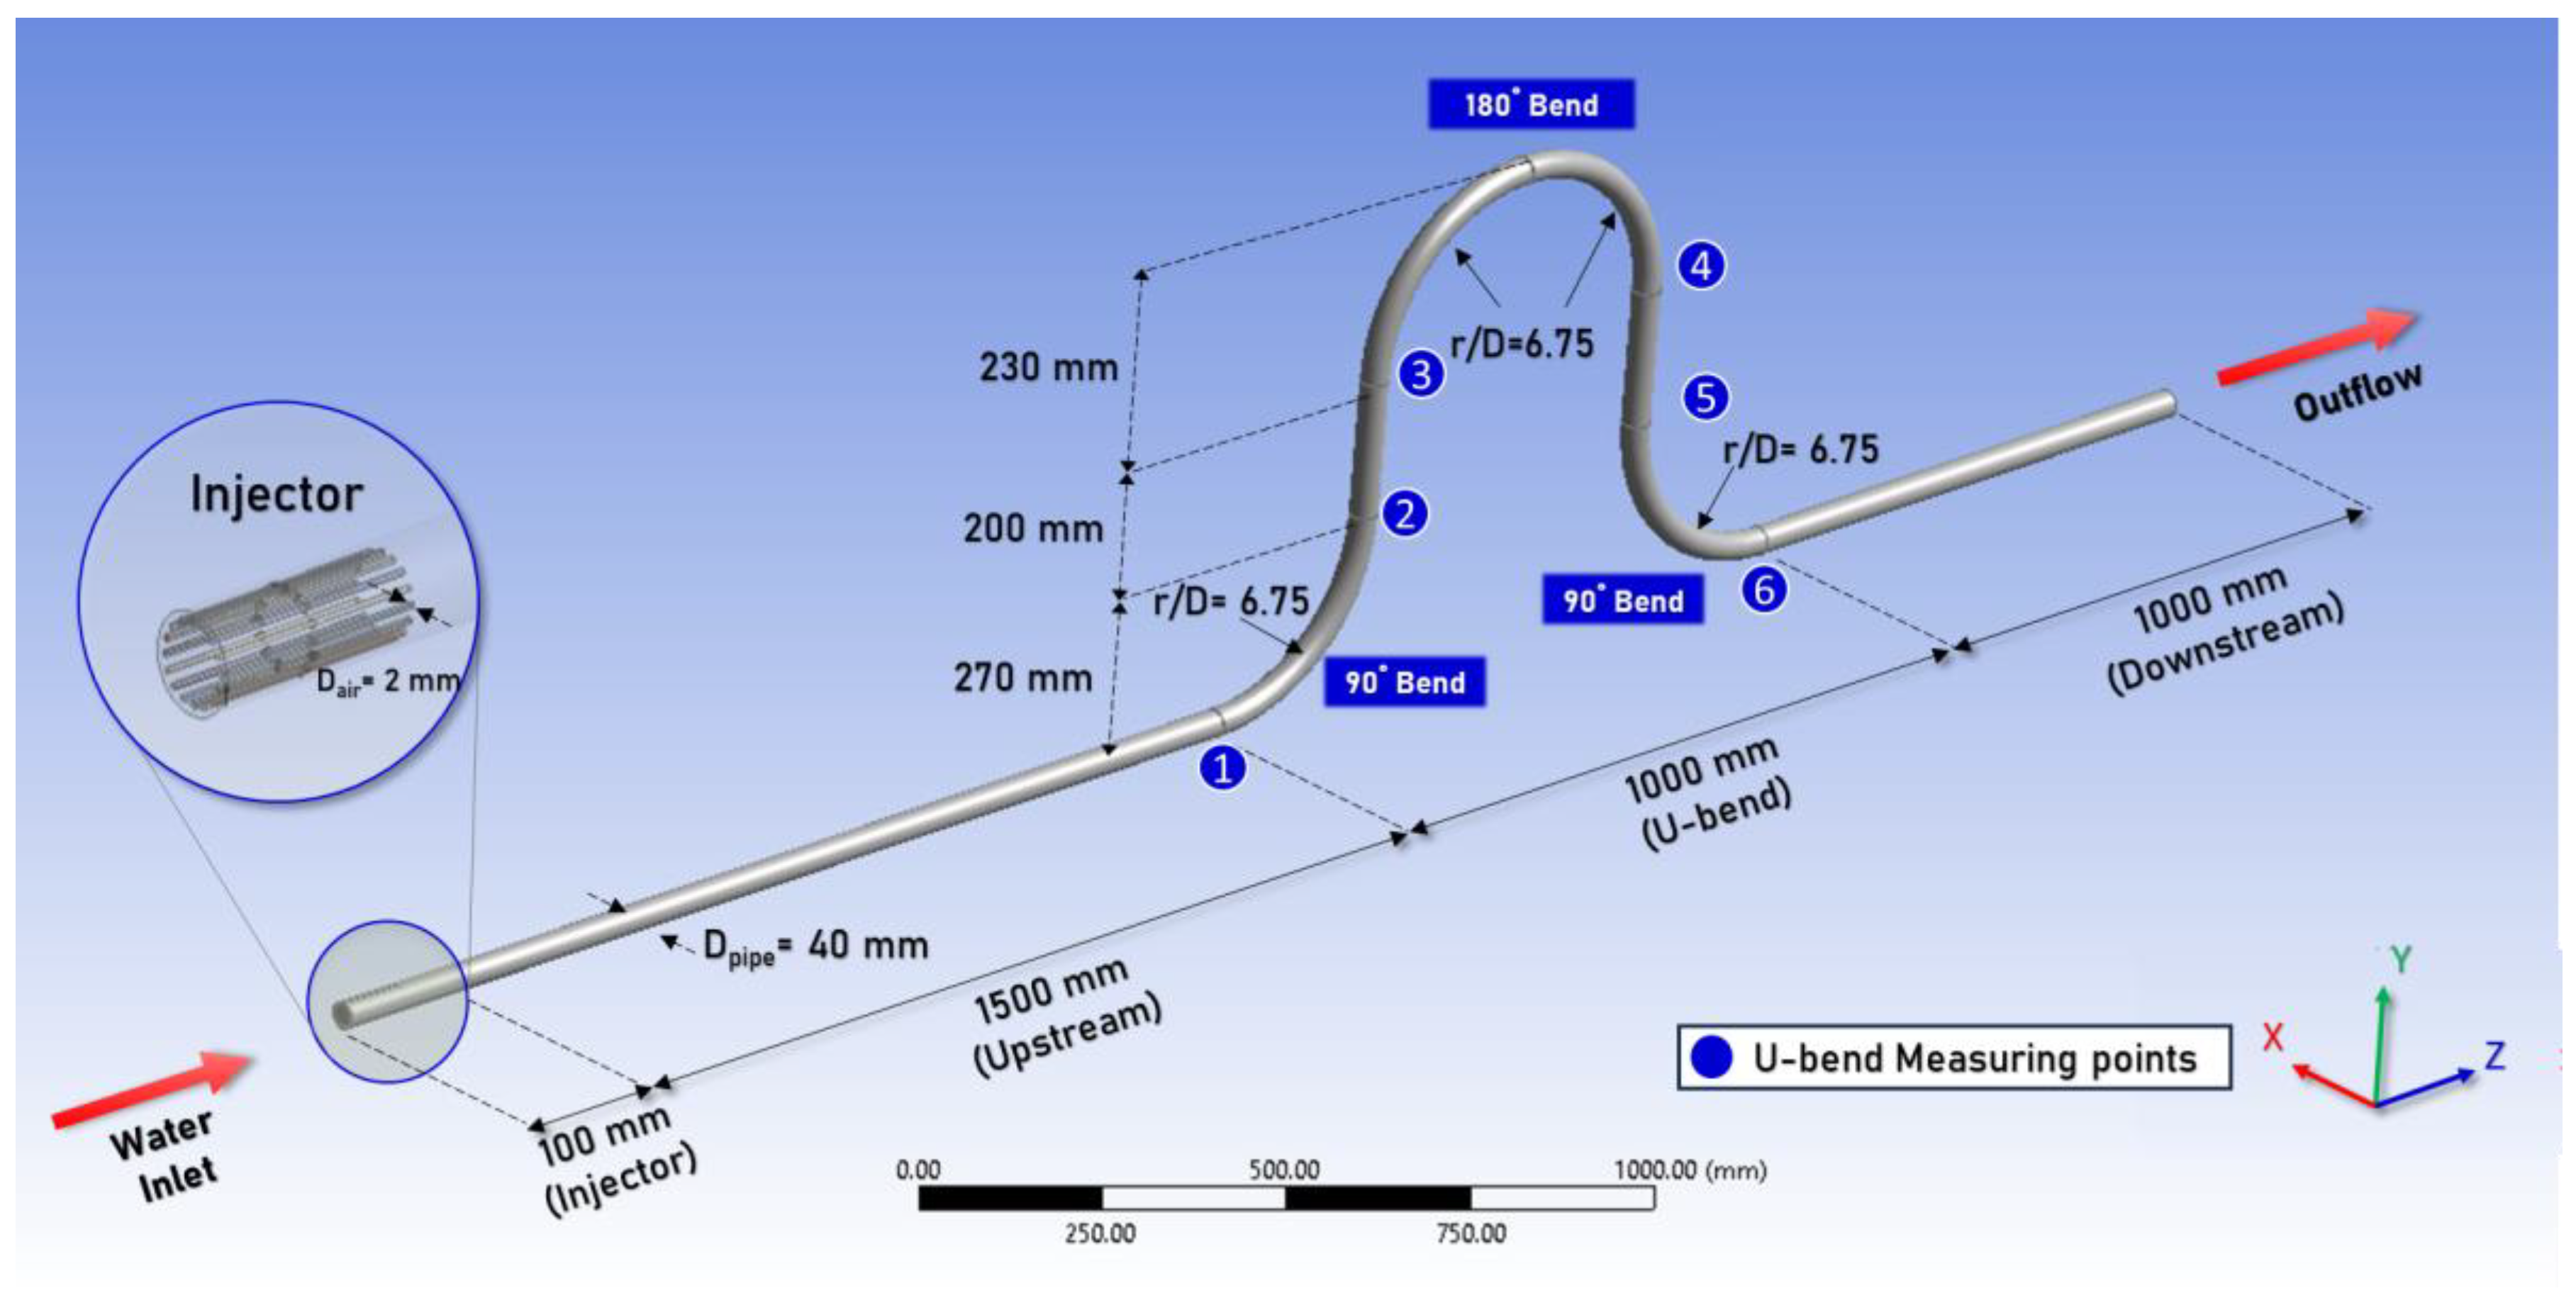
2.1. Geometry of Computational Model

The complete flow domain model is constructed by assembling the injector, upstream, U-bend, and downstream sections, as depicted in Figure 1.
The dimensions of the model utilized in this study were specifically designed to be consistent with the physical setup outlined in our previously published studies [10,29,30]. The flow domain initiates at the inlet cross-section of a cylindrical pipe with a diameter of Dpipe = 40 mm, where two-phase air–water flow conditions are introduced via the circular air injector. The injector provides air injection into the water flow through nozzles located at 16 equally spaced points around the circumference. As illustrated in the figure, each air pipe has a hydraulic diameter of Dair = 2 mm and extends 100 mm into the flow domain. This extension of the pipe into the flow domain establishes a separate domain for the air phase to develop. In the numerical model, the inner surfaces of the extended part are designated as inflow to prevent any flow disturbance, while the inlet cross-sections are individually configured as air inlets.
Following the injector section, a 1500-mm-long horizontal section called the upstream section is constructed. This section allows for observing the air–water flow development before entering the test section, which includes the U-bend geometry. In the upstream region, the flow reaches fully developed conditions prior to entering the U-bend section. Fully developed conditions are identified based on the hydrodynamic characteristics of the determined flow regime becoming evident. The flow regime for our phase characteristics and physical conditions is established as plug flow by employing commonly used flow regime maps of horizontal liquid–gas flows outlined in Baker’s [31] and Hewitt and Robert’s [32] studies. In our previous and experimental investigations, we confirmed that the transition to plug flow is achieved within the upstream region. This enables us to examine the two-phase flow characteristics under fully developed multiphase conditions for both phases. We observed that the bubbles are clustered in the upper portion of the pipe as plugs, exhibiting characteristics indicative of plug flow towards the end of the upstream region. This aspect is further explored in our experimental study [10].
The U-bend section initiates with a 90° vertical upward elbow featuring a curvature ratio of r/D = 6.75 (r = 270 mm, D = 40 mm), following the upstream segment. It is then followed by a further 200mm vertical upward section, diverging our work from previous works investigating the U-bend effect in the literature. Typically, U-bends are constructed solely as 180-degree return bends [25,28,31,32]. However, in our study, we also examine the pre-effect of the 90-degree upward and downward elbows on the two-phase flow, in addition to the effect of the 180-degree return U-bend. The 180-degree bend features a curvature ratio of r/D = 5.75 (r = 230 mm, D = 40 mm). After passing through the U-bend, the flow moves symmetrically downwards towards the last 90° bend (transitioning from a vertical to a horizontal orientation) with a curvature ratio of r/D = 6.75. Later, the flow proceeds to the pipe outflow along the downstream section.

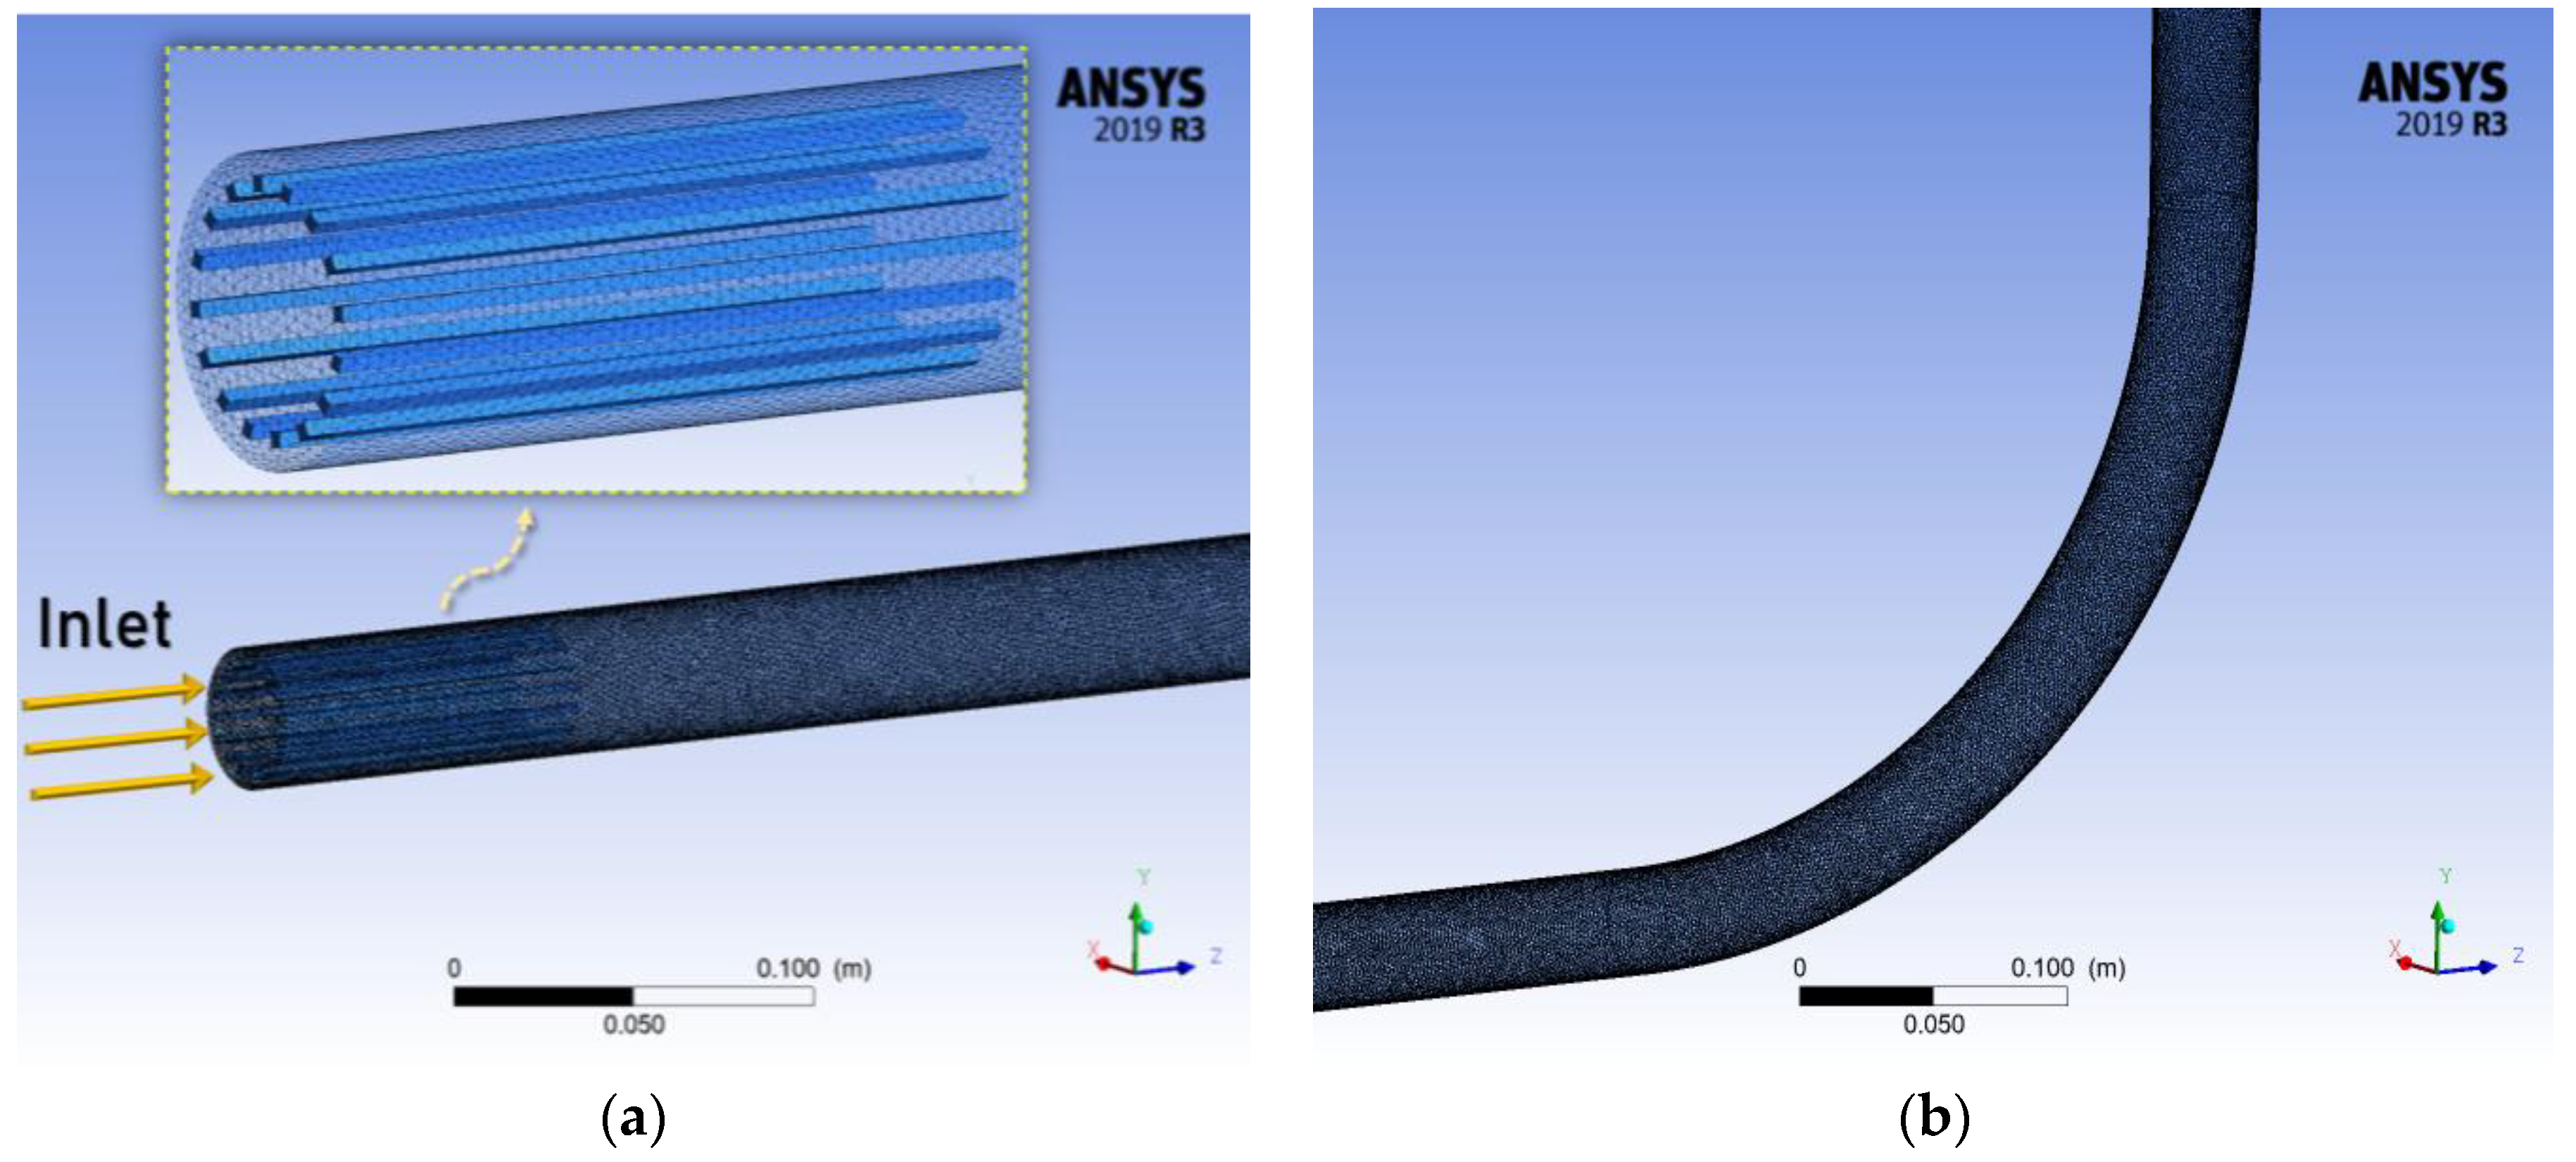
2.2. Mesh Structure and Design Parameters

The meshing for the fluid domain comprises high-resolution tetrahedral-based elements, a common practice in flow and two-phase flow simulations due to their effectiveness in handling complex geometries [33]. In this study, we adopted a tetrahedral-weighted mesh with a finer element size to model the complex geometry of the injector and U-bend more accurately and consistently. The complete model is composed of more than 4.1 million nodes and 2.8 million elements, with a mesh size set at 1 × 10⁻⁵ m, and the maximum allowed mesh size is 4 × 10⁻³ m. The mesh size is selected in compliance with the bubble diameters calculated at the outlet of the injector. The bubble diameter at the outlet of the injector is calculated using the relation developed by Kunii and Levenspiel [34] based on the variables, which are the volumetric flow rate and the diameter of the air nozzles. The mean bubble size estimated is 1 mm to 5 mm, as was also investigated in our previous experimental results [10].
The mesh skewness and orthogonal quality study are utilized to assess mesh quality. The average skewness is determined to be 0.22, while the orthogonal quality is evaluated at 0.78. Figure 2 illustrates the generated mesh structure of the injector and bend sections.
As shown in Figure 2a, the inlet cross-sectional area is defined as a velocity-inlet boundary condition for each phase. Meanwhile, the side areas of the rectangular cross-section of the air domain are specified as interior flow boundaries. The remaining pipe walls are set as no-slip boundary conditions. The boundary condition is chosen as a pressure outlet at the outlet section located at the end of the downstream segment, as the pipe discharges into a tank that is open to the atmosphere.
The water phase is designated as the primary phase for computational modeling, and the volumetric water flow rate is set at 180 L/min. The design parameters for the water phase are detailed in Table 1.
In the calculations, all thermal properties of the water phase are determined based on the average temperature of 24 °C. The mass flux rate and superficial velocity are computed considering the pipe diameter, which is 40 mm (0.04 m). Additionally, the Reynolds Number (Re) for the liquid phase is calculated as 1.04 × 10⁶ (»3500), indicating that the water flow regime is turbulent.
On the other hand, the secondary phase is designated as air to represent the gas phase. The volumetric airflow rate is varied at 30, 35, and 40 L/min to conduct a parametric study. The air is distributed to the injector section through sixteen capillary pipes placed around the pipe circumference at equal angles. Design conditions for the air phase are presented in Table 2.

2.3. Numerical Model

The volume of fluid (VOF), mixture, and Eulerian models are commonly used numerical methods for simulating multiphase flows. While the VOF model is employed to analyze interfaces between phases, it can be computationally expensive and struggles with resolving thin interfaces and complex interfacial dynamics. In contrast, the mixture model treats multiphase flow as a single continuous mixture, rendering it suitable for dispersed flows but limited in accurately capturing phase segregation and interface dynamics. Despite their utility, both models exhibit weaknesses in representing strong phase interactions, often necessitating more advanced modeling approaches for precise predictions. On the other hand, the Eulerian Model, particularly the Eulerian–Eulerian approach, has attracted significant attention in multiphase flow modeling due to its effectiveness in simulating complex scenarios. Hence, the Eulerian model will be further elaborated in this study.

2.3.1. Eulerian Model

The Eulerian model is among the most comprehensive approaches for multiphase modeling. Developed based on the separated flow model theory, it treats the properties of each phase separately, solving the governing equations independently for each phase.
The volume fraction (α) is determined by solving the continuity equation. Equation (1) addresses the continuity equation per phase.
t a q ρ q + α q ρ q u q = p = 1 n ( m pq m qp ) +   S q
On the right-hand side of Equation (1), the terms mpq and mqp represent mass transfer terms, while Sq denotes the source term. By default, the source term is typically zero, but it can be adjusted based on user input.
Equation (2) introduces the momentum equation solved for the Eulerian model, incorporating the interphase relations.
α q ρ q u q + α q ρ q u q 2 = α q p + τ q + α q ρ q   g   + p = 1 n   K pq u p u q +   m pq u pq   m qp u qp   + F q + F lift , q + F wl , q + F vm , q + F td , q
On the right-hand side of Equation (2), the first three terms relate to pressure, friction, and buoyancy forces, respectively. Subsequently, drag forces are accounted for in terms of interfacial and mass transfer forces. In the last part of the equation, various non-drag forces are included. As depicted, the momentum equation comprehensively addresses interphase momentum exchange and bubble interactions, incorporating various non-drag terms such as external forces (Fq), lift (Flift,q), wall lubrication (Fwl,q), virtual mass (Fvm,q), and turbulent dispersion (Ftd,q) forces. These interactions are elaborated upon in detail in the following section.
  • Interphase Momentum Exchange Relations
The Eulerian approach is particularly suitable for situations where detailed insights into phase interactions are essential. Known for its robustness and computational efficiency [35], it has been widely employed across diverse applications, demonstrating its capability to accurately capture the complexities of interphase relations [36].
Interphase relations in two-phase flows are categorized under drag and non-drag forces and are critical for modeling the dynamics and behavior of complex systems. Drag forces, resulting from the relative motion between phases, play a significant role in shaping the distribution, dispersion, and mixing of phases within the flow domain. These forces are typically classified based on flow conditions and phase properties, with factors such as viscosity and bubble size influencing their strength. The magnitude of drag force is notably affected by the shape and interfacial area of the dispersed phase. For our analysis, we adopted the Tomiyama drag model [37], which is well-suited for accommodating various bubble sizes and shapes and is commonly utilized in the literature.
Non-drag forces, on the other hand, introduce additional complexity to the system and include lift, wall lubrication, virtual mass, and turbulent dispersion forces. Lift forces, for instance, can induce the ascent of gas bubbles or descent of liquid droplets, while surface-tension-related forces like wall lubrication tend to minimize interface surface area, impacting phenomena such as droplet formation and coalescence. In our study, we incorporated the Hosokawa et al. model [38] for wall lubrication, the Tomiyama et al. [37] lift model for lift forces, the Drew et al. [39] model for virtual mass forces, and the Bertodano model [40] for turbulent dispersion forces to accurately capture bubble interactions as non-drag forces.

2.3.2. Numerical Setup

Numerical modeling of the two-phase flow was carried out utilizing ANSYS Fluent (v19.R3) in this study. Following the import of the solid model and the provision of the appropriate mesh structure, the Fluent module was employed for flow analysis.
The multiphase solver selected is the Eulerian method solver, as described previously. In this setup, water is defined as the primary phase, while air is defined as the secondary phase. The specifications for both phases are outlined in Table 1 and Table 2, as previously addressed.
For discretization, a cell-based least squares method was selected for pressure, offering advantages in convergence and accuracy, particularly with unstructured meshes. Conversely, a first-order upwind discretization scheme was employed for pressure, momentum, turbulent kinetic energy, and turbulent dissipation rate.
Furthermore, pressure–velocity coupling played a crucial role in modeling the interaction between pressure and velocity fields. Algorithms were utilized to ensure that the changes in pressure affected velocity, adhering to the continuity equation. In this context, the phase-coupled option was utilized, allowing the velocities of each phase to be independently solved based on the respective pressures.
As far as turbulence is concerned, the realizable k–ε turbulence model was employed, which is known for its ability to accurately predict turbulent characteristics and flow behavior in complex scenarios while maintaining lower computational loads and high calculation accuracy [41].
In transient simulations, the timestep is set to 1 × 10⁻⁴ s (0.1 ms), which is in line with the experimental acquisition time determined using the Nyquist sampling theorem. Further details on the sampling rate investigation can be found in [10,30]. The simulation is run over an extended flow time, with local two-phase results saved as an output file for each timestep. Cell Courant numbers are maintained below 1.0 throughout the simulation, averaging between 0.6 and 0.8.

3. Results and Discussion

The numerical results are presented in terms of local air void fraction (αair) and phase velocities.

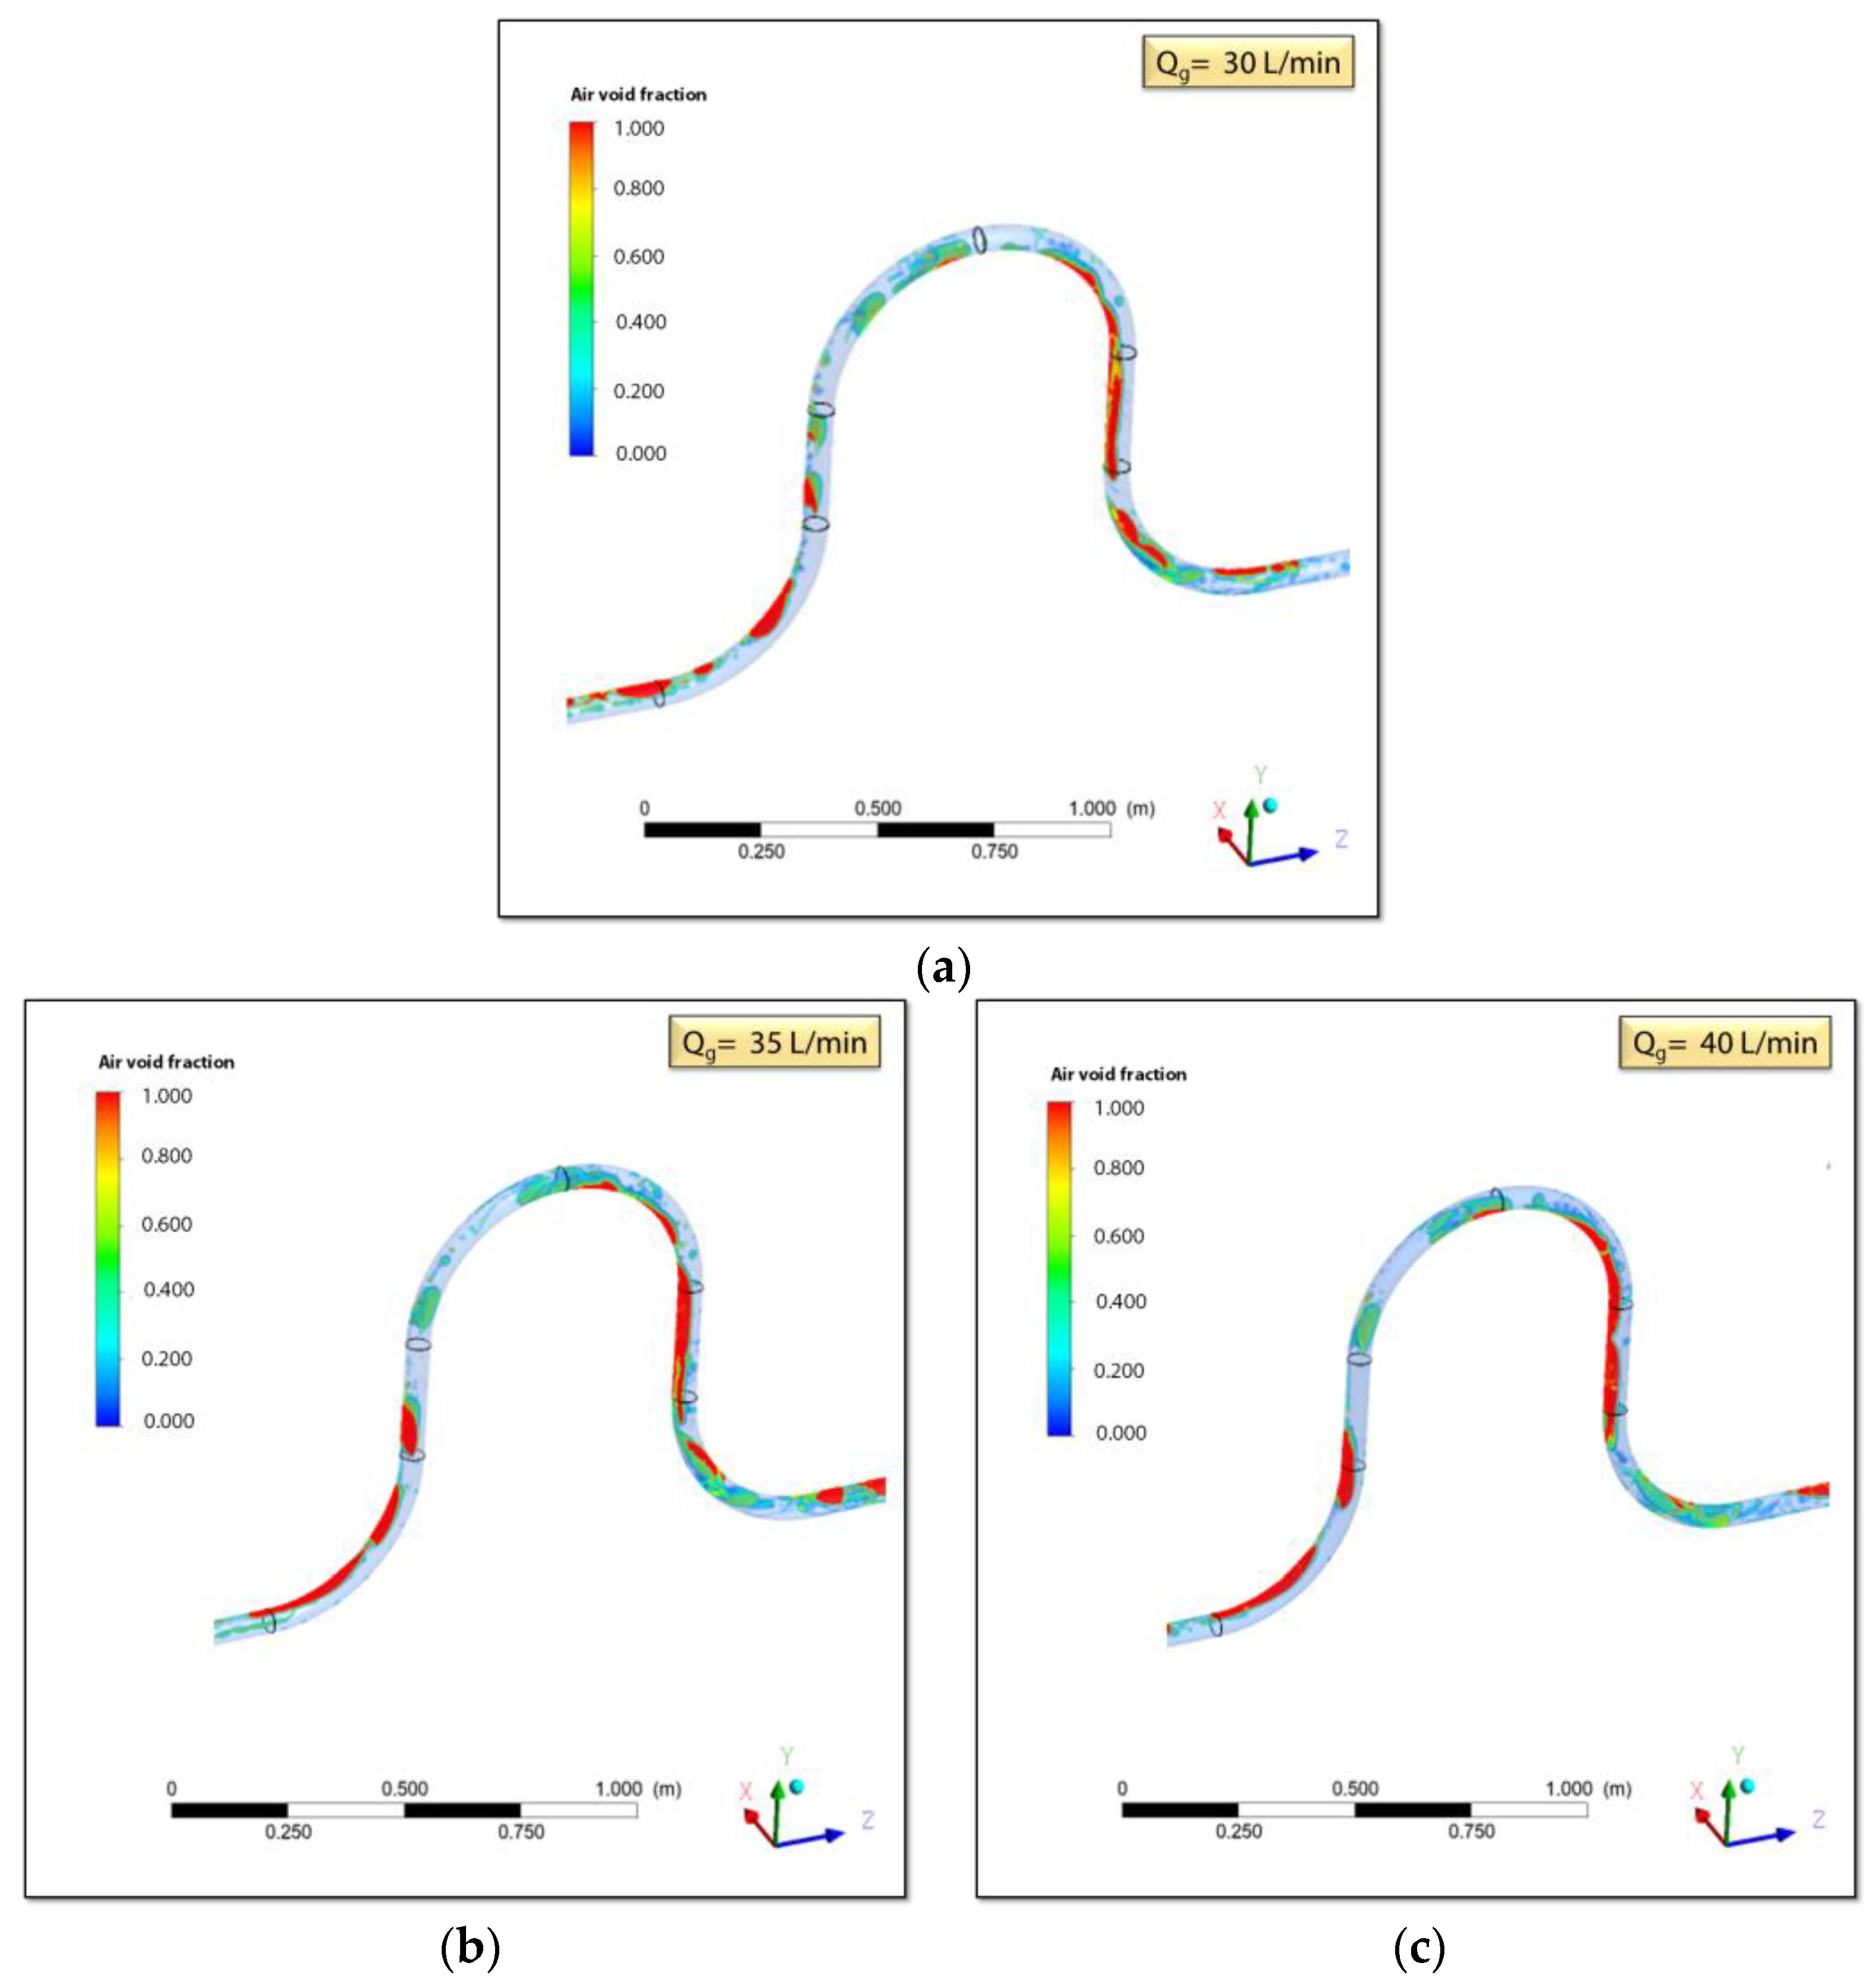
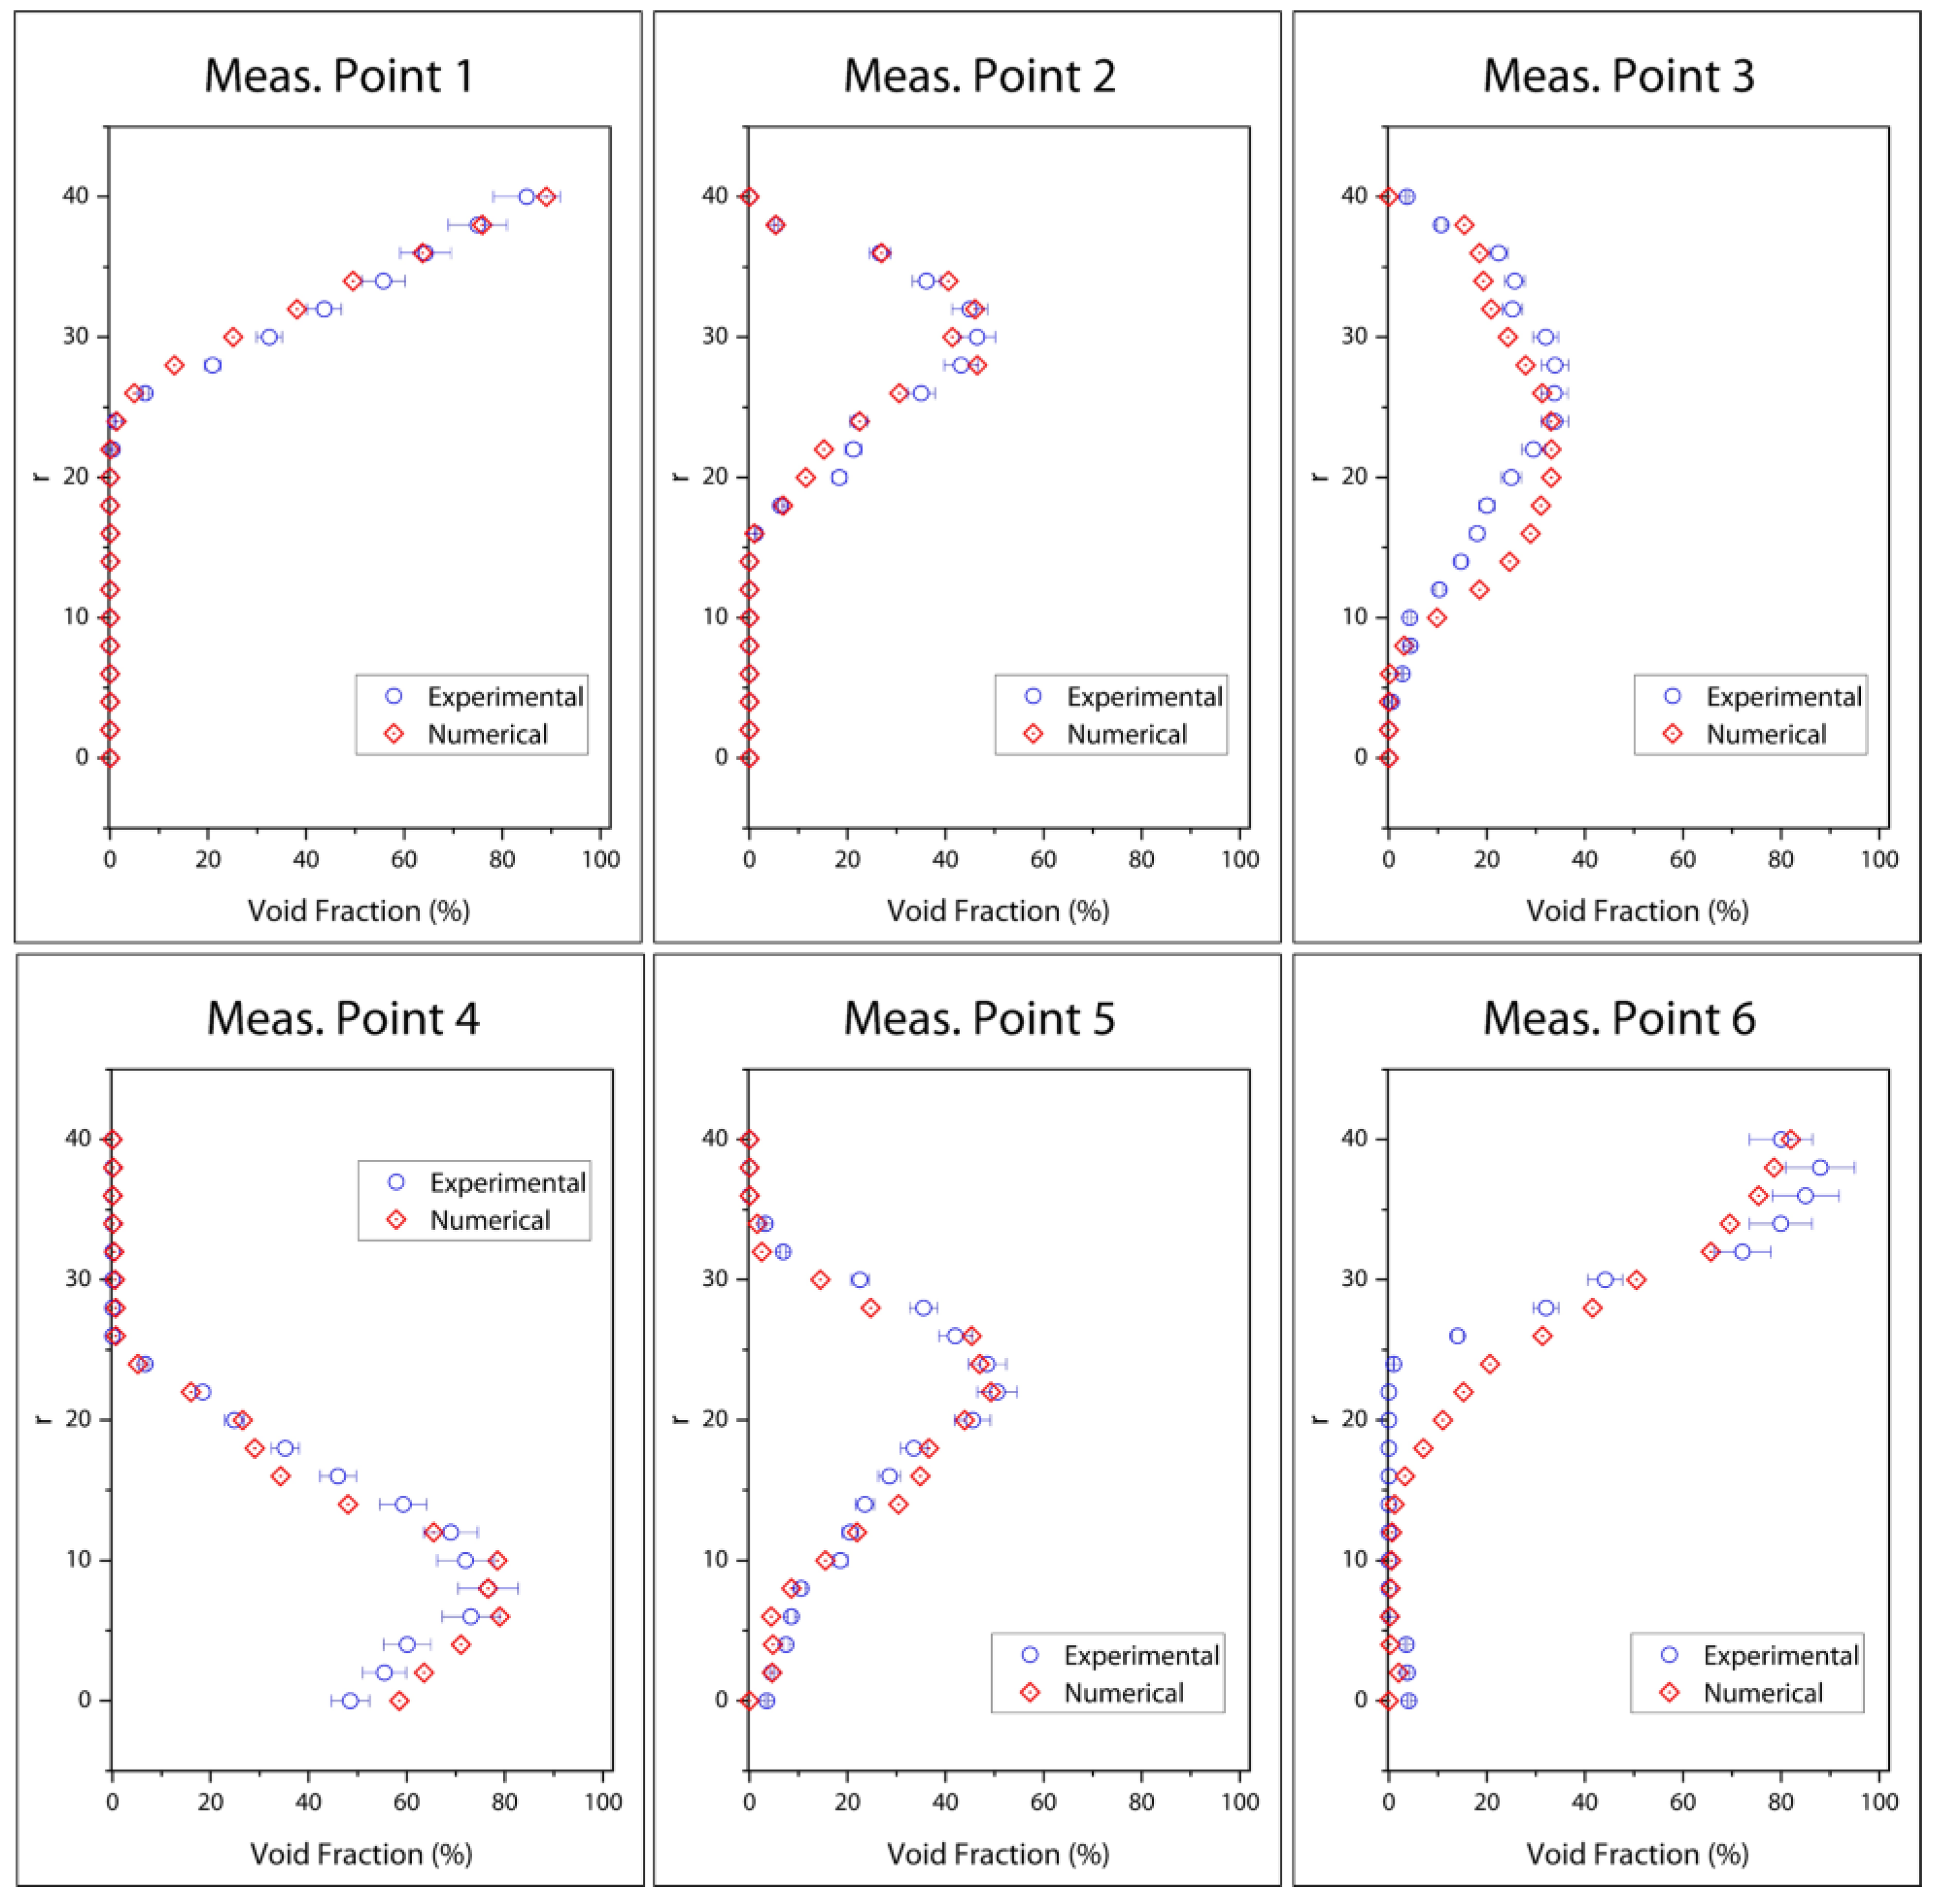
3.1. Local Air Void Fraction
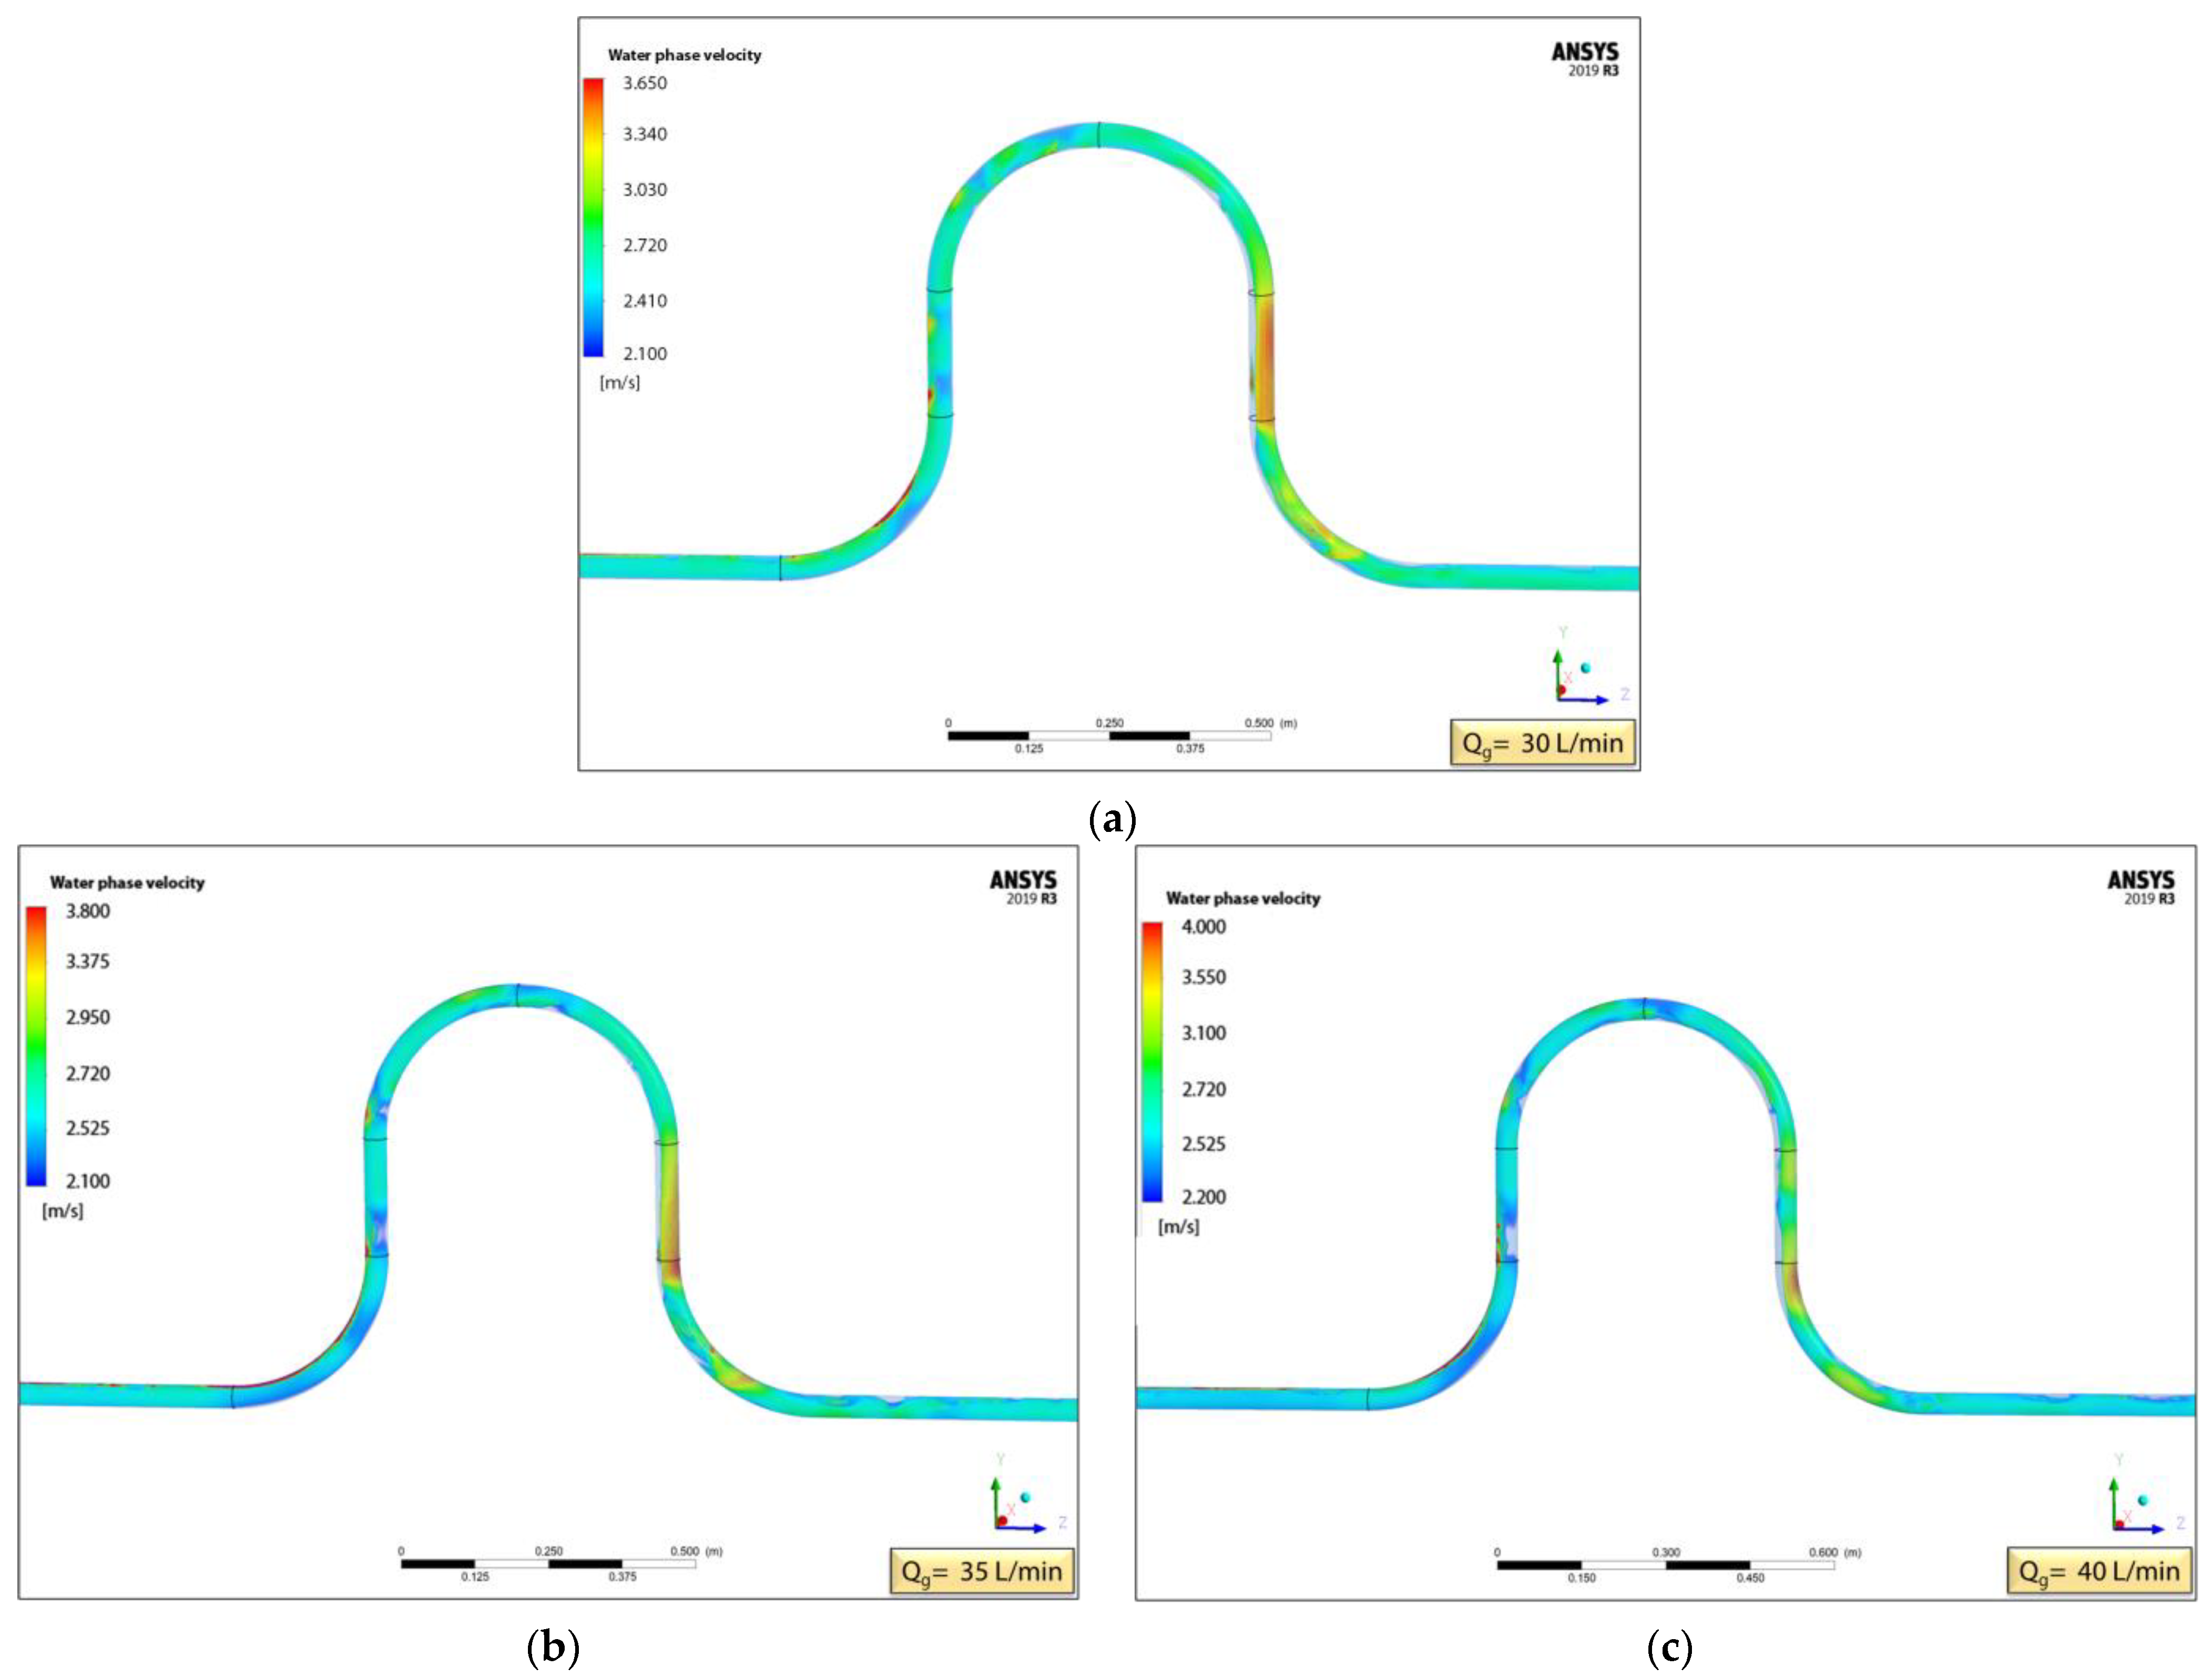
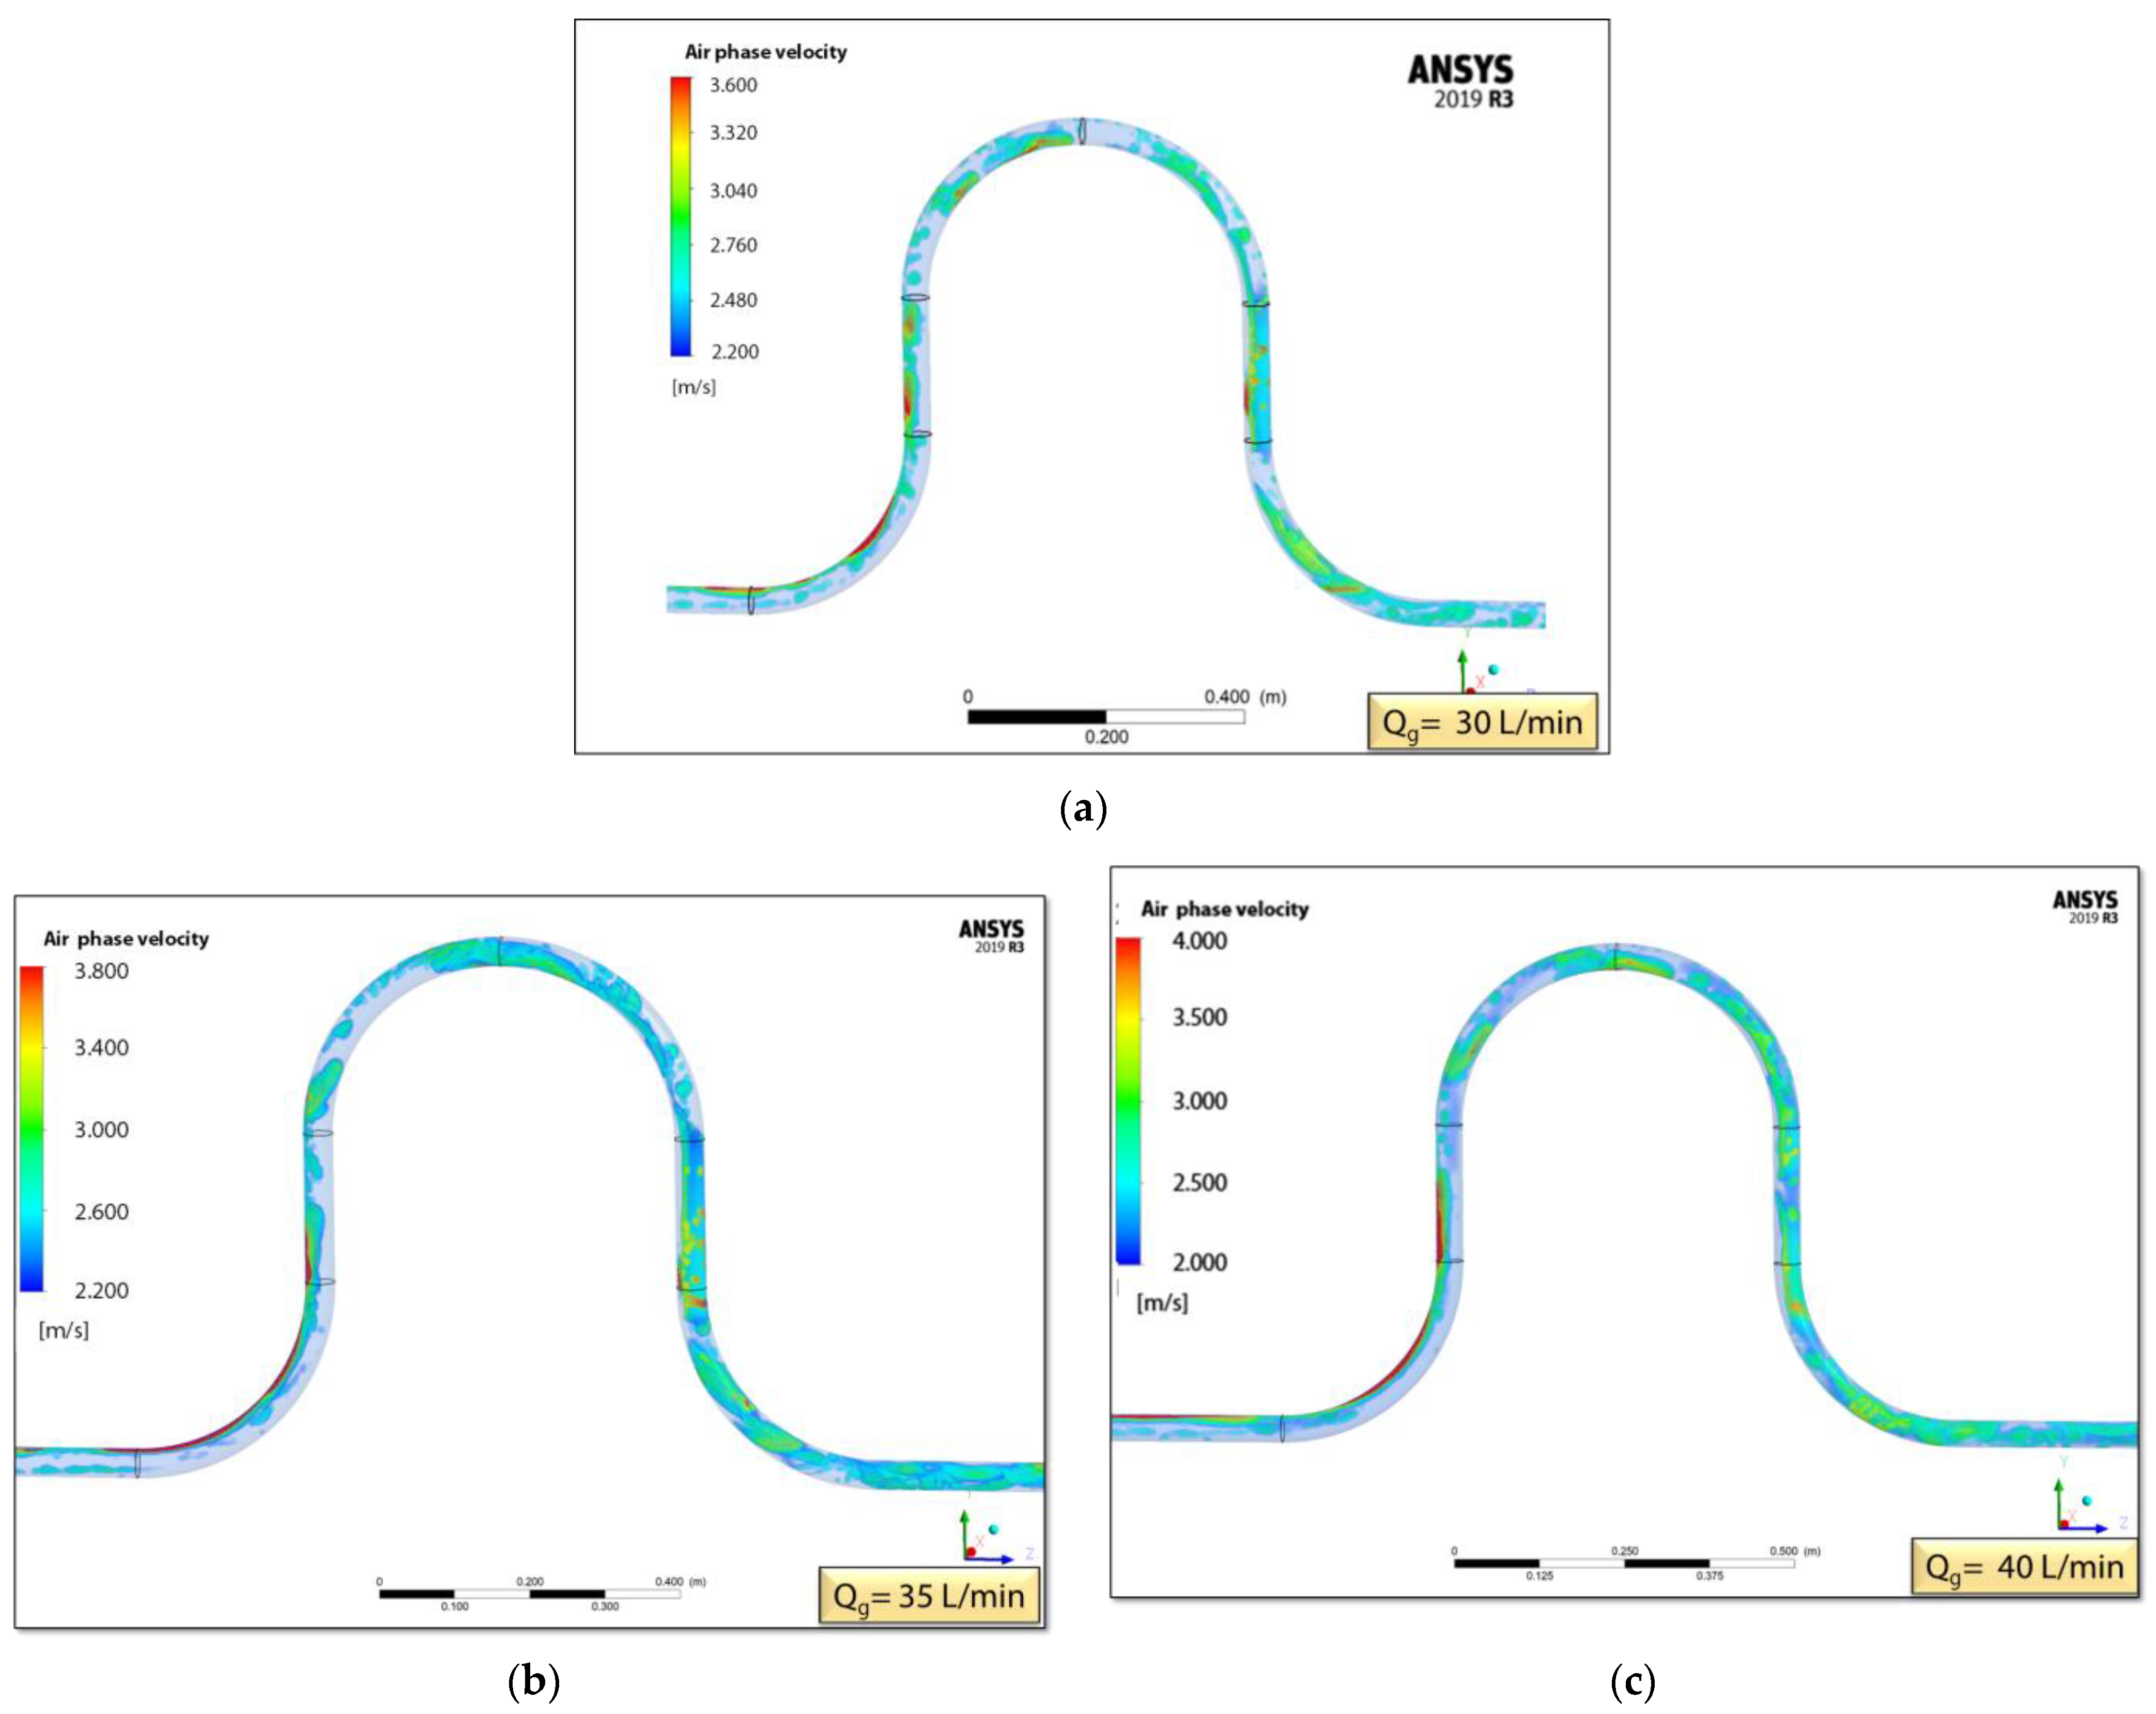
The air void fraction (αair) is determined locally for all points in the flow domain of the developed numerical model. The rendering of air volume fraction in the flow domain was plotted within the range of 0.00–1.00 (or 0–100% as a percentage) for visualization. Figure 3 illustrates the air volume fraction rendered for different airflow rates in our study. In the figure, the transparent sections represent the water phase (αair = 0), while the opaque sections (αair > 0) depict the air phase and the corresponding air void fraction.
As depicted in Figure 3, similar flow types and regimes are observed for all three airflow rates. These results align closely with the flow map regimes discussed in the earlier sections and corroborate the experimental findings and observations. Notably, the injected bubbles in the circumferential direction complete their horizontal development along the upstream section. The gas phase is notably concentrated in the vertical upper diameter of the pipe, forming extended air chords, signifying the completion of flow development by the end of the upstream. This configuration characterizes a distinct plug flow regime. Upon entering the first 90-degree bend from horizontal to vertical orientation, these elongated air chords fragment into individual slugs, also known as Taylor bubbles. This breakup phenomenon primarily originates from the bend’s effect, which generates higher centripetal forces at the outer radius compared to the inner radius, leading to bubble fragmentation post-bend, as noted by Qiao et al. [22]. Consequently, bubble breakup in the curvature direction becomes more pronounced at elevated gas flow rates, aligning with observations from the previous literature [18]. Furthermore, the bubbles tend to migrate further toward the center of the pipe as the airflow rate increases. The cross-sectional average void fractions corresponding to the present airflow rates were measured at 12.7%, 18.0%, and 22.7%, respectively.
After the initial 90-degree bend, the flow advances through a straight 200 mm riser section before reaching the 180-degree U-bend, as detailed in the geometry section. In this part of the flow, the presence of Taylor bubbles becomes notably pronounced. The liquid phase covers the entire outer wall, while the gas phase occupies the inner center, creating a local annular flow pattern. This observation holds practical significance, especially in heat transfer applications, where it can enhance heat transfer to the liquid phase along the outer wall and optimize heat exchanger designs.
As the downward vertical movement commences after the U-bend, the influence of body forces acting on the phases becomes significantly more pronounced in this section. In the downward segment, buoyancy forces act opposite to the flow direction for the gas phase. Consequently, the body forces in this region cause the liquid phase to concentrate towards the outer curvature diameter, resulting in the capture of air bubbles between the accelerating liquid phase and the inner wall of the pipe. This phenomenon leads to higher void fractions of the accumulated gas phase. However, it is observed that the effect of gas phase accumulation can be mitigated by increasing the airflow rate. The maximum local void fraction at the outer radius was found to be 82%, 81%, and 78% for 30, 35, and 40 L/min airflow rates, respectively.
A turbulence effect is observed following the final 90-degree bend, leading to a local transition to churn flow after the last elbow. This transition is attributed to the increased water velocity impacting the bottom of the wall and the centrifugal effect generated by the elbow. However, it is noteworthy that the bubbles clustered once again in the upper section, resembling plugs, and the effects of turbulence diminished significantly in the downstream section.

3.2. Phase Velocity

Since the Eulerian–Eulerian model, based on separated flow theory, is utilized for the multiphase model, the phase velocity equations are solved independently for air and water. Hence, the phase velocities are determined separately throughout the flow domain in the numerical model. Consequently, the velocities of the air and water phases in the U-bend domain were visualized using volume rendering. Figure 4 and Figure 5 show the water and air phase velocity contours in the U-bend for the parametric airflow rates, respectively.
In the vertical upward flow, the local water phase velocity decreases to 2.1 to 2.2 m/s for airflow rates of 30, 35, and 40 L/min, owing to the influence of body forces on the water phase. Conversely, the local air velocity increases to approximately 4.0–4.5 m/s due to buoyancy forces acting on the Taylor bubbles.
At the first upward bend, the average local bubble velocities at the outer radius are locally found to be 3.1 m/s for 30 L/min, 4.1 m/s for 35 L/min, and 4.5 m/s for 40 L/min. This observation underscores the substantial impact of the volumetric airflow rate on the phase velocities in the upward flow. Conversely, the water phase velocity is significantly reduced in the upward flow due to body forces acting on the water phase. Accordingly, the local average phase velocities are found to be between 2.5 and 2.7 m/s.
Upon examining the downward vertical flow, it is observed that the local water phase velocities increase up to 3.7 m/s. As indicated by the local void fraction results, air bubbles are trapped between the accelerating liquid phase and the inner wall of the pipe in the downward flow. Consequently, Figure 4 and Figure 5 demonstrate that the water phase is accelerated, particularly in the 200 mm straight section of the downward flow, as the trapped air restricts the cross-sectional area of the pipe. Investigation into the local velocity of the air phase in the downward direction reveals a stagnation point in the pipe sections of the inner radius where air is trapped, while in the pipe sections of the outer radius, a few bubbles can be seen drifting with the flowing water. Additionally, turbulent flow is noticed at the very end of the U-bend.
While the average cross-sectional velocity increases in the vertical upward segment due to the influence of buoyancy forces on the bubbles, the average velocities decrease in the 180-degree U-bend section due to bubble breakup from chord form and their migration towards the central section. In the last elbow, U-bend-4, the bubble velocities were notably reduced to below 2.0 m/s across the majority of the cross-section.

3.3. Validation of the Results

The computational results of the developed model are validated by comparing the numerical results obtained for an airflow rate of 30 L/min with the experimental data. The controlled experiments were conducted at Istanbul Technical University Hydraulics Laboratory under precisely the same conditions as those described in the numerical setup. The experimental setup layout and equipment are presented in Figure 6, which is addressed more comprehensively in our other studies [10].
On the water side, represented in the blue color in Figure 6, a magnetic-type flow meter was utilized to monitor the water volumetric flow rate, maintained at 180 L/min as specified in Table 1. The accuracy of the device is estimated at 0.5% of the reading, with uncertainties up to ±0.48 and ±1.32 L/min [10]. On the other hand, for the air side, the volumetric airflow rate is measured by a rotameter with an accuracy of ±2.1 L/min and uncertainty levels ranging from ±2.12 to ±2.22 L/min.
In the experiments, the local void fractions at six predefined measuring points within the test section, as depicted in Figure 1, were measured using an advanced optical probe over an extended duration. The uncertainty level associated with the optical probe measurements is evaluated as ±7% [10]. Figure 7 illustrates the axial development of void fractions for the predefined measuring points, comparing experimental and numerical results.
The numerical data were obtained from the model by placing virtual probes at the same locations as the experimental measuring points. As depicted in the figures, the trends of the numerical and experimental results are similar, indicating good agreement between the two datasets.

4. Conclusions

Through our comprehensive investigation, this study provides valuable insights into the complex behavior of the air–water two-phase flow within a complete U-bend configuration, encompassing two horizontal-to-vertical 90-degree bends and one vertical 180-degree elbow. We were able to analyze the intricate interplay between drag and non-drag forces, shedding light on the dynamics of phase distribution and phase velocities within the U-bend by employing the Eulerian–Eulerian approach in our computational model. Our findings emphasize several key points:
  • The observed flow patterns, including the development of plug flow, the formation of Taylor bubbles with local annular flow, and the transition to churn flow, underscore the significant influence of bend geometry and airflow rates on multiphase flow behavior.
  • Bubbles form extended chords and elongated bubbles as plugs due to density variations in the upstream region. However, these chords break up upon entering the first vertical 90-degree bend, transitioning into single slugs or Taylor bubbles. This phenomenon is driven by the critical role of body forces and buoyancy effects on bubble interactions. Thus, employing interphase relations is significant in terms of computational accuracy.
  • In the downward vertical flow, local water phase velocities accelerate, influenced by body forces. Taylor bubbles get trapped between the accelerating liquid phase and the inner wall, leading to significant air accumulation and a detected void fraction of 85% in the inner cross-section of the wall. However, it is found that the gas phase accumulation effect can be reduced by increasing the airflow rate. It may be worthwhile to consider increasing the flow rate of the gas phase to avoid air accumulations for practical applications, including such U-bends.
  • A turbulence effect, leading to a local transition to churn flow, is observed after the last elbow, driven by increased water velocity impacting the bottom of the wall and the centrifugal effect of the elbow. However, bubble clustering reoccurs in the upper section, resembling plugs, and turbulence effects diminish in the downstream section.
  • The Eulerian–Eulerian approach (separated flow theory) yields reasonable results to predict the flow characteristics of air–water flow in elbows, as appropriate sub-models for phase interactions are employed.
The results presented in this study provide implications for future applications and assist further studies that can address the findings for different piping systems and elbows commonly used in practical applications in the industry under various design conditions. The validation of our numerical model against the experimental data reaffirms its reliability and applicability in practical engineering scenarios. Further investigations will aim to explore pressure-drop relations to extend this advanced multiphase flow research in such complex geometries.

Author Contributions

Methodology, E.K. and N.E.; supervision, N.E.; software, E.K.; validation, E.K.; formal analysis, E.K. and N.E.; investigation, E.K. and N.E.; resources, E.K. and N.E.; data curation, E.K. and N.E.; writing—original draft preparation, E.K.; writing—review and editing, E.K. and N.E.; visualization, E.K. All authors have read and agreed to the published version of the manuscript.

Funding

This paper is produced based on the Ph.D. dissertation and supported by the Research Fund of the Istanbul Technical University under project number: 42451.

Data Availability Statement

The data presented in this study are available on reasonable requests from the corresponding author.

Conflicts of Interest

The authors declare no conflicts of interest.

References

  1. Miwa, S.; Hibiki, T. Inverted Annular Two-Phase Flow in Multiphase Flow Systems. Int. J. Heat Mass Transf. 2022, 186, 122340. [Google Scholar] [CrossRef]
  2. Khasawneh, K.; Moon, J.; Ko, Y.; Jeong, J.J.; Yun, B. Experimental Study on Local Droplet Parameters in a Deformed 2 × 2 Rod Bundle under Air-Water Annular-Mist Flow. Int. J. Multiph. Flow 2023, 160, 104374. [Google Scholar] [CrossRef]
  3. Li, C.; Zhu, Y.; Wang, J.; Liu, W.; Fang, L.; Zhao, N. Mass Flow Rate Measurement of Gas-Liquid Two-Phase Flow Using Acoustic-Optical-Venturi Mutisensors. Flow Meas. Instrum. 2023, 90, 102314. [Google Scholar] [CrossRef]
  4. Figueiredo, M.M.F.; Goncalves, J.L.; Nakashima, A.M.V.; Fileti, A.M.F.; Carvalho, R.D.M. The Use of an Ultrasonic Technique and Neural Networks for Identification of the Flow Pattern and Measurement of the Gas Volume Fraction in Multiphase Flows. Exp. Therm. Fluid Sci. 2016, 70, 29–50. [Google Scholar] [CrossRef]
  5. Hansen, L.S.; Pedersen, S.; Durdevic, P. Multi-Phase Flow Metering in Offshore Oil and Gas Transportation Pipelines: Trends and Perspectives. Sensors 2019, 19, 2184. [Google Scholar] [CrossRef]
  6. Dollet, B.; Marmottant, P.; Garbin, V. Bubble Dynamics in Soft and Biological Matter. Annu. Rev. Fluid Mech. 2019, 51, 331–355. [Google Scholar] [CrossRef]
  7. Xu, Y.; Wang, L.; Wang, Y.; Qian, Y.; Wang, H.; Xu, Y.; Yang, X. Gas-Liquid Flow Pattern Identification and Bubble Characteristics Analysis in a Static Mixer Based HiPOxTM Reactor. Chem. Eng. Sci. 2023, 267, 118269. [Google Scholar] [CrossRef]
  8. Başaran, A. Experimental Investigation of R600a as a Low GWP Substitute to R134a in the Closed-Loop Two-Phase Thermosyphon of the Mini Thermoelectric Refrigerator. Appl. Therm. Eng. 2022, 211, 11850. [Google Scholar] [CrossRef]
  9. Zade, S.; Costa, P.; Fornari, W.; Lundell, F.; Brandt, L. Experimental Investigation of Turbulent Suspensions of Spherical Particles in a Square Duct. J. Fluid Mech. 2018, 857, 748–783. [Google Scholar] [CrossRef]
  10. Kükrer, E.; Eskin, N. Experimental Assessment of Local Void Fraction and Flow Development in a U-Bend Piping System for Air-Water Two-Phase Flow. Int. J. Multiph. Flow 2023, 169, 104610. [Google Scholar] [CrossRef]
  11. Cao, Z.; Zhang, H.; Mei, H.; Yan, G.; Chu, W.; Wang, Q. Numerical Study on R32 Flow Condensation in Horizontally Oriented Tubes with U-Bends. Energies 2022, 15, 4799. [Google Scholar] [CrossRef]
  12. Croquer, S.; Vieiro, J.; Chacon, C.; Asuaje, M. CFD Multi-Phase Flow Analysis Across Diverging Manifolds: Application in the Oil-Gas Industry. In Proceedings of the ASME 2014 International Mechanical Engineering Congress and Exposition, Montreal, QC, Canada, 14–20 November 2014; ASME: Montreal, QC, Canada, 2014. [Google Scholar]
  13. Vist, S.; Pettersen, J. Two-Phase Flow Distribution in Compact Heat Exchanger Manifolds. Exp. Therm. Fluid Sci. 2004, 28, 209–215. [Google Scholar] [CrossRef]
  14. Dong, W.; Yao, L.; Luo, W. Numerical Simulation of Flow Field of Submerged Angular Cavitation Nozzle. Appl. Sci. 2023, 13, 613. [Google Scholar] [CrossRef]
  15. Deniz, E.; Eskin, N. Hydrodynamic Characteristics of Two-Phase Flow through Horizontal Pipe Having Smooth Expansion. J. Therm. Sci. Technol. 2015, 35, 1–9. [Google Scholar]
  16. Zahedi, R.; Babaee Rad, A. Numerical and Experimental Simulation of Gas-Liquid Two-Phase Flow in 90-Degree Elbow. Alexandria Eng. J. 2021, 61, 2536–2550. [Google Scholar] [CrossRef]
  17. Kim, S.; Park, J.H.; Kojasoy, G.; Kelly, J.M.; Marshall, S.O. Geometric Effects of 90-Degree Elbow in the Development of Interfacial Structures in Horizontal Bubbly Flow. Nucl. Eng. Des. 2007, 237, 2105–2113. [Google Scholar] [CrossRef]
  18. Dutta, P.; Saha, S.K.; Nandi, N.; Pal, N. Numerical Study on Flow Separation in 90° Pipe Bend under High Reynolds Number by K-ε Modelling. Eng. Sci. Technol. Int. J. 2016, 19, 904–910. [Google Scholar] [CrossRef]
  19. Mazumder, Q.H.; Siddique, S.A. CFD Analysis of Two-Phase Flow Characteristics in a 90 Degree Elbow. J. Comput. Multiph. Flows 2011, 3, 165–175. [Google Scholar] [CrossRef]
  20. Aung, N.Z.; Yuwono, T. Computational Fluid Dynamics Simulations of Gas-Liquid Two-Phase Flow Characteristics through a Vertical to Horizontal Right Angled Elbow. ASEAN J. Sci. Technol. Dev. 2013, 30, 1–16. [Google Scholar] [CrossRef]
  21. Abhari, M.N.; Ghodsian, M.; Vaghefi, M.; Panahpur, N. Experimental and Numerical Simulation of Flow in a 90° bend. Flow Meas. Instrum. 2010, 21, 292–298. [Google Scholar] [CrossRef]
  22. Qiao, S.; Zhong, W.; Wang, S.; Sun, L.; Tan, S. Numerical Simulation of Single and Two-Phase Flow across 90° Vertical Elbows. Chem. Eng. Sci. 2021, 230, 116185. [Google Scholar] [CrossRef]
  23. Sharma, M.; Ravi, P.; Ghosh, S.; Das, G.; Das, P.K. Hydrodynamics of Lube Oil-Water Flow through 180° Return Bends. Chem. Eng. Sci. 2011, 66, 4468–4476. [Google Scholar] [CrossRef]
  24. El-Behery, S.M.; Hamed, M.H.; El-Kadi, M.A.; Ibrahim, K.A. CFD Prediction of Air-Solid Flow in 180° Curved Duct. Powder Technol. 2009, 191, 130–142. [Google Scholar] [CrossRef]
  25. De Oliveira, P.M.; Barbosa, J.R. Pressure Drop and Gas Holdup in Air-Water Flow in 180° Return Bends. Int. J. Multiph. Flow 2014, 61, 83–93. [Google Scholar] [CrossRef]
  26. Dhanasekaran, T.S.; Wang, T. Numerical Model Validation and Prediction of Mist/Steam Cooling in a 180-Degree Bend Tube. Int. J. Heat Mass Transf. 2012, 55, 3818–3828. [Google Scholar] [CrossRef]
  27. Domanski, P.A.; Hermes, C.J.L. An Improved Correlation for Two-Phase Pressure Drop of R-22 and R-410A in 180° Return Bends. Appl. Therm. Eng. 2008, 28, 793–800. [Google Scholar] [CrossRef]
  28. Aliyu, A.M.; Almabrok, A.A.; Baba, Y.D.; Lao, L.; Yeung, H.; Kim, K.C. Upward Gas–Liquid Two-Phase Flow after a U-Bend in a Large-Diameter Serpentine Pipe. Int. J. Heat Mass Transf. 2017, 108, 784–800. [Google Scholar] [CrossRef]
  29. Kükrer, E.; Eskin, N. Transient Computational Fluid Dynamics Modeling of Air-Water Two-Phase Flow for Elbows. In Lecture Notes in Mechanical Engineering; Springer: Berlin/Heidelberg, Germany, 2024. [Google Scholar]
  30. Kükrer, E. Analysis of Non-Boiling Gas-Liquid Two-Phase Flow through Flow Components: Experimental Investigation and Numerical Modelling; Istanbul Technical University (ITU): Istanbul, Turkey, 2023. [Google Scholar]
  31. Almabrok, A.A.; Aliyu, A.M.; Baba, Y.D.; Lao, L.; Yeung, H. Void Fraction Development in Gas-Liquid Flow after a U-Bend in a Vertically Upwards Serpentine-Configuration Large-Diameter Pipe. Heat Mass Transf. 2018, 54, 209–226. [Google Scholar] [CrossRef]
  32. Dassler, C.; Janoske, U. Experimental Investigation of Single- and Two-Phase Pressure Drop in Slender Rectangular 180° Return Bends. Exp. Therm. Fluid Sci. 2019, 103, 126–132. [Google Scholar] [CrossRef]
  33. Antepara, O.; Balcázar, N.; Oliva, A. Tetrahedral Adaptive Mesh Refinement for Two-Phase Flows Using Conservative Level-Set Method. Int. J. Numer. Methods Fluids 2021, 93, 481–503. [Google Scholar] [CrossRef]
  34. Kunii, D.; Levenspiel, O. Fluidization Engineering, 2nd ed.; Butterworth–Heinemann: Oxford, UK, 1991; ISBN 978-0-08-050664-7. [Google Scholar]
  35. Benim, A.C.; Deniz Canal, C.; Boke, Y.E. Computational Investigation of Oxy-Combustion of Pulverized Coal and Biomass in a Swirl Burner. Energy 2022, 238, 121852. [Google Scholar] [CrossRef]
  36. Wu, Y.; Liu, D.; Ma, J.; Chen, X. Three-Dimensional Eulerian–Eulerian Simulation of Coal Combustion under Air Atmosphere in a Circulating Fluidized Bed Combustor. Energy Fuels 2017, 31, 7952–7966. [Google Scholar] [CrossRef]
  37. Tomiyama, A. Struggle with Computational Bubble Dynamics. Multiph. Sci. Technol. 1998, 10, 369–405. [Google Scholar] [CrossRef]
  38. Hosokawa, S.; Tomiyama, A.; Misaki, S.; Hamada, T. Lateral Migration of Single Bubbles Due to the Presence of Wall. In Proceedings of the American Society of Mechanical Engineers, Fluids Engineering Division, Montreal, QC, Canada, 14–18 July 2002; FED: Montreal, QC, Canada, 2002; Volume 257. [Google Scholar]
  39. Drew, D.; Cheng, L.; Lahey, R.T. The Analysis of Virtual Mass Effects in Two-Phase Flow. Int. J. Multiph. Flow 1979, 5, 233–242. [Google Scholar] [CrossRef]
  40. Lopez de Bertodano, M.A. Two Fluid Model for Two-Phase Turbulent Jets. Nucl. Eng. Des. 1998, 179, 65–74. [Google Scholar] [CrossRef]
  41. Wang, W.; Sun, Y.; Wang, B.; Dong, M.; Chen, Y. CFD-Based Erosion and Corrosion Modeling of a Pipeline with CO2-Containing Gas–Water Two-Phase Flow. Energies 2022, 15, 1694. [Google Scholar] [CrossRef]
Figure 1. Constructed solid model with detailed U-bend system geometry.
Computation 12 00081 g001
Figure 2. The mesh structure of the (a) injector and (b) bend sections.
Computation 12 00081 g002
Figure 3. Volume rendered local void fractions of U-bend for (a) 30 L/min, (b) 35 L/min, and (c) 40 L/min airflow rates.
Computation 12 00081 g003
Figure 4. Volume rendered local water phase velocities in U-bend for (a) 30 L/min, (b) 35 L/min, and (c) 40 L/min airflow rates.
Computation 12 00081 g004
Figure 5. Volume rendered local air phase velocities in U-bend for (a) 30 L/min, (b) 35 L/min, and (c) 40 L/min airflow rates.
Computation 12 00081 g005
Figure 6. Experimental setup layout.
Computation 12 00081 g006
Figure 7. Validation of numerical results with experimental results.
Computation 12 00081 g007
Table 1. Design parameters for water phase.
DefinitionSymbol Unit
Densityρw997.3kg/m3
Dynamic viscosityμw0.0009107kg/m·s
Volumetric flow rate Q ˙ w 180L/min
Mass flux rateGw2380.9kg/m2s
Superficial velocityjw2.4m/s
Table 2. Design parameters for air phase.
DefinitionSymbol Unit
Densityρa1.196kg/m3
Dynamic viscosityμa0.0000183kg/m·s
Volumetric flow rate Q ˙ a 30; 35; 40L/min
Mass flux rateGa0.479; 0.559; 0.639kg/m2s
Superficial velocityja0.622; 0.725; 0.829m/s
Disclaimer/Publisher’s Note: The statements, opinions and data contained in all publications are solely those of the individual author(s) and contributor(s) and not of MDPI and/or the editor(s). MDPI and/or the editor(s) disclaim responsibility for any injury to people or property resulting from any ideas, methods, instructions or products referred to in the content.

