Abstract
Early detection of plant nutrient deficiency is crucial for agricultural productivity. This study investigated the performance and interpretability of Convolutional Neural Networks (CNNs) for this task. Using the rice and banana datasets, we compared three CNN architectures (CNN, VGG-16, Inception-V3). Inception-V3 achieved the highest accuracy (93% for rice and banana), but simpler models such as VGG-16 might be easier to understand. To address this trade-off, we employed Explainable AI (XAI) techniques (SHAP and Grad-CAM) to gain insights into model decision-making. This study emphasises the importance of both accuracy and interpretability in agricultural AI and demonstrates the value of XAI for building trust in these models.
1. Introduction
As the global population continues to grow, being projected to reach 8.5 billion according to a 2030 report by The United Nations Food and Agriculture Organization (FAO) projects [1], ensuring food security becomes a pressing challenge. Effective farming techniques, including the timely identification of plant nutrient deficiencies, play a crucial role in preventing crop diseases and significant financial losses [2]. Crop yields can be significantly impacted by factors such as temperature, nutrients, water, and other environmental factors [3]. A plant’s lifecycle is greatly influenced by nutrients, which play a crucial role in determining factors such as plant quality and productivity. The authors in [4] state that plants require seventeen vital mineral elements to complete their lifecycle.
In general, macronutrients such as Magnesium (Mg), Phosphorus (P), and Nitrogen (N) are required in higher concentrations than micronutrients such as Manganese (Mn) and Zinc (Zn) [5]. Nitrogen (N), a key nutrient, not only speeds up crop growth but also improves the quality of crops [6]. Plants facing abiotic stresses such as heat, salinity, drought, and waterlogging benefit from adequate phosphorus, as it plays a critical role in regulating their physiological responses. However, the lack of such nutrients harms the plant, leading to yield loss for farmers [7]. According to [8], the conventional methods that rely on visual inspection by agriculture specialists for plant nutrient deficiency identification are time-consuming and labour-intensive. The agriculture industry has increasingly adopted machine learning (ML) and Artificial Intelligence (AI) to enhance the efficiency and accuracy of plant health diagnosis. Moreover, [9] states that because of its enormous economic potential, the use of deep learning (DL) in agriculture encompasses the identification of plant diseases, managing crops, and predicting crop yield. According to [10], the effectiveness of DL, particularly Convolutional Neural Networks (CNN), has undoubtedly revolutionised our ability to classify images. CNN has a distinct edge because it can learn from the local and global features of the input image through training. In the field of computer vision (CV), CNNs excel at various tasks, such as object detection, image classification, and image segmentation [11]. This includes detecting plant diseases, predicting crop yields, plant classification, and precision farming [12,13,14,15].
Ref. [16] stated that CNN surpasses conventional ML algorithms in carrying out thorough image classification. Because CNNs learn from end to end, they are effective tools for learning from a vast body of visual data. However, the learning strategy renders CNNs as a “black box” which is challenging for humans to understand. Additionally, they do not explain how they came to their predictions. Their lack of interpretability hinders their practical application in the field. In response to the nature of “black box” models, Explainable Artificial Intelligence (XAI) has become a topic of interest. According to [17], XAI helps to visualise, explain, and interpret the inner workings of DL or ML models. XAI methods aid in increasing the ML model’s transparency and trustworthiness. In this study, we conducted experiments using two publicly available plant nutrient deficiency image datasets and analysed the performance and interpretability of three CNN-based architectures.
The contributions of this paper are the following:
- Compared to previous studies, it presents an integrated approach that considers both the performance and explainability of CNN architectures when used for plant nutrient deficiency identification.
- As a first attempt, it focuses on comparing the explainability of two prominent XAI techniques, GRAD-CAM, and Shapley Additive exPlanations (SHAP) when used for plant nutrient deficiency identification.
The structure of the remaining parts of this paper is described as follows. Section 2 provides an overview of relevant theoretical aspects and a review of related work on CNN-based approaches that have been used for plant nutrient deficiency identification. Section 3 describes the methodology of this study, while Section 4 presents the results obtained from experiments with the three CNN-based architectures. The discussion of results is presented in Section 5, while the paper is concluded in Section 6 with a summary, and our perspective on the future investigation.
2. Background and Related Work
In this section, we present a theoretical background to the study by touching on the aspects of plant nutrient deficiency, the selected CNN architectures, and Explainable AI methods.
2.1. Plant Nutrient Deficiency
According to [18], nutrient deficiencies occur when an important nutrient is not present in sufficient quantities to meet the needs of growing plants. For instance, insufficient Nitrogen (N) in plants can have several detrimental effects on their growth and development [19]. Similarly, the lack of Phosphorus (P) is another nutritional factor that limits agricultural production worldwide [20]. These deficiencies can arise from various factors such as soil conditions, inadequate fertilisation, soil pH, and other environmental conditions [21,22,23,24]. If the soil’s acidity or alkalinity is off balance (pH) plants cannot absorb the nutrients they need, which hurts their growth [25]. Additionally, improper fertilisation practices, either under-application or imbalanced nutrient rations, can lead to deficiencies [21]. The most important step in diagnosing a nutria deficiency is identifying the location and pattern of the symptoms on the plant. This is because different deficiencies often manifest in different ways. For example, chlorosis, a condition characterised by the yellowing of leaf tissue due to the lack of chlorophyll, often affects plants that lack Nitrogen, Sulfur, or copper (Cu) [26]. Similarly, a deficiency in Phosphorus, Potassium, or Boron can cause dead plant tissue, a condition known as necrosis, which appears as brown spots on the tips or between the veins of leaves [26].
In [27], the authors state that there are three methods of analysing deficiencies: visual observation, plant analysis, and soil analysis. Using information from the leaf, the agriculturist primarily assesses the state of the plant’s nutrition. The human eye often cannot detect these nutrient deficiencies until the plant has already suffered damage. Because of this, technology development is essential to help farmers and crop specialists spot these shortcomings at an early stage.
2.2. Convolutional Neural Network
CNN is one of the various DL algorithms and is a unique form of a multilayer neural network [28]. The algorithm is among the most important ones in computer vision. According to Wang [29], the three concepts that make up CNN architectures are local receptive field, shared weights, and spatial subsampling. CNNs recognise visual patterns from images with minimal processing. When it comes to different visual problems, CNN has been utilised successfully [30]. CNN is composed of distinct layers such as convolutional, pooling, and fully connected layers [31]. The most important element is the convolutional layer. Convolution is used to condense images into a format that is simpler for the computer to handle while simultaneously ensuring that no essential elements are lost for accurate prediction. A significant benefit of incorporating pooling layers in a CNN is that they aid in lowering the network’s computational complexity.
2.3. VGG16 Architecture
Simonyan and Zisserman from Oxford University proposed the use of VGGNet [32]. Even though VGGNet came in second place instead of winning, it was the runner-up in the classification task of the ILSVRC (ImageNet Large Scale Visual Recognition Competition) in 2014. The model attained an accuracy of 92.7% in the top-five test by utilising ImageNet. It is one of the popular CNN architectures because it uses small-sized filters [28]. This type of model is known for being easy to use and highly effective. It consists of 13 convolutional layers with a filter size of 3 × 3, 3 dense layers with 4096 neurons in each layer, and five pooling layers. According to Khan et al. [33], it is advantageous to increase the depth of neural networks to enhance the network’s final performance. To decrease the spatial dimension, each convolution is followed by a rectified linear unit (ReLU) action, and each block is finished with a max pooling operation [34]. Nevertheless, the model comes with a disadvantage in that it requires a greater expense for evaluation and a substantial amount of memory and parameters [34].
2.4. Inception-V3 Architecture
The InceptionV3 architecture is a CNN with several layers that were trained on ImageNet by Google researchers. Its introduction was made through a paper published by Szegedy et al. [35] called “Rethinking the Inception Architecture for Computer Vision”. The InceptionV3 model is built upon the Inception architecture, which was developed to address the issue of the increasing depth of CNNs leading to higher computational cost and decreased efficiency [36]. The Inception architecture introduces the concept of modules, which are collections of convolutional and pooling layers that operate on different scales and at different resolutions [33]. This allows the model to learn features at multiple scales, reducing the number of parameters and computational costs while improving performance.
2.5. Explainable Artificial Intelligence
Understanding how AI approaches are used to provide such outcomes is necessary when decisions made automatically have an impact on people [37]. Explainable AI is a method and technique that provides humans with understandable results/output that they can trust [38]. The black-box nature of the algorithm has highlighted the need for explainable AI. The various types of explanation models include global methods, local methods, and introspective methods. Global methods help in understating how a model makes decisions for the overall structure. Additionally, we can explain the model’s entire behaviour. Local techniques, on the other hand, aid in comprehending how the model makes decisions for a particular instance.
2.5.1. Shapley Additive exPlanations (SHAP)
SHAP uses a feature-relevant explanation approach. An ML model may be understood and explained using it. There are various advanced ML techniques, specifically DL architectures, which possess the unique characteristics of being opaque. The foundation of SHAP values is Shapley values, a notion borrowed from [39] game theory. Shapley values are utilised by SHAP to provide an interpretation and provide an explanation for any given ML model [40].
Additionally, Lundberg and Lee [41] demonstrated that Shapley values are the only approach to determine the relevance of a feature while preserving two crucial characteristics, local accuracy, and consistency.
- Local accuracy: at a minimum, the explanation model must reproduce the results of the original model [42]
- Consistency: Regardless of other features, the significance of a feature should not decrease if we change a model so that it depends more on that feature [42].
Let and denote setting
For any two models and , if
For all inputs , then [41].
2.5.2. Gradient-Weighted Class Activation Mapping (Grad-CAM)
To enhance the transparency of decisions made by CNN-based models, Selvaraju [43] introduced a method called Gradient-weighted Class Activation Mapping (Grad-CAM) for presenting a “visual explanations” heatmap to understand the decisions made by these models. The fundamental motivation for the creation of Grad-CAM is to leverage the information contained in the convolutional layer to identify the significant parts of image classification. According to Panesar [44], Grad-CAM combines feature maps using gradients such that the original network does not need to be changed. This method highlights the areas of the input image that the model focuses on during the classification process.
2.6. Related Work
Previously, some attempts that focus on the identification of plant nutrient deficiency using CNN have been reported in the literature. We present the most recent approaches as follows. Xu et al. [45] examined the precision of various DCNNs in identifying nutrient insufficiencies in rice and attained a 97.44% accuracy rate. Another vision-based monitoring system was proposed by Tran et al. [46], who carried out research that involved the comparison of two deep CNN models regarding their capability to predict and categorise three nutrient deficiencies. The accuracy of Inception-ResNet v2 and Autoencoder reached 87.273% and 79.091%, respectively, with the validity of the ensemble averaging being 91%. Talukder and Sarkar [5] suggested a Deep Ensemble CNN for detecting nutrient deficiency in rice. They also employed pre-trained models such as InceptionV3. The model they proposed accomplished an accurate rate of 98.33%. Ibrahim et al. [47] used CNN for palm leaf nutrient deficiency. The dataset utilised by the study consists of 350 photos of healthy leaves with different forms of palm leaf nutrient deficiencies. A confusion matrix was employed to assess performance. The overall mean percentages were 94.29% for accuracy, 80% for sensitivity, and 96.67% for specification.
To evaluate the nitrogen content of wheat, ref. [40] suggested using machine learning and XAI. Six ML regression models were utilised by the author to forecast the nitrogen of wheat. The gradient-boosting regression and random forest combination outperformed the (R2 > 0.85) previous combinations. To provide local and global explanations, SHAP values were used.
Compared to previous studies, our study provides a more comprehensive analysis of plant nutrient deficiency by looking at two different plants (Rice and Banana) instead of one. Additionally, most of the previous research assesses the accuracy of the DL models, but they do not consider the explainability of the models as highlighted in Table 1. Therefore, an integrated approach that considers both performance and explainability is lacking in the existing body of work. This study seeks to fill the gap by comparing the explainability of two prominent XAI techniques: GRAD-CAM and SHAP.

Table 1.
Summary of related work.
3. Methods
An overview of the framework used in this study is presented in Figure 1. It comprises two major phases: data preprocessing and the implementation of the interpretable DL models. The subsequent subsections delve into the specifics of each of these stages.
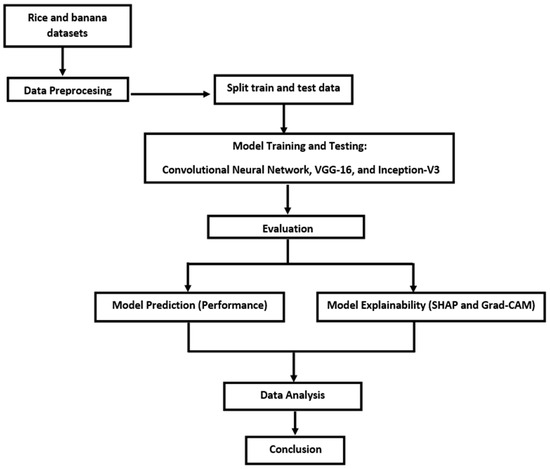
Figure 1.
A general framework of the study.
3.1. Data Acquisition
For this study, two datasets were used. The rice dataset containing 1156 images of rice was collected from Kaggle [48]. The dataset contains three distinct types of nutrient deficiency, Potassium (K), Nitrogen (N), and Phosphorus (P). The images have a resolution of 500 × 375 pixels. The second dataset (banana dataset) is available in [49], and consists of various banana types, including Robusta, Poovan, and Monthan. The dataset contains three classes: calcium, iron, and healthy leaves. The images have a resolution of 256 × 256, and the background was set to black so that ML algorithms obtained uniform images to train the model.
3.2. Image Pre-Processing
Images need to be pre-processed before being used for model training and testing [50]. Images may be pre-processed using a variety of images, for example, scaling images, making them grayscale, and enhancing images. To perform pre-processing, we used a technique called data augmentation. According to [50], data augmentation is a method utilised in ML to enlarge the training dataset’s volume by implementing different modifications to the original images. This includes a function for random cropping, which takes a random section of the image and resizes it to the specified size. All images are resized to a uniform size (150 × 150). Another function was used to apply random rotations to the image, ranging from −20 to 20 degrees. This helps the model learn features that are robust to slight variations in the orientation of the objects. Additionally, images are randomly flipped horizontally. This helps the model learn features that are independent of the object’s orientation on the left or right side of the image.
3.3. Data Training
For this study, Python (version 3.9.19) on Google Collab was used to perform the experimentation. The following is a discussion of the software environment, which comprises frameworks and the main Python libraries that we employed in the experimental process including TensorFlow, Pandas, and NumPy.
Model Architectures
The study implemented three well-known DL models, namely a baseline CNN and two pre-trained models, for the identification of plant disease and nutrient deficiency. Table 2 contains the parameter settings. During training, the models were trained using 32 batch sizes, and the number of epochs used was 30. The learning process was initiated with an initial learning rate of 0.001 and the Adam optimiser was utilised for efficient weight updates. The models were trained using the categorical cross-entropy loss function, which is well-suited for multi-class classification tasks. Two callbacks were used in the model’s training and validation processes. Monitoring the validation loss and decreasing the learning rate by a factor of 0.5 were carried out using the first callback. A categorical cross-entropy loss was used, which measures the difference between the predicted probability distribution and the true labels for multi-class classification problems. To stop early, a second callback was used. Both callbacks were applied to prevent the model from over-fitting.
Table 2.
Parameter settings used for training.
3.4. Evaluation Metrics
The evaluation of the performance of the CNN models was carried out by using standard metrics for classification: accuracy, precision, recall, and F1 score, which are defined by [16] in terms of the number of fp—false positives; tp—true positives; tn—true negatives; and fn—false negatives as follows:
Accuracy = (TP + TN)/(P + N)
Precision = TP/(TP + FP)
Recall = TP/(TP + FN)
F1-Score = 2 × (Precision × Recall)/(Precision + Recall))
4. Results
The section analyses the performance of three image classification models on two separate datasets (rice and banana). Table 3 shows that all three models achieved strong performance on the rice dataset, with similar scores across all metrics. Inception-V3 and VGG-16 achieved the highest scores, reaching 93% accuracy for all evaluation categories. The trend of Inception-V3 dominance continued with the banana dataset. It achieved the highest scores (92%) in all evaluation metrics. VGG-16 (82%) outperformed the CNN model (68%), suggesting its potential as an alternative choice. Figure 2 shows that, across all datasets, Inception-V3 consistently achieved the best performance, solidifying its superiority for image classification tasks on these specific datasets. VGG-16 presented itself as a competitive alternative, particularly for the rice dataset. The CNN model, while functional, yielded the lowest scores in all categories. Based on the results, Inception-V3 stands out as the most effective model for image classification tasks across the rice and banana datasets, as shown in Figure 2. Its consistently high performance in accuracy, precision, recall, and F1-score suggests its suitability for these specific image classification problems. While VGG-16 presents a viable alternative, further investigation might be necessary depending on the specific application and dataset characteristics.
Table 3.
Model performance across all datasets.
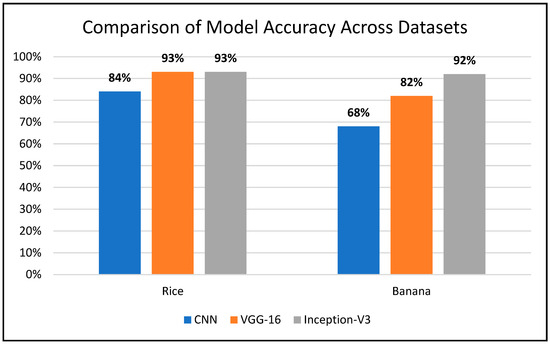
Figure 2.
Comparison of model accuracy across datasets.
4.1. Confusion Matrix
A helpful instrument for assessing the effectiveness of ML models is the confusion matrix. It provides a detailed breakdown of how many instances were classified correctly or incorrectly for each class.
4.1.1. Rice Dataset
The confusion matrix for the three models when applied to the rice dataset is shown in Table 4. The confusion matrix for the CNN model shows that it predicted Nitrogen correctly 75 times, while incorrectly predicting Phosphorus 7 times and Potassium 6 times. Similarly, the model predicted Phosphorus correctly 59 times but incorrectly predicted Nitrogen 6 times and Potassium 13 times. The model’s accuracy rate was 84% in total. The VGG-16 model showed a higher accuracy compared to the CNN model. It correctly predicted Nitrogen 84 times, Phosphorus 57 times, and Potassium 74 times. The model’s accuracy rate was 93% in total. The overall accuracy of the Inception-V3 model was 93%, as indicated by its confusion matrix. The model correctly predicted Nitrogen 94 times, Phosphorus 56 times, and Potassium 66 times.
Table 4.
Confusion matrix for the rice dataset.
4.1.2. Banana Dataset
The corresponding confusion matrix outputs for each model are depicted in Table 5. Overall, all three models performed well on the banana dataset, as indicated by the relatively high number of correct predictions compared to misclassifications.
Table 5.
Confusion matrix for the banana dataset.
4.2. Model Explanation Using SHAP
Notwithstanding the good accuracy scores of the three models, there exists a lack of transparency in these models. To explain any ML model, there are a few generalised XAI methods. For this study, two XAI algorithms, SHAP and Grad-CAM, were used. In this section, we explain the SHAP output of the three models when applied to two different datasets.
4.2.1. Analysing Explainability of ML Models Using SHAP-Rice Dataset
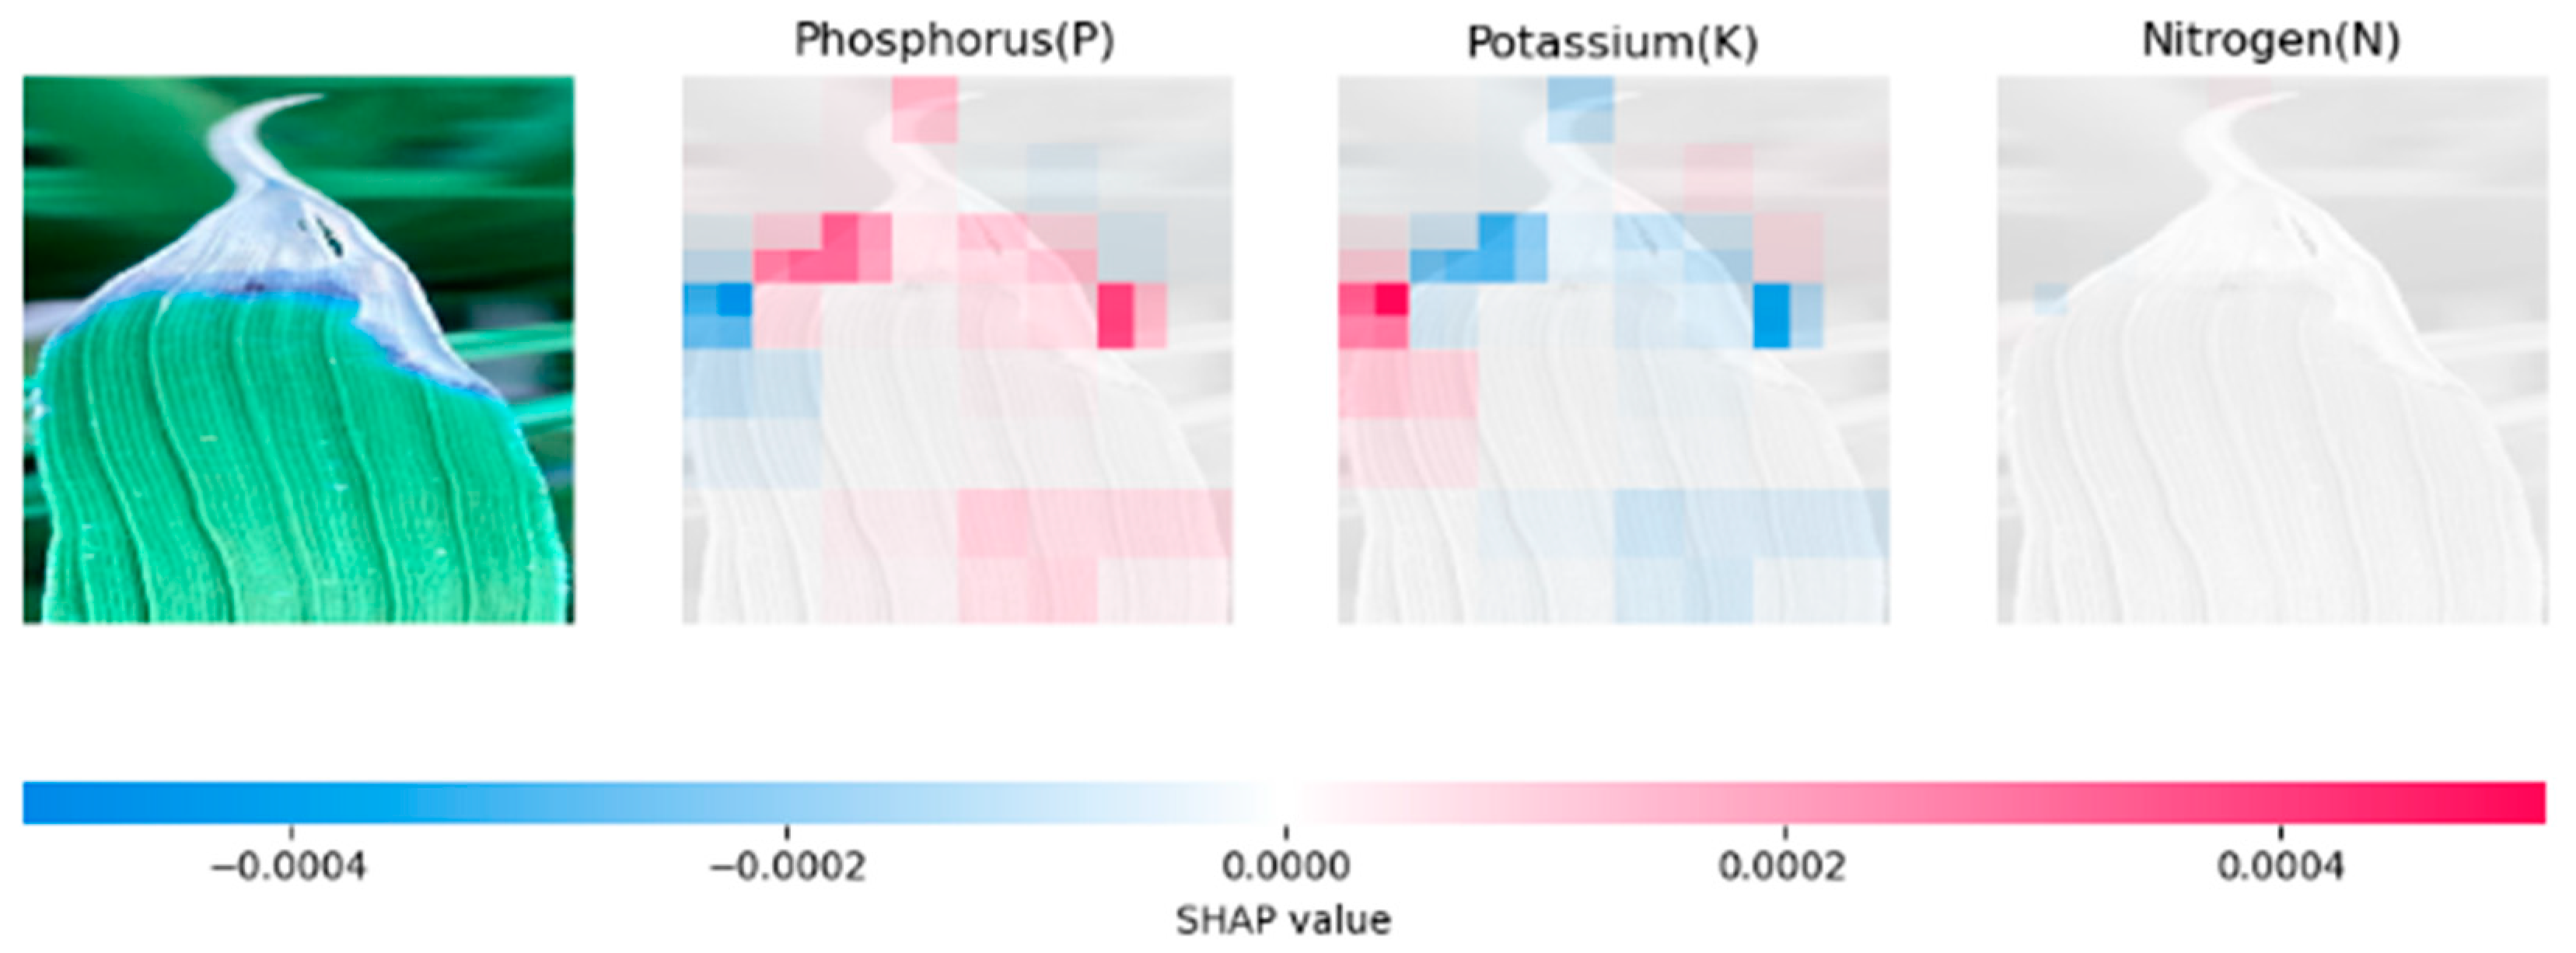
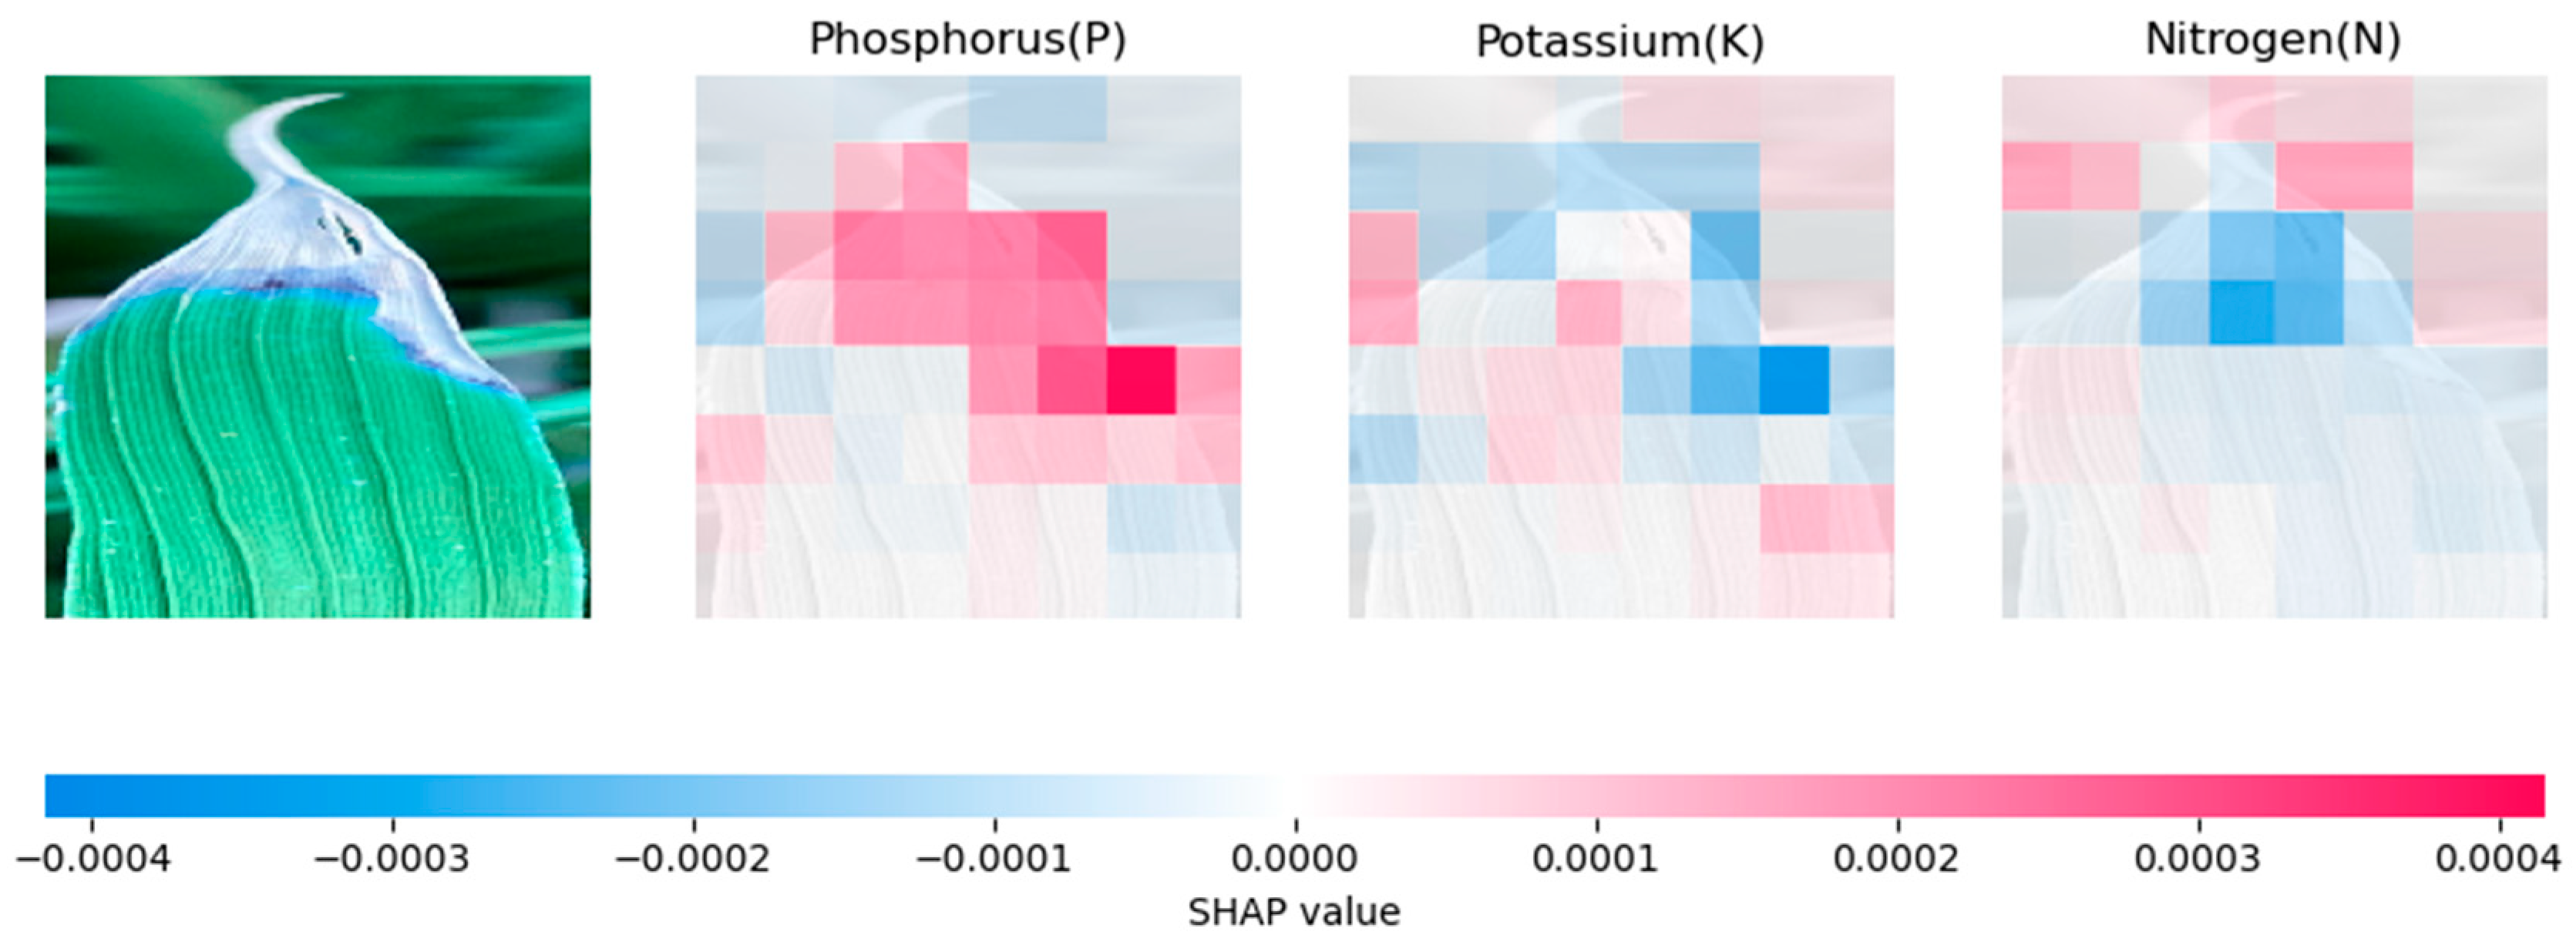
The input image is displayed on the left in Figure 3, with the SHAP output of the CNN model being highlighted in red and blue pixels. Red tones show positive contributions and blue tones to negative contributions to the prediction of this category. The model displays the three categories that it deems to be associated with the image. The probability of phosphorus prediction is shown to increase in the first explanation image through the display of a red tone. The explanations for nitrogen and potassium contain fewer red colours. Overall, the figure suggests that the CNN model relies heavily on a few prominent features to make its predictions. Figure 4 shows the SHAP output of the VGG-16 model. This model also appears to rely on a limited set of notable features, similar to the CNN model. However, the contribution of each feature is more evenly distributed, with fewer features having an extremely positive or negative contribution. The SHAP output of the Inception-V3 model is displayed in Figure 5. Inception-V3 appeared to be more reliant on a broader set of features than CNN, with many features making a significant positive or negative contribution to the final prediction.

Figure 3.
CNN (rice) SHAP output.
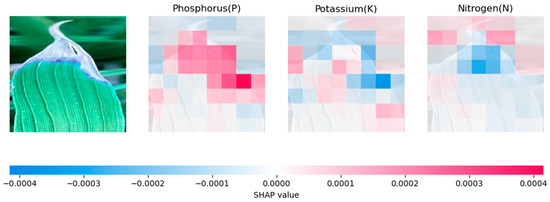
Figure 4.
VGG-16 (rice) SHAP output.
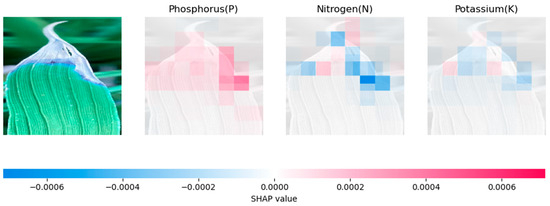
Figure 5.
Inception-V3 (rice) SHAP output.
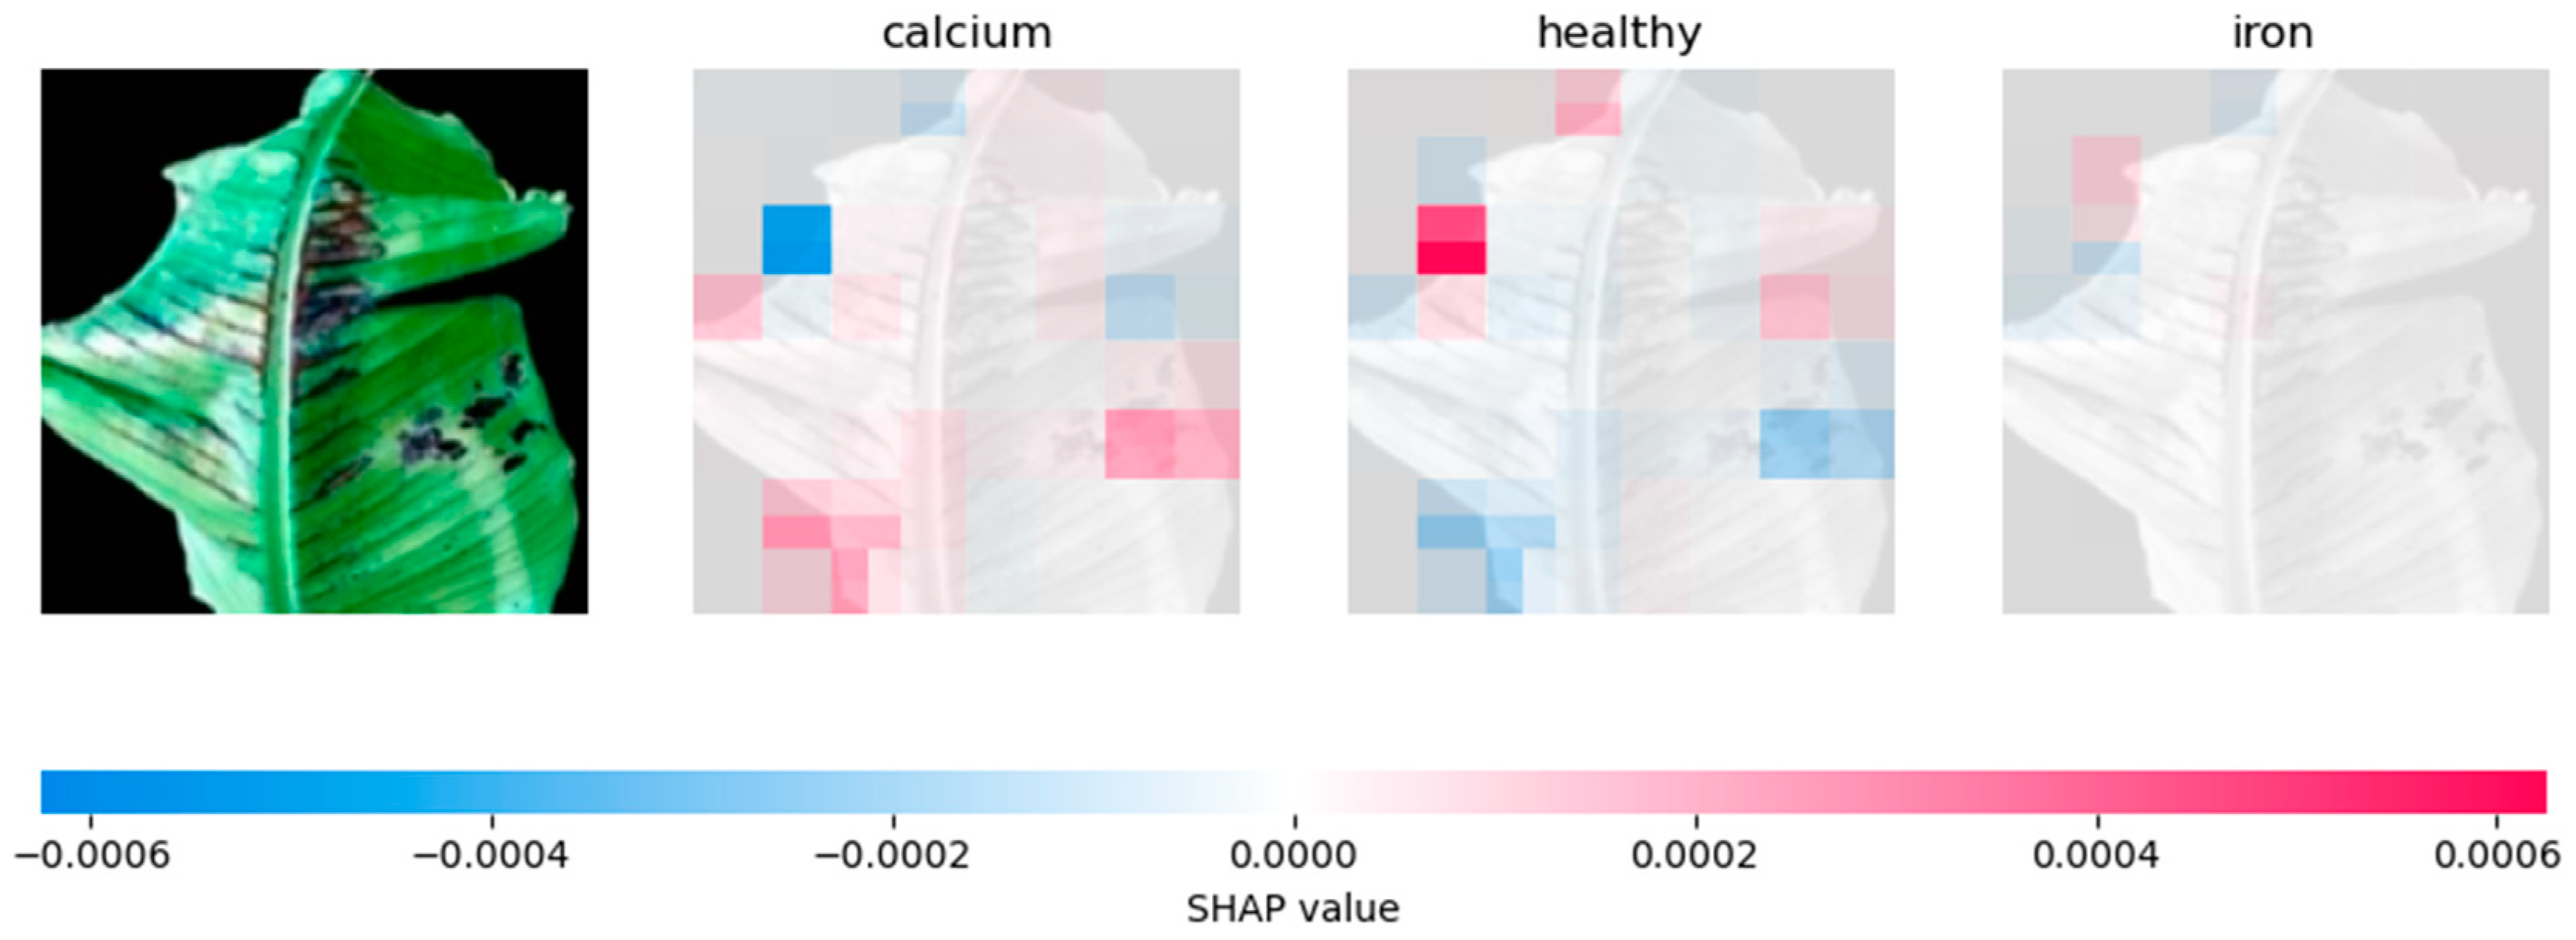
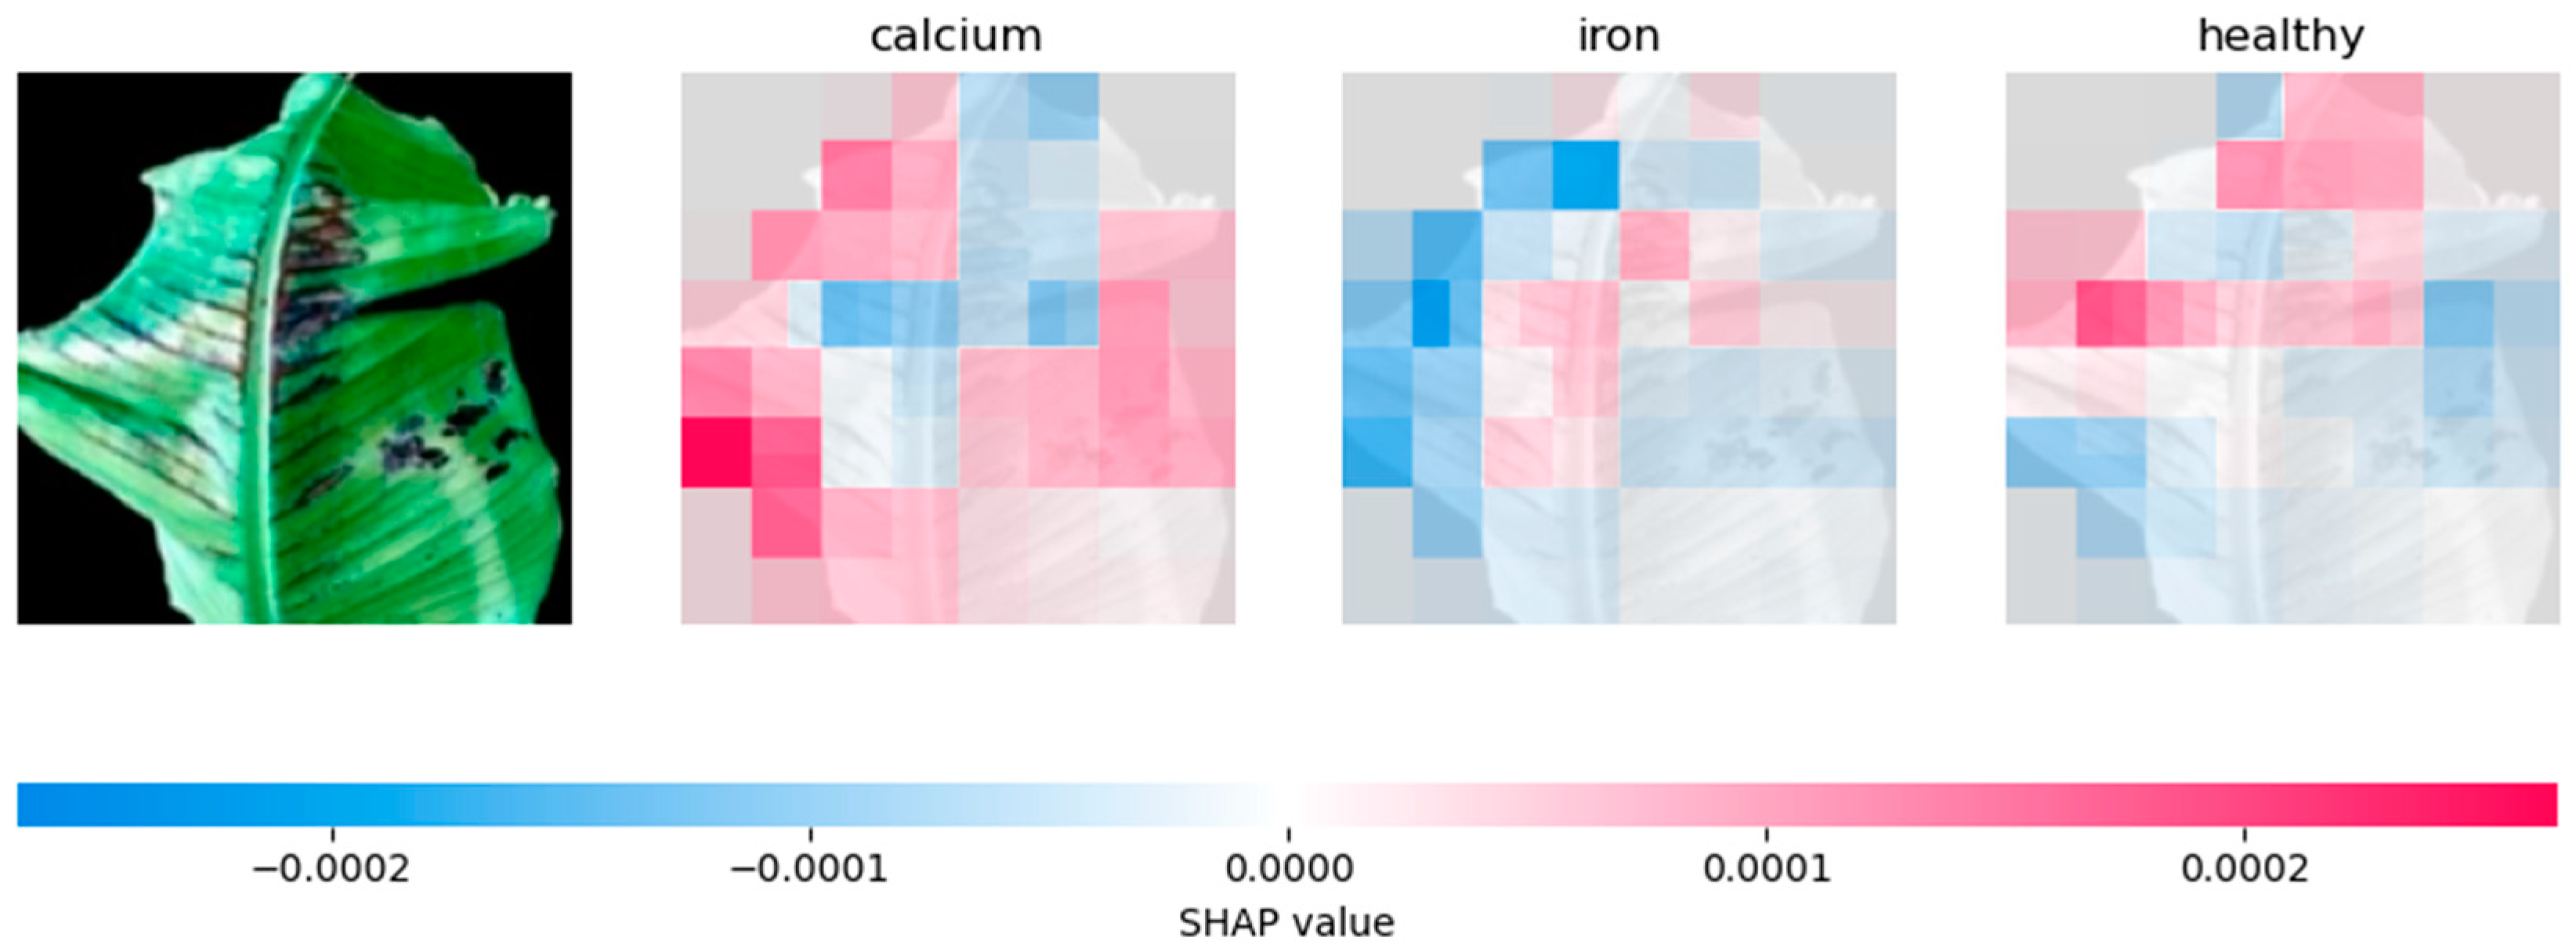
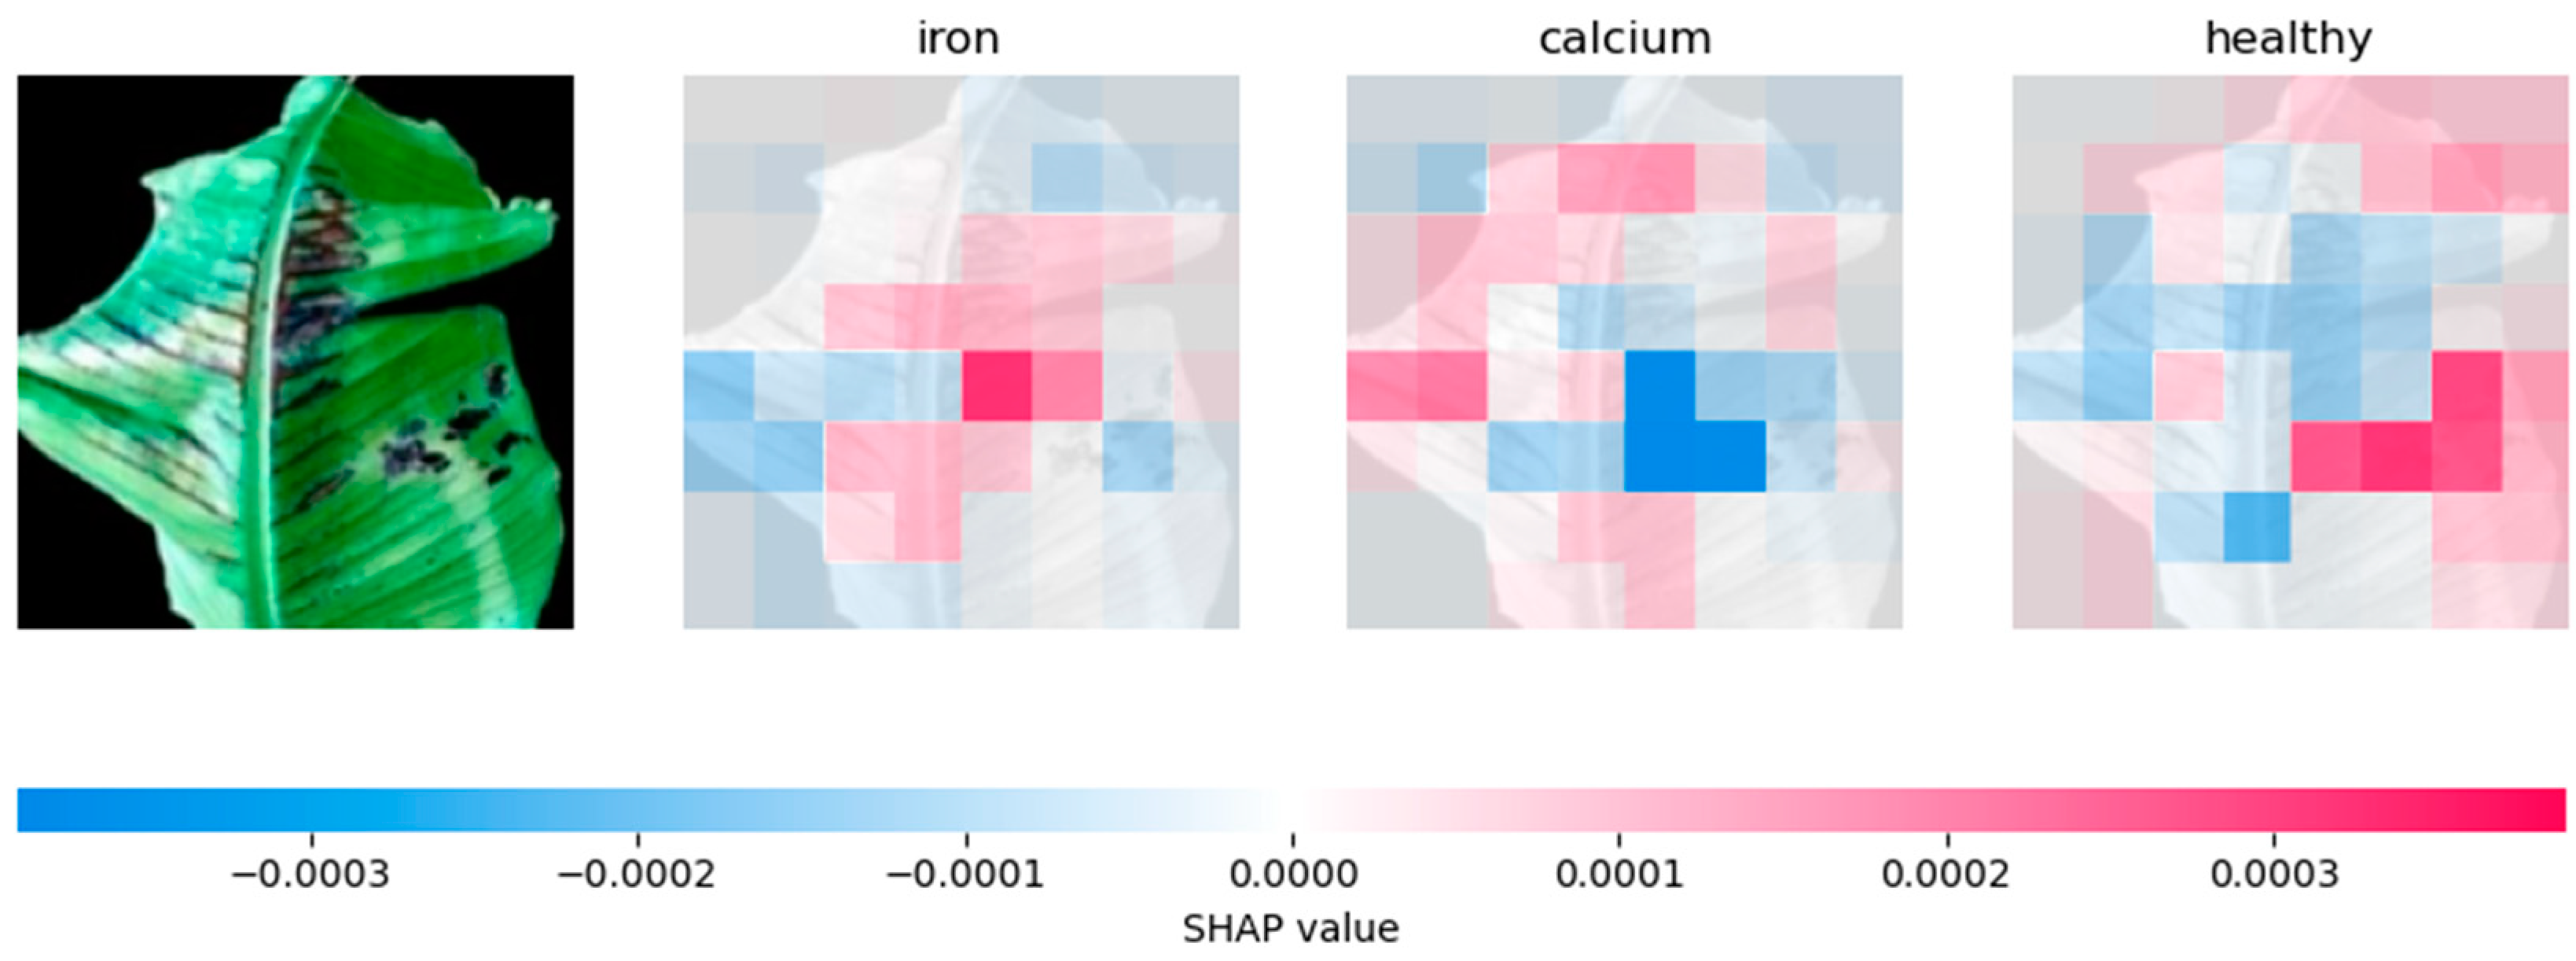
4.2.2. Analysing Explainability of ML Models Using SHAP-Banana Dataset
By analysing the SHAP output from the CNN model as shown in Figure 6, we can see that the most influential regions on the banana leaf are on the sides of the leaf. Compared to the other models, the VGG-16 in Figure 7 distributes the SHAP values across the whole leaf. The Inception-V3 models in Figure 8 rely on broader context clues, resulting in different patterns of SHAP values across the banana leaf.
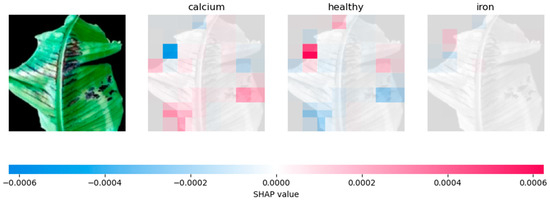
Figure 6.
CNN (banana) SHAP output.

Figure 7.
VGG-16 (banana) SHAP output.

Figure 8.
Inception-V3 (banana) SHAP output.
Overall, the SHAP output of these three deep learning models suggests that each model relies on a distinct set of key features to make predictions as summarised in Table 6.
Table 6.
Summary of the explainability of the ML models based on SHAP.
4.3. Model Explanation Using Grad-CAM
For each of the three models, a GRAD-CAM visualisation technique was used to debug the prediction process and emphasise the intriguing areas of the plant pictures that determine the final decision. The visual explanation provides an overview by generating a heatmap where pixels with high to low intensity are indicated in red, yellow, green, and blue [34]. This technique can be used to determine whether the model accurately predicts the absence of potassium based on the infected region of the plant.
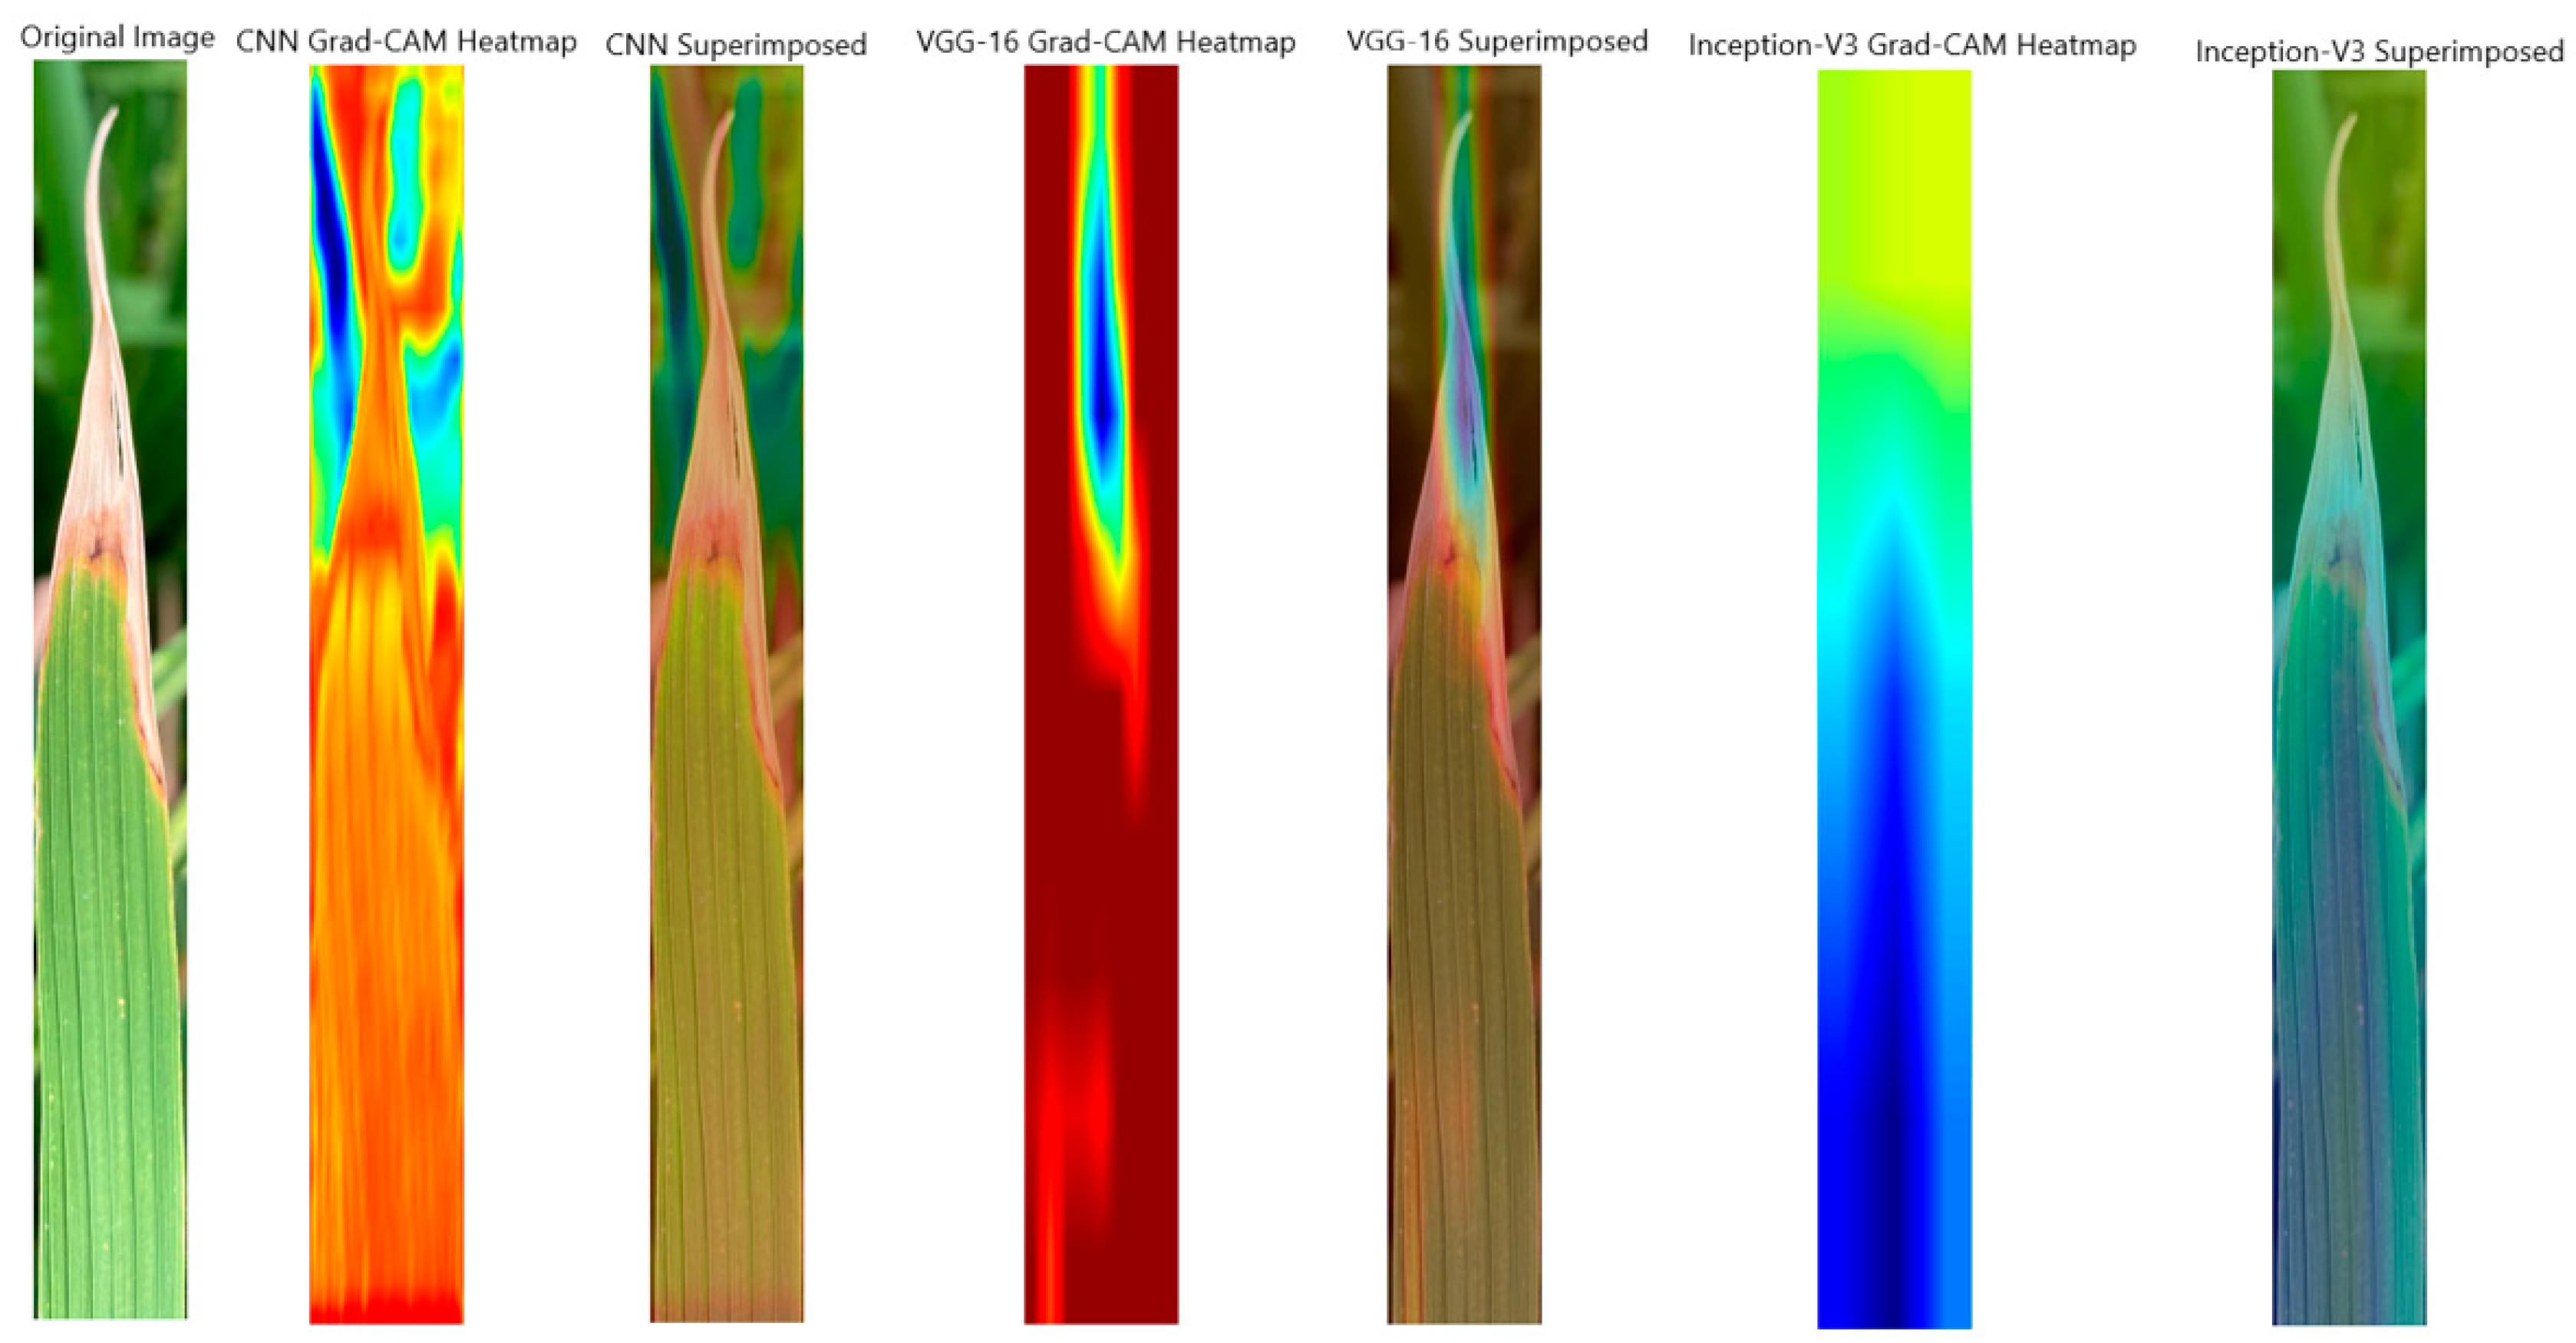
4.3.1. Analysing Explainability of ML Models Using Grad-CAM-Rice Dataset
The CNN GRAD-CAM heatmap revealed that the model mainly focused on the tip of the leaf, where the nutrient deficiency is prominent. The VGG-16 considered a similar part of the leaf; however, the heatmap showed a more accurate part of the plant compared to the CNN model. The way that VGG-16 localised the defected region shows that we can trust the model. People can better understand how VGG-16 uses image classification to identify the lack of nutrients in plants by examining the highlighted area.
The Inception-V3 GRAD-CAM heatmap showed a different pattern compared to the first two models. The model highlighted various broader areas rather than a single dominant area. The approach used in the study for nutrient deficiency identification is consistent with the findings of [35]. The results presented in Figure 9 demonstrate the effectiveness of Grad-CAM in providing transparency and interpretability of these models.
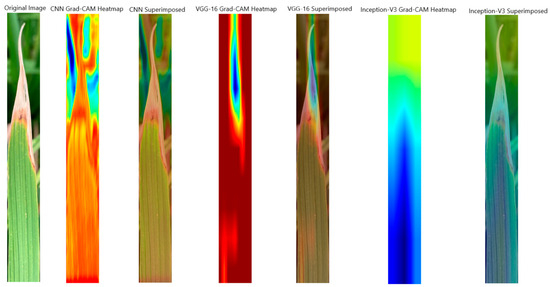
Figure 9.
Rice Grad-CAM output.
4.3.2. Analysing Explainability of ML Models Using Grad-CAM-Banana Dataset
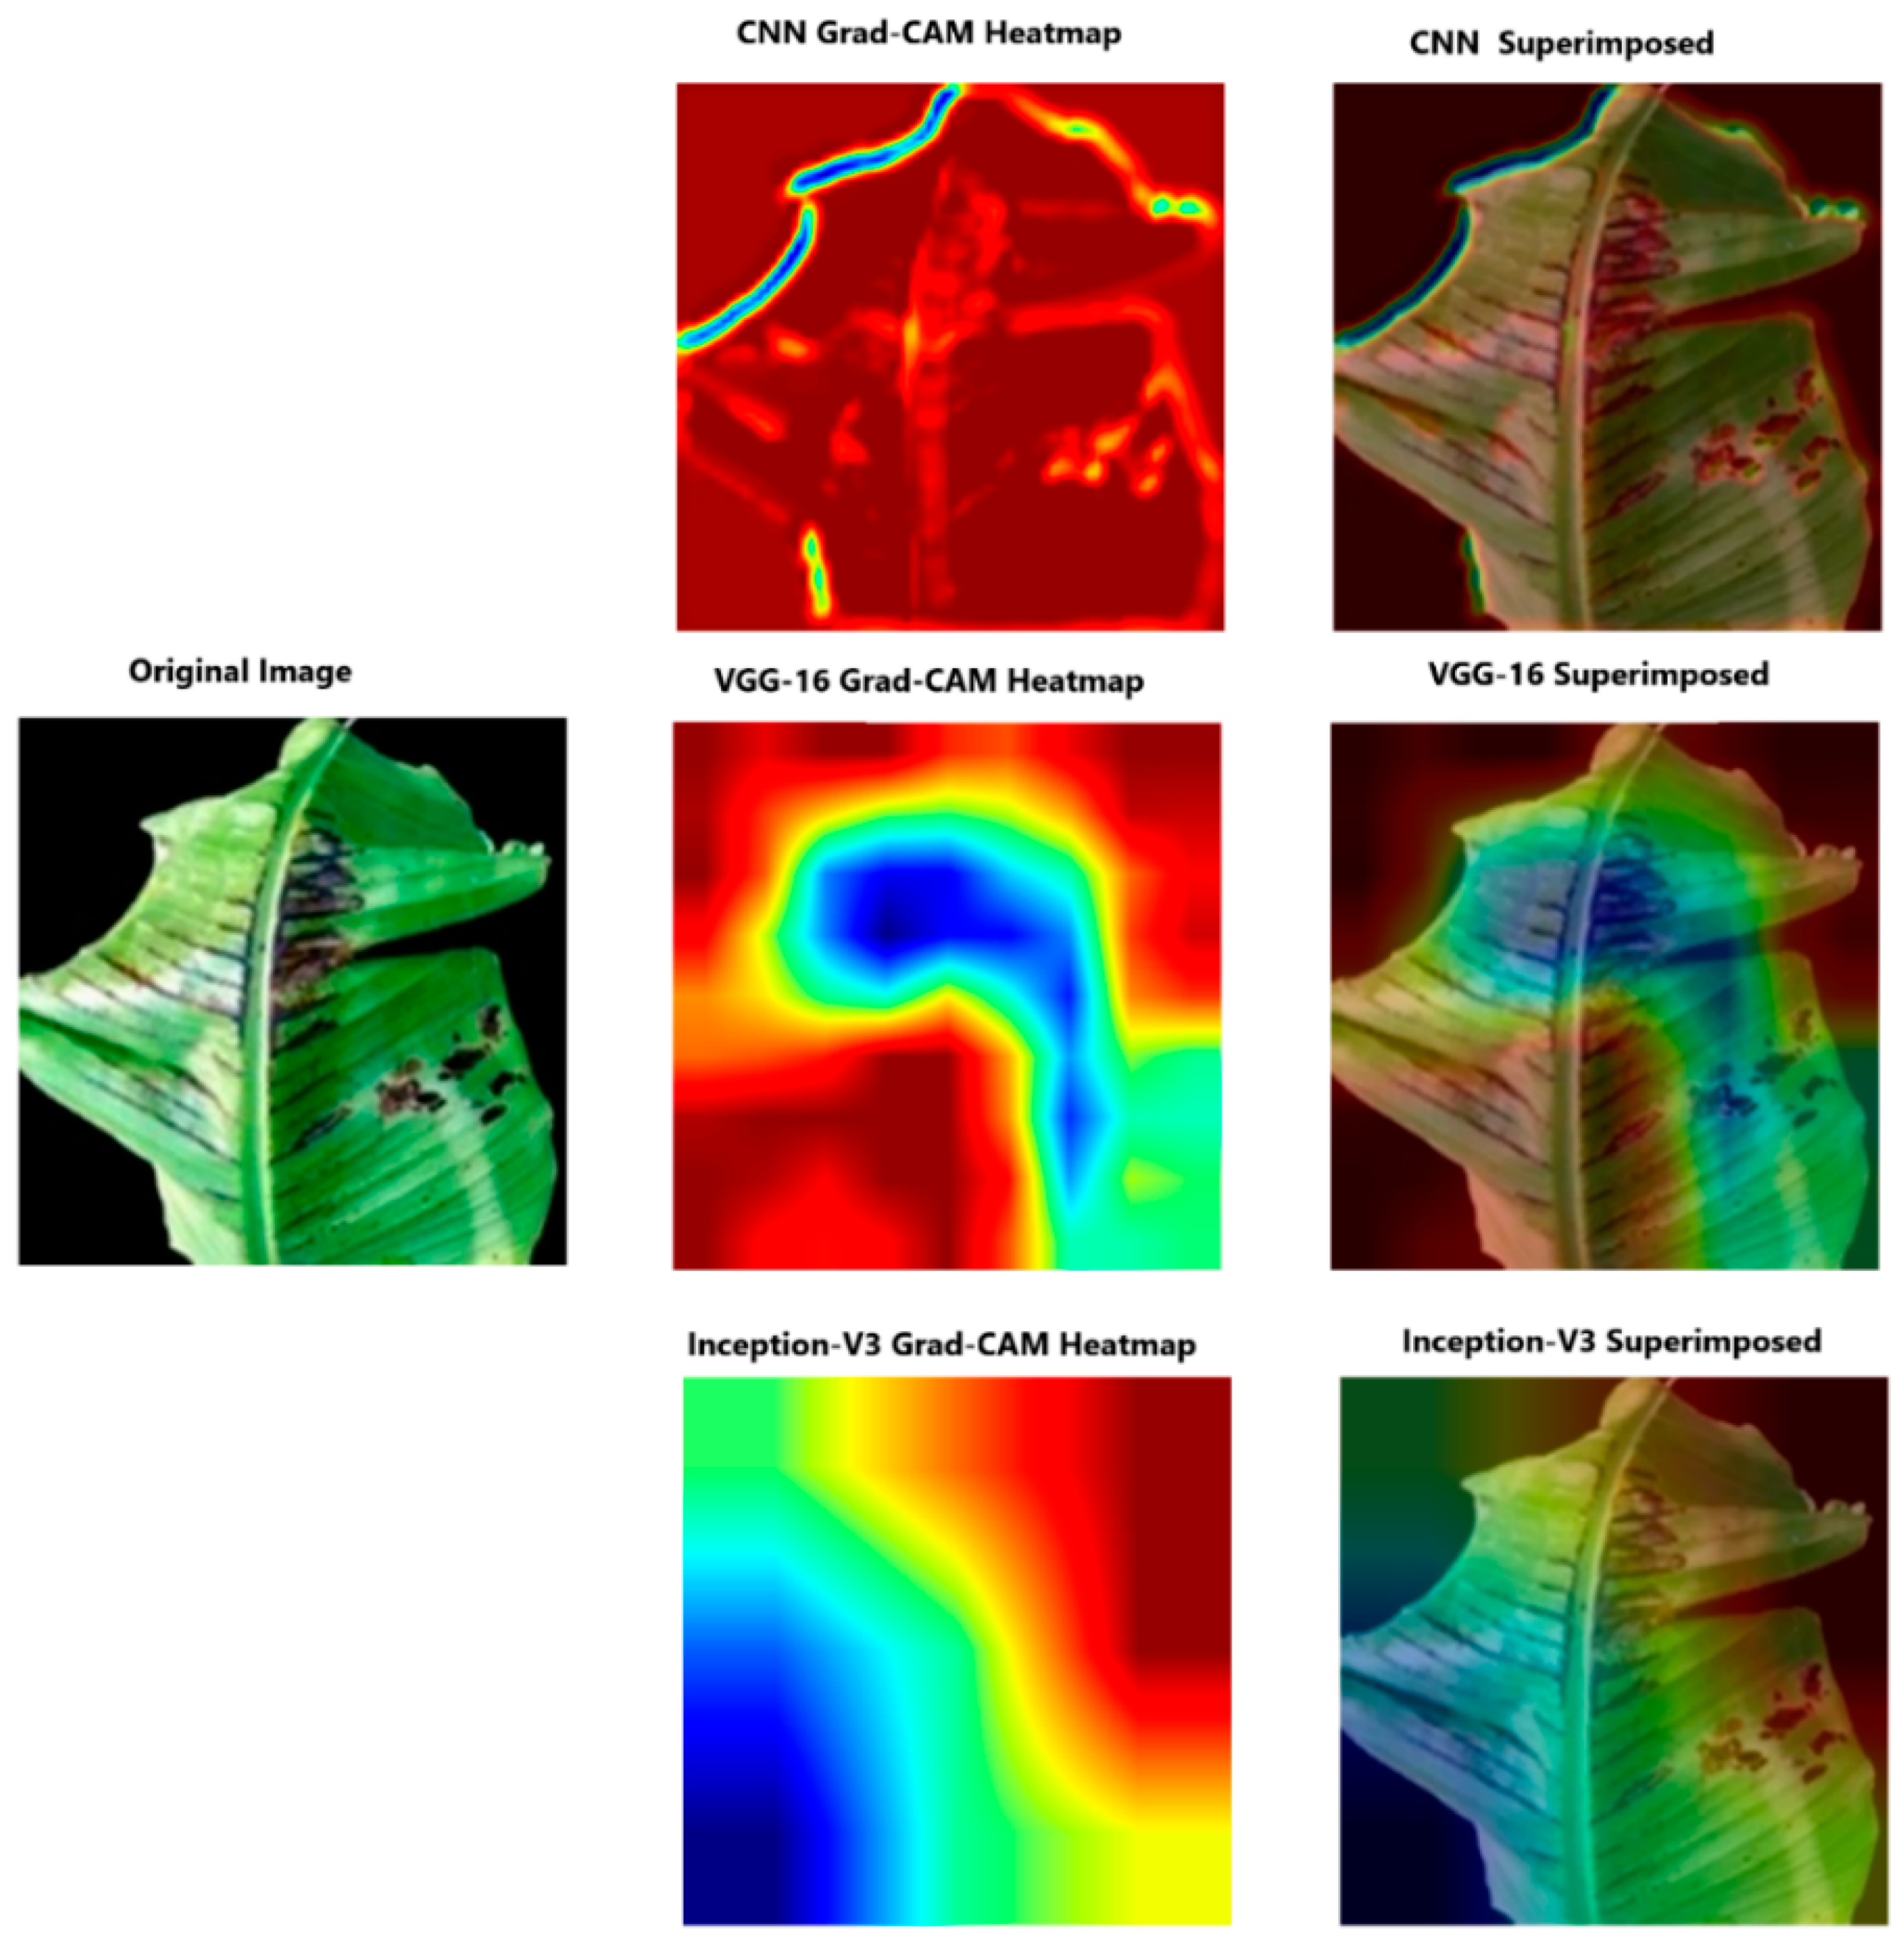
Figure 10 illustrates the use of the Grad-CAM approach when applied to the three models to construct the class activation mapping. This mapping helps to localise the specific region of the plant that predominantly influenced the decision [26]. In this instance, the CNN model tended to highlight the contours of the banana leaf. However, the other two models focused on the leaf itself. The Inception-V3 model heatmap lacks a precise overlap with the object of interest.

Figure 10.
Banana Grad-CAM output.
In conclusion, Grad-CAM is a powerful tool that helps us understand the decision-making process of CNN models such as baseline CNN, VGG-16, and Inception-V3. The results presented in Table 7 demonstrate the effectiveness of Grad-CAM in providing transparency and interpretability of these models. This visual explanation enables a better understanding of how the model performs image classification. Moreover, Grad-CAM is a potential approach for improving the interpretability and transparency of CNN models, offering practitioners and researchers insightful information about their internal working and decision-making processes.
Table 7.
Summary of the explainability of the ML models based on Grad-CAM.
5. Discussion
This study evaluated the performance and interpretability of three Convolutional Neural Network (CNN) architectures for identifying plant nutrient deficiencies. Two datasets, of rice and banana plants, were employed for experimentation. The findings revealed that Inception-V3 and VGG-16 surpassed the baseline CNN model in terms of accuracy for the rice dataset, both achieving 93%. Inception-V3 demonstrated exceptional performance on the banana dataset, attaining an F1-Score of 92%, significantly exceeding CNN (68%) and VGG-16 (81%). These results suggest Inception-V3’s efficacy in detecting nutrient deficiencies in banana plants. Overall, Inception-V3 consistently delivered superior performance across all datasets. This can be attributed to its deeper architecture, which enable more robust feature extraction capabilities, as observed in previous studies comparing CNN architectures [8,16].
Beyond achieving high accuracy, model interpretability is equally important. This study used two XAI algorithms, SHAP and Grad-CAM, to gain insights into the models’ decision-making processes. SHAP analysis revealed that CNN and VGG-16 models often relied on a limited set of prominent features for prediction. Conversely, Inception-V3 incorporated a broader spectrum of features, suggesting its ability to leverage more nuanced information for accurate classification. Grad-CAM visualisations provided further insights. In the banana and rice datasets, the CNN model’s heatmaps highlighted the plant leaf’s contours, while the other two models focused on the leaf itself. Notably, VGG-16 exhibited the most reliable localisation of affected regions based on its heatmap quality. Similar to the finding in [51], these visual explanations enhanced our understanding of how models identify nutrient deficiencies by pinpointing the highlighted areas.
The findings highlight a trade-off between accuracy and interpretability. While Inception-V3 achieved superior performance, its complex architecture may limit interpretability. Conversely, VGG-16’s simpler structure facilitates explanation but potentially compromises accuracy in certain scenarios. Therefore, the optimal model selection depends on the application’s priorities. If paramount accuracy is required, Inception-V3 might be preferred despite interpretability limitations. In contrast, if understanding the model’s reasoning is critical, VGG-16 could be a better choice, even with a slight accuracy trade-off.
6. Conclusions
In this study, we performed comparative analyses of the performance and interpretability of three CNN-based architectures for the identification of plant nutrient deficiencies. The results showed that Inception-V3 achieved the highest accuracy and surpassed the other two architectures in terms of performance. The implementation of SHAP and Grad-CAM provided insights into classification decisions and increased the transparency of models. SHAP focuses on feature importance, highlighting how each feature in the image contributes to the model’s prediction. This allows researchers to understand which features the model relies on most heavily for specific predictions. An advantage of SHAP is that it can be applied to various model architectures, not just CNNs. However, SHAP may not reveal the specific locations within the image influencing the decision, and interpreting the heatmaps can be subjective. Grad-CAM, on the other hand, focuses on model attention. It identifies the image regions most influential for the model’s prediction by generating heatmaps where red areas indicate image regions with the highest influence on the model’s decision. This provides a visual explanation of where the model “looks” at the image to make a prediction. This is valuable for understanding if the model focuses on relevant plant regions, such as areas with signs of nutrient deficiency. However, Grad-CAM does not directly explain how individual features contribute, and the heatmaps might not be perfectly localised, especially for complex models. The study’s findings demonstrate the aforementioned strengths and weaknesses. The study contributes to the literature by incorporating explainable deep learning in the context of plant nutrient deficiency identification. Moreover, unlike prior research that primarily evaluated accuracy without considering explainability, the study addressed this gap by comparing the explainability of GRAD-CAM and SHAP techniques, shedding light on how these models arrive at their predictions. By bringing attention to the importance of a holistic approach that considers both accuracy and explainability in the agriculture sector, the research enhances trust and usability in the models’ predictions.
Overall, the study contributes to the growing field of XAI by providing insights into the performance and interpretability of CNN architectures for the identification of plant nutrient deficiency. The results could help the application of ML models in agriculture to be more trustworthy, and shed light on how these models operate internally.
The limitation of this study is the use of publicly available datasets, which cannot fully capture the variations in plant nutrient deficiency in the real world. Future research should explore the use of larger and more diverse datasets to enhance the generalisability of the models. We will also collaborate with agricultural researchers to have access to real farm datasets. Moreover, future research can explore other methods of explanation, such as LIME and the Contextual Importance and Utility (CIU) method, to further improve the transparency and interpretation of the DL and ML models.
Author Contributions
Conceptualization, O.D.; methodology, O.D., J.M. and T.K.; software, J.M.; validation, J.M., T.K. and O.D.; investigation, J.M.; resources, O.D.; data curation, J.M.; writing—original draft preparation, J.M.; writing—review and editing, O.D. and T.K; supervision, O.D. and T.K. All authors have read and agreed to the published version of the manuscript.
Funding
This research received no external funding.
Data Availability Statement
The data are publicly available.
Acknowledgments
The authors of this paper appreciate the support of the Cape Peninsula University of Technology (CPUT).
Conflicts of Interest
The author declares no conflicts of interest.
References
- Xu, X.; He, P.; Yang, F.; Ma, J.; Pampolino, M.F.; Johnston, A.M.; Zhou, W. Methodology of Fertilizer Recommendation Based on Yield Response and Agronomic Efficiency for Rice in China. Field Crops Res. 2017, 206, 33–42. [Google Scholar] [CrossRef]
- Ghosh, P.; Mondal, A.K.; Chatterjee, S.; Masud, M.; Meshref, H.; Bairagi, A.K. Recognition of Sunflower Diseases Using Hybrid Deep Learning and Its Explainability with AI. Mathematics 2023, 11, 2241. [Google Scholar] [CrossRef]
- Islam, S.; Reza, M.N.; Samsuzzaman, S.; Ahmed, S.; Cho, Y.J.; Noh, D.H.; Chung, S.-O.; Hong, S.J. Machine Vision and Artificial Intelligence for Plant Growth Stress Detection and Monitoring: A Review. Precis. Agric. Sci. Technol. 2024, 6, 33–57. [Google Scholar] [CrossRef]
- Liang, C.; Tian, J.; Liao, H. Proteomics Dissection of Plant Responses to Mineral Nutrient Deficiency. Proteomics 2013, 13, 624–636. [Google Scholar] [CrossRef] [PubMed]
- Talukder MS, H.; Sarkar, A.K. Nutrients deficiency diagnosis of rice crop by weighted average ensemble learning. Smart Agric. Technol. 2023, 4, 100155. [Google Scholar] [CrossRef]
- Govindasamy, P.; Muthusamy, S.K.; Bagavathiannan, M.; Mowrer, J.; Jagannadham, P.T.; Maity, A.; Halli, H.M.; GK, S.; Vadivel, R.; TK, D.; et al. Nitrogen Use Efficiency—A Key to Enhance Crop Productivity under a Changing Climate. Front. Plant Sci. 2023, 14. [Google Scholar] [CrossRef] [PubMed]
- Khan, F.; Siddique, A.B.; Shabala, S.; Zhou, M.; Zhao, C. Phosphorus Plays Key Roles in Regulating Plants’ Physiological Responses to Abiotic Stresses. Plants 2023, 12, 2861. [Google Scholar] [CrossRef] [PubMed]
- Kusanur, V.; Chakravarthi, V.S. Using Transfer Learning for Nutrient Deficiency Prediction and Classification in Tomato Plant. Int. J. Adv. Comput. Sci. Appl. 2021, 12, 784–790. [Google Scholar] [CrossRef]
- Yi, J.; Krusenbaum, L.; Unger, P.; Hüging, H.; Seidel, S.J.; Schaaf, G.; Gall, J. Deep Learning for Non-Invasive Diagnosis of Nutrient Deficiencies in Sugar Beet Using RGB Images. Sensors 2020, 20, 5893. [Google Scholar] [CrossRef]
- Kattenborn, T.; Leitloff, J.; Schiefer, F.; Hinz, S. Review on Convolutional Neural Networks (CNN) in Vegetation Remote Sensing. ISPRS J. Photogramm. Remote Sens. 2021, 173, 24–49. [Google Scholar] [CrossRef]
- Wang, C.; Li, C.; Han, Q.; Wu, F.; Zou, X. A Performance Analysis of a Litchi Picking Robot System for Actively Removing Obstructions, Using an Artificial Intelligence Algorithm. Agronomy 2023, 13, 2795. [Google Scholar] [CrossRef]
- Mazumder, M.K.A.; Mridha, M.F.; Alfarhood, S.; Safran, M.; Abdullah-Al-Jubair, M.; Che, D. A Robust and Light-Weight Transfer Learning-Based Architecture for Accurate Detection of Leaf Diseases across Multiple Plants Using Less Amount of Images. Front. Plant Sci. 2023, 14, 1321877. [Google Scholar] [CrossRef] [PubMed]
- Albattah, W.; Javed, A.; Nawaz, M.; Masood, M.; Albahli, S. Artificial Intelligence-Based Drone System for Multiclass Plant Disease Detection Using an Improved Efficient Convolutional Neural Network. Front. Plant Sci. 2022, 13, 808380. [Google Scholar] [CrossRef] [PubMed]
- Jafar, A.; Bibi, N.; Naqvi, R.A.; Sadeghi-Niaraki, A.; Jeong, D. Revolutionizing Agriculture with Artificial Intelligence: Plant Disease Detection Methods, Applications, and Their Limitations. Front. Plant Sci. 2024, 15, 1356260. [Google Scholar] [CrossRef] [PubMed]
- Taji, K.; Ghanimi, F. Enhancing Plant Disease Classification through Manual CNN Hyperparameter Tuning. Data Metadata 2023, 2, 112. [Google Scholar] [CrossRef]
- Dey, B.; Masum Ul Haque, M.; Khatun, R.; Ahmed, R. Comparative Performance of Four CNN-Based Deep Learning Variants in Detecting Hispa Pest, Two Fungal Diseases, and NPK Deficiency Symptoms of Rice (Oryza Sativa). Comput. Electron. Agric. 2022, 202, 107340. [Google Scholar] [CrossRef]
- Henna, S.; Alcaraz, J.M.L. From Interpretable Filters to Predictions of Convolutional Neural Networks with Explainable Artificial Intelligence. arXiv 2022, arXiv:2207.12958. [Google Scholar]
- Mccauley, A. Plant Nutrient Functions and Deficiency and Toxicity Symptoms. Nutr. Manag. Modul. 2009, 9, 1–16. [Google Scholar]
- Aleksandrov, V. Identification of Nutrient Deficiency in Plants by Artificial Intelligence. Acta Physiol. Plant 2022, 44, 29. [Google Scholar] [CrossRef]
- Sinha, D.; Tandon, P.K. An Overview of Nitrogen, Phosphorus and Potassium: Key Players of Nutrition Process in Plants. In Sustainable Solutions for Elemental Deficiency and Excess in Crop Plants; Springer: Singapore, 2020; pp. 85–117. ISBN 9789811586361. [Google Scholar]
- Beura, K.; Kohli, A.; Kumar, A.; Anupam, P.; Rajiv, D.; Shweta, R.; Nintu, S.; Mahendra, M.; Yanendra, S.; Singh, K.; et al. Souvenir, National Seminar on “Recent Developments in Nutrient Management Strategies for Sustainable Agriculture: The Indian Context; Bihar Agricultural University: Bhagalpur, India, 2022; ISBN 9789394490932. [Google Scholar]
- Andrianto, H.; Suhardi; Faizal, A.; Budi Kurniawan, N.; Praja Purwa Aji, D. Performance Evaluation of IoT-Based Service System for Monitoring Nutritional Deficiencies in Plants. Inf. Process. Agric. 2023, 10, 52–70. [Google Scholar] [CrossRef]
- Mattila, T.J.; Rajala, J. Do Different Agronomic Soil Tests Identify Similar Nutrient Deficiencies? Soil. Use Manag. 2022, 38, 635–648. [Google Scholar] [CrossRef]
- Mohd Adib, N.A.N.; Daliman, S. Conceptual Framework of Smart Fertilization Management for Oil Palm Tree Based on IOT and Deep Learning. In Proceedings of the IOP Conference Series: Earth and Environmental Science, Kelantan, Malaysia, 14–15 July 2021; IOP Publishing Ltd.: Bristol, UK, 2021; Volume 842. [Google Scholar]
- Nogueira De Sousa, R.; Moreira, L.A. Plant Nutrition Optimization: Integrated Soil Management and Fertilization Practices; TechOpen: Rijeka, Croatia, 2024. [Google Scholar]
- Hanif Hashimi, M.; Abad, Q.; Gul Shafiqi, S. A Review of Diagnostic Techniques of Visual Symptoms of Nutrients Deficiencies in Plant. Int. J. Agric. Res. 2023, 6, 1–9. [Google Scholar]
- Kamelia, L.; Rahman, T.K.B.A.; Saragih, H.; Haerani, R. The Comprehensive Review on Detection of Macro Nutrients Deficiency in Plants Based on the Image Processing Technique. In Proceedings of the 2020 6th International Conference on Wireless and Telematics, ICWT 2020, Yogyakarta, Indonesia, 3–4 September 2020; Institute of Electrical and Electronics Engineers Inc.: Piscataway, NJ, USA, 2020. [Google Scholar]
- Ghosh, A.; Sufian, A.; Sultana, F.; Chakrabarti, A.; De, D. Fundamental Concepts of Convolutional Neural Network. In Recent Trends and Advances in Artificial Intelligence and Internet of Things; Springer: Cham, Switzerland, 2019; Volume 172, ISBN 9783030326449. [Google Scholar]
- Wang, H. On the Origin of Deep Learning. arXiv 2017, arXiv:1702.07800. [Google Scholar]
- Kamilaris, A.; Prenafeta-Boldú, F.X. A Review of the Use of Convolutional Neural Networks in Agriculture. J. Agric. Sci. 2018, 156, 312–322. [Google Scholar] [CrossRef]
- Canziani, A.; Paszke, A.; Culurciello, E. An Analysis of Deep Neural Network Models for Practical Applications. arXiv 2016, arXiv:1605.07678. [Google Scholar] [CrossRef]
- Simonyan, K.; Zisserman, A. Very Deep Convolutional Networks for Large-Scale Image Recognition. In Proceedings of the 3rd International Conference on Learning Representations, ICLR 2015—Conference Track Proceedings, San Diego, CA, USA, 7–9 May 2015; pp. 1–14. [Google Scholar]
- Khan, A.; Anabia, S.; Umme, Z.; Aqsa, S.Q. A Survey of the Recent Architectures of Deep Convolutional Neural Networks. Artif. Intell. Rev. 2020, 53, 5455–5516. [Google Scholar] [CrossRef]
- Leonardo, M.M.; Carvalho, T.J.; Rezende, E.; Zucchi, R.; Faria, F.A. Deep Feature-Based Classifiers for Fruit Fly Identification (Diptera: Tephritidae). In Proceedings of the 31st Conference on Graphics, Patterns and Images, SIBGRAPI 2018, Paraná, Brazil, 29 October–1 November 2018; Institute of Electrical and Electronics Engineers Inc.: Piscataway, NJ, USA, 2019; pp. 41–47. [Google Scholar]
- Szegedy, C.; Liu, W.; Jia, Y.; Sermanet, P.; Reed, S.; Anguelov, D.; Erhan, D.; Vanhoucke, V.; Rabinovich, A. Going Deeper with Convolutions. In Proceedings of the 2015 IEEE Conference on Computer Vision and Pattern Recognition (CVPR), Boston, MA, USA, 7–12 June 2015; pp. 1–9. [Google Scholar]
- Alzubaidi, L.; Zhang, J.; Humaidi, A.J.; Al-Dujaili, A.; Duan, Y.; Al-Shamma, O.; Santamaría, J.; Fadhel, M.A.; Al-Amidie, M.; Farhan, L. Review of Deep Learning: Concepts, CNN Architectures, Challenges, Applications, Future Directions. J. Big Data 2021, 8, 53. [Google Scholar] [CrossRef] [PubMed]
- Barredo, A.A.; Díaz-Rodríguez, N.; Del Ser, J.; Bennetot, A.; Tabik, S.; Barbado, A.; Garcia, S.; Gil-Lopez, S.; Molina, D.; Benjamins, R.; et al. Explainable Artificial Intelligence (XAI): Concepts, Taxonomies, Opportunities and Challenges toward Responsible AI. Inf. Fusion 2020, 58, 82–115. [Google Scholar] [CrossRef]
- Gerlings, J.; Shollo, A.; Constantiou, L. Reviewing the Need for Explainable Artificial Intelligence (XAI). arXiv 2021, arXiv:2012.01007. [Google Scholar] [CrossRef]
- Linardatos, P.; Papastefanopoulos, V.; Kotsiantis, S. Explainable Ai: A Review of Machine Learning Interpretability Methods. Entropy 2021, 23, 18. [Google Scholar] [CrossRef]
- Singh, H.; Roy, A.; Setia, R.K.; Pateriya, B. Estimation of Nitrogen Content in Wheat from Proximal Hyperspectral Data Using Machine Learning and Explainable Artificial Intelligence (XAI) Approach. Model. Earth Syst. Env. 2021, 8, 2505–2511. [Google Scholar] [CrossRef]
- Lundberg, S.M.; Lee, S.I. A Unified Approach to Interpreting Model Predictions. Adv. Neural Inf. Process Syst. 2017, 30, 4766–4775. [Google Scholar]
- Antwarg, L.; Miller, R.M.; Shapira, B.; Rokach, L. Explaining Anomalies Detected by Autoencoders Using SHAP. arXiv 2020, arXiv:1903.02407. [Google Scholar]
- Selvaraju, R.R.; Cogswell, M.; Das, A.; Vedantam, R.; Parikh, D.; Batra, D. Grad-CAM: Visual Explanations from Deep Networks via Gradient-Based Localization. In Proceedings of the IEEE International Conference on Computer Vision, Venice, Italy, 22–29 October 2017. [Google Scholar]
- Panesar, A. Improving Visual Question Answering by Leveraging Depth and Adapting Explainability. In Proceedings of the 2022 31st IEEE International Conference on Robot and Human Interactive Communication (RO-MAN), Naples, Italy, 29 August–2 September 2022. [Google Scholar]
- Xu, Z.; Guo, X.; Zhu, A.; He, X.; Zhao, X.; Han, Y.; Subedi, R. Using Deep Convolutional Neural Networks for Image-Based Diagnosis of Nutrient Deficiencies in Rice. Comput. Intell. Neurosci. 2020, 2020, 7307252. [Google Scholar] [CrossRef] [PubMed]
- Tran, T.T.; Choi, J.W.; Le, T.T.H.; Kim, J.W. A Comparative Study of Deep CNN in Forecasting and Classifying the Macronutrient Deficiencies on Development of Tomato Plant. Appl. Sci. 2019, 9, 1601. [Google Scholar] [CrossRef]
- Ibrahim, S.; Hasan, N.; Sabri, N.; Abu Samah, K.A.F.; Rahimi Rusland, M. Palm Leaf Nutrient Deficiency Detection Using Convolutional Neural Network (CNN). Int. J. Nonlinear Anal. Appl. 2022, 13, 1949–1956. [Google Scholar]
- Weeraphat, R. Nutrient Deficiency Symptoms in Rice. Available online: https://www.kaggle.com/datasets/guy007/nutrientdeficiencysymptomsinrice (accessed on 4 April 2023).
- Sunitha, P. Images of Nutrient Deficient Banana Plant Leaves, V1; Mendeley: London, UK, 2022. [Google Scholar] [CrossRef]
- Rakesh, S.; Indiramma, M. Explainable AI for Crop Disease Detection. In Proceedings of the 2022 4th International Conference on Advances in Computing, Communication Control and Networking (ICAC3N), Greater Noida, India, 16–17 December 2022; IEEE: Piscataway, NJ, USA, 2022; pp. 1601–1608. [Google Scholar]
- Mostafa, S.; Mondal, D.; Panjvani, K.; Kochian, L.; Stavness, I. Explainable Deep Learning in Plant Phenotyping. Front. Artif. Intell. 2023, 6, 1203546. [Google Scholar] [CrossRef]


Disclaimer/Publisher’s Note: The statements, opinions and data contained in all publications are solely those of the individual author(s) and contributor(s) and not of MDPI and/or the editor(s). MDPI and/or the editor(s) disclaim responsibility for any injury to people or property resulting from any ideas, methods, instructions or products referred to in the content. |
© 2024 by the authors. Licensee MDPI, Basel, Switzerland. This article is an open access article distributed under the terms and conditions of the Creative Commons Attribution (CC BY) license (https://creativecommons.org/licenses/by/4.0/).