
Human–Object Interaction: Development of a Usability Index for Product Design Using a Hierarchical Fuzzy Axiomatic Design

 , ,
, ,  , ,
, ,
Abstract
:1. Introduction
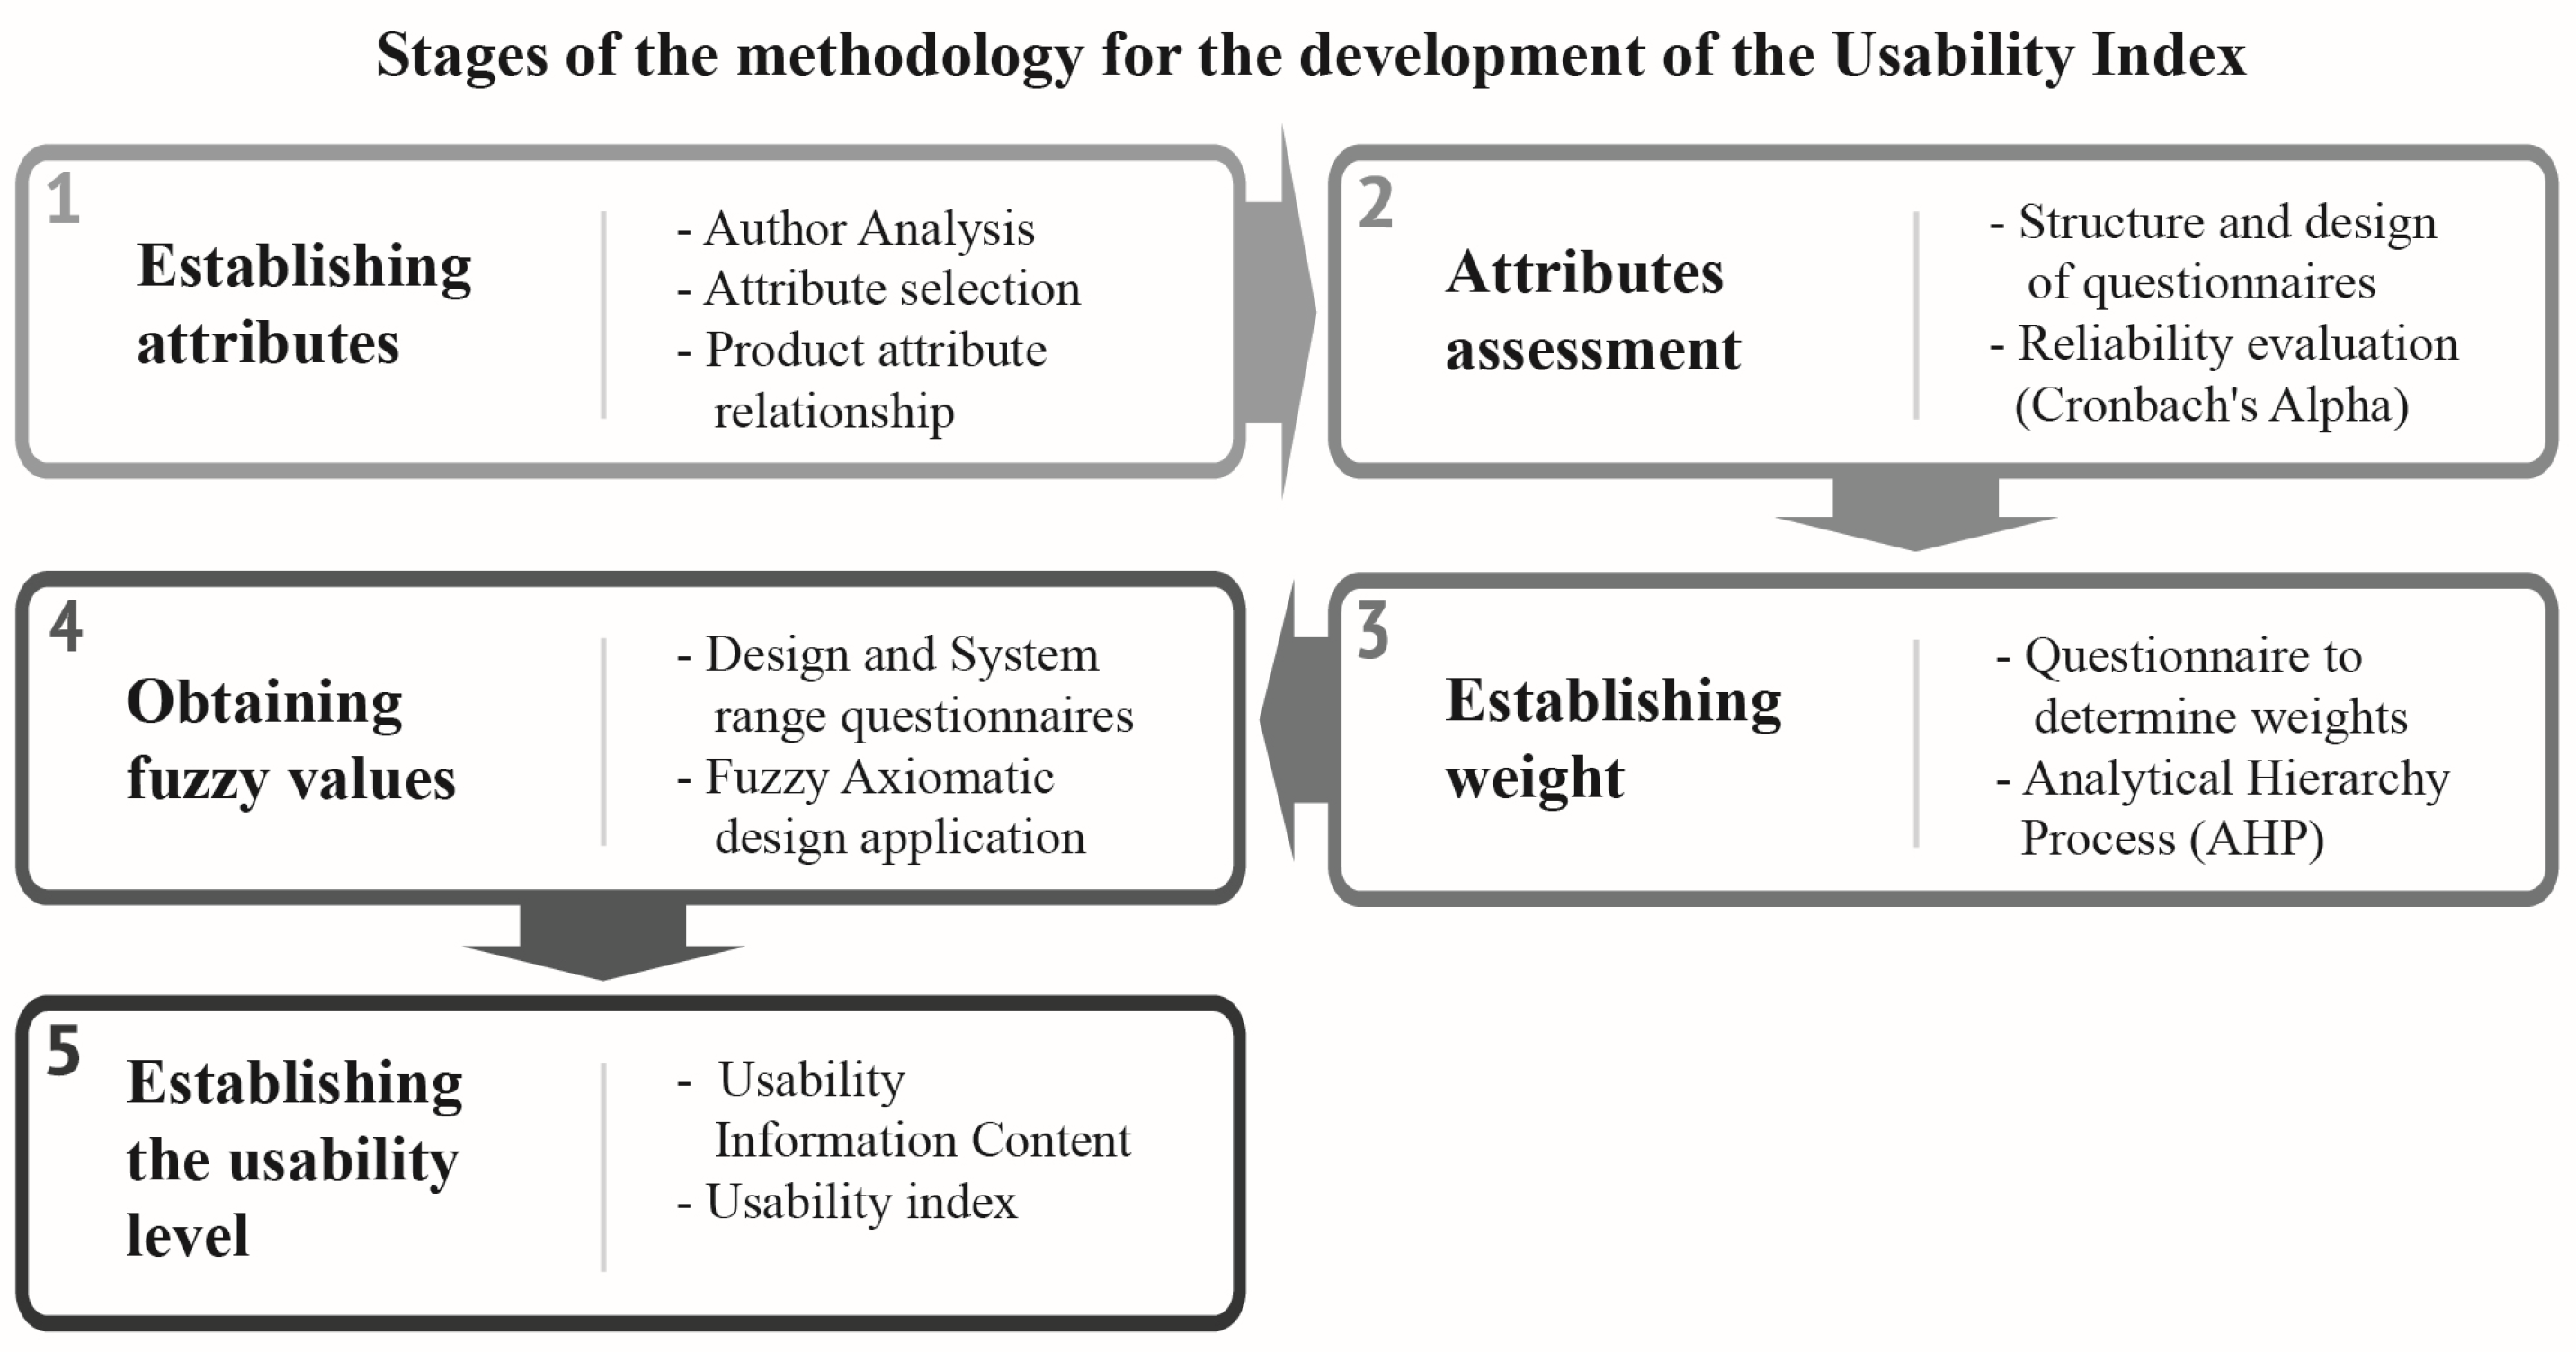
2. Materials and Methods
2.1. Establishing Attributes
2.2. Attribute Assessment
2.3. Establishing Weight
- The first step was to establish the alternatives to be compared, which are represented by
- The second stage consisted of establishing the attributes, with B_i = 1, 2, …, “m” being the number of attributes.
- Next, a group of experts were chosen who drew on their own judgement to rank each attribute in order of importance to obtain a weight, which would result from the AHP’s pairwise comparison and the geometric mean, as shown in Equation (1):
- Based on Entani et al., the first step is to determine the attributes with m; then, a pair of attributes is compared and generates all possible pairs, thus obtaining the A comparison matrix as shown in Equation (2) [27]:
- where a_ij shows the priority relationship for attribute i as compared to that of attribute j. Pairwise comparisons were given, as observed in the case of attribute m.
- The W_ij weights were obtained from the matrix, using the eigenvector method and Equation (3):
- The sum of the weights obtained was normalized, and the final decision matrix values were used as final weights for the respective attributes.
- The alternatives were ranked by W_j in descending order, with the highest value signaling the most preferred alternative.
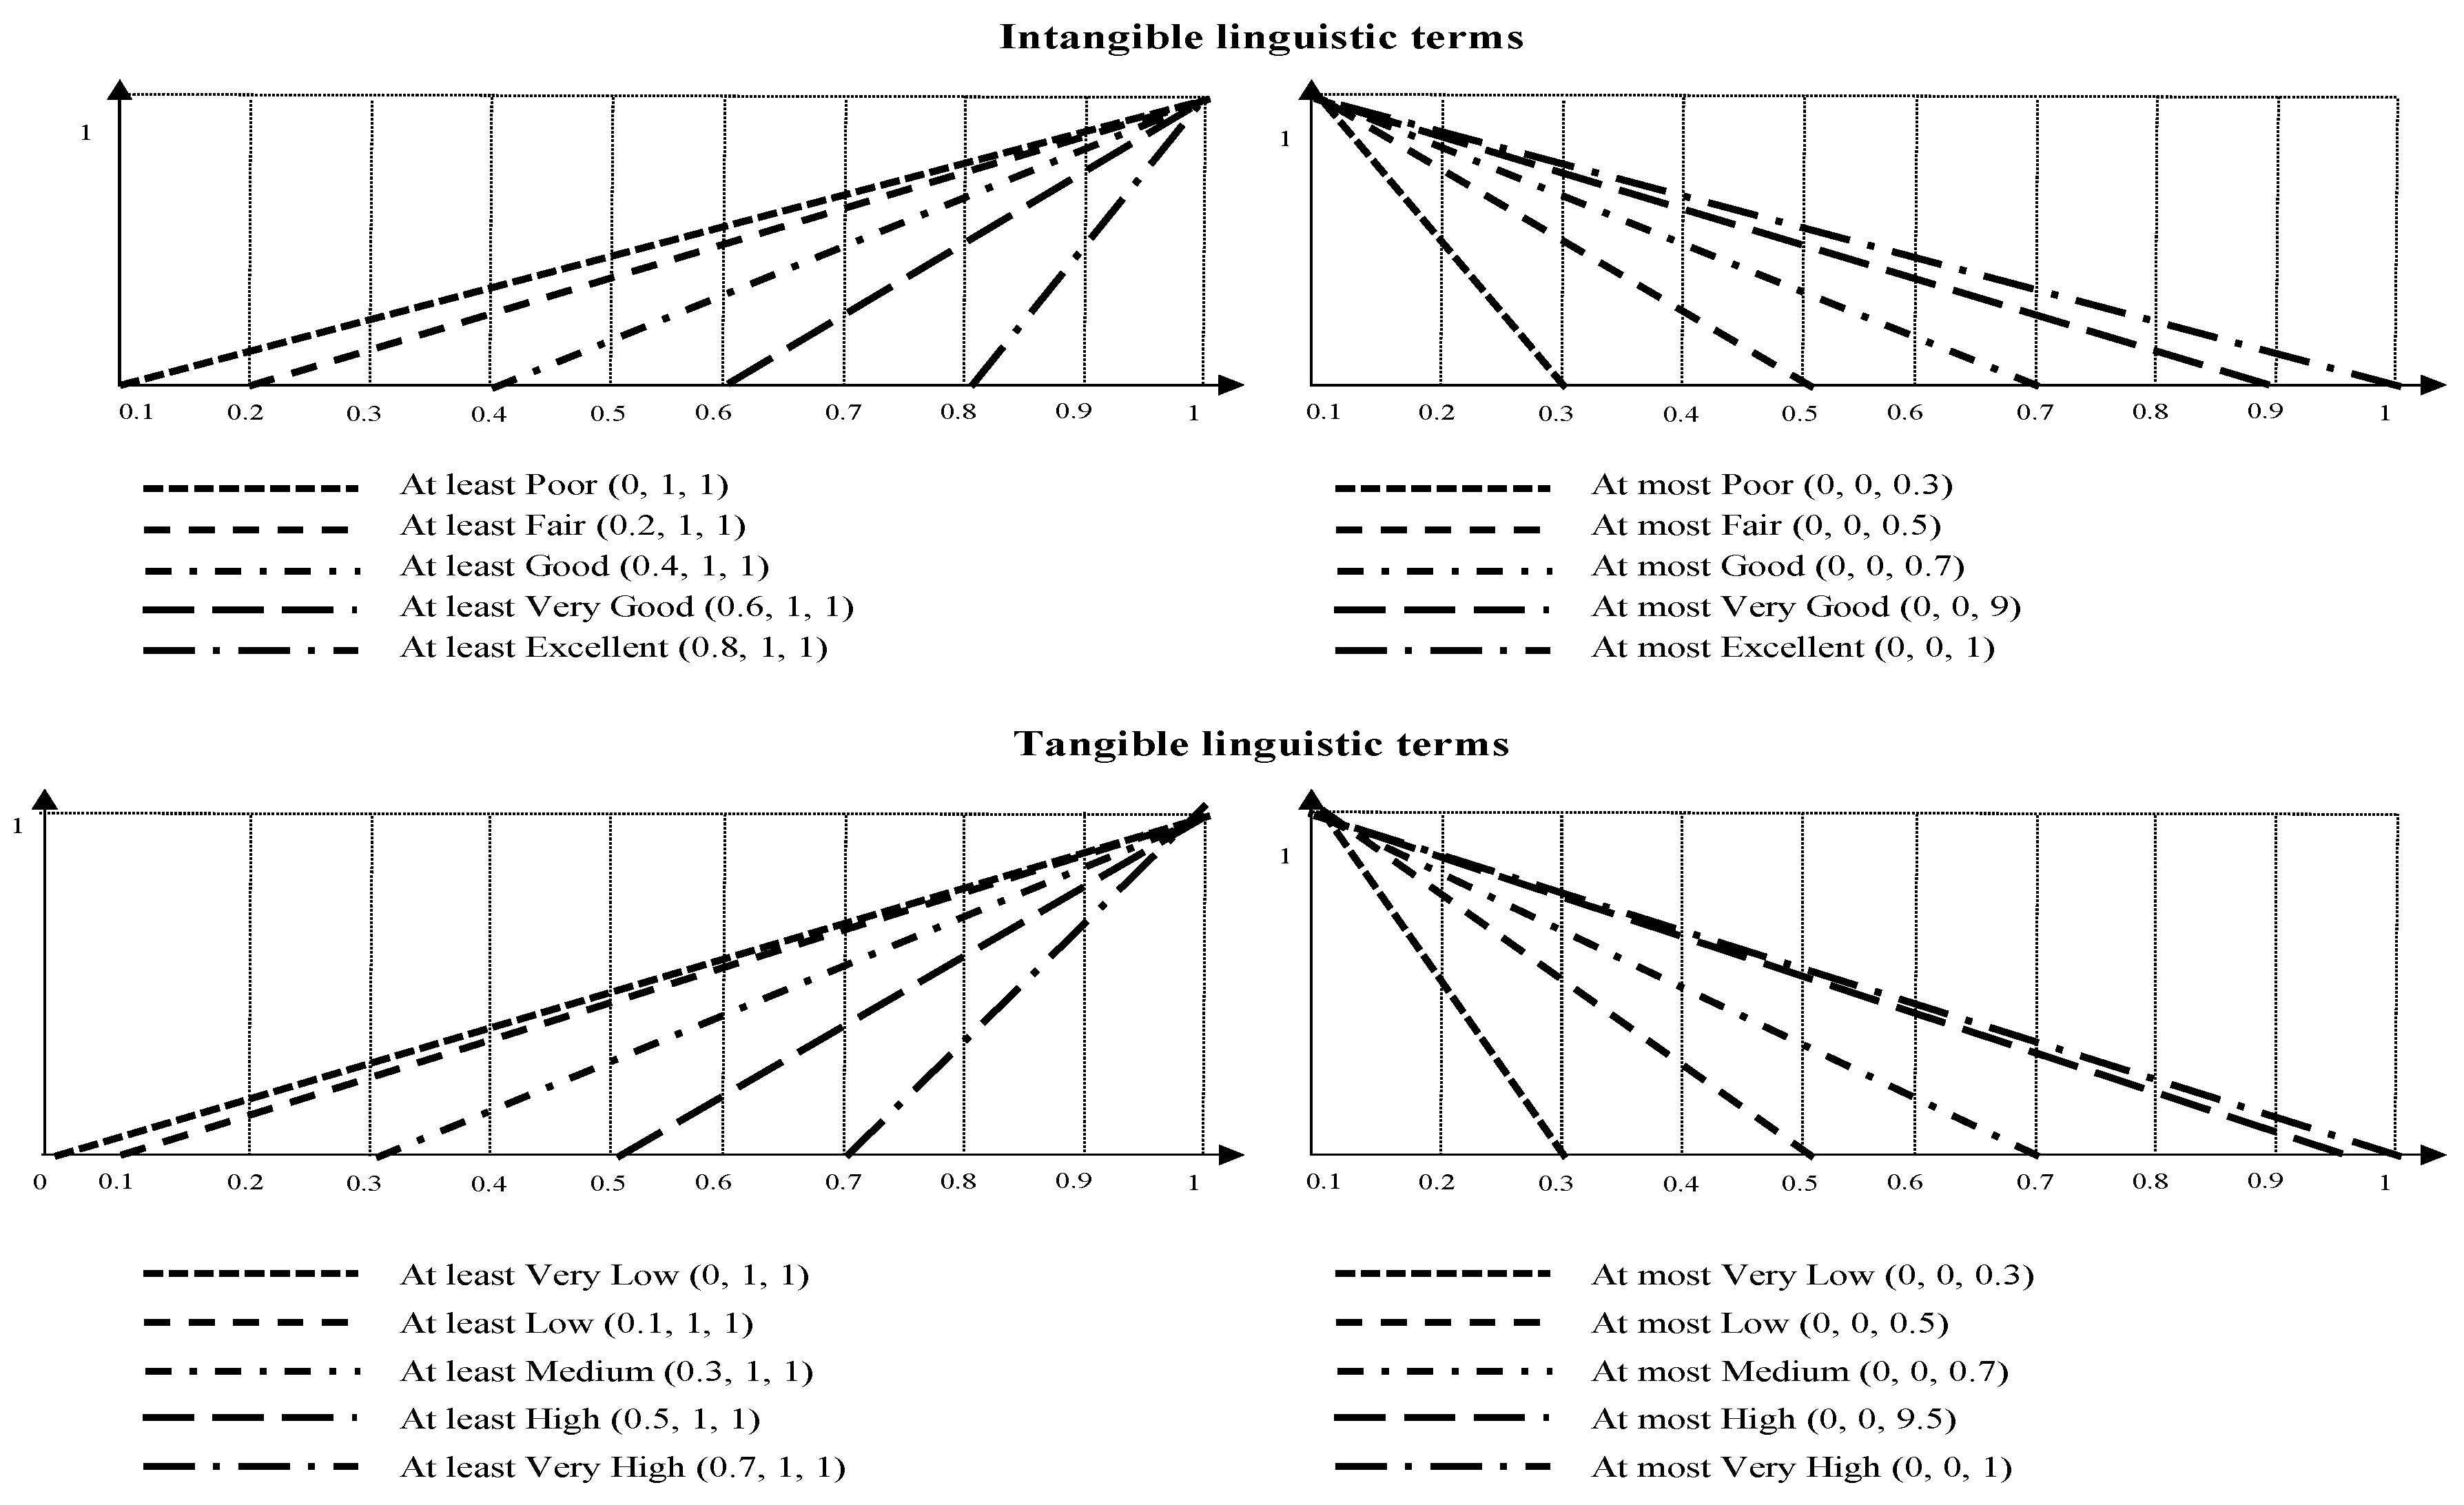
2.4. Obtaining Fuzzy Values
2.5. Establishing the Usability Level
2.6. Interpreting the Usability Level Results
3. Results
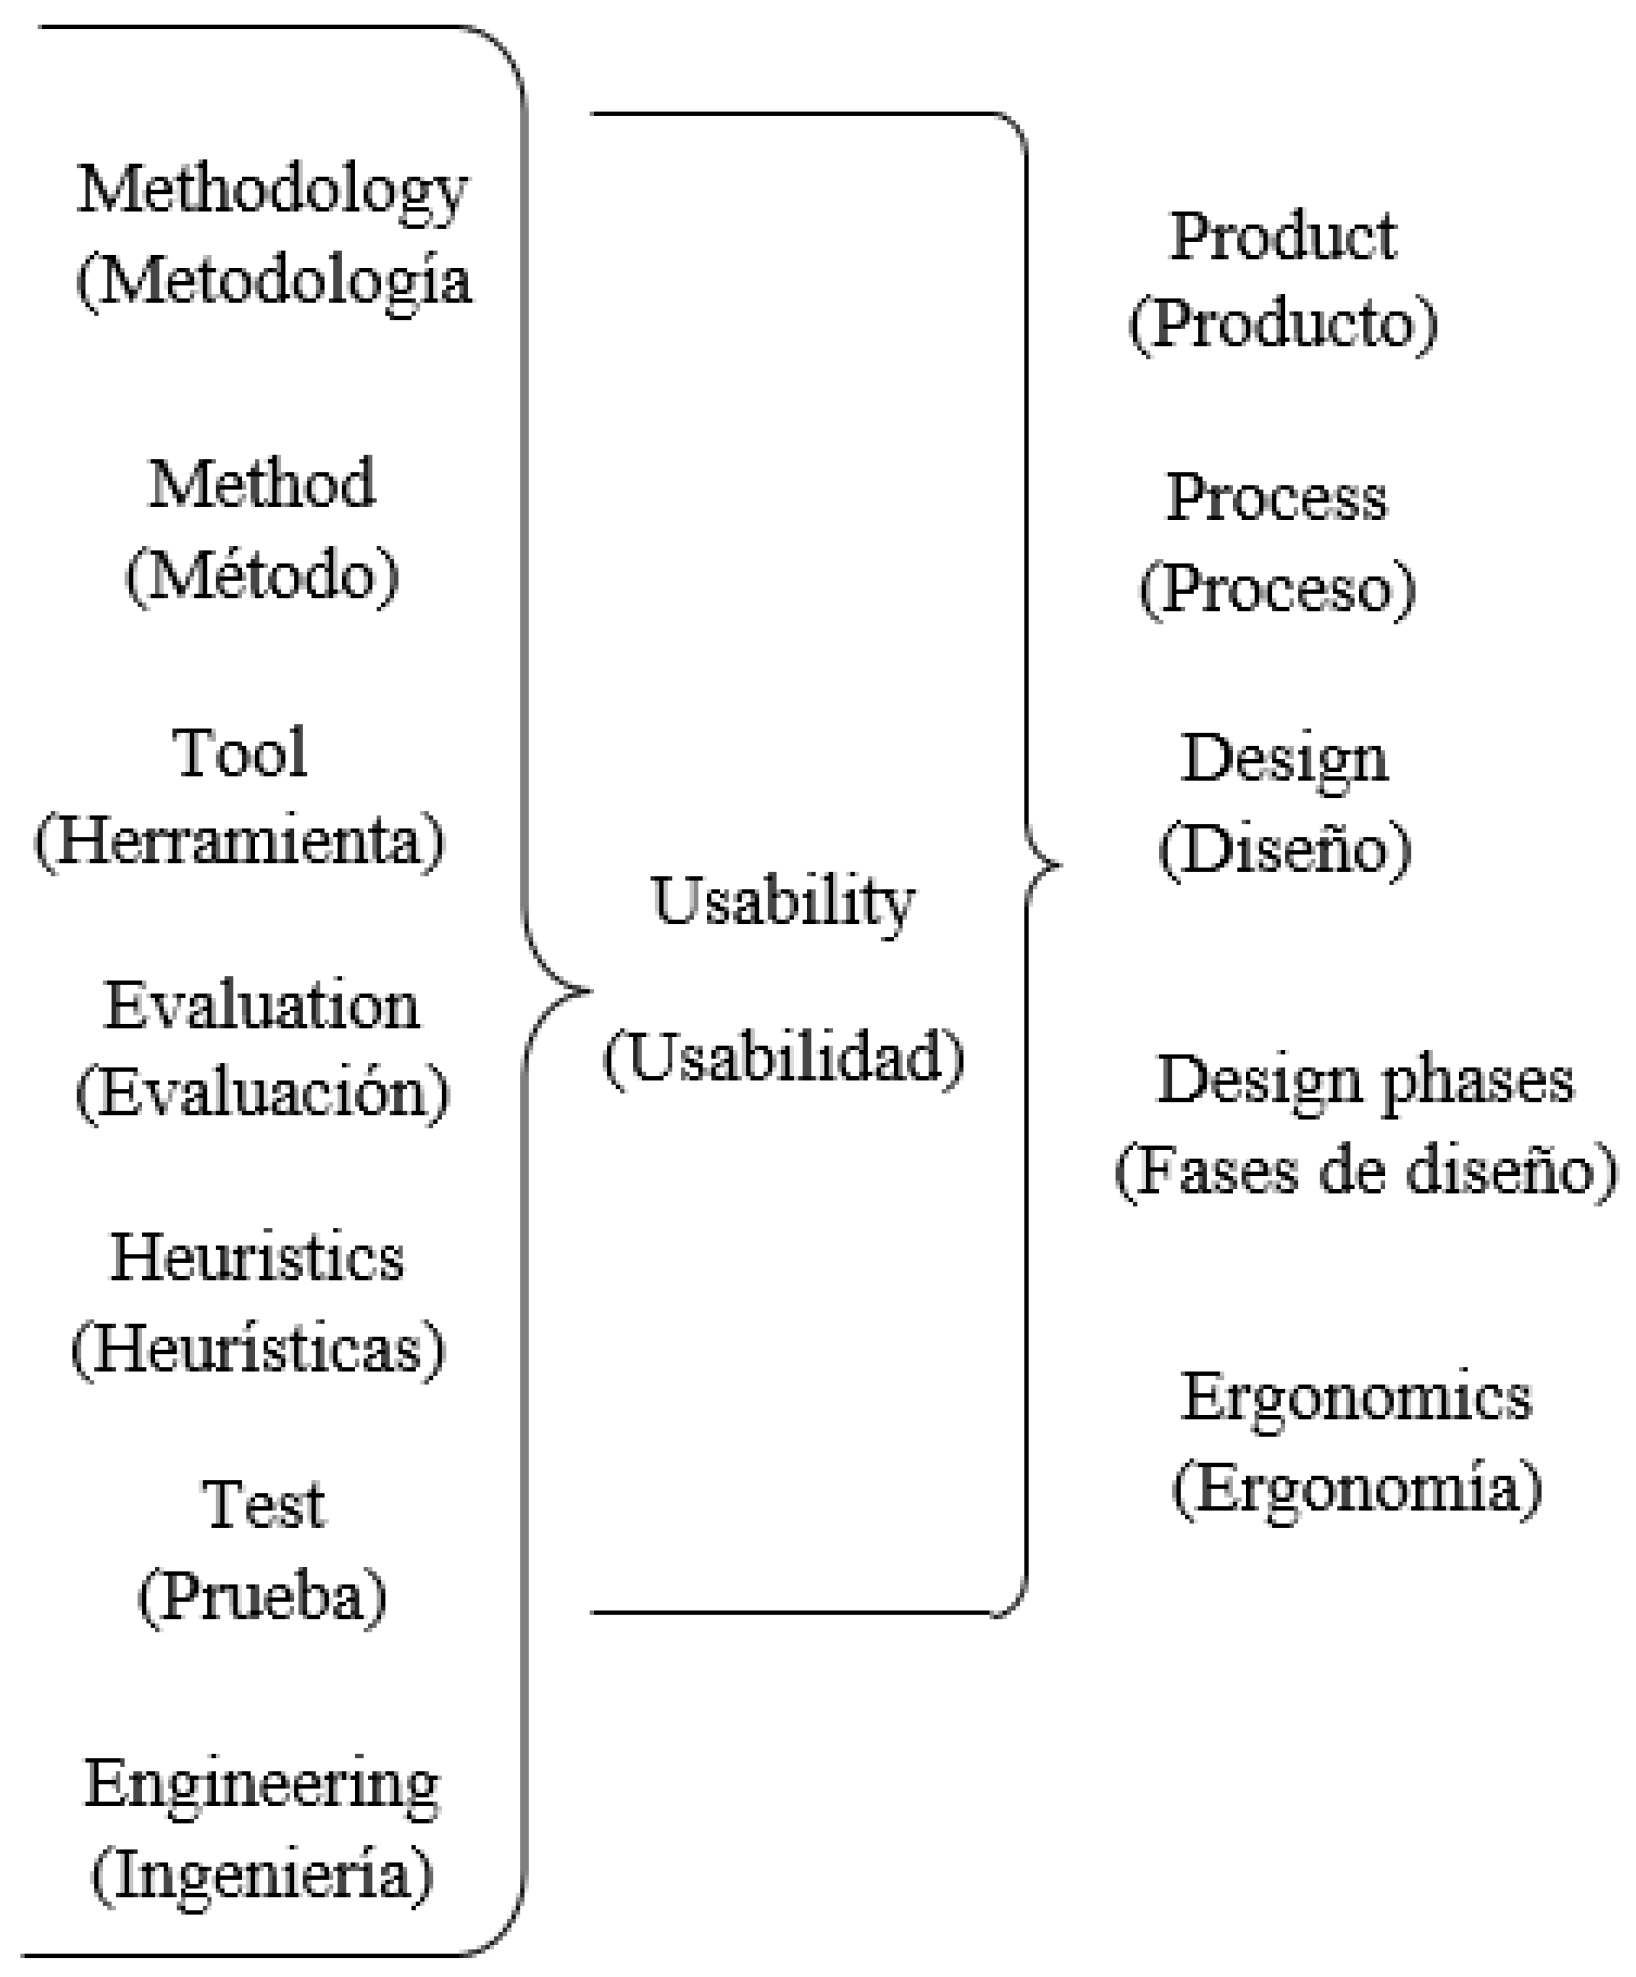
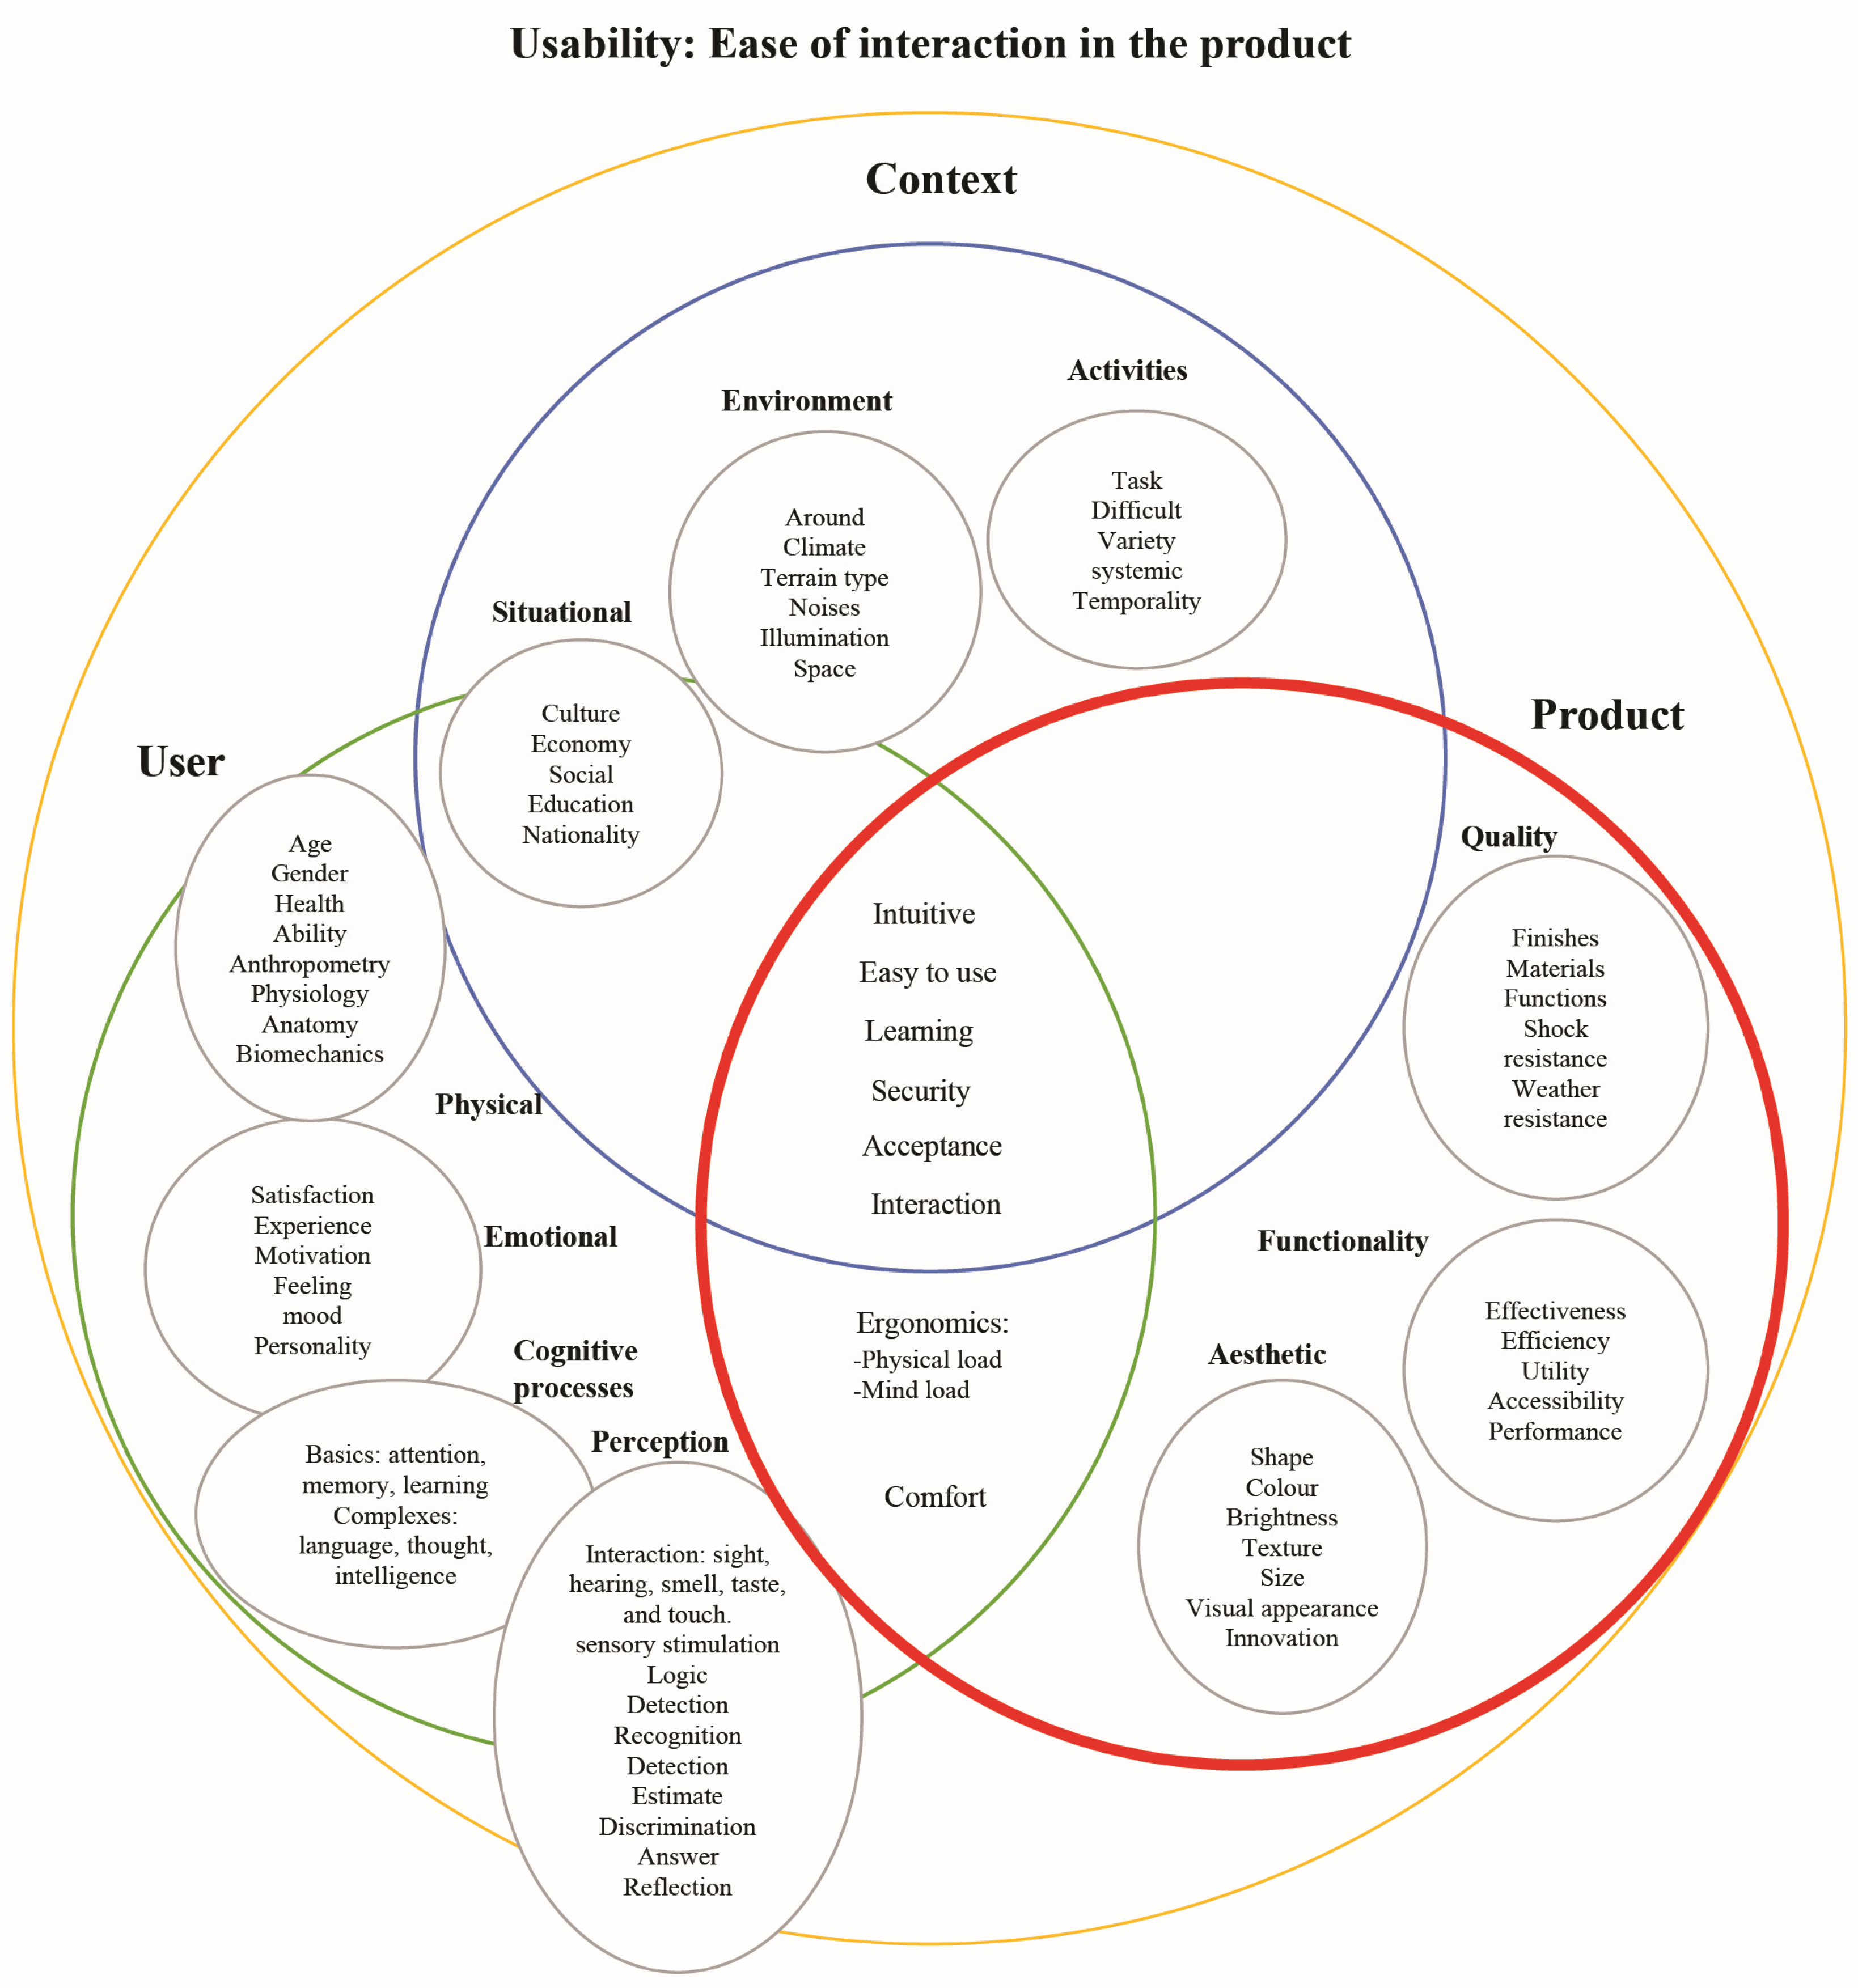
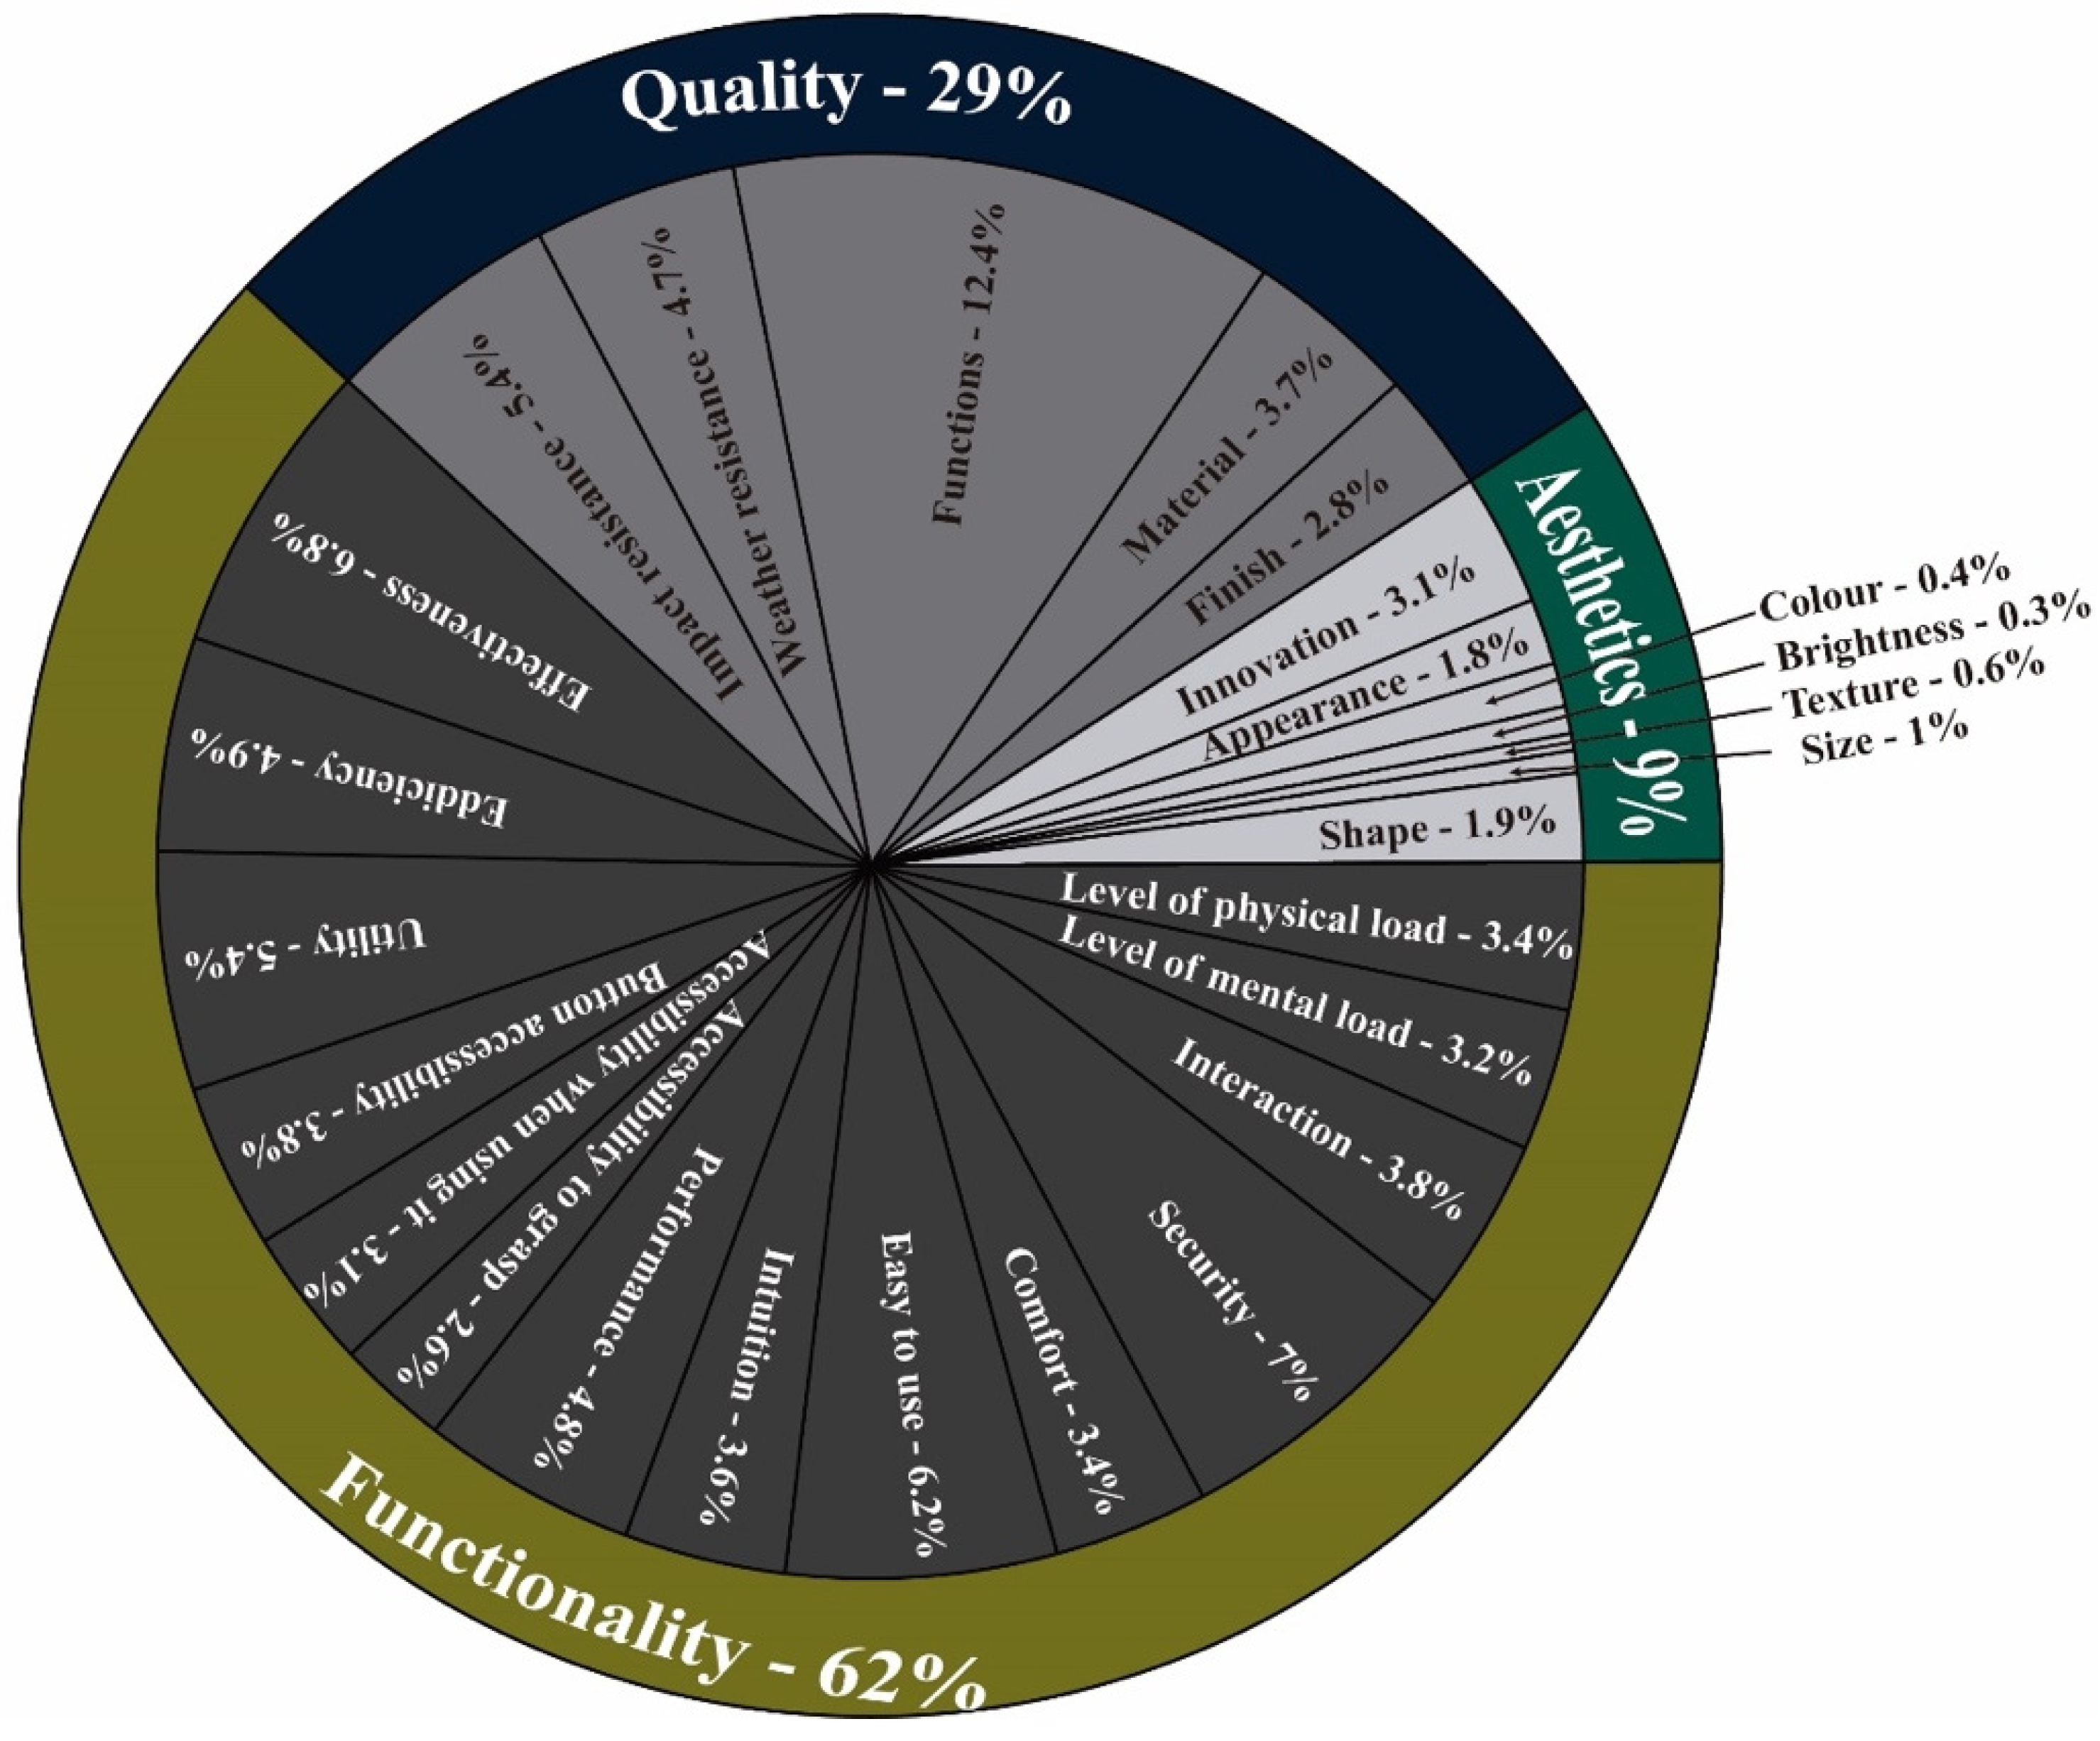
3.1. Attribute Identification—Literature Review to Obtain Weights and Set Boundaries for the Attributes
3.2. Working with the Attributes
3.2.1. Questionnaire Design
- The first questionnaire aimed to rank the usability attributes’ importance by obtaining a weight for them using a hierarchy pairwise comparison (in consistency with AHP). This questionnaire was administered only to experts in the field of evaluation chosen according to the type of product.
- The second questionnaire was used to measure the design range (axiomatic design), where the product is evaluated according to what the experts believe should be the lowest expected value for each product’s attributes. Questionnaires 1 and 2 should only be administered when the experts’ assessment of a type of product has yet to be given.
- The third questionnaire was designed to measure the system range (axiomatic design), which evaluates the product according to what it features, based on the attributes that are presented; it was administered only to users.
3.2.2. Administering Questionnaires to Experts
3.2.3. Cronbach’s Alpha Results: Tool Reliability
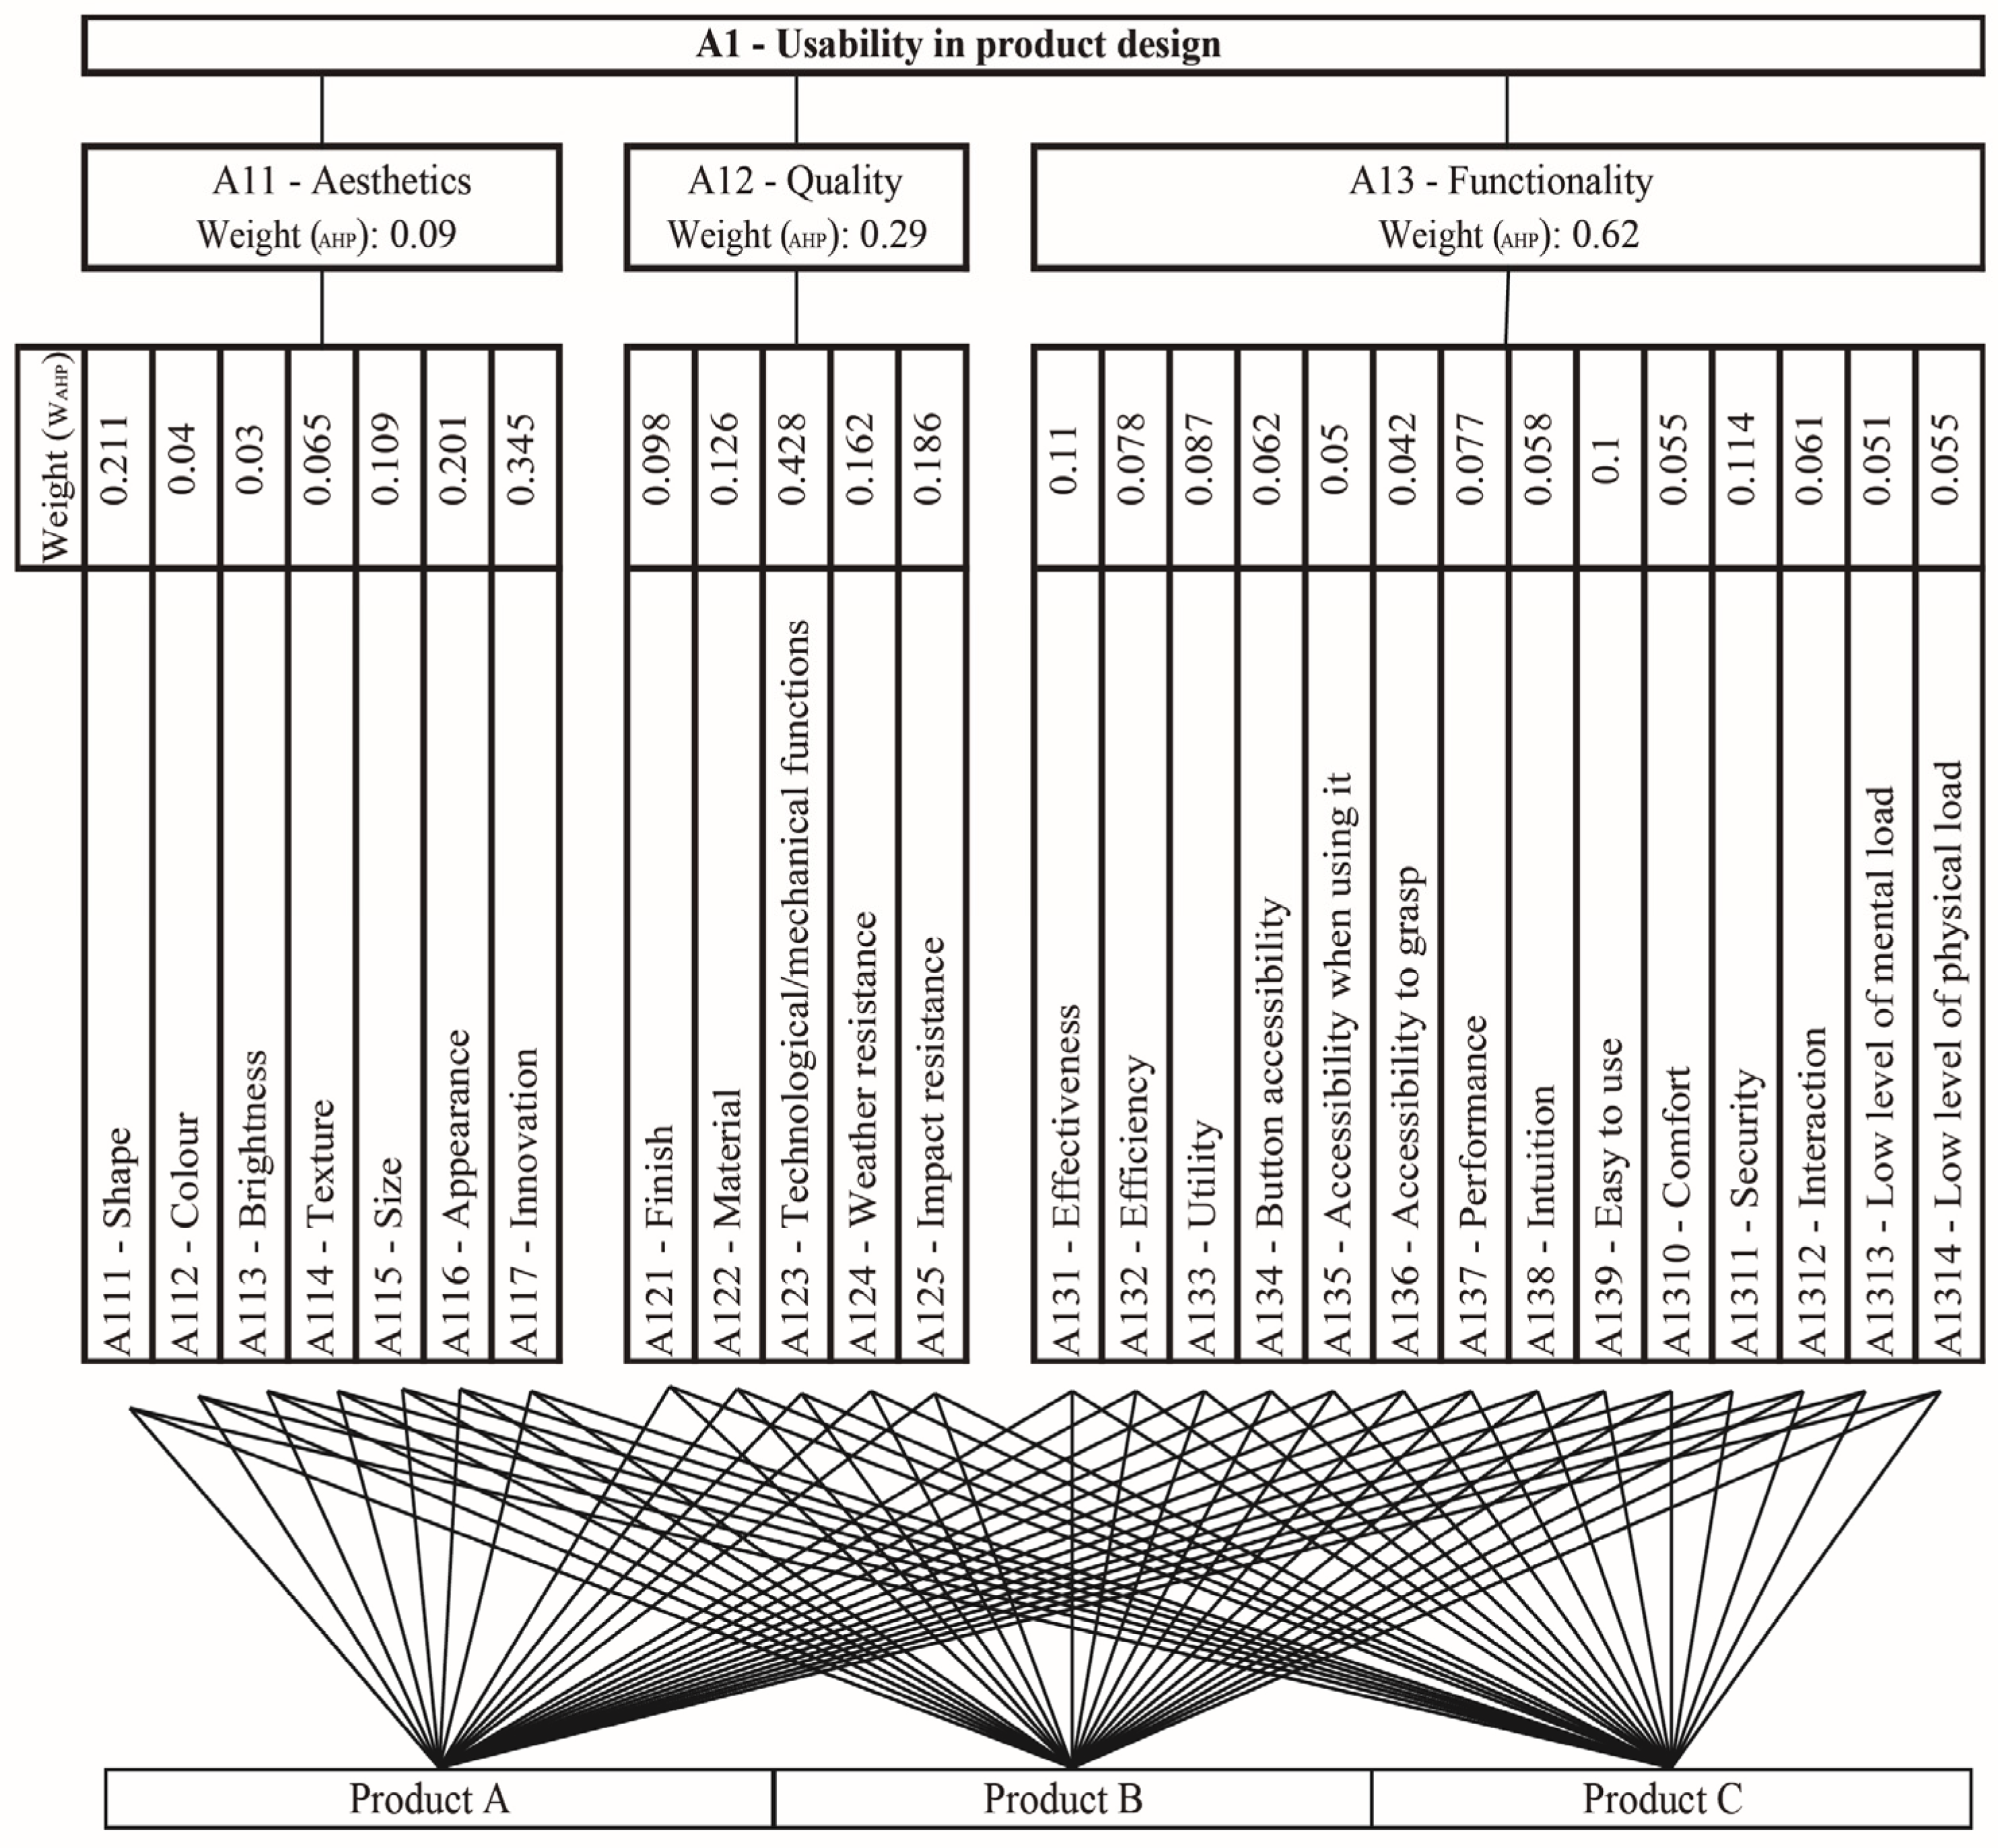
3.3. Obtaining a Weight for Each Attribute Using the AHP Tool (Questionnaire 1)
3.4. Obtaining Fuzzy Values—Fuzzy Axiomatic Design
3.4.1. Design Range Questionnaire Results
3.4.2. System Range Questionnaire Results and Experts’ Common Area
3.5. Establishing the Usability Level
Content of the Usability Information
3.6. Interpreting the Usability Level for Product Design
3.6.1. Minimum and Maximum TUIC Values
3.6.2. Usability Level Scale
3.6.3. TUIC, USind, and Products A, B, and C Usability Level
4. Discussion
5. Conclusions
Author Contributions
Funding
Data Availability Statement
Conflicts of Interest
References
- ISO 9241-11; Ergonomics of Human-System Interaction—Part 11: Usability: Definitions and Concepts. ISO: Geneva, Switzerland, 2018; p. 36. Available online: https://www.iso.org/standard/63500.html (accessed on 1 April 2024).
- Shneiderman, B.; Plaisant, C. Designing the User Interface: Strategies for Effective Human-Computer Interaction; Pearson Addison-Wesley: San Francisco, CA, USA, 2009; pp. 707–708. [Google Scholar]
- Norman, D. The Design of Everyday Things; Basic Books: New York, NY, USA, 2002; p. 78. [Google Scholar]
- Krug, S. Don’t Make Me Think: A Common Sense Approach to Web Usability; Pearson Education India: Chennai, India, 2000; p. 9. [Google Scholar]
- Esquivel, G. Ventajas y Desventajas Que Hay Detrás de la Experiencia de Usuario. 2018. Available online: http://cio.com.mx/ventajas-y-desventajas-que-hay-detras-de-la-experiencia-de-usuario/ (accessed on 5 May 2020).
- Hernández, E. Métodos y Técnicas de Evaluación de la Usabilidad sin Personas Usuarias. 2019. Available online: https://medium.com/@eliseohdez/métodos-y-técnicas-de-evaluación-de-la-usabilidad-sin-personas-usuarias-e8f7b03c8654 (accessed on 9 November 2019).
- Tractinsky, N. The Usability Construct: A Dead End? Hum.-Comput. Interact. 2018, 33, 131–177. [Google Scholar] [CrossRef]
- Tan, J.; Gencel, C.; Rönkkö, K. A Framework for Software Usability & User Experience in Mobile Industry. In Proceedings of the 2013 Joint Conference of the 23rd International Workshop on Software Measurement and the 8th International Conference on Software Process and Product Measurement, Ankara, Turkey, 23–26 October 2013; IEEE: Piscataway, NJ, USA; pp. 156–164. [Google Scholar]
- Heo, J.; Ham, D.; Park, S.; Song, C.; Yoon, W. A framework for evaluating the usability of mobile phones based on multi-level, hierarchical model of usability factor. Interact. Comput. 2009, 21, 263–275. [Google Scholar] [CrossRef]
- Audoux, K.; Segonds, F.; Kerbrat, O.; Aoussat, A. Selection method for multiple performances evaluation during early design stages. Procedia CIRP 2018, 70, 204–210. [Google Scholar] [CrossRef]
- Goo, B.; Lee, J.; Seo, S.; Chang, D.; Chung, H. Design of reliability critical system using axiomatic design with FMECA. Int. J. Nav. Archit. Ocean. Eng. 2019, 11, 11–21. [Google Scholar] [CrossRef]
- Baquero, L.; Rodríguez, O.; Ciudad, F. Lógica Difusa Basada en la Experiencia del Usuario para Medir la Usabilidad. Rev. Latinoam. Ing. Softw. 2016, 4, 48–54. [Google Scholar]
- Borsci, S.; Federici, S.; Malizia, A.; De Filippis, M.L. Shaking the usability tree: Why usability is not a dead end, and a constructive way forward. Behav. Inf. Technol. 2019, 38, 519–532. [Google Scholar] [CrossRef]
- Cross, N. Engineering Design Methods: Strategies for Product Design, 5th ed.; John Wiley & Sons: Hoboken, NJ, USA, 2021; p. 224. [Google Scholar]
- Shao, J.; Lu, F.; Zeng, C.; Xu, M. Research progress analysis of reliability design method based on axiomatic design theory. Procedia CIRP 2016, 53, 107–112. [Google Scholar] [CrossRef]
- Delaram, J.; Fatahi, O. An architectural view to computer integrated manufacturing systems based on Axiomatic Design Theory. Comput. Ind. 2018, 100, 96–114. [Google Scholar] [CrossRef]
- Aydoğan, S.; Günay, E.; Akay, D.; Okudan, G. Concept design evaluation by using Z-axiomatic design. Comput. Ind. 2020, 122, 103278. [Google Scholar] [CrossRef]
- Wu, X.; Liao, H. Utility-based hybrid fuzzy axiomatic design and its application in supply chain finance decision making with credit risk assessments. Comput. Ind. 2020, 114, 103144. [Google Scholar]
- Kulak, O.; Kahraman, C. Fuzzy multi-attribute equipment selection based on information axiom. J. Mater. Process. Technol. 2005, 169, 337–345. [Google Scholar] [CrossRef]
- Celik, M.; Kahraman, C.; Cebi, S.; Er, I. Fuzzy axiomatic design-based performance evaluation model for docking facilities in shipbuilding industry: The case of Turkish shipyards. Expert Syst. Appl. 2009, 36, 599–615. [Google Scholar] [CrossRef]
- Maldonado, A.; García, J.; Alvarado, A.; Balderrama, C. A hierarchical fuzzy axiomatic design methodology for ergonomic compatibility evaluation of advanced manufacturing technology. Int. J. Adv. Manuf. Technol. 2013, 66, 171–186. [Google Scholar] [CrossRef]
- Karatas, M. Hydrogen energy storage method selection using fuzzy axiomatic design and analytic hierarchy process. Int. J. Hydrogen Energy 2020, 45, 16227–16238. [Google Scholar] [CrossRef]
- Saaty, T.L. The Modern Science of Multicriteria Decision Making and Its Practical Applications: The AHP/ANP Approach. Oper. Res. 2013, 61, 1101–1118. [Google Scholar] [CrossRef]
- Saaty, T. Decision making with the analytic hierarchy process. Int. J. Serv. Sci. 2008, 1, 16. [Google Scholar] [CrossRef]
- Maldonado, A.; Alvarado, A.; García, J.; Balderrama, C. Intuitionistic fuzzy TOPSIS for ergonomic compatibility evaluation of advanced manufacturing technology. Int. J. Adv. Manuf. Technol. 2014, 70, 2283–2292. [Google Scholar] [CrossRef]
- Awan, U.; Hannola, L.; Tandon, A.; Kumar, R.; Dhir, A. Quantum computing challenges in the software industry. A fuzzy AHP-based approach. Inf. Softw. Technol. 2022, 147, 106896. [Google Scholar] [CrossRef]
- Entani, T.; Sugihara, K.; Tanaka, H. Interval Evaluations in DEA and AHP. In Fuzzy Applications in Industrial Engineering; Springer: Berlin/Heidelberg, Germany, 2006; pp. 291–304. [Google Scholar]
- Mendoza, A.; Solano, C.; Palencia, D.; Garcia, D. Aplicación del proceso de jerarquía analítica (AHP) para la toma de decisión con juicios de expertos. Ingeniare Rev. Chil. Ing. 2019, 27, 348–360. [Google Scholar] [CrossRef]
- Quiroz, J.; García, M. Aplicación de diseño axiomático en el desarrollo de productos escolares con plásticos bio-basados. Acad. J. 2020, 12, 1657–1662. [Google Scholar]
- Kulak, O.; Cebi, S.; Kahraman, C. Applications of axiomatic design principles: A literature review. Expert Syst. Appl. 2010, 37, 6705–6717. [Google Scholar] [CrossRef]
- Ruvalcaba Coyaso, F.J.; Vermoden, A. Lógica difusa para la toma de decisiones y la selección de personal. Univ. Empresa 2015, 17, 239–256. [Google Scholar] [CrossRef]
- Maldonado, A.; Balderrama, C.; Pedrozo, J.; Carcía, J. Diseño Axiomático: Libro de Fundamentos y Aplicaciones; Universidad de la Rioja: Logrono, Spain, 2019; p. 166. [Google Scholar]
- Suh, N. The Principles of Design; Oxford University Press: Oxford, UK, 1990; p. 418. [Google Scholar]
- Suh, N.; Farid, A. Axiomatic Design in Large Systems: Complex Products, Buildings and Manufacturing Systems; Springer: Berlin/Heidelberg, Germany, 2016. [Google Scholar]
- Taherdoost, H. What Is the Best Response Scale for Survey and Questionnaire Design; Review of Different Lengths of Rating Scale/Attitude Scale/Likert Scale. Int. J. Acad. Res. Manag. (IJARM) 2020, 8, 1–10. [Google Scholar]
- Bisquerra, R.; Pérez-Escoda, N. ¿Pueden las escalas Likert aumentar en sensibilidad? REIRE Rev. D’innovació I Recer. En Educ. 2015, 8, 129–147. [Google Scholar]
- Nielsen, J. Finding usability problems through heuristic evaluation. In CHI, Proceedings of the SIGCHI Conference on Human Factors in Computing Systems; ACM Press: New York, NY, USA, 1992; Volume 1, pp. 373–380. [Google Scholar]
- Nielsen, J.; Landauer, T. A Mathematical Model of the Finding of Usability Problems. INTERCHI 1993, 1, 206–213. [Google Scholar]
- Saunila, M.; Nasiri, M.; Ukko, J.; Rantala, T. Smart technologies and corporate sustainability: The mediation effect of corporate sustainability strategy. Comput. Ind. 2019, 108, 178–185. [Google Scholar] [CrossRef]
- Suh, N. Axiomatic Design: Advances and Applications; Oxford University Press: Oxford, UK, 2001; p. 503. [Google Scholar]
- Calvo, A.; Ortega, S.; Saez, A. Métodos de Evaluación con Usuarios; Universitat Oberta de Catalunya: Barcelona, Spain, 2011. [Google Scholar]
- Maghsoodi, A.; Mosavat, M.; Hafezalkotob, A.; Hafezalkotob, A. Hybrid hierarchical fuzzy group decision-making based on information axioms and BWM: Prototype design selection. Comput. Ind. Eng. 2019, 127, 788–804. [Google Scholar] [CrossRef]
- Subulan, K.; Baykasoğlu, A. An Improved Extension of Weighted Hierarchical Fuzzy Axiomatic Design; CRC Press: Boca Raton, FL, USA, 2021; p. 31. [Google Scholar]
- Gölcük, İ. An interval type-2 fuzzy axiomatic design method: A case study for evaluating blockchain deployment projects in supply chain. Inf. Sci. 2022, 602, 159–183. [Google Scholar] [CrossRef]
- Chakraborty, K.; Mondal, S.; Mukherjee, K. Analysis of product design characteristics for remanufacturing using Fuzzy AHP and Axiomatic Design. J. Eng. Des. 2017, 28, 338–368. [Google Scholar] [CrossRef]
- Feng, J. Wind farm site selection from the perspective of sustainability: A novel satisfaction degree-based fuzzy axiomatic design approach. Int. J. Energy Res. 2021, 45, 1097. [Google Scholar] [CrossRef]
- Utamura, S.; Murase, C.; Hamatani, V.; Nagano, Y. User Experience Index Scale—Quantifying Usability by Magnitude Estimation. Fujitsu Sci. Tech. J. 2009, 45, 219–225. [Google Scholar]
- Kim, J.; Han, S. A methodology for developing a usability index of consumer electronic products. Int. J. Ind. Ergon. 2008, 38, 333–345. [Google Scholar] [CrossRef]
- Brandy, A.; Mantelet, F.; Aoussat, A.; Pigot, P. Proposal for a new usability index for product design teams and the general public. In Proceedings of the 21st International Conference on Engineering Design (ICED17), Vancouver, BC, Canada, 21–25 August 2017; Volume 8, pp. 199–208. [Google Scholar]

Importance of Comparison between Attributes | |||||||||
|---|---|---|---|---|---|---|---|---|---|
| Absolutely More Important | Strongly Most Importantly | Moderately More Important | Weakly More Important | Equally Important | Weakly More Important | Moderately More Important | Strongly Most Importantly | Absolutely More Important | |
| Regarding the usability of the product. How important is functionality versus product quality? | |||||||||
| Regarding the usability of the product. How important is the functionality versus the aesthetics of the product? | |||||||||
| Regarding the usability of the product. How important is quality versus aesthetics? | |||||||||
| Product | Description |
|---|---|
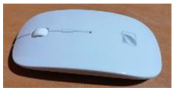 | Product A: Slimline Mouse–Wireless 2.4 GHz USB receiver 4 buttons (left, right, cursor movement speed and scroll click) Scroll Two AAA batteries |
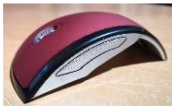 | Product B: Ergonomic Optical Mouse–Wireless 2.4 GHz USB receiver 3 buttons (left, right and scroll click) Scroll Two AAA batteries Automatic energy saving |
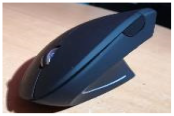 | Product C: Ergonomic Vertical Mouse–Wireless USB receiver 6 buttons (left, right, up and down in the window, next or back in the window and click to scroll) Scroll Power source: USB cable for charging |
| Cronbach’s Alpha | |
|---|---|
| Questionnaire 1—Importance of attributes—Pairwise comparison | 0.917 |
| Questionnaire 2—Design Range | 0.955 |
| Questionnaire 3—System Range: Product A | 0.929 |
| Questionnaire 3—System Range: Product B | 0.950 |
| Questionnaire 3—System Range: Product C | 0.914 |
| Aesthetics | Quality | Functionality | |
|---|---|---|---|
| CI | 0.18 | 0.11 | 0.09 |
| RI | 1.34 | 1.115 | 1.57 |
| CR | 0.12 | 0.101 | 0.059 |
| Fuzzy Values | |||||
|---|---|---|---|---|---|
| Experts | 1 | 2 | 3 | 4 | 5 |
| Group | Aesthetics | ||||
| Shape | (0.4, 1, 1) | (0.6, 1, 1) | (0.2, 1, 1) | (0.4, 1, 1) | (0.4, 1, 1) |
| Colour | (0.2, 1, 1) | (0.4, 1, 1) | (0, 1, 1) | (0.6, 1, 1) | (0.2, 1, 1) |
| Brightness | (0.2, 1, 1) | (0, 1, 1) | (0, 1, 1) | (0.6, 1, 1) | (0.2, 1, 1) |
| Texture | (0.4, 1, 1) | (0.6, 1, 1) | (0.2, 1, 1) | (0.4, 1, 1) | (0.2, 1, 1) |
| Size | (0.4, 1, 1) | (0.4, 1, 1) | (0.4, 1, 1) | (0.2, 1, 1) | (0.4, 1, 1) |
| Appearance | (0.4, 1, 1) | (0.8, 1, 1) | (0, 1, 1) | (0.6, 1, 1) | (0.2, 1, 1) |
| Innovation | (0.6, 1, 1) | (0.8, 1, 1) | (0, 1, 1) | (0.4, 1, 1) | (0.4, 1, 1) |
| Assigned Rating of the Evaluation—Product A | |
|---|---|
| Aesthetics | Fuzzy Values |
| Shape | (0.2, 0.29, 0.5) |
| Colour | (0.16, 0.22, 0.46) |
| Brightness | (0.16, 0.22, 0.46) |
| Texture | (0.28, 0.37, 0.58) |
| Size | (0.44, 0.59, 0.74) |
| Appearance | (0.28, 0.37, 0.58) |
| Innovation | (0.16, 0.25, 0.46) |
| Product A | Product B | Product C |
|---|---|---|
| Attribute: shape | Attribute: shape | Attribute: shape |
| Design Range—Red Color: (0.2, 1, 1) | Design Range—Red Color: (0.2, 1, 1) | Design Range—Red Color: (0.2, 1, 1) |
| System Range—Green Color: (0.2, 0.29, 0.5) | System Range—Green Color: (0.44, 0.59, 0.74) | System Range—Green Color: (0.4, 0.55, 0.7) |
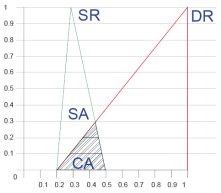 | 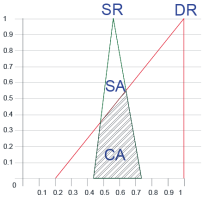 |  |
| System Area—Green Triangle: 0.1484 | System Area—Green Triangle: 0.149 | System Area—Green Triangle: 0.1483 |
| Common area—hatching area: 0.042 | Common area—hatching area: 0.105 | Common area—hatching area: 0.099 |
| Attributes | Common Area | System Area | UIC | W of Secondary Attributes | UIC of Secondary Attributes (UIC × Wsecondary) | W of Primary Attributes | UIC of Primary Attributes (UIC of Secondary Attributes × Wprimary) | ||||||||||
|---|---|---|---|---|---|---|---|---|---|---|---|---|---|---|---|---|---|
| A | B | C | A | B | C | A | B | C | A-B-C | A | B | C | A-B-C | A | B | C | |
| A111—Shape | 0.094 | 0.116 | 0.097 | 0.146 | 0.145 | 0.143 | 0.639 | 0.320 | 0.564 | 0.211 | 0.135 | 0.068 | 0.119 | 0.09 | 0.011 | 0.006 | 0.010 |
| A112—Colour | 0.114 | 0.114 | 0.121 | 0.139 | 0.139 | 0.135 | 0.282 | 0.285 | 0.157 | 0.040 | 0.011 | 0.011 | 0.006 | 0.09 | 0.001 | 0.001 | 0.001 |
| A113—Brightness | 0.118 | 0.117 | 0.074 | 0.147 | 0.142 | 0.092 | 0.320 | 0.274 | 0.321 | 0.030 | 0.010 | 0.008 | 0.010 | 0.09 | 0.001 | 0.001 | 0.001 |
| A114—Texture | 0.092 | 0.113 | 0.106 | 0.149 | 0.149 | 0.149 | 0.690 | 0.404 | 0.489 | 0.065 | 0.045 | 0.026 | 0.032 | 0.09 | 0.004 | 0.002 | 0.003 |
| A115—Size | 0.088 | 0.111 | 0.065 | 0.148 | 0.147 | 0.143 | 0.749 | 0.408 | 1.146 | 0.109 | 0.082 | 0.044 | 0.125 | 0.09 | 0.007 | 0.004 | 0.011 |
| A116—Appearance | 0.115 | 0.123 | 0.107 | 0.142 | 0.142 | 0.130 | 0.304 | 0.206 | 0.275 | 0.201 | 0.061 | 0.041 | 0.055 | 0.09 | 0.005 | 0.004 | 0.005 |
| A117—Innovation | 0.099 | 0.125 | 0.122 | 0.151 | 0.147 | 0.134 | 0.608 | 0.239 | 0.134 | 0.345 | 0.209 | 0.082 | 0.046 | 0.09 | 0.018 | 0.007 | 0.004 |
| A121—Finish | 0.092 | 0.107 | 0.112 | 0.144 | 0.142 | 0.144 | 0.654 | 0.402 | 0.364 | 0.098 | 0.064 | 0.039 | 0.036 | 0.29 | 0.019 | 0.011 | 0.010 |
| A122—Material | 0.073 | 0.115 | 0.110 | 0.146 | 0.152 | 0.137 | 0.997 | 0.404 | 0.314 | 0.126 | 0.126 | 0.051 | 0.040 | 0.29 | 0.037 | 0.015 | 0.012 |
| A123—Functions | 0.101 | 0.113 | 0.108 | 0.144 | 0.141 | 0.146 | 0.512 | 0.325 | 0.438 | 0.428 | 0.219 | 0.139 | 0.187 | 0.29 | 0.064 | 0.041 | 0.055 |
| A124—Weather resistance | 0.075 | 0.093 | 0.095 | 0.150 | 0.150 | 0.147 | 0.998 | 0.685 | 0.625 | 0.162 | 0.162 | 0.111 | 0.101 | 0.29 | 0.047 | 0.032 | 0.030 |
| A125—Impact resistance | 0.036 | 0.084 | 0.107 | 0.147 | 0.152 | 0.147 | 2.050 | 0.854 | 0.457 | 0.186 | 0.381 | 0.159 | 0.085 | 0.29 | 0.111 | 0.046 | 0.025 |
| A131—Effectiveness | 0.123 | 0.119 | 0.098 | 0.223 | 0.217 | 0.210 | 0.852 | 0.869 | 1.103 | 0.110 | 0.094 | 0.096 | 0.121 | 0.62 | 0.059 | 0.060 | 0.076 |
| A132—Efficiency | 0.084 | 0.127 | 0.053 | 0.194 | 0.227 | 0.213 | 1.216 | 0.841 | 2.013 | 0.078 | 0.095 | 0.066 | 0.158 | 0.62 | 0.059 | 0.041 | 0.098 |
| A133—Utility | 0.116 | 0.118 | 0.101 | 0.139 | 0.139 | 0.145 | 0.256 | 0.242 | 0.519 | 0.087 | 0.022 | 0.021 | 0.045 | 0.62 | 0.014 | 0.013 | 0.028 |
| A134—Button accessibility | 0.097 | 0.106 | 0.098 | 0.146 | 0.137 | 0.145 | 0.588 | 0.371 | 0.560 | 0.062 | 0.037 | 0.023 | 0.035 | 0.62 | 0.023 | 0.014 | 0.022 |
| A135—Accessibility when using it | 0.109 | 0.115 | 0.086 | 0.147 | 0.143 | 0.147 | 0.422 | 0.307 | 0.771 | 0.050 | 0.021 | 0.015 | 0.039 | 0.62 | 0.013 | 0.010 | 0.024 |
| A136—Accessibility to grasp | 0.087 | 0.105 | 0.077 | 0.146 | 0.143 | 0.146 | 0.742 | 0.443 | 0.918 | 0.042 | 0.031 | 0.019 | 0.039 | 0.62 | 0.019 | 0.012 | 0.024 |
| A137—Performance | 0.046 | 0.075 | 0.075 | 0.147 | 0.147 | 0.140 | 1.688 | 0.982 | 0.891 | 0.077 | 0.130 | 0.076 | 0.069 | 0.62 | 0.081 | 0.047 | 0.043 |
| A138—Intuition | 0.123 | 0.075 | 0.073 | 0.136 | 0.202 | 0.154 | 0.151 | 1.435 | 1.072 | 0.058 | 0.009 | 0.083 | 0.062 | 0.62 | 0.005 | 0.051 | 0.038 |
| A139—Easy to use | 0.117 | 0.120 | 0.079 | 0.137 | 0.139 | 0.150 | 0.229 | 0.211 | 0.924 | 0.100 | 0.023 | 0.021 | 0.092 | 0.62 | 0.014 | 0.013 | 0.057 |
| A1310—Comfort | 0.074 | 0.111 | 0.073 | 0.144 | 0.142 | 0.145 | 0.972 | 0.354 | 0.994 | 0.055 | 0.053 | 0.019 | 0.054 | 0.62 | 0.033 | 0.012 | 0.034 |
| A1311—Security | 0.085 | 0.116 | 0.083 | 0.141 | 0.148 | 0.141 | 0.742 | 0.350 | 0.771 | 0.114 | 0.084 | 0.040 | 0.088 | 0.62 | 0.052 | 0.025 | 0.055 |
| A1312—Interaction | 0.090 | 0.094 | 0.039 | 0.150 | 0.139 | 0.147 | 0.737 | 0.569 | 1.913 | 0.061 | 0.045 | 0.035 | 0.117 | 0.62 | 0.028 | 0.022 | 0.073 |
| A1313—Level of mental load | 0.061 | 0.097 | 0.042 | 0.216 | 0.139 | 0.210 | 1.834 | 0.525 | 2.339 | 0.051 | 0.094 | 0.027 | 0.120 | 0.62 | 0.059 | 0.017 | 0.075 |
| A1314—Level of physical load | 0.075 | 0.093 | 0.048 | 0.202 | 0.216 | 0.209 | 1.435 | 1.212 | 2.115 | 0.055 | 0.079 | 0.067 | 0.116 | 0.62 | 0.049 | 0.042 | 0.073 |
| TUIC | 0.834 | 0.548 | 0.884 | ||||||||||||||
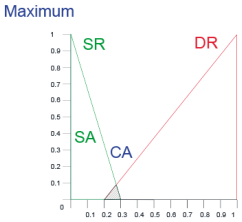 | Attribute: shape |
| Common area: 0.0045 | |
| System area: 0.15 | |
| UIC: 5059 | |
| Secondary Attribute W: 0.211 | |
| Secondary Attribute UIC: 1067 | |
| Primary Attribute W: 0.085 | |
| Primary Attribute UIC: 0.091 | |
| TUIC-Maximum | 4.878 |
| Usability Index Level | ||
|---|---|---|
| Level | TUIC | USind |
| Excellent | 0–0.696 | 0.8569–1 |
| Very good | 0.697–1.392 | 0.7142–0.8568 |
| Good | 1.393–2.088 | 0.5713–0.7140 |
| Regular | 2.089–2.784 | 0.4285–0.5712 |
| Poor | 2.785–3.480 | 0.2857–0.4284 |
| Very poor | 3.481–4.176 | 0.1429–0.2856 |
| Appalling | 4.177–4.878 | 0–0.1428 |
| NOTE | The lower the information content, the better | The higher the value of the index, the better (Equation (6)) |
| Product A | Product B | Product C | |||
|---|---|---|---|---|---|
| USind | Usability Index Level | USind | Usability Index Level | USind | Usability Index Level |
| 0.829 | Very good | 0.887 | Excellent | 0.819 | Very good |
Disclaimer/Publisher’s Note: The statements, opinions and data contained in all publications are solely those of the individual author(s) and contributor(s) and not of MDPI and/or the editor(s). MDPI and/or the editor(s) disclaim responsibility for any injury to people or property resulting from any ideas, methods, instructions or products referred to in the content. |
© 2024 by the authors. Licensee MDPI, Basel, Switzerland. This article is an open access article distributed under the terms and conditions of the Creative Commons Attribution (CC BY) license (https://creativecommons.org/licenses/by/4.0/).
Share and Cite
Peña-Ontiveros, M.I.; Balderrama-Armendariz, C.O.; Rossa-Sierra, A.; Maldonado-Macias, A.A.; Cortés Sáenz, D.; Hernández Arellano, J.L. Human–Object Interaction: Development of a Usability Index for Product Design Using a Hierarchical Fuzzy Axiomatic Design. Computation 2024, 12, 130. https://doi.org/10.3390/computation12060130
Peña-Ontiveros MI, Balderrama-Armendariz CO, Rossa-Sierra A, Maldonado-Macias AA, Cortés Sáenz D, Hernández Arellano JL. Human–Object Interaction: Development of a Usability Index for Product Design Using a Hierarchical Fuzzy Axiomatic Design. Computation. 2024; 12(6):130. https://doi.org/10.3390/computation12060130
Chicago/Turabian StylePeña-Ontiveros, Mayra Ivette, Cesar Omar Balderrama-Armendariz, Alberto Rossa-Sierra, Aide Aracely Maldonado-Macias, David Cortés Sáenz, and Juan Luis Hernández Arellano. 2024. "Human–Object Interaction: Development of a Usability Index for Product Design Using a Hierarchical Fuzzy Axiomatic Design" Computation 12, no. 6: 130. https://doi.org/10.3390/computation12060130
APA StylePeña-Ontiveros, M. I., Balderrama-Armendariz, C. O., Rossa-Sierra, A., Maldonado-Macias, A. A., Cortés Sáenz, D., & Hernández Arellano, J. L. (2024). Human–Object Interaction: Development of a Usability Index for Product Design Using a Hierarchical Fuzzy Axiomatic Design. Computation, 12(6), 130. https://doi.org/10.3390/computation12060130