Article

Development and Verification of Coupled Fluid–Structure Interaction Solver

1
US Army Corps of Engineers, Vicksburg, MS 39180, USA
2
Center for Advanced Vehicular Systems, Mississippi State University, Starkville, MS 39759, USA
3
Department of Mechanical Engineering, Mississippi State University, Starkville, MS 39759, USA
*
Author to whom correspondence should be addressed.
Computation 2024, 12(6), 129; https://doi.org/10.3390/computation12060129
Submission received: 16 May 2024 / Revised: 12 June 2024 / Accepted: 17 June 2024 / Published: 20 June 2024

Abstract

:
Recent trends in aeroelastic analysis have shown a great interest in understanding the role of shock boundary layer interaction in predicting the dynamic instability of aircraft structural components at supersonic and hypersonic flows. The analysis of such complex dynamics requires a time-accurate fluid-structure interaction solver. This study focuses on the development of such a solver by coupling a finite-volume Navier-Stokes solver for fluid flow with a finite-element solver for structural dynamics. The coupled solver is then verified for the prediction of several panel instability cases in 2D and 3D uniform flows and in the presence of an impinging shock for a range of subsonic and supersonic Mach numbers, dynamic pressures, and shock strengths. The panel deflections and limit cycle oscillation amplitudes, frequencies, and bifurcation point predictions were compared within 10 % of the benchmark results; thus, the solver was deemed verified. Future studies will focus on extending the solver to 3D turbulent flows and applying the solver to study the effect of turbulent load fluctuations and shock boundary layer interactions on the fluid-structure coupling and structural dynamics of 2D panels.

1. Introduction

The use of lightweight composite aero-structures for high-speed vehicles has renewed the interest in studying the stability of structural components subjected to the combined inertial, elastic, and aerodynamic loads. Supersonic flight trajectories involve segments of transonic flow regimes with mixed supersonic/subsonic flow and shock-boundary layer interactions (SBLI) over the surface of the vehicle. Such flows involve complex fluid-structure interactions (FSI), wherein the loads can result in a wide range of physical phenomena or engineering problems involving dynamic aeroelasticity, such as flutter and buffeting [1,2]. The forces acting on a body trigger a sustained unsteadiness or structural vibrations called Flutter (or Buffet), leading to material fatigue and premature failure of the structural members. Hence, it is important to study and understand the impact of flow and structural parameters on a system’s stability characteristics.
Several numerical techniques have been used to predict and/or improve understanding of fluid-structure interactions in transonic flows in order to assist in the design of next-generation aircraft. The Piston theories, time-accurate partitioned, and monolithic FSI approaches are among the most widely used methods to assist with this analysis. Piston theories are low fidelity FSI solvers, wherein the aerodynamic forces are estimated from the surface pressure predictions obtained using an analytic model based on the structural deflection and normal velocity [3,4]. These fluid loads are coupled with the transient structural solver to drive the FSI in time. In recent studies, Ganji and Dowell [5] developed an aerodynamic damping enhanced piston theory to predict the flutter of a semi-infinite panel for a low supersonic range (M from 1 to 2 ). The study reported that the enhanced model can predict single-mode flutter expected in low M ranges, which the classical piston theory fails to predict. Brouwer et al. [6] further enhanced the piston theory with a quasi-steady flow assumption where the linear perturbations in the surface pressure were added to a local pressure obtained from a steady CFD solution. The model was applied for stationary and oscillating shock impingement in two- and three-dimensional flows and the results were compared against the benchmark Euler and URANS simulations. The proposed approach was able to capture shock-induced limit cycle oscillations accurately. However, the model showed deficiencies for higher mode surface deformations when the viscous effects become important. These approaches have been used successfully in approximating the flutter boundary, characteristics of the flutter response (like amplitude and frequency) and guiding intuitive flutter control strategies [7,8,9].
The monolithic approach requires simultaneous discretization of the governing equations for both the fluid and structural disciplines with coupled Jacobian terms at the FSI boundary [10]. In contrast, the partitioned approaches typically involve establishing some form of communication of loads and displacements between established (or purpose-built) standalone fluid and structural dynamic solvers [11]. A survey of the literature, as below, shows that partitioned approaches are more common than monolithic solvers, as they can leverage validated solvers in either domain. Several studies have coupled the inviscid Euler equation solver for aerodynamics with a modal structural dynamics solver [12]. Lee-Rausch [13] applied this model to examine the transonic flutter boundaries of an AGARD 445.6 airfoil. The results compared well with the experiments for M < 1 but also predicted a premature rise in flutter boundary for M > 1 . Chen et al. [14] applied the model for three-dimensional transonic wing flutter for the AGARD 445.6 configuration and reported reasonable agreements with the experiment. Visbal [15] coupled Euler equations for fluid flow with the von Karman plate equations for structural dynamics. The nonlinear von Karman strain, which is a simplification of the Green-Lagrange strain for thin bending structures provides the coupling between in-plane and moderately large transverse deflections. The model was applied for the simulation of semi-infinite panel flutter due to shock impingement. The study showed, for the first time, that a shock of sufficient strength could induce bifurcation at a significantly lower dynamic pressure than that of the standard panel flutter.
Shishaeva, Vedeneev, and Aksenov [16] used Mindlin plate theory combined with a nonlinear von Karman strain. They applied the solver for finite panel flutter simulations. The results demonstrated the existence of non-periodic oscillations for 1.33 < M < 1.42 and coupled flutter mode for M = 1.82 . Bhatia and Beran [17] coupled a compressible Euler flow solution (linearized about the mean) with a structural dynamics solver to formulate a linearized stability eigenvalue problem. The formulation was used to evaluate flutter instabilities arising from fluid-structure interaction obtained for semi-infinite and square panels for a range of subsonic and supersonic flow conditions. The study reported that for both the semi-infinite and square panels, the high-frequency flutter modes become critical in a very narrow range of the dynamic pressures for low supersonic flows, whereas classic supersonic flutter mode behavior is observed for higher Mach numbers. Boyer et al. [18] performed simulations for SBLI-induced dynamics of a square panel using coupled Euler and von Karman plate solvers. They reported that flutter amplitude and frequency increased significantly with increases in shock strength.
Some studies have coupled viscous Navier-Stokes solvers with structural solvers to study FSI for laminar and turbulent conditions. Gordnier and Visbal [19] developed a three-dimensional aeroelastic solver by coupling the Navier-Stokes solver with the von Karman equations for structural dynamics. This study provided an in-depth validation of the solver for semi-infinite transonic panel flutter for inviscid and laminar flows. For supersonic cases that include viscous effects, the laminar boundary layer was shown to delay bifurcation, resulting in a higher critical dynamic pressure and lower frequency. Much like in the inviscid case, subsonic flow conditions exhibited two types of behavior, one with a downward deflection of the panel and the other with the upper deflection becoming unstable due to shock formation across the panel’s surface. Gordnier and Visbal [20] extended the work for laminar and turbulent flows over a square panel, where the Baldwin-Lomax model was used for turbulence modeling. The results echoed the conclusion of the previous study that the presence of the boundary layer delays the onset of panel flutter. However, turbulent boundary layer predictions were found to be very similar to those of the inviscid flows. The study also reported that the interaction between laminar flows and 3D panels resulted in a much more complex panel deflection pattern than the interaction with 2D panels.
Vedeneev [21] investigated the effect of the boundary layer on panel stability during panel flutter using a laminar Navier-Stokes solver coupled with a von Karman structural solver. They reported that instabilities can be split into subsonic and supersonic eigenmodes. For accelerating flows (i.e., convex panel deflection), the supersonic modes are stabilized, whereas the subsonic modes are destabilized, and an opposite behavior is observed for the decelerating flows (concave panel deflection). Ostoich et al. [22] investigated the aeroelasticity of a panel for laminar and turbulent boundary layers using Direct Numerical Simulation (DNS) coupled with a finite element structure solver. Their results showed that the panel flutter generated oscillating compression waves, which significantly augmented the turbulent structures in the near-wall region. Li et al. [23] developed a solver that coupled the Navier-Stokes solver for the fluid domain and the nonlinear structural dynamics solver for the panel. The solver was applied for the analysis of SBLI-induced panel flutter for inviscid and laminar boundary layer flows. They concluded that an aeroelastically tailored flexible panel could potentially be used as a means of passive flow control. Boyer et al. extended his study on 3D inviscid flow to laminar flow [24], a non-monotonic increase in the flutter amplitude for shock strength of P 3 / P 1 = 1.8 was observed due to the transfer of energy to higher-order modes, resulting in non-periodic oscillations. Shinde, McNamara, and Gaitonde [25,26] performed computations using a DNS fluid solver coupled with a von Karman structural solver to study flutter induced by an oblique shock impinging on a three-dimensional transitional and turbulent boundary layer over a flexible panel. They reported that the panel flutter enhanced the transition to turbulence and resulted in an unsteady separation region, which then served as a source of acoustic radiation.
Few studies have applied coupled viscous flow and structural solvers for complex geometries. Cavagna, Quaranta, and Mantegazza [27] extended the model developed by Chen et al. [14] to include viscous effects by coupling the RANS fluid solver with the modal structural solver. The solver was validated for aeroelastic stability evaluation of an AGARD 445.6 wing. Ozcatalbas, Acar, and Uslu [28] performed an aeroelastic analysis of the AGARD 445.6 wing using weakly coupled commercially available fluid and structural solvers and a weak coupling method along with the Spalart-Allmaras turbulence model for viscous effects. The flutter speeds and frequencies in the transonic regime were determined to be in good agreement with experiment and numerical studies. Wang [29] also utilized the loosely coupled Spalart-Allmaras (RANS) model with the second order Bernoulli beam element model to simulate static aeroelastic behavior of the ONERA M6 wing over a range of angles of attack. Im, Chen, and Zha [30] and Gan and Zha [31] performed simulations of supersonic flutter boundaries on AGARD 445.6 wing using the full Navier-Stokes equations, which are strongly coupled with the modal approach for structural dynamics. They reported that URANS-captured flutter boundary of subsonic flows compared fairly well with the experiment; however, they performed poorly in predicting flutter with supersonic inflow conditions involving shock boundary layer interaction. The study demonstrated that using a hybrid RANS/LES with delayed detached eddy simulation (DDES) improved the flutter predictions.
Overall, the literature review shows the numerous efforts in applying the coupled fluid-structure interaction solvers for dynamic aeroelasticity applications. Most studies are focused on predicting the flutter onset in inviscid or laminar flow conditions. However, recent studies show growing interest in understanding the role of high-fidelity turbulent solvers and shock boundary layer interactions on panel flutter dynamics. The objective of this research is to develop an FSI solver by coupling a finite volume-based Navier-Stokes fluid solver with a finite element-based structural solver. A comprehensive study on the stability of the FSI solver, grid refinement, and time-independent solution has been performed to obtain the optimal grid resolution and time step sizes required for the simulations. Then, the solver is verified for 2D inviscid and laminar flows and 3D inviscid flows for the prediction of the bifurcation location and limit cycle oscillation characteristics for uniform flow and oblique shock impingement over a panel against the benchmark FSI results available in the literature [15,17,18,19,23,26].
The rest of the paper is organized as follows. Section 2 provides a description of the key aspects of the fluid and structural solvers, the coupling approach. The problem description, computational setup, simulation cases, and associated flow conditions are discussed in Section 3. Grid, time-step convergence, and stability of the FSI solver are shown in Section 4. Section 5 focuses on verification of the FSI solver with benchmark test cases available in the literature. Finally, in Section 6, key conclusions and future research directions are discussed.

2. Numerical Methods

A high-fidelity FSI solver has been developed by coupling finite-volume compressible flow solver Loci-flowPsi [32] and finite-element structural solver MAST (Multidisciplinary-design Adaptivity and Sensitivity Toolkit) finite-element library [33]. The following section provides the details of the solvers and coupling approach developed.

2.1. Fluid Solver

FlowPsi is an open source version of the Loci-Chem [32] a multi-species, chemically reacting flow solver that has been extensively validated for highly energetic flows found in rocket plumes. The governing equations for the fluid flow are the mass-weighted, filtered, compressible Navier-Stokes equations for which the mass, momentum, and energy equations as given below.
t ρ + x j ρ u j = 0
t ρ u i + x j ρ u i u j = p x i + x j σ i j
t ρ E + x j ρ u j H = x j k T x j + u i σ i j
where ρ is the fluid density, u i are the velocity components, p is the fluid pressure, E is the total energy, H is the total enthalpy, k is the thermal conductivity, T is the fluid temperature, and σ i j is the viscous stress tensor. In the present work, the fluid is assumed to be a thermally perfect gas; that is, the fluid mixture obeys the following simple thermal equation of state with specific gas constant R = 287.1 J/kg-K. The viscosity μ and thermal conductivity k are modeled as a function of temperature. The solver uses cell-centered finite volume discretization over generalized grids. The time discretization uses a second-order accurate BDF scheme which is unconditionally stable for all CFL values. The solver also implements various limiters for accurately resolving flow discontinuities. The grid deformation capability with geometric conservation is built into the solver in which the volume mesh is adapted in response to each surface deformation update according to the inverse distance weighted method described in [34].
P = ρ R T
E = c v T + 1 2 u k u k
H = c p T + 1 2 u k u k
σ i j = μ u i x j + u j x i 2 3 δ i j u i x j

2.2. Structure Solver

MAST has been extensively validated for transonic flutter analysis and the design of thermally stressed structures [17]. The structural finite-element discretization in MAST is based on Bernoulli beam theory for semi-infinite panels and Kirchhoff plate theory for finite panels. The nonlinear influence of stretching due to bending is modeled with the von Karman strain, which provides coupling between the in-plane and transverse displacements.
ρ s H 2 δ w t 2 + E s H 3 12 ( 1 ν s 2 ) 4 δ w x 4 + 2 4 δ w 2 x 2 y + 4 δ w y 4 N x 2 δ w x 2 N y 2 δ w y 2 N x y 2 δ w x y = P ( x , y , t ) P c + x + y τ w a l l ( x , y , t ) δ w + H 2
ρ s H 2 δ u t 2 + N x x + N x y y τ w a l l ( x , y , t ) = 0
ρ s H 2 δ v t 2 + N x y x + N y y τ w a l l ( x , y , t ) = 0
where, N x , N y , and N x y are the membrane stresses. The equations shown above are in a Lagrangian reference frame with x, y, z, and the corresponding deflections δ u , δ v , δ w refer to the original undeformed panel configuration. ρ s refers to the density of the panel, E s is the Youngs modulus, H is the thickness, and ν s is the Poisson’s ratio of the panel. Whereas P ( x , y , t ) and τ w a l l ( x , y , t ) are the instantaneous fluid pressure and wall shear stress acting on the panel. While P c is the cavity pressure acting at the bottom of the panel. Notice that these equations are derived by assuming Kirchoff’s hypothesis. In addition, traction on the top surface parallel to the middle surface is considered, although it is negligible compared to the pressure load. The governing equations of the structure are written in the weak form and solved using the finite-element method. In this study, the panel is discretized using linear elements and 2nd order time accurate Generalized-alpha scheme.

2.3. Coupling Algorithm

The fluid and structural dynamics solvers are coupled through a virtual layer of rigid structural elements that permit a two-way, work-conservative mapping of fluid forces and displacements between the fluid and structural nodes at the shared interface. In this method of FSI coupling, each fluid node on the fluid domain’s FSI boundary forms either a tetrahedron or a pyramid with one face on the structural domain’s FSI boundary. This creates a layer of scaffold elements on the FSI boundary between the fluid and structural domains. These scaffold elements form a static system of equations described by:
K δ X = f
where, K is the stiffness matrix, δ X is the displacement vector, and f is the force vector. When the structural domain has a quadrilateral element, a pyramid is used as a scaffolding element such that the fluid node is contained within its volume. Then, a similar procedure can be used to transfer the forces from the fluid nodes to the structural nodes, and the displacements from the structural nodes to the fluid nodes.
With this transfer scheme, the fluid and structural solvers are coupled using the conventional serial staggered (CSS) procedure, where the fluid solver’s FSI boundary lags behind the structural solver. The same time step is used for both solvers and the fluid forces and structural displacements are exchanged once per time step. A more detailed explanation of the coupling algorithm is provided in Appendix A.

3. Computational Setup

Three types of FSI configurations are considered in this study: 2D Uniform flow (Configuration A), oblique shock impingement (Configuration B) over a semi-infinite flexible panel, and 3D uniform flow (Configuration C) over a finite flexible panel. The following discussion first describes the problem for all the configurations, followed by the details on the domain and grid sizes, boundary conditions, and simulation conditions used in this study.

3.1. Problem Description

Configuration A-2D Uniform Flow: The FSI setup for this configuration is shown in Figure 1a. It consists of a flexible semi-infinite panel of length L and thickness H embedded over a cavity in a rigid wall. The panel is subjected to a uniform inviscid flow of Mach M = 2 on the top, and the bottom is maintained at cavity pressure P c . Note, that the leading and trailing edges of the flexible panel (red color) are assumed to be flushed with the wall (dark grey) on either side, creating an isolated cavity (i.e., no flow path with the external flow).
Configuration B-2D Oblique Shock: This configuration, shown in Figure 1b, is a modification of Configuration A. The fluid domain consists of an oblique shock of wave angle β (w.r.t. X a x i s ) that impinges on the panel at mid-point x imp and produces a reflected shock. The incident and reflected shocks divide the fluid domain into three regions. In region 1, the free-stream fluid properties prevail, similar to Configuration A. The region between the incident and reflected shocks is region 2, and the one formed after the reflected shock is region 3. Fluid properties in regions 2 and 3 can be computed for the given shock angle β using the oblique shock relations. Note, that x imp is the impingement location when the flow is assumed inviscid. In addition to the inviscid flow, laminar and turbulent boundary layer interactions with the shock and the panel are investigated for this configuration. For viscous flow, the presence of a boundary layer causes a subsonic bulge for weak shock interactions or flow separation for strong shock interactions near x imp . Factors that determine the strength of the SBLI include (1) the ratio of pressure in region 3 to pressure in region 1 ( P 3 / P 1 ) , and (2) the type of the boundary layer, viz., laminar or turbulent. The details regarding the SBLI can be found in the book [35].
Configuration C-3D Uniform Flow: The FSI setup for this configuration is shown in Figure 1c. It consists of a flexible finite panel of length L, width W, and thickness H embedded over a cavity in a rigid wall. The panel is subjected to a uniform inviscid flow of Mach M = 2 on the top, and the bottom is maintained at cavity pressure P c . Note, that the leading and trailing edges of the flexible panel (red color) are assumed to be flushed with the wall (dark grey) on all sides, creating an isolated cavity (i.e., no flow path with the external flow).

3.2. Domain and Grids

For Configuration A, the FSI simulations were performed using a panel of length L = 0.3 m and thickness H = 0.0015 m. The panel is at Y = 0 m and spans X = [ 0.15 , 0.15 ] m. A rectangular fluid domain spanning X = [ 0.33 , 0.27 ] m in the axial direction and Y = [ 0 , 0.2 ] m in the transverse direction is used. The fluid domain is discretized using a structured mesh of size 100 × 350 cells in the axial and transverse directions with a unit cell in the spanwise direction. The semi-infinite panel is modeled as an Euler-Bernoulli beam using n x = 51 grid points. A time step of Δ t = 1 × 10 5 s is used to study the FSI problem.
For Configuration B, the same rectangular fluid domain as Configuration A is used. The fluid domain is discretized using a structured mesh of sizes 200 × 350 , cells in the streamwise, wall-normal direction with a unit cell in the spanwise direction. To maintain y + = 1 in the boundary layer region (as required for the turbulent flow cases), an appropriate near-wall grid spacing was estimated from the flat-pate boundary layer to be 2.5 × 10 6 m. Hence, the wall-normal direction has a stretched grid with hyperbolic tangent distribution using n y = 351 mesh points with wall-normal spacing from Δ Y wall = 2.5 × 10 6 m at the wall to Δ Y = 5 × 10 3 m at Y = 0.2 m from the wall. A panel of length L = 0.3 m and thickness H = 0.0006 m are used to study these cases. The panel is discretized into uniform grids ( Δ X = 0.003 m) that match point-to-point with the fluid domain consisting of n x = 101 grid points. A time step of Δ t = 1 × 10 5 s is used to study the FSI problem. Figure 1d shows the zoomed-in view of the near-panel region of the deforming mesh during panel oscillations. Note, that the zoomed-in view of the mesh is scaled 20 times to capture the mesh deformation, resulting in a distorted incident and reflected shock angles (in red color). The color plot of ρ / ρ m a x is shown to capture the shock impingement at the center of the panel, compression, and expansion waves generated at the leading and trailing edges due to panel deflection.
For Configuration C, the simulation domain spans X = [ 0.15 , 0.45 ] m, Y = [ 0.3 , 0.3 ] m, and Z = [ 0 , 0.15 ] m in streamwise, spanwise, and transverse directions. A square panel of length and width L = W = 0.3 m and thickness H = 0.0015 m is embedded at the center of the domain. The fluid domain is discretized using a structured mesh of size 101 × 101 × 26 cells in the axial, spanwise, and transverse directions. The panel is modeled using Kirchhoff plate theory using n x = n y = 51 grid points in axial and spanwise directions. A time step of Δ t = 1 × 10 5 s is used to study the FSI problem.

3.3. Simulation Conditions

As summarized in Table 1, four sets of simulations were performed in this study. Simulations were performed to investigate the impact of Mach number, pressure ratio, flow type, and non-dimensional dynamic pressure on the nature of the response of the coupled system. For all the simulations, the fluid is assumed to be air, modeled as an ideal gas with an isentropic index of γ = 1.4 and a specific gas constant of R = 287.1 J/kg-K. The viscous flow simulations were performed using fixed dynamic viscosity and thermal conductivity evaluated using R e = 1.2 × 10 5 and P r = 0.72 for a M = 2 flow. The dynamic viscosity and thermal conductivity are assumed constant throughout the domain to match the boundary layer thickness at the leading edge of the panel with Li et al. [23]. The panel was assumed to have a density of ρ s = 2700 kg/m3, Young’s modulus E s = 7.2 × 10 10 Pa and Poisson’s ratio ν s = 0.3 or 0.33 with resulting flexural rigidity of D = 22.25 or 22.75 Pa-m3. The mass ratio, which provides the ratio of fluid density to structural density, was assumed to be m r = 0.1 . Using these four simulation sets, we are going to verify our 2D and 3D FSI solver with the existing benchmark datasets, as shown in the table.

3.4. Initial and Boundary Conditions

For Configuration A, uniform inflow boundary condition was defined at the inlet (shown in green color) at Mach M , pressure P , and temperature T . The far-field boundary condition was specified at the top of the domain (shown in pink), and the uniform outflow condition was specified at the outlet shown in blue. A symmetry boundary condition was specified on the left and right faces (in the spanwise direction) of the fluid domain. The rigid walls (dark grey) and the flexible panel (red) were modeled as adiabatic slip walls. The cavity pressure was set to the mean pressure distribution on the panel, i.e., P c = P . Since there was no pressure differential across the panel thickness, a small initial perturbation velocity of ± 0.01 m/s was specified at the start of the FSI simulations to trigger an instability in the panel geometry. A simply supported boundary condition was used at both edges of the panel.
For Configuration B, uniform supersonic inflow boundary conditions at Mach M , pressure P , and temperature T were specified at the inlet (shown in green). The shock bifurcates the top surfaces into three regions, as shown in Figure 1b. The first two regions act as supersonic inflow boundaries with properties evaluated using oblique shock relations. The third region and outlet surface (shown in blue color) were specified as supersonic outflow boundaries. For shock strengths, P 3 / P 1 = 1.2 , 1.4 , and 1.8 the shock angles were calculated as β = 31 . 35 , 32 . 58 , and 34 . 8 , respectively. The bottom surface (including the flexible panel and the rigid walls) was specified as an adiabatic slip wall for the inviscid simulations. For the viscous simulations, it was replaced with a no-slip adiabatic wall boundary condition. In this setup, the cavity pressure was set to the mean pressure distribution on the panel. Earlier works by Gordnier and Visbal [20,36] showed that choosing P 1 as the cavity pressure can result in a significantly high static panel deflection and the corresponding surface pressure variation. In order to minimize these effects, the mean cavity pressure is used in this study. Based on the impingement location ( x imp ), mean cavity pressure is defined as P c = ( x imp / L ) P 1 + ( 1 x imp / L ) P 3 / 2 . Unlike the uniform flow case, the existing pressure difference across the panel thickness acts as a natural instability that triggers the panel flutter, resulting in either the panel taking a deflected but stationary position or else undergoing oscillations. A zero-deflection initial condition and simply supported boundary conditions were used at both edges of the panel.
Table 1. Summary of simulation cases, associated flow conditions, structural properties, grid sizes, objectives, and the verification data sets used in the study.
CaseFlow ParametersStructural ParametersFSI ParametersGrid SizeTime Step
M P r R e P 3 / P 1 δ / L H / L W / L ρ s [kg/m3] E s [GPa],
ν s
λ m r FluidStructure[s] × 10 5
12D Uniform Flow 1Inviscid 0.4 to 0.95 ---- 0.005 0270072, 0.33 30 to 3000 0.1 35 K501
1.0 to 2.0 2 to 880
22D Oblique Shock 2Inviscid 2.0 -- 1.2 , 1.4 , 1.8 , 2.3 -72, 0.3 100 to 87570 K50, 70, 1001
3Laminar 3 0.72 1.2 × 10 5 1.4 0.0156 , 0.0262 0.002 87535 K504, 2, 1, 0.5 , 0.25
49 K70
70 K100
98 K140
140 K200
43D Uniform flow 4Inviscid----1500 to 3000265 K 50 × 50 1
1 Verification of 2D FSI solver for steady-state equilibrium/LCO amplitudes and LCO frequency against analytic [37] and benchmark numerical results [17,19]. 2 Verification of 2D FSI solver semi-infinite panel deformation and surface pressure predictions against benchmark results [15,23] for inviscid and laminar flows, respectively. 3 The effects of laminar boundary layer thickness on steady-state equilibrium/LCO predictions are verified with [23]. 4 Verification of 3D FSI solver for steady-state equilibrium/LCO amplitudes and LCO frequency against benchmark results of [18,26].
Configuration C also specifies similar boundary conditions to Configuration A, except in the spanwise direction, the symmetry boundary condition was replaced by the far-field boundary condition. Cavity pressure under the square panel was specified as P c = P and a small initial velocity perturbation was specified to trigger the instability. All four edges of the panel are specified as clamped boundaries to replicate the results of benchmark studies.
For all the cases, fluid-only simulations were carried out first to obtain a steady-state flow solution over the rigid panel, which is then used as the initial condition to start the unsteady FSI analysis where the panel is allowed to deform. The 2D fluid-only simulations were run for 100 K time steps ( t = 1 s), and the 2D FSI simulations were run for a minimum of 200 K time steps ( t = 2 s). While the 3D simulations (fluid-only and FSI) are run for 50 K ( t = 0.5 s) each.

4. Convergence Study

4.1. Grid Convergence Study

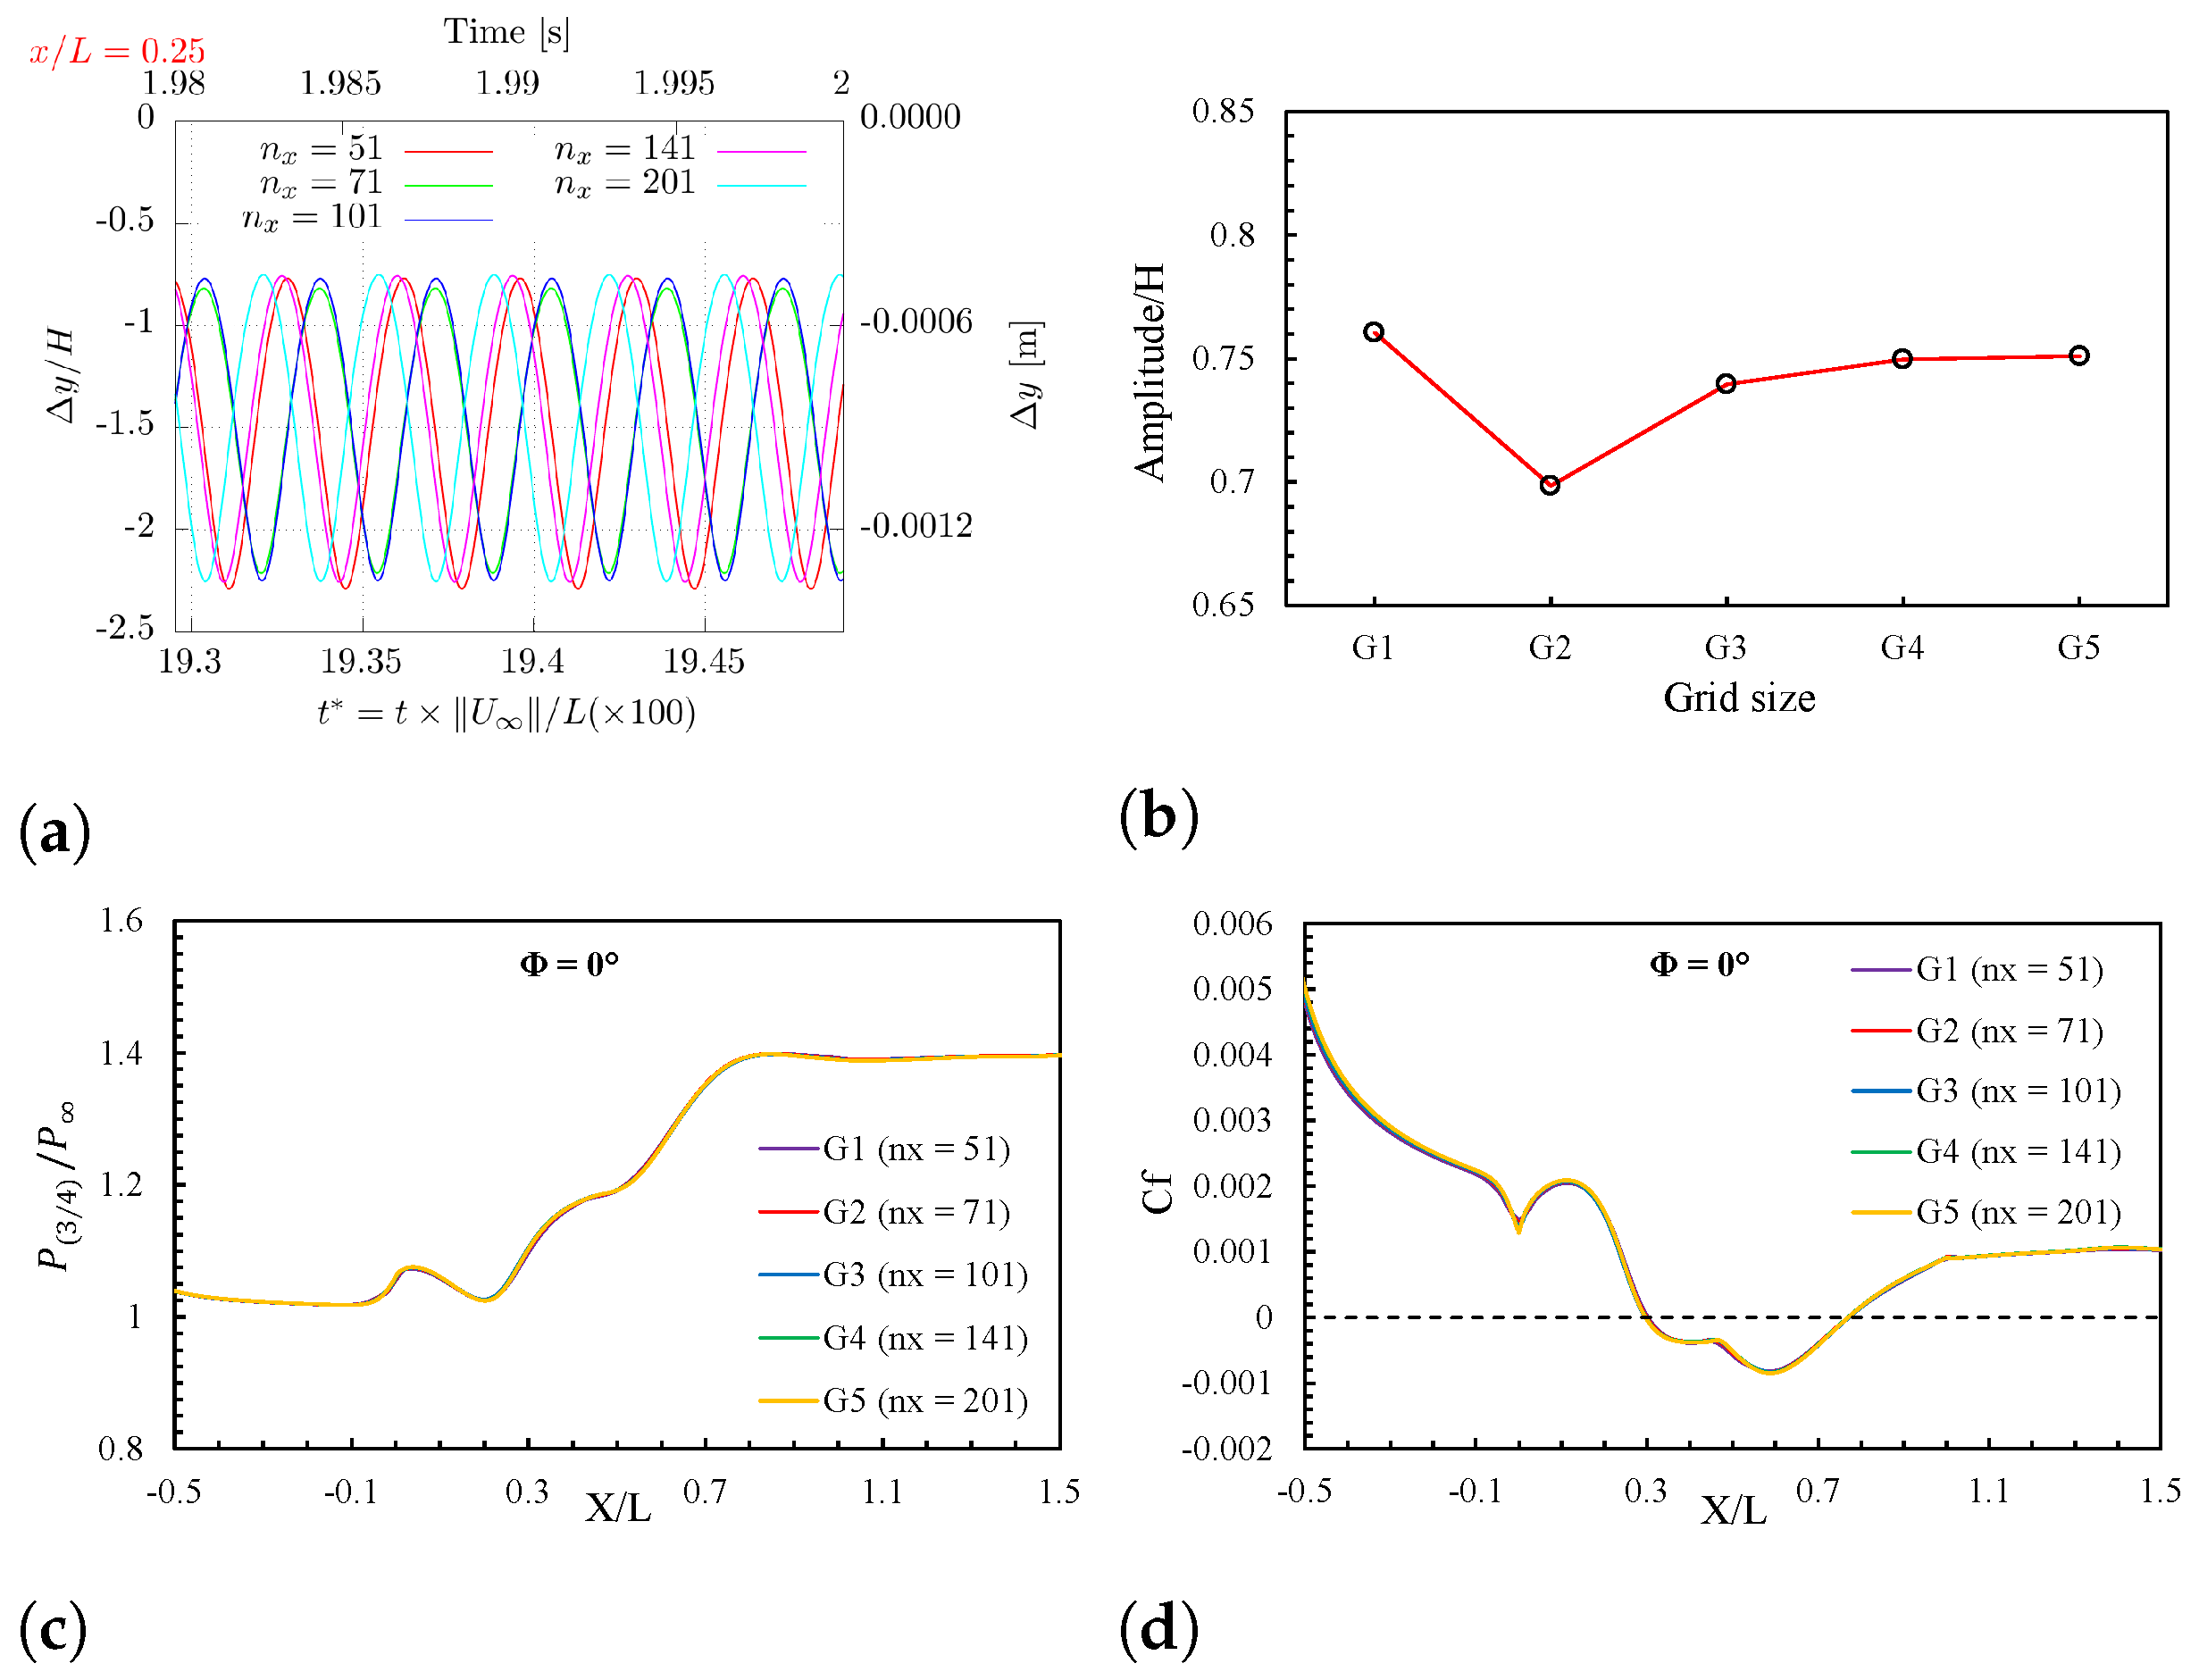
A convergence study was performed to determine the appropriate grid and time step resolution for the simulations. To evaluate the effect of grid resolution, tests were performed for a laminar flow of M = 2 with a weak oblique shock strength P 3 / P 1 = 1.4 and λ = 875 , wherein five systematically refined fluid grids were generated using refinement ratio r G = 1 / 2 . Fluid grids with 100 × 350 , 140 × 350 , 200 × 350 , 280 × 350 , and 400 × 350 cells in the streamwise to wall-normal direction are used for this study. The corresponding number of structural elements that match point to point with the fluid grid is 50 elements (coarse), 70 elements (medium), 100 elements (fine), 140 elements (finer), 200 elements (finest). For the test case considered, a stable LCO behavior of the panel was predicted to be consistent with Li et al. [23] as shown in Figure 2a through displacement time history of the 3/4th chord length of the panel. Grid convergence was shown in Figure 2b. A comparison of normalized pressure and coefficient of friction predictions with respect to grid refinement was shown in Figure 2c,d. The results indicate that the amplitude of the oscillations increases asymptotically, and the grid convergence ratio of the finest grid is R G = ( S G 5 S G 4 ) / ( S G 4 S G 3 ) = 0.127 , where S G represents the amplitude of grid ‘G’. The predictions of fine grids showed < 1.6 % variation in the amplitude with 20 % faster simulation time compared to the finest grids. Hence, the fine grid of size 200 × 350 cells with 101 nodes on the panel was chosen for the rest of the FSI simulations.

4.2. Time Independence Study

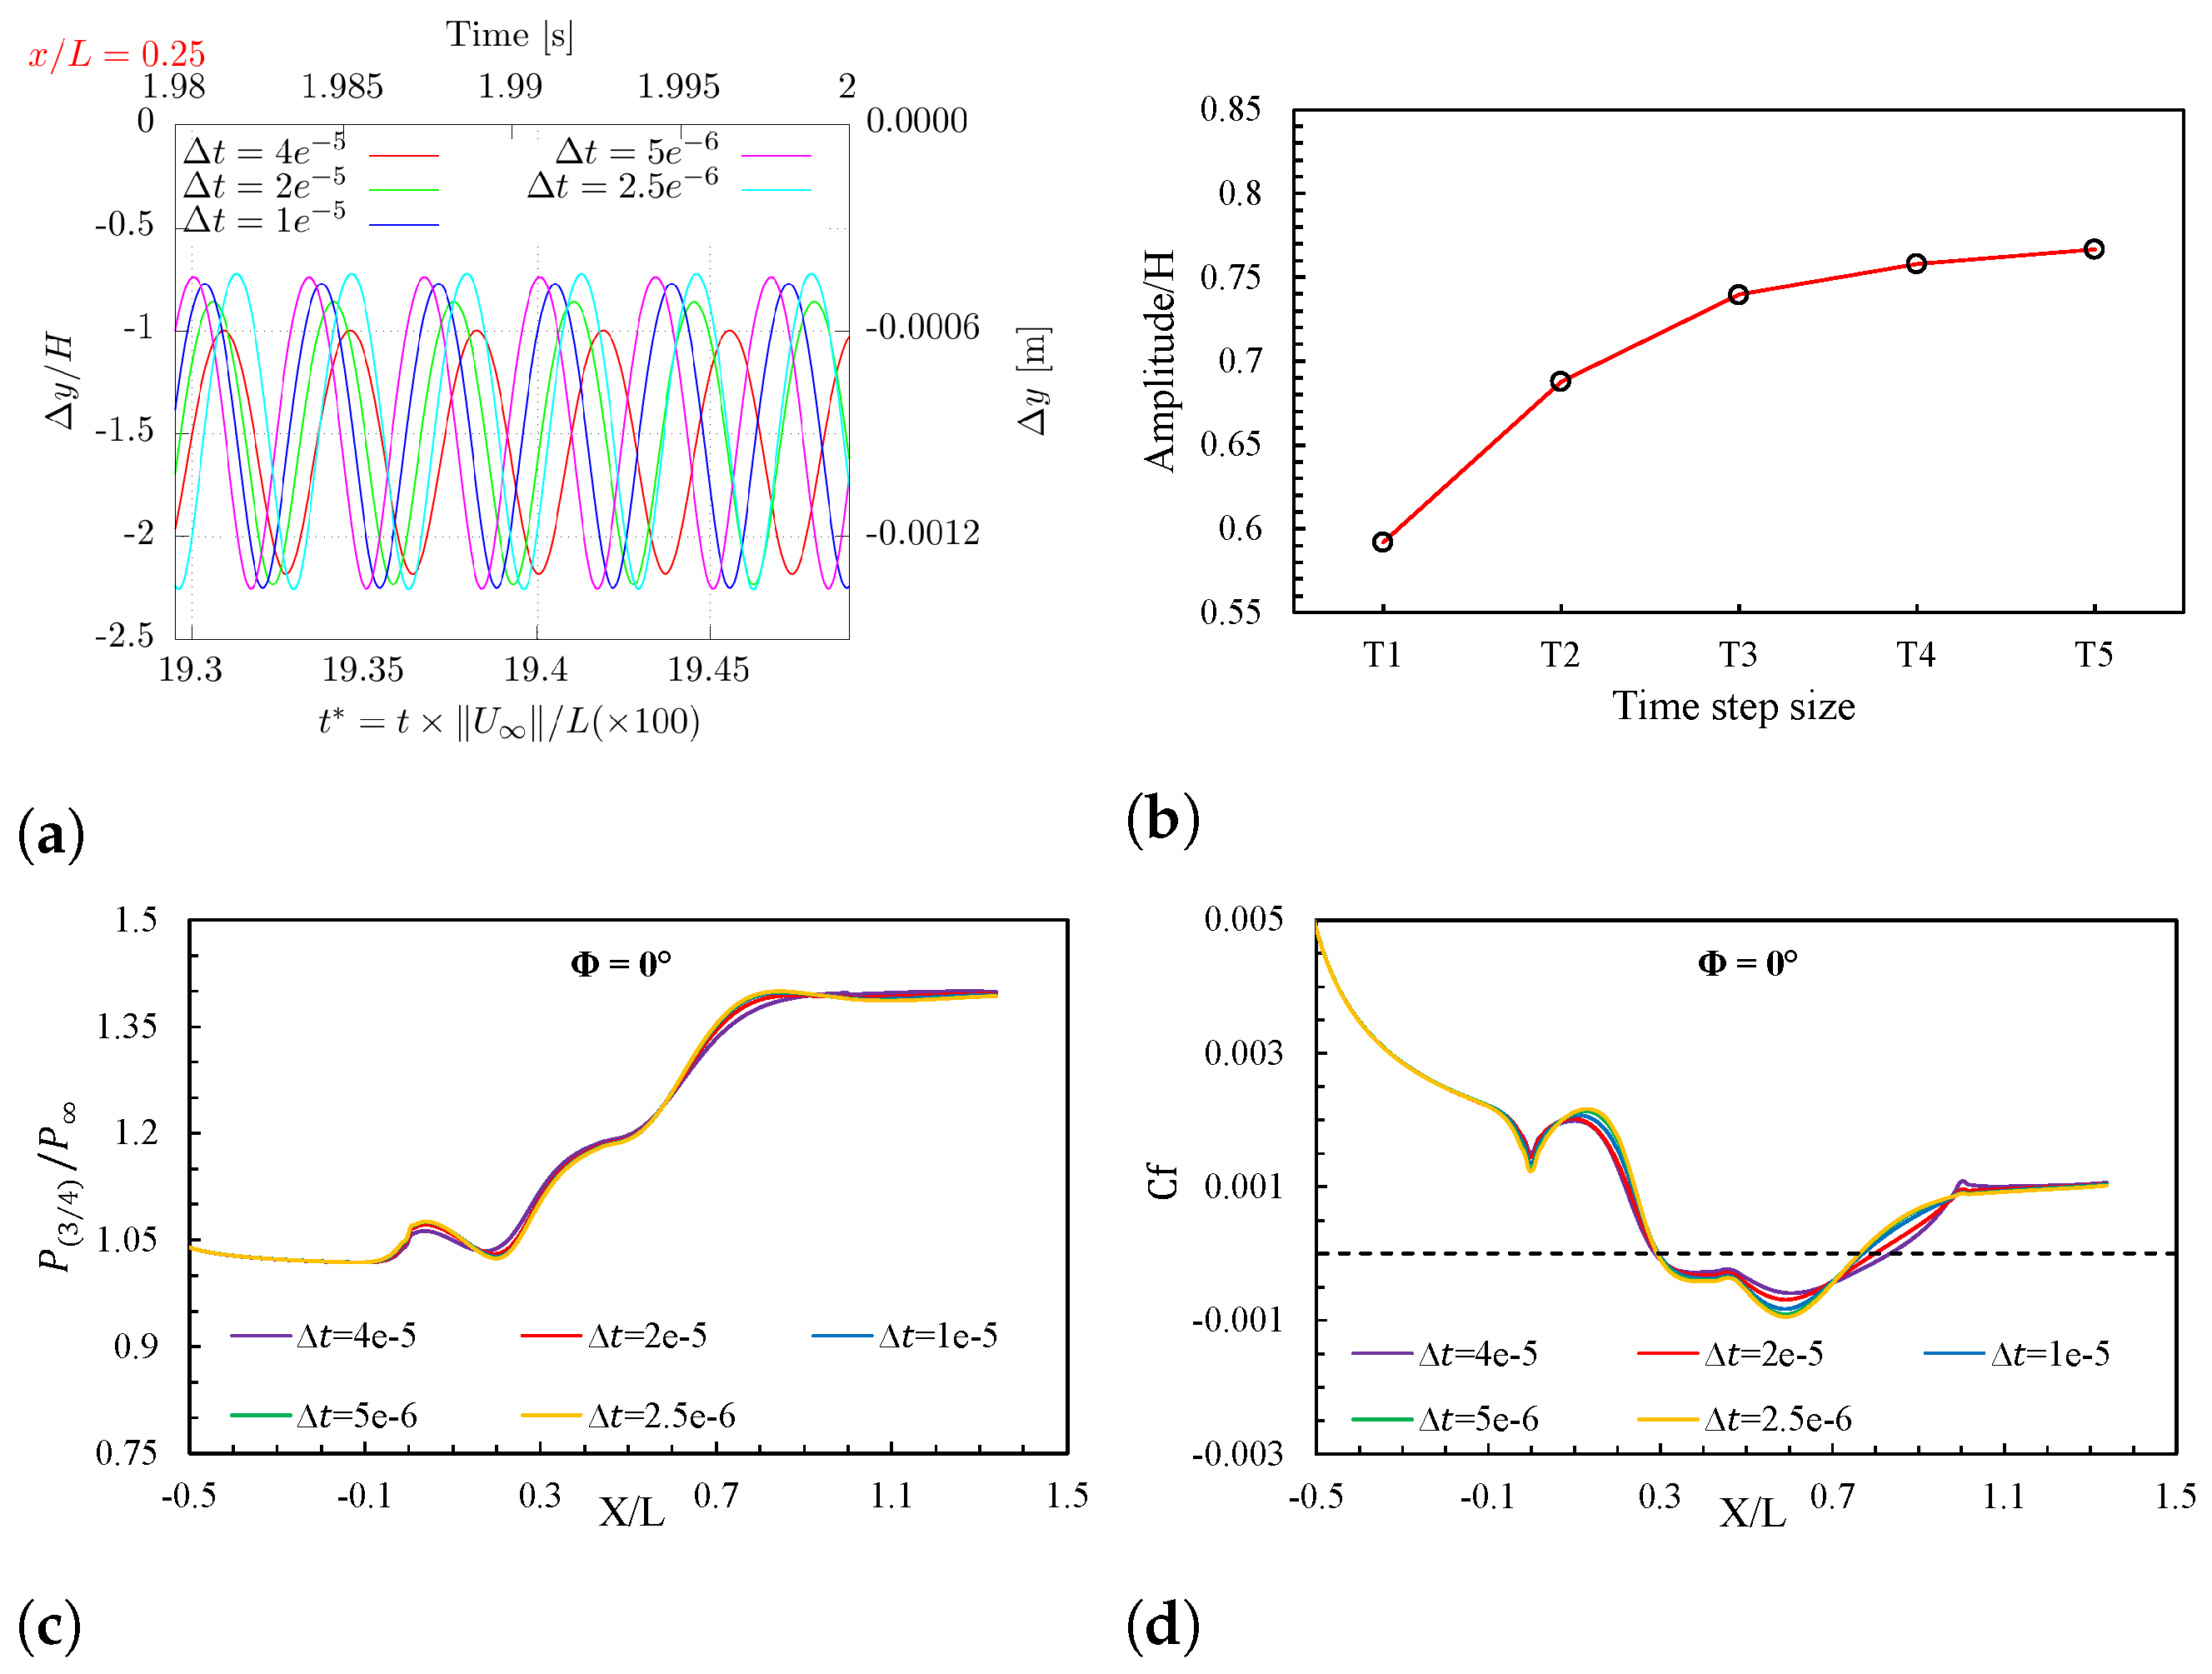
A time-step convergence study was also performed for the same laminar case of M = 2 , shock strength ( P 3 / P 1 = 1.4 ) and λ = 875 , wherein five time-step sizes were chosen using refinement ratio r T = 0.5 , Δ t =   4 × 10 5 , 2 × 10 5 , 1 × 10 5 , 0.5 × 10 5 , and 0.25 × 10 5 s. A fluid grid of size 200 × 350 corresponding to 100 elements on the structure was chosen for the simulations. Similar to the grid refinement case, all the simulations predicted the LCO behavior of the panel as shown in Figure 3a. Time-step convergence was shown through Figure 3b. A comparison of normalized pressure and coefficient of friction predictions with respect to time-step variation was shown in Figure 3c,d. The results indicate that the amplitude of the oscillations converges asymptotically with decreasing time-step size. A convergence ratio of R T = ( S T 5 S T 4 ) / ( S T 4 S T 3 ) = 0.487 was observed for the moderate time-step, where S T represents the amplitude of time-step size ‘T’. A coarse time-step ( 4 × 10 5 ) corresponding to a CFL of 155 (approx.) showed a difference of approximately 22 % with respect to the finest time-step size ( 0.25 × 10 5 ) corresponding to a CFL of 9.7 (approx.), while the fine time-step size ( 1 × 10 5 ) exhibited a difference of approximately 3.5 % and with 50 % faster simulation time compared to the finest time-step size. Hence, the fine time-step size of Δ t = 1 × 10 5 s was chosen for the rest of the FSI simulations.

4.3. Stability of the FSI Solver

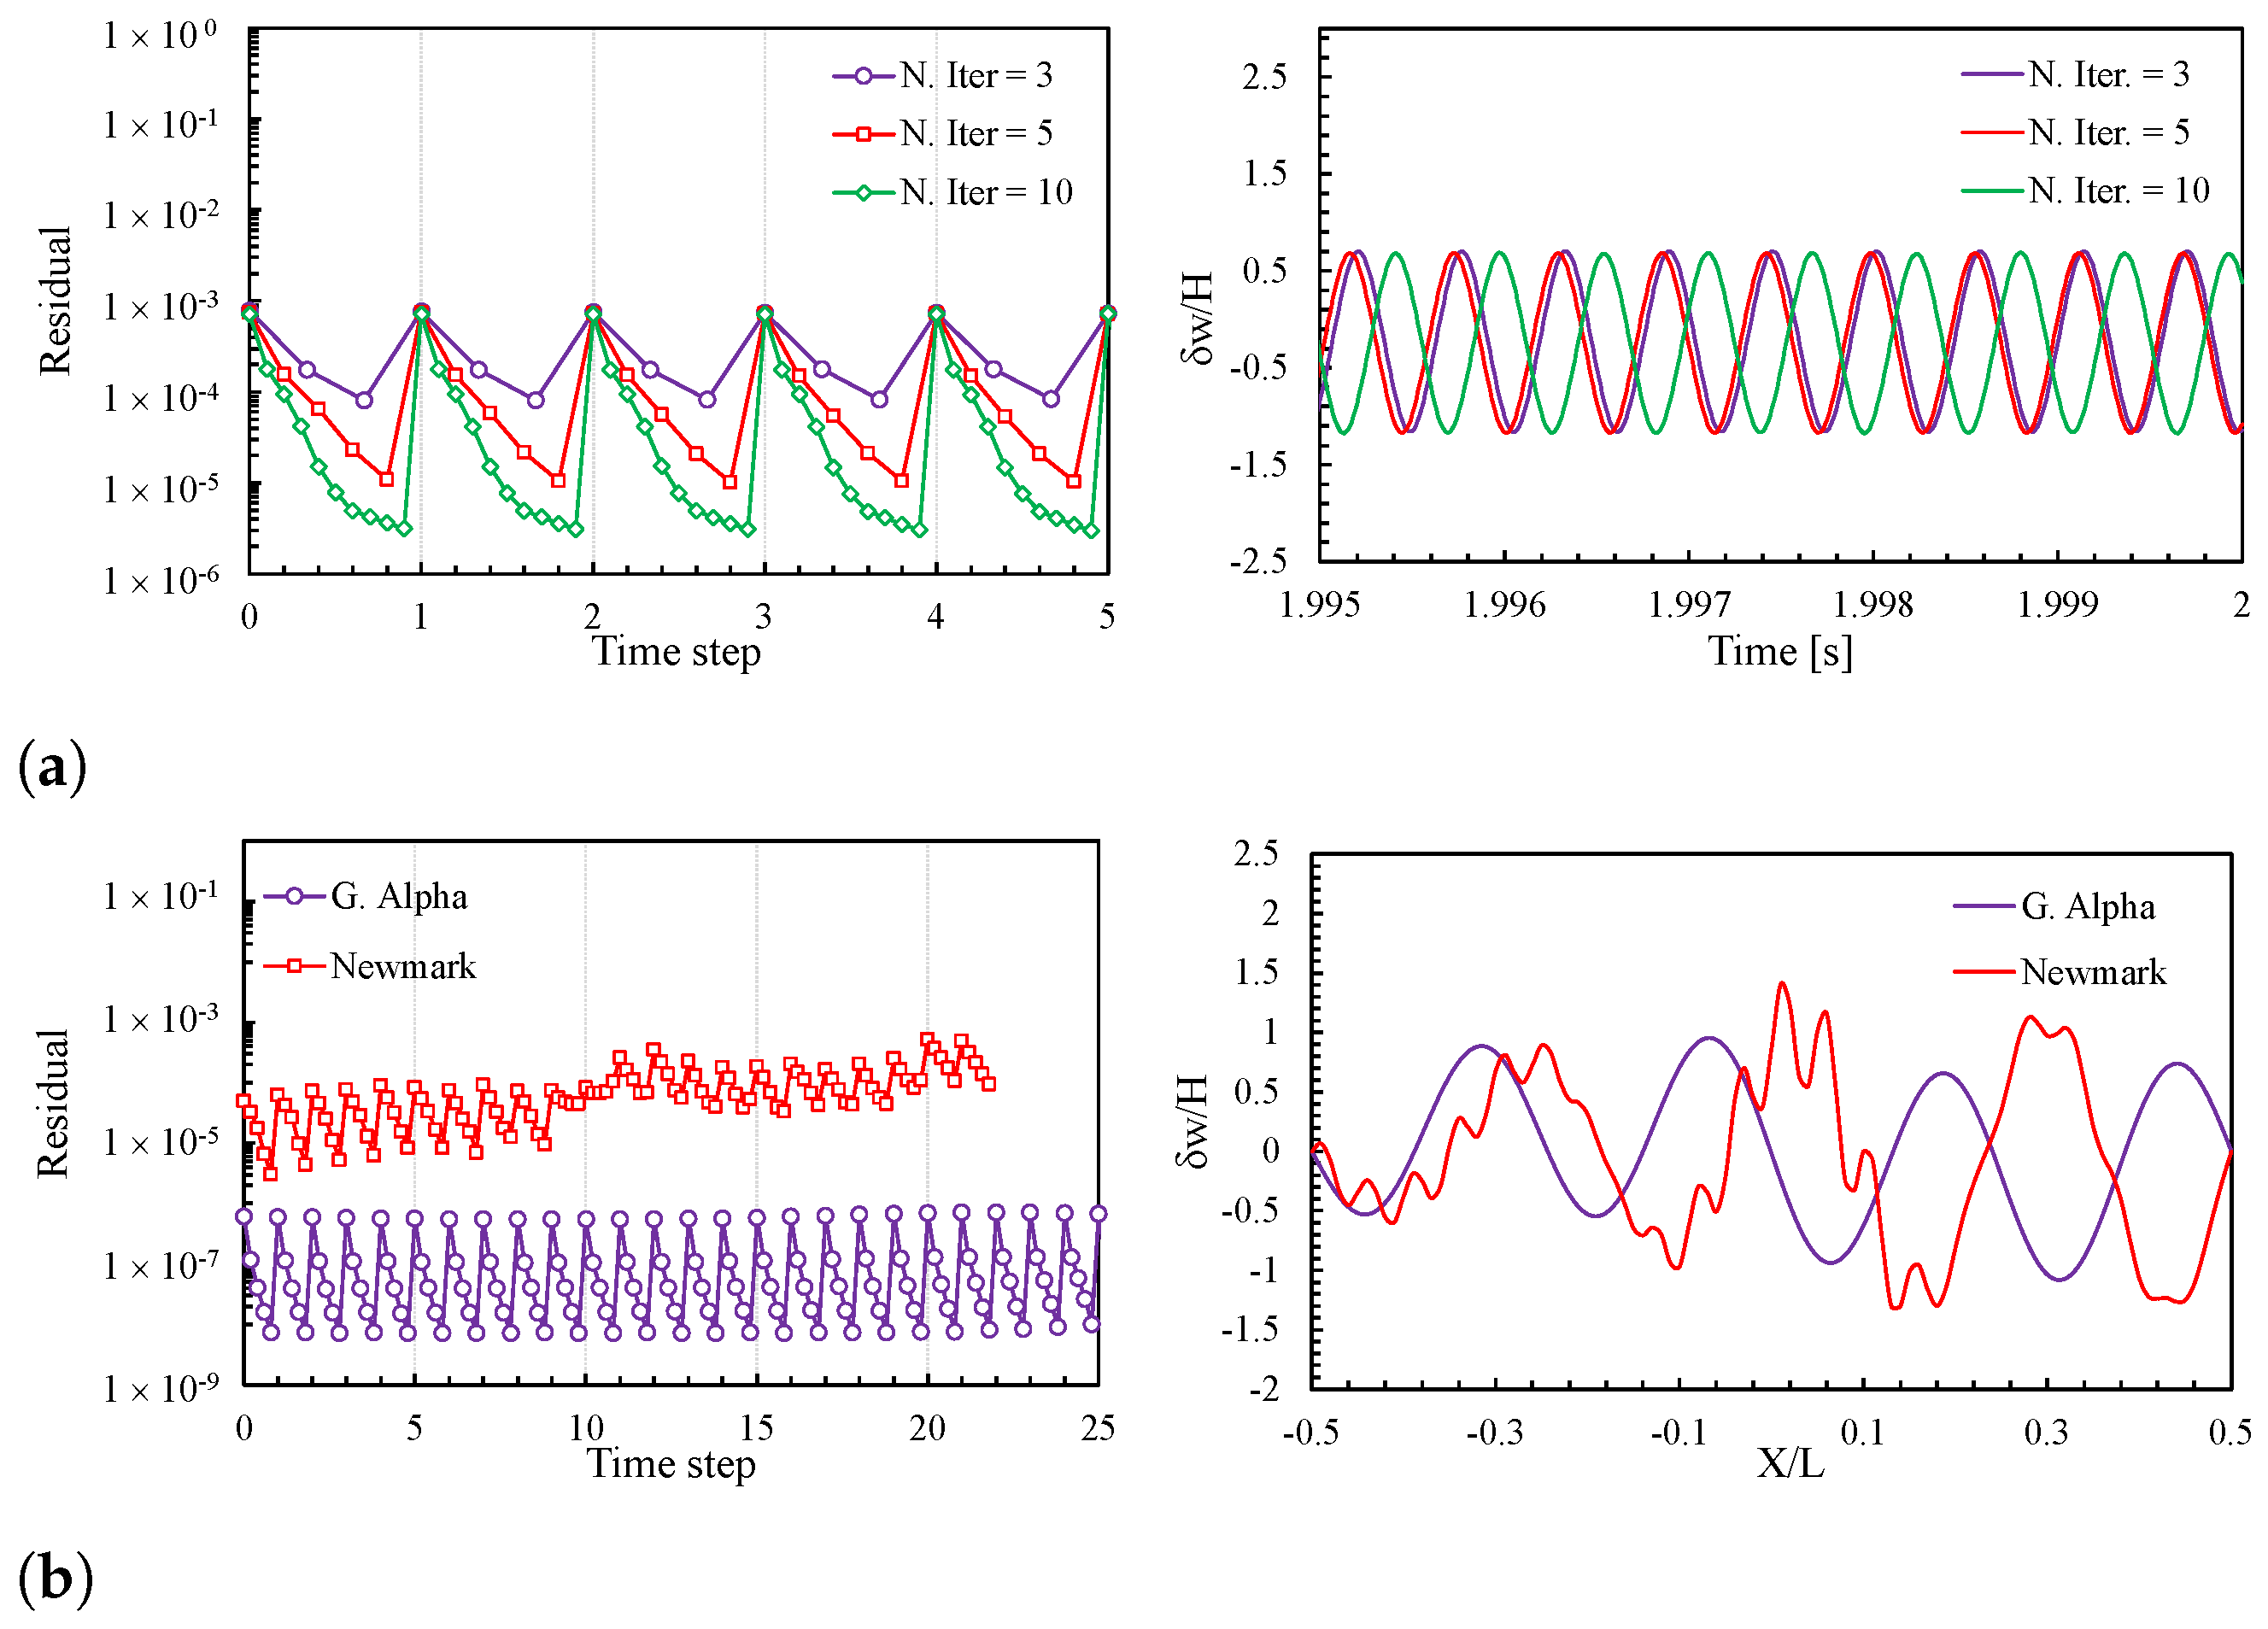
Multiple studies have shown that the stability of weakly coupled FSI solvers is highly dependent on the choice of discretization methods and, in some cases, can result in spurious numerical modes. Hence, the numerical stability of the partitioned FSI solver is analyzed by checking the effect of Newton iterations ( N I t e r ) used by the fluid and structural solvers and the time integration schemes used by the structural solver on the accuracy of the FSI solution as shown in Figure 4. For this purpose, the residuals of fluid and structural solutions, displacement time history, and deflection of the panel are plotted for the FSI simulations. Figure 4a shows the decreasing average cell momentum residuals of the fluid solution with the inner iterations and a similar displacement time history for 3/4th chord length of the panel for three N I t e r cases. However, the maximum decrease in the residual values with an asymptotic behavior was obtained for ten fluid Newton iterations N I t e r = 10 while the amplitude and frequency of the oscillations remain the same. Although the associated computational cost was higher, we chose N I t e r = 10 for all the cases to achieve better convergence behavior.
Although the Newmark second-order technique was the most widely used time integration technique in the finite element community, generalized-alpha has superior convergence behavior because of its optimal numerical dissipation characteristics [38]. Hence, we compared the stability characteristics of these two schemes to emphasize the stability of our FSI solver, as shown in Figure 4b. The structural solver was designed to use a maximum number of Newton iterations at each time step to achieve the best convergence behavior. Results indicate that the Newmark second-order technique takes many inner iterations (an average of 30 inner iterations) to converge. In comparison, generalized alpha converges within three Newton iterations with much lower residuals (two orders of magnitude). Note, that the structural residual values are plotted for 25 consecutive iterations after 1.895 s. Since FSI simulations are sensitive to the stability of each solver, we noticed that the FSI simulation failed when allowed to run longer with the Newmark scheme. In contrast, the generalized-alpha method exhibited superior stability characteristics. Hence, the generalized-alpha time integration scheme was used in this study to solve structural dynamics.

5. Results and Discussion

5.1. Configuration A: Uniform Flow (Set # 1)

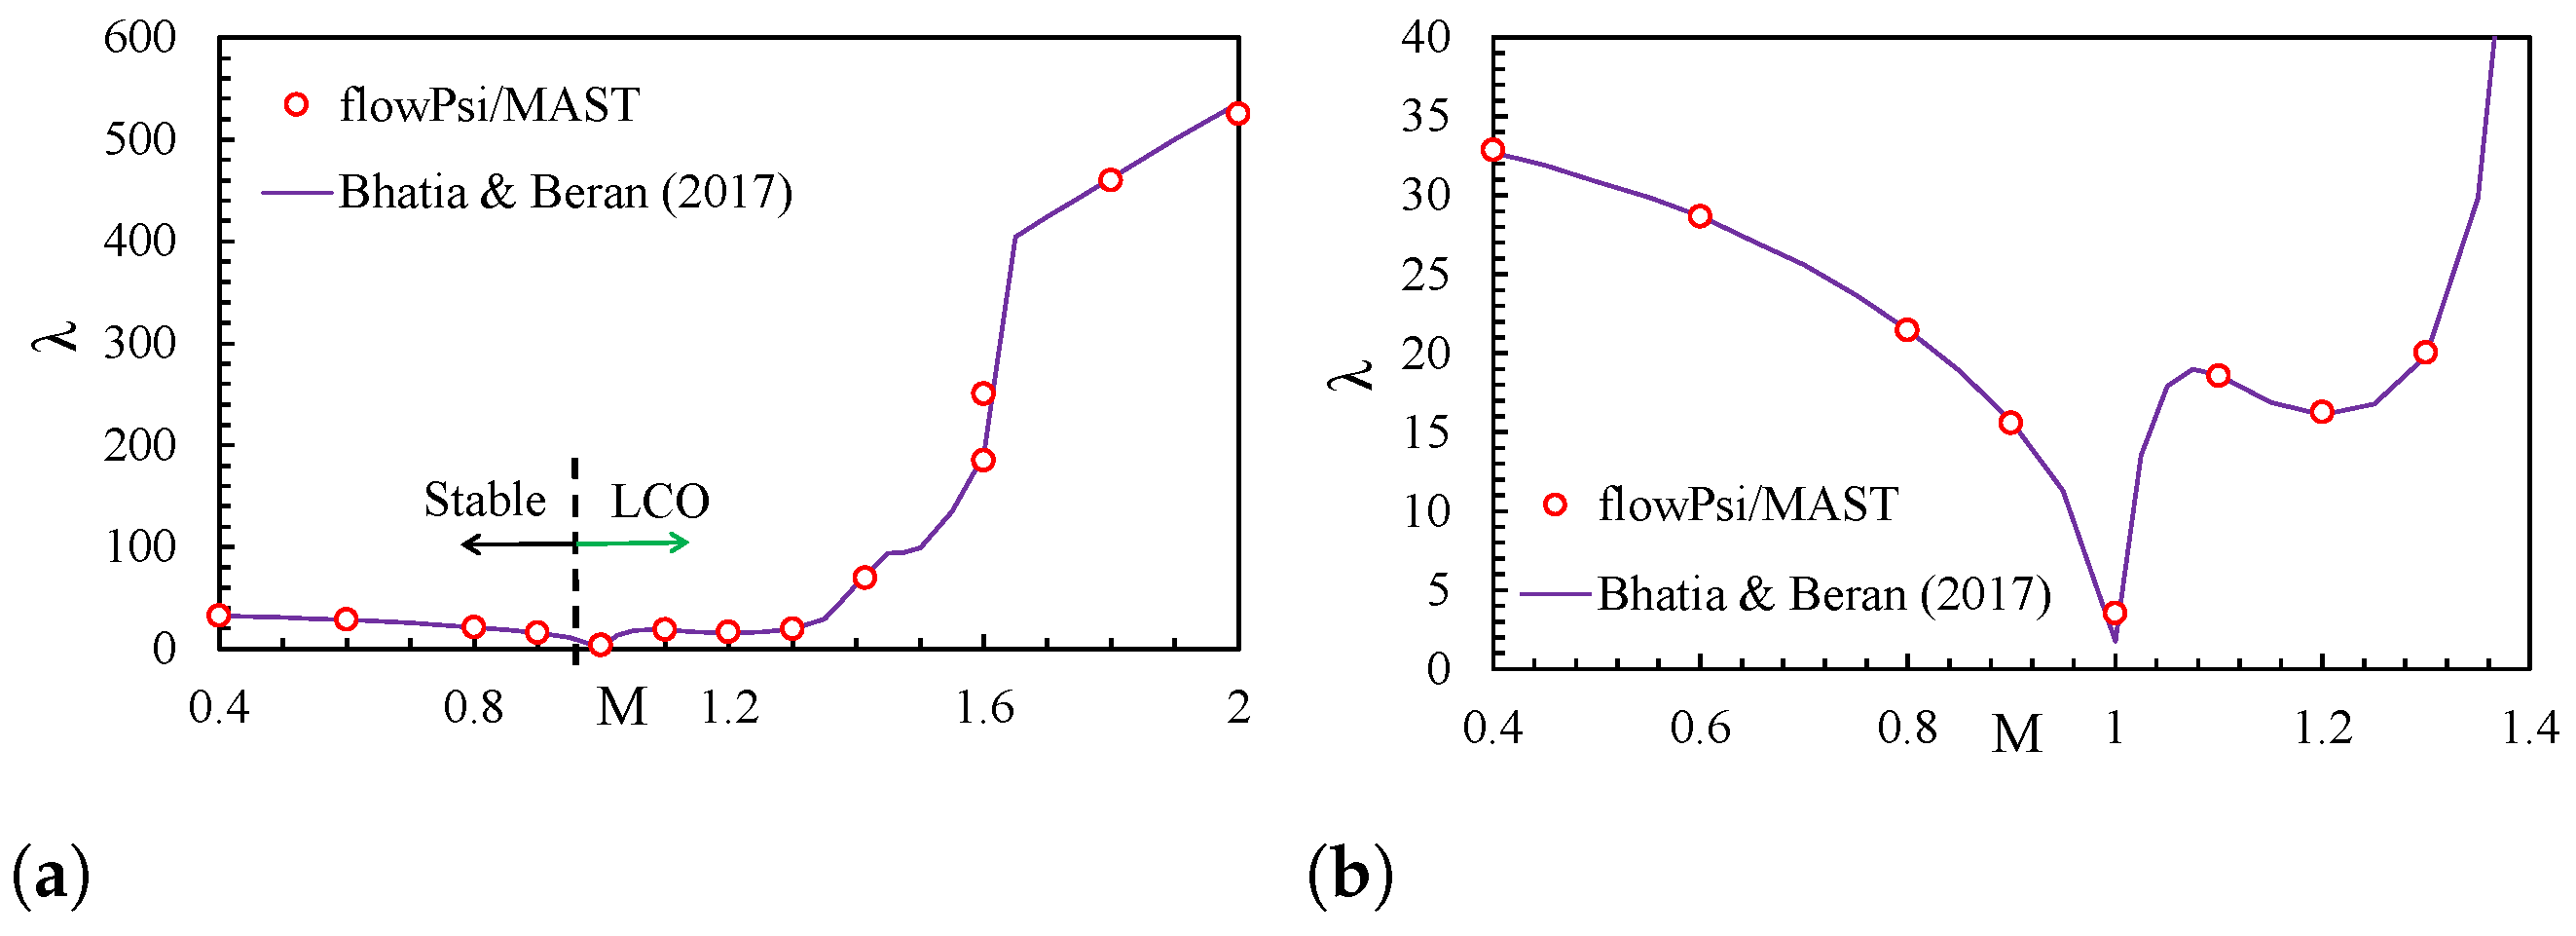
Simulation set # 1 focused on verifying the FSI solver to predict the bifurcation point for a uniform flow over a range of subsonic and supersonic Mach numbers: M = 0.45 to 2. In addition, an analysis of FSI coupling was also presented for subsonic and supersonic flows. As shown in Figure 5, the critical λ predictions obtained from the FSI solver compare well with the results from Bhatia and Beran [17]. The critical λ decreases with the increase in M for subsonic conditions and increases for the supersonic conditions. A sharp rise in the critical value was noticed for M > 1.4 . For the subsonic cases ( M = 0.4 to 1.0 ), the panel showed stable upward or lower deflection after the bifurcation, indicating stable divergence. Whereas for the supersonic flow, the panel showed LCO. A precise bifurcation location was obtained for all the cases except for M = 1.6 , which revealed the presence of two different bifurcation points within a narrow range of λ = 210 and 250. The detailed structural deflection and flow pattern analysis after the bifurcation location is discussed below.
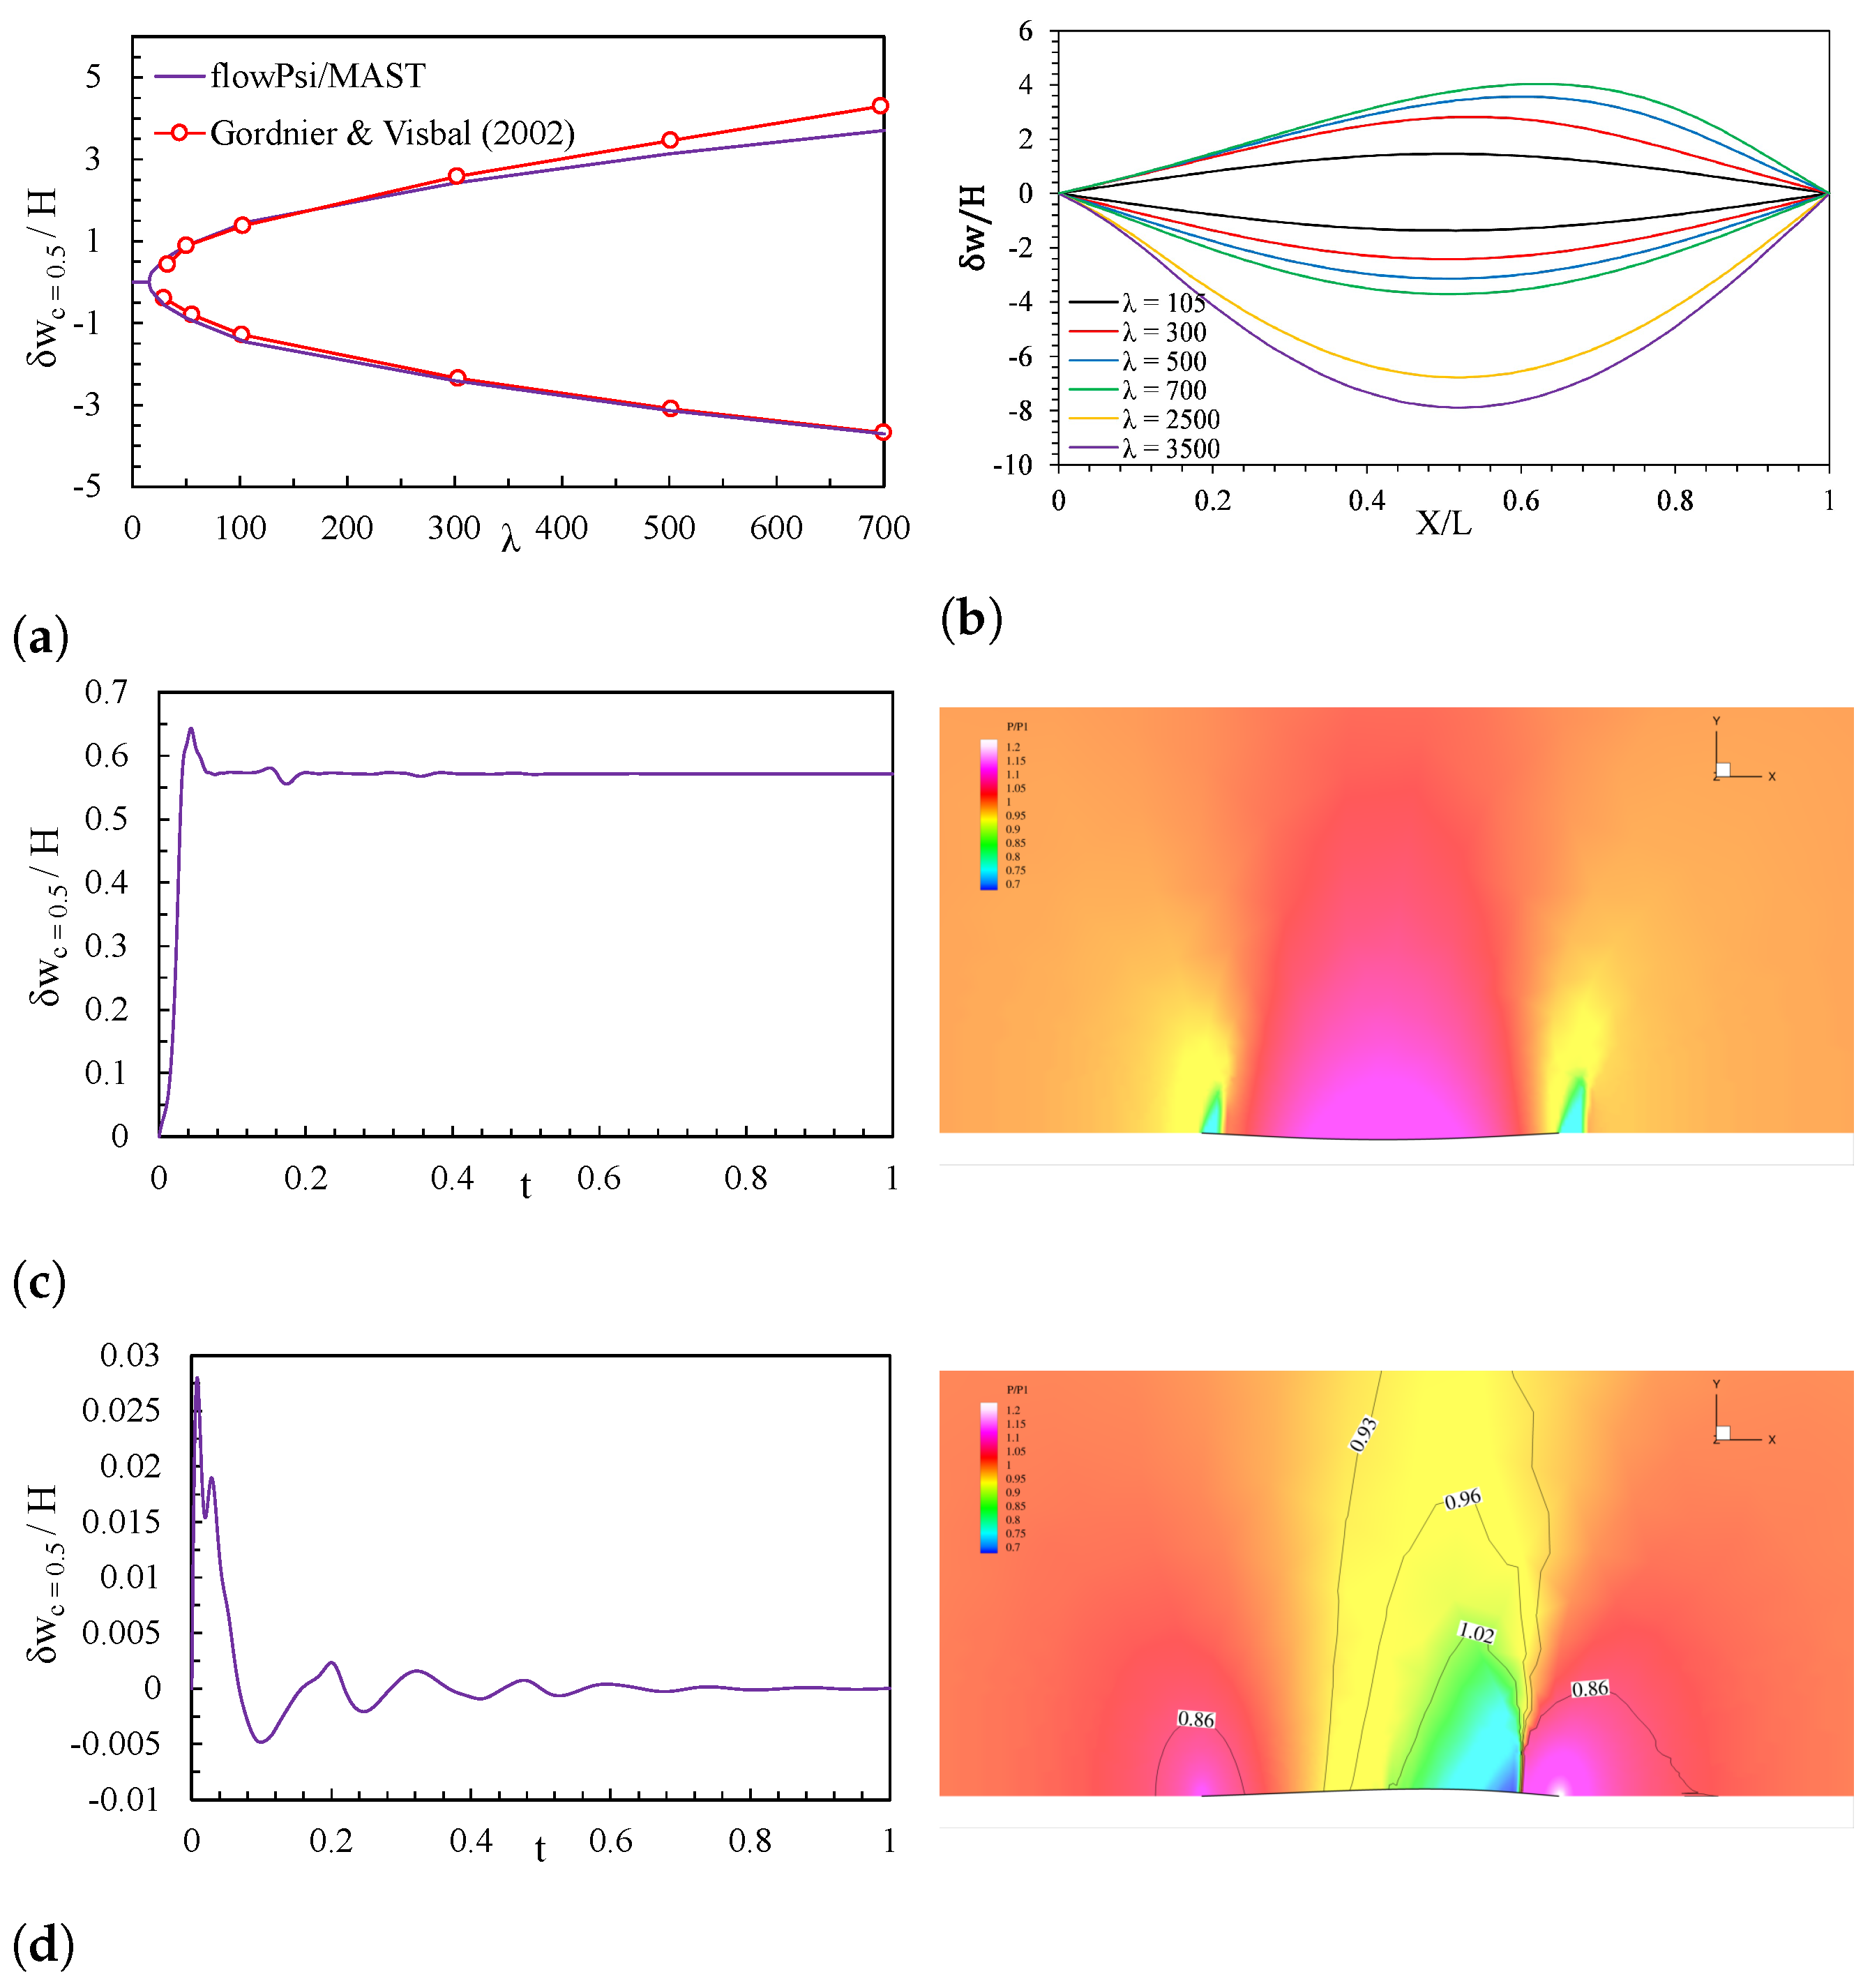
Analysis of Subsonic Regime: All the subsonic cases showed similar qualitative characteristics for the panel deflection and flow pattern with the increase in λ . Herein, the results obtained for M = 0.9 are used for discussion since benchmark CFD predictions in [17,19] are available for this M. For λ < 15.55 , the initially prescribed panel displacements are damped, and the panel returns to a flat equilibrium configuration as shown in Figure 6. However, above the bifurcation point, the initial perturbations result in two new stable branches: convex-shaped into the flow (positive) or concave-shaped away from the flow (negative), depending on the initial perturbation. The panel deflection on both of these branches increases with λ . However, the nonlinear stiffening effects due to the von Karman strain reduce the displacement growth rate as λ increases. For flows up to λ = 700 , the panel deflection converges to either a concave or convex shape depending on initial panel perturbation as shown in Figure 6b. However, for λ > 700 , the panel always converges to a concave shape (see Figure 6b). Additionally, while the concave shape remains symmetric about the midpoint, the convex shape loses this symmetry with higher values of λ .
For the concave-shaped deflections, this is expected since the flow shows a high-pressure region at the center of the panel due to flow deceleration (Figure 6c), and the pressure distribution is symmetric around the center. On the other hand, for the convex shape panel deflections, the flow accelerates over the panel. At sufficiently higher λ ( 300 ), a shock is formed slightly aft of the mid-point (Figure 6d), resulting in asymmetric panel deflection. With increasing λ , the shock moves towards the trailing edge of the panel, enhancing the asymmetry of the panel deflection. Note, that without the initial perturbation, the panel continues to stay in an undeformed configuration. This indicates that the zero-displacement branch is now unstable since a small perturbation causes the panel to diverge away from this point and settle into a nearby fixed point.
The mid-cord displacement predictions in this study match very well with the benchmark results outlined in [19] for the concave panel deflection and up to λ 300 for the convex panel deflections. However, the results show some differences in the convex displacement for λ > 300 . This is because the panel deflections are asymmetric in this study but are symmetric in [19]. This difference is expected as the present results account for the nonlinearity in the flow field due to the formation of shock. On the other hand, the benchmark study used a linearized stability analysis and thus could not account for the nonlinear effects.
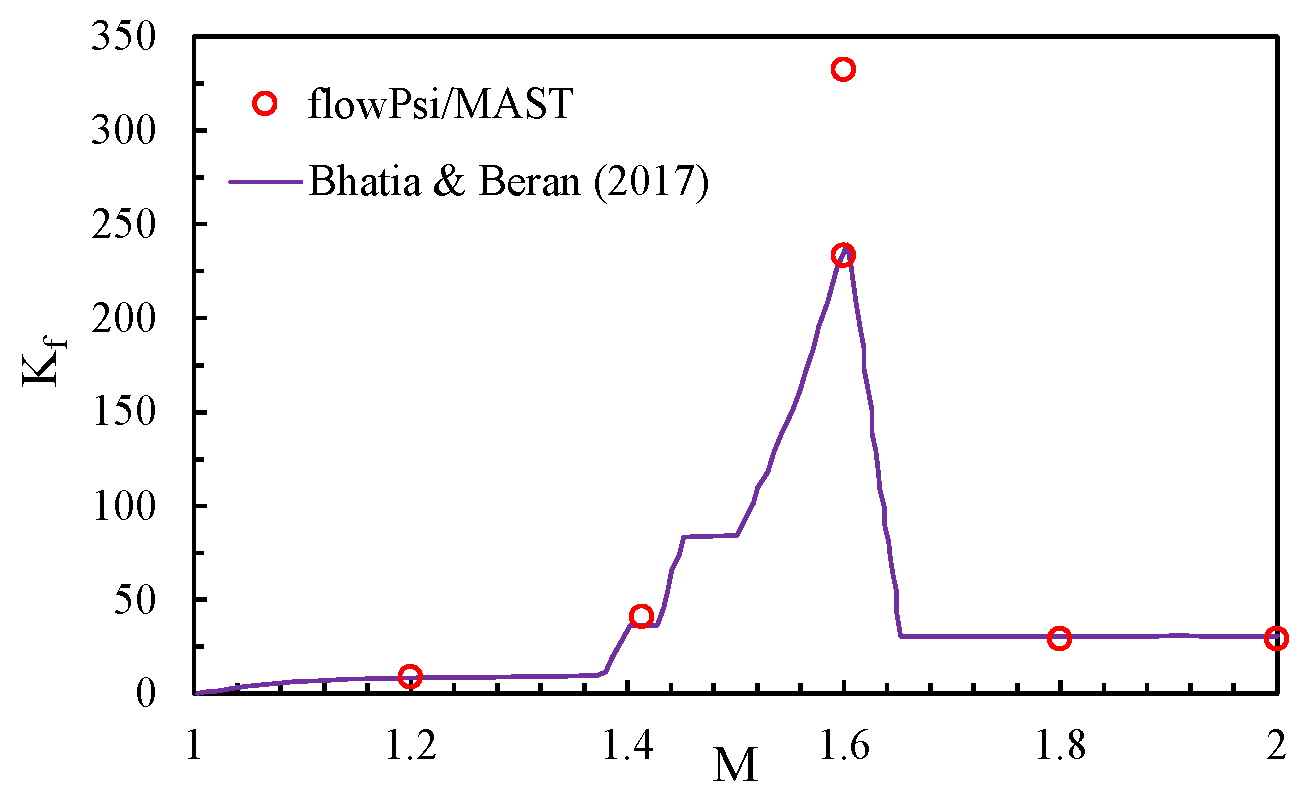
Analysis of Supersonic Regime: The LCO frequency of the panel for the supersonic flows near the bifurcation location is presented in Figure 7. Bhatia and Beran [17] reported that the frequencies increase from M = 1.2 to 1.6 in a step-wise manner, peaking at M = 1.6 , and then decrease for higher M. The current predictions agree very well with [17], except that two different bifurcation points were observed (as discussed above) for M = 1.6 , and the bifurcation point for higher λ = 250 exhibited a higher frequency. Bhatia and Beran [17] explained that the increase in the frequency was associated with the change in the panel deformation modal pattern. A similar pattern is observed in this study. As shown in Figure 8, the LCO for M = 1.2 and 1.414 involves the first and third modes of panel deflection. For M = 1.6 , the lower λ = 210 bifurcation point showed fifth mode deflection, while the higher λ = 250 bifurcation point exhibited sixth mode deflection as reported in [17]. For higher M = 1.8 and 2, the panel shows second-mode deflection, where the deflection is dominantly on the downstream part of the panel due to the formation of compression shocks and expansion waves.
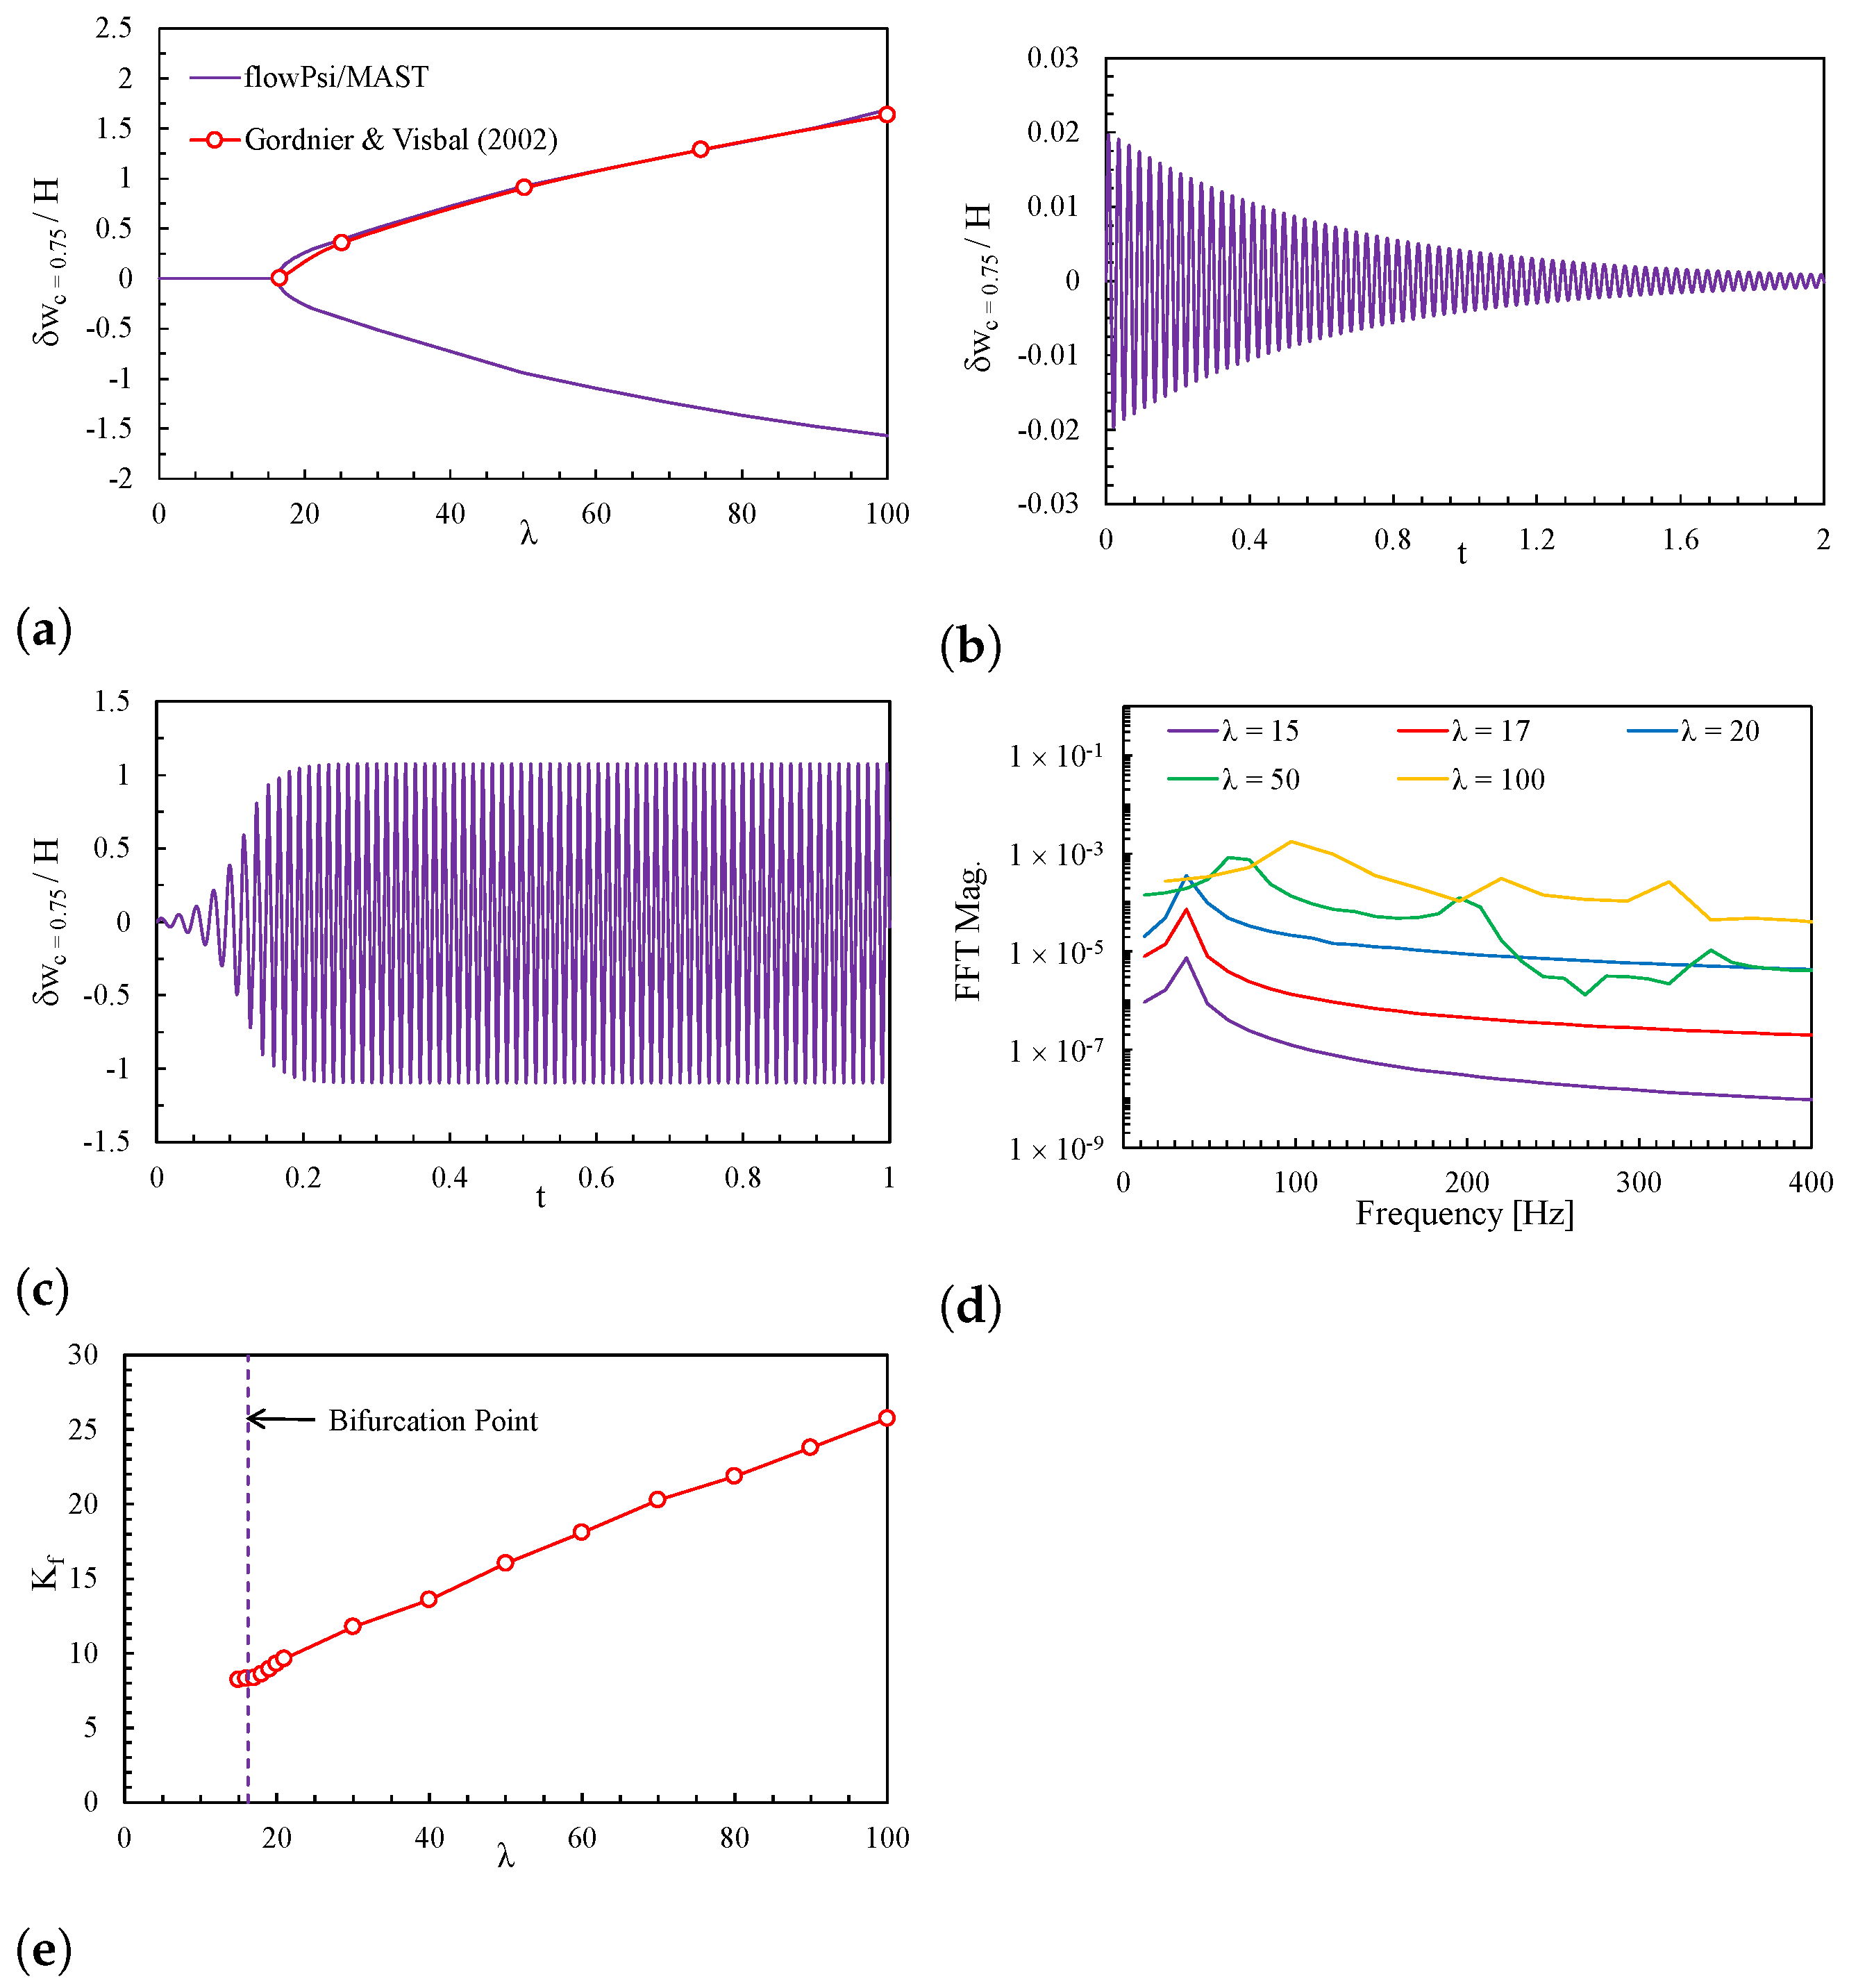
The effect of the increasing λ on the LCO pattern is demonstrated in Figure 9 for M = 1.2 . The analysis indicates that for λ slightly less than the bifurcation point ( λ = 15 ), the panel initially oscillates due to the sudden impact of the incident shock. However, the amplitudes gradually decay, leading to a stable solution with zero panel deflection. A slight increase in λ above the bifurcation point leads to self-sustained oscillations. The variation in LCO amplitude at the 3/4th-chord location is consistent with the results in [19]. As shown in Figure 9d,e, the LCO amplitude and frequency show that the frequency remains almost constant near the bifurcation point, i.e., λ = 15 to 20, while the amplitude increases sharply. For higher λ = 20 to 100, both the amplitude and frequency show almost a linear increase.
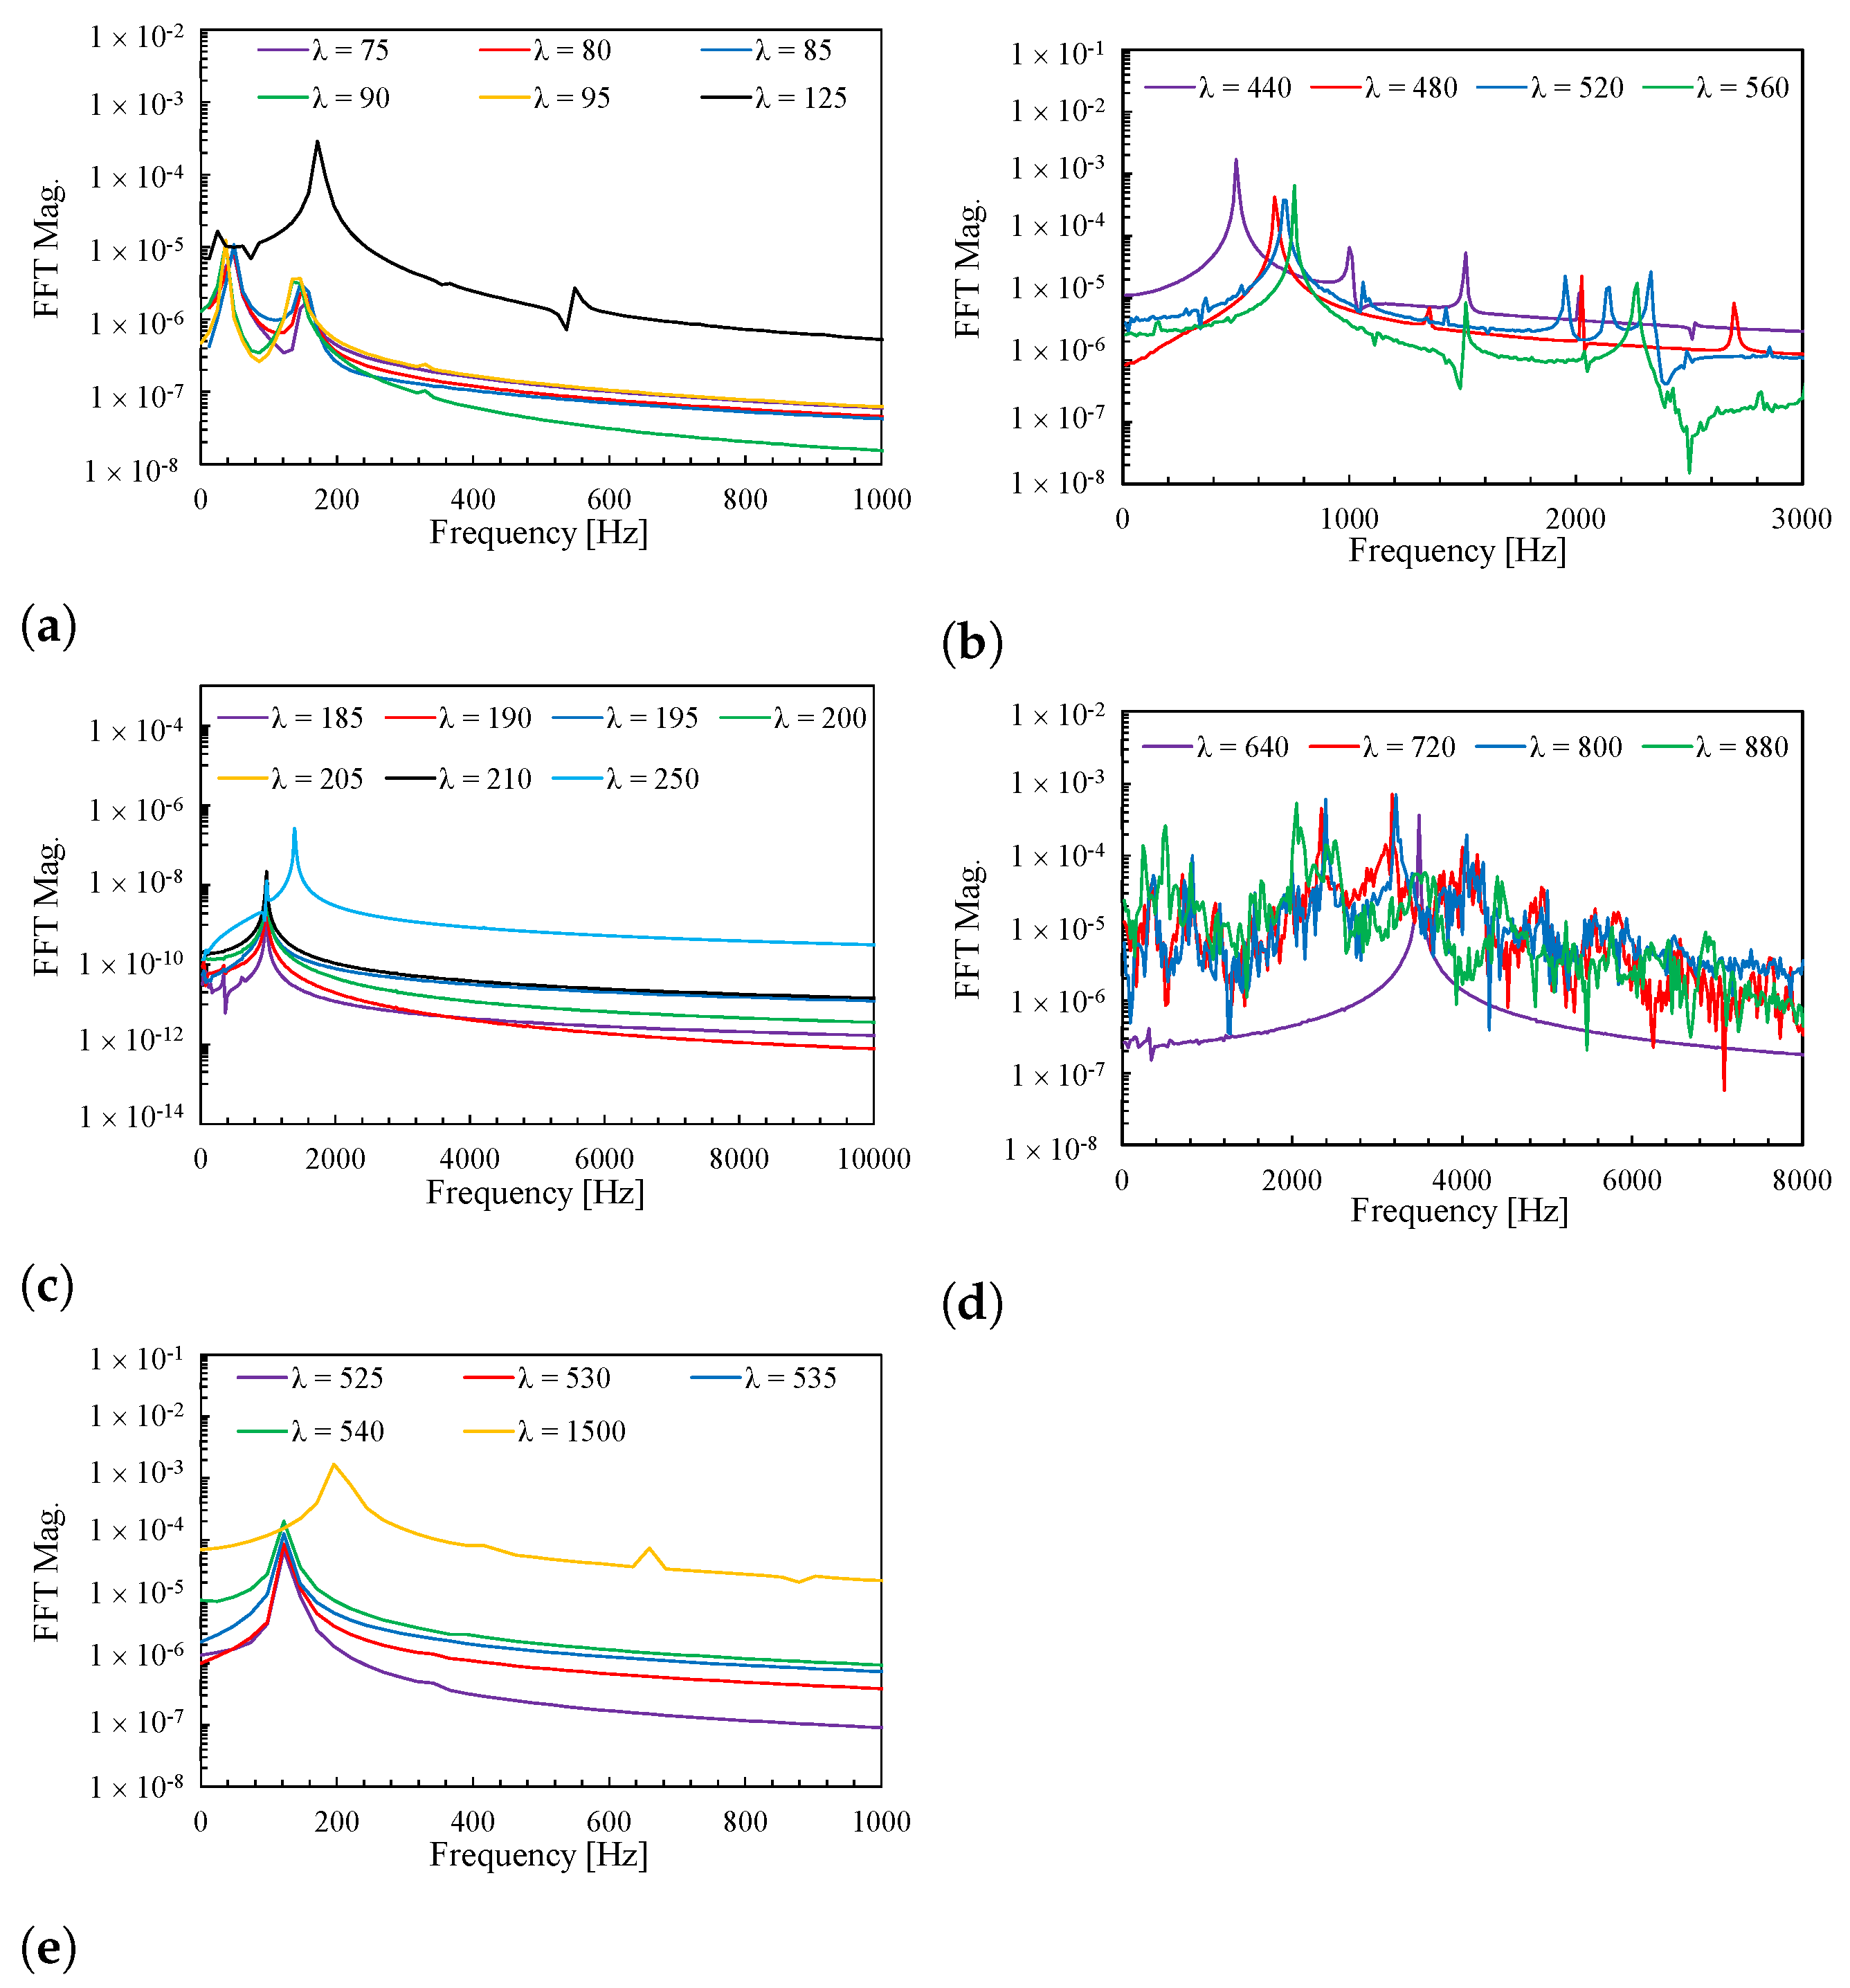
As shown in Figure 10a,b for M = 1.414 , two dominant frequencies appear for λ < 100 , and the LCO amplitudes do not significantly change. However, for λ > 100 , the flutter mode at λ = 125 is dominated by a single frequency. A single dominant mode is predicted for higher λ up to λ = 440 , but the dominant frequency and amplitude keep increasing. For even higher λ , the dominant frequency and amplitude remain unchanged, but higher harmonic frequencies start to appear.
The predictions for M = 1.6 (Figure 10c,d) show similar characteristics as the M = 1.414 case for up to λ = 640 , i.e., initially only the LCO amplitude grows, and the dominant frequency remains constant, then both the LCO amplitude and frequency increases. However, for higher λ values ( > 720 ), panel deflection shows a wide spectral content, a characteristic of chaotic response. The predictions for M = 1.8 and 2 also show initial growth of LCO amplitude, followed by an increase in amplitude and frequency. However, the deflection shows a single dominant mode over a wide range of λ .

5.2. Configuration B: Supersonic Flow with Oblique Shock Wave

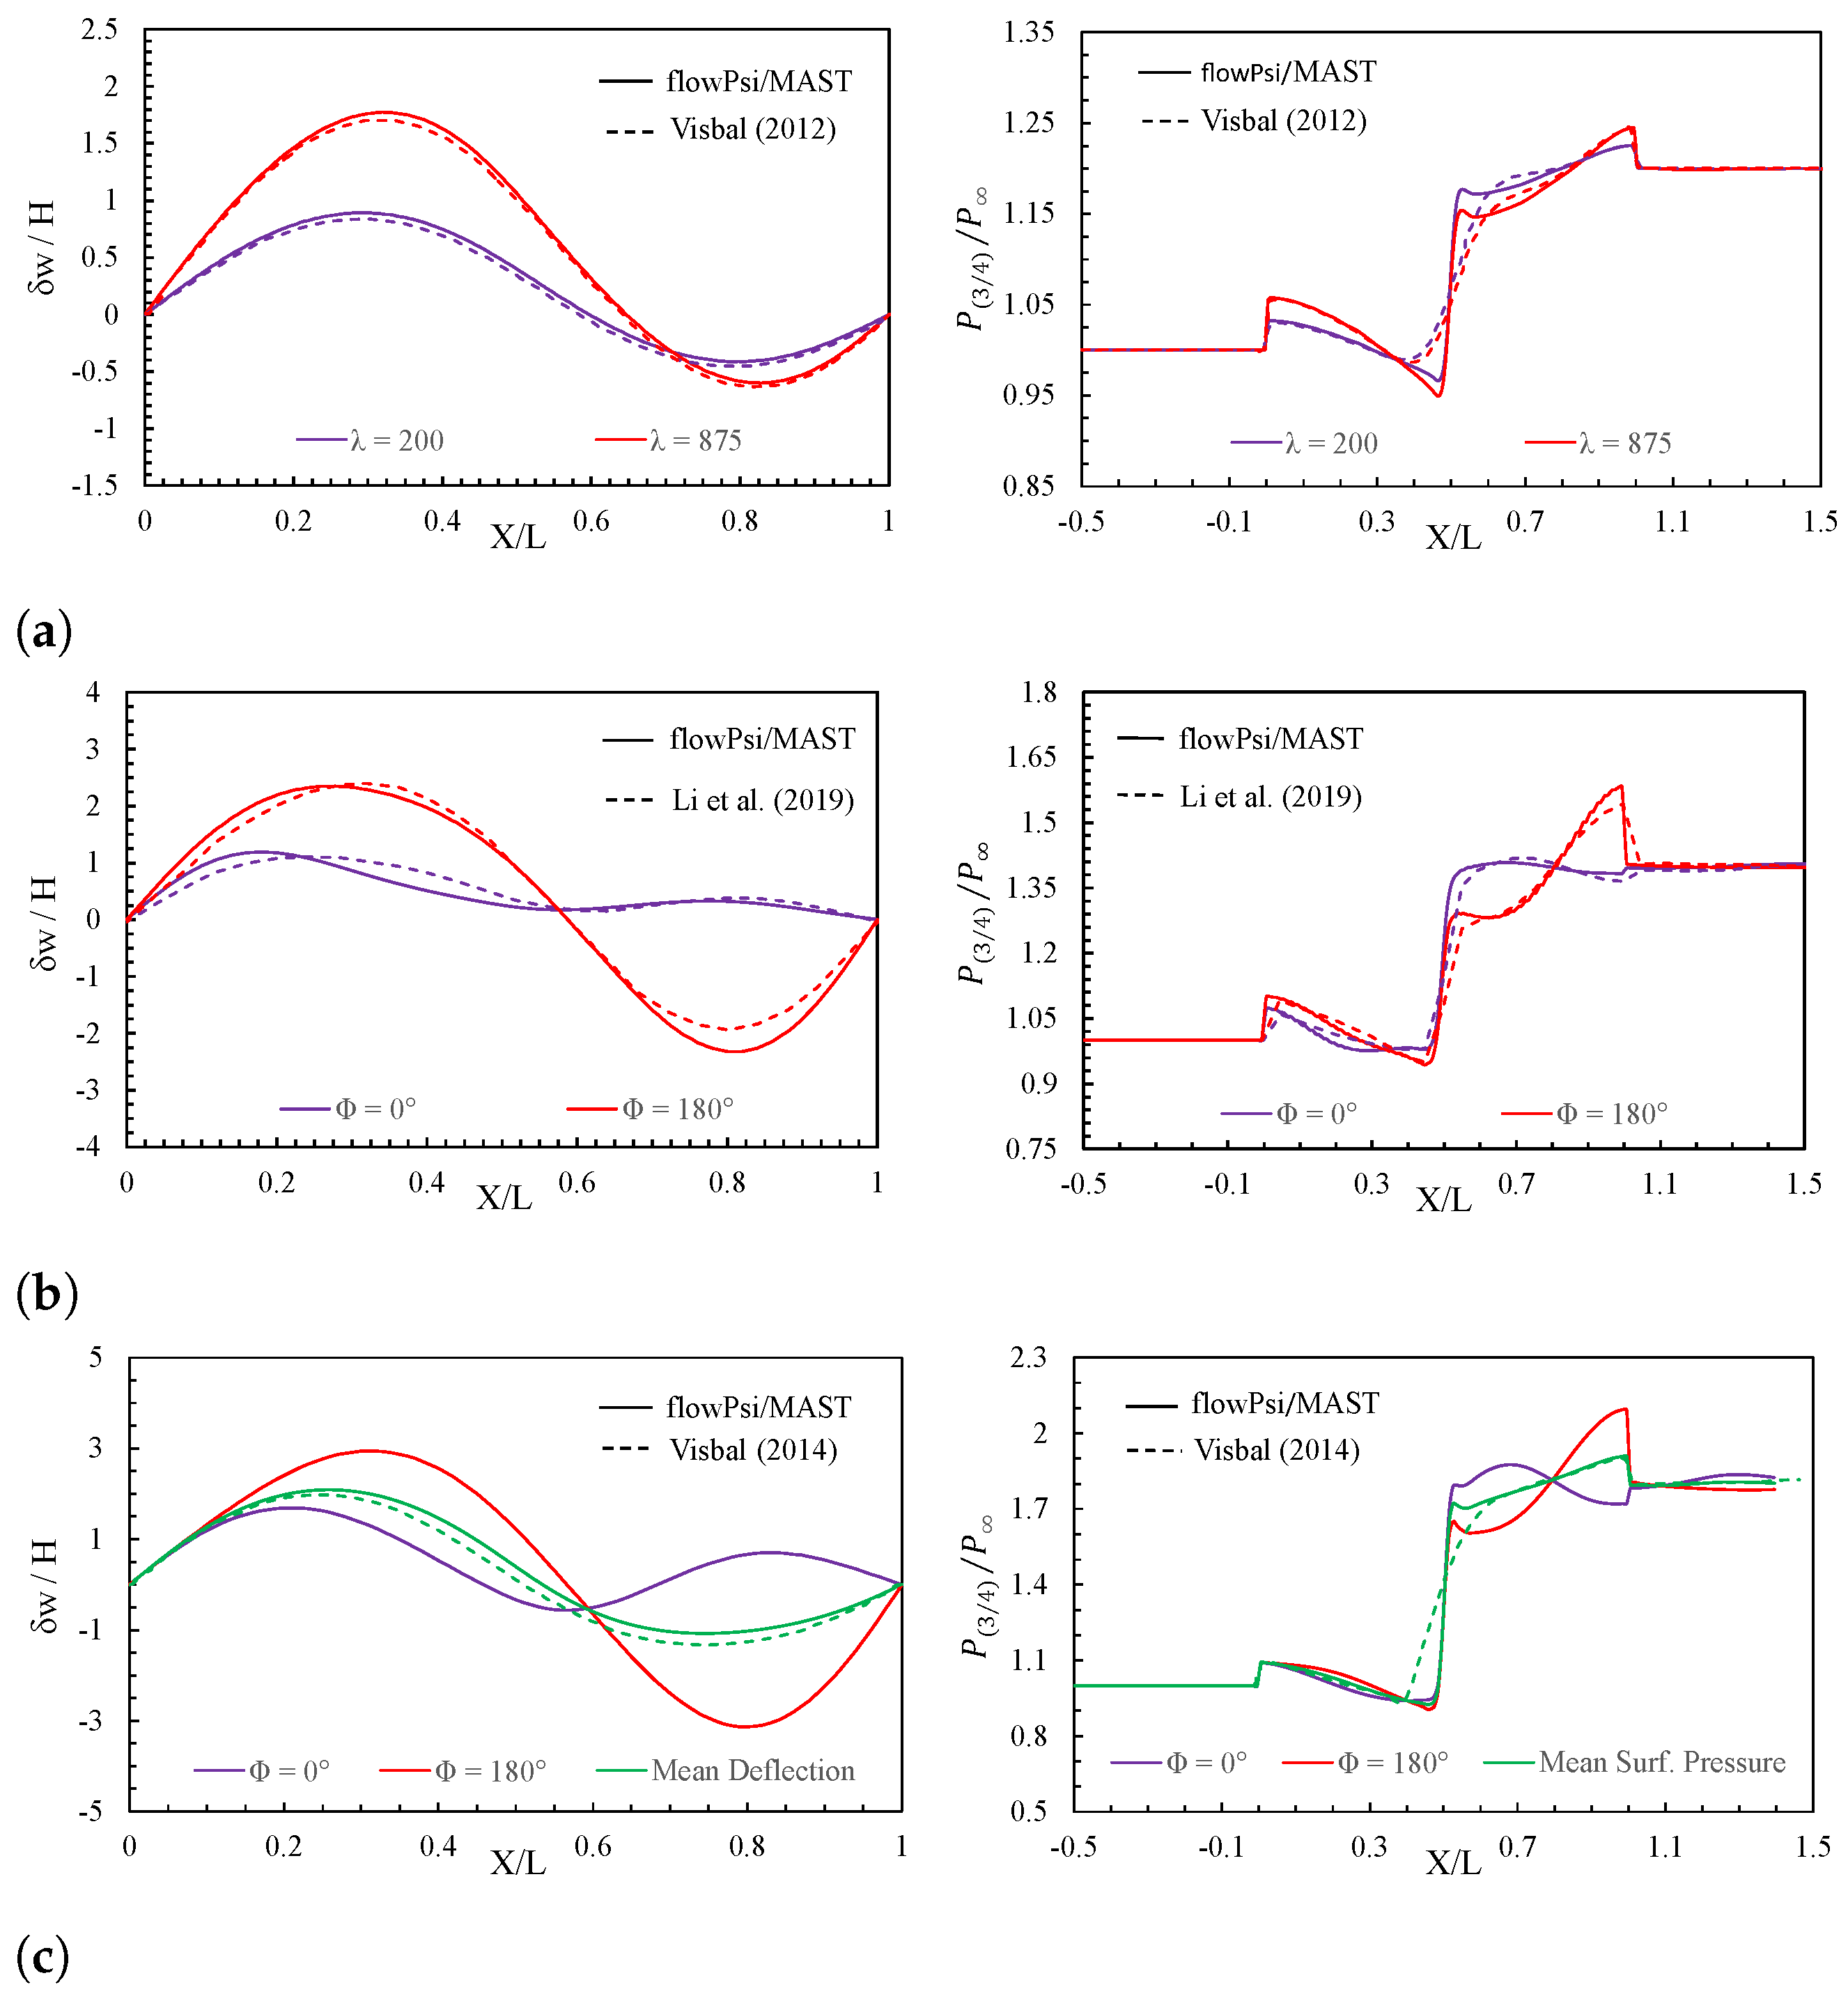
Inviscid Flow Predictions (Set # 2): Figure 11 and Figure 12 summarize the unsteady characteristics of LCO (i.e., amplitude and frequency) along with the panel deflection and surface pressure distribution for three shock strengths P 3 / P 1 = 1.2 , 1.4 , and 1.8 with increasing λ and the results were compared with the predictions of [15,23]. The dotted lines with unfilled markers correspond to the benchmark results of Visbal. Solid lines with filled markers represent the flowPsi/MAST predictions. Square, circle, and triangle markers correspond to a pressure ratio of P 3 / P 1 = 1.2 , 1.4 , and 1.8 , respectively. As the cavity pressure was set to the average of zones 1 and 3 pressures, the panel was forced outward in a convex shape on the leading edge and inward in a concave shape on the trailing edge. For P 3 / P 1 = 1.2 , the pressure differential was not strong enough to trigger an oscillatory response for the range of λ considered, resulting in a static panel deflection similar to Visbal. The stable panel deflection and surface pressure were compared to Visbal [15] for λ = 200 , and 875 as shown in Figure 12a. The surface pressure ratio near the leading and trailing edges of the panel exhibit significant similarities, while the region close to the impingement location ( X / L = 0.5 ) indicates a sharper capture of the oblique shock compared to [15].
For P 3 / P 1 = 1.4 , a subcritical bifurcation was noticed, and the predictions compare very well with Visbal [15] showing less than 2 % difference in the amplitude and frequency of the oscillations. The results in Figure 11a show a sudden onset of the structural instability leading to LCO around λ = 525 . The LCO amplitude asymptotically increases with the increase in λ , whereas the dominant frequency decreases steadily. The instantaneous panel deflection and surface pressure predictions for λ = 875 at Φ = 0 (corresponding to the minimum 3/4 th-cord deflection) and Φ = 180 (corresponding to the maximum 3/4th-cord deflection) were compared with that of [23] in Figure 12b. The present results exhibit strong similarities with the benchmark data. A strong shock is observed at the panel’s leading edge, followed by an equally strong expansion wave at the trailing edge. The results agree reasonably well with [23] except for up to 5 % differences in the displacement at the trough region for Φ = 180 .
For P 3 / P 1 = 1.8 , a supercritical bifurcation was noticed as shown in Figure 11a. The LCO amplitudes in the present study were 4 to 6 % over predicted compared to [39], whereas the frequencies were predicted within 2 % . The bifurcation point was around λ = 200 , and the LCO amplitude increases and frequency decreases asymptotically with the increase in λ . The amplitudes were higher than those for P 3 / P 1 = 1.4 as expected due to stronger pressure gradients. Similarly, the dominant frequency was 30 to 40 % higher for stronger shock. The instantaneous panel deflection and surface pressure predictions for λ = 875 at Φ = 0 and Φ = 180 in Figure 12c were very similar to those for P 3 / P 1 = 1.4 , except the deformations were larger, and surface pressure ratios were higher. The mean surface pressure ratio near the leading and trailing edges of the panel exhibit significant similarities, while the region close to the impingement location ( X / L = 0.5 ) indicated a sharper capture of the oblique shock compared to Visbal [39]. Similarly, the mean panel deflection also resulted in a small variation compared to Visbal. This could be a result of the higher grid resolution used in this study compared to Visbal.
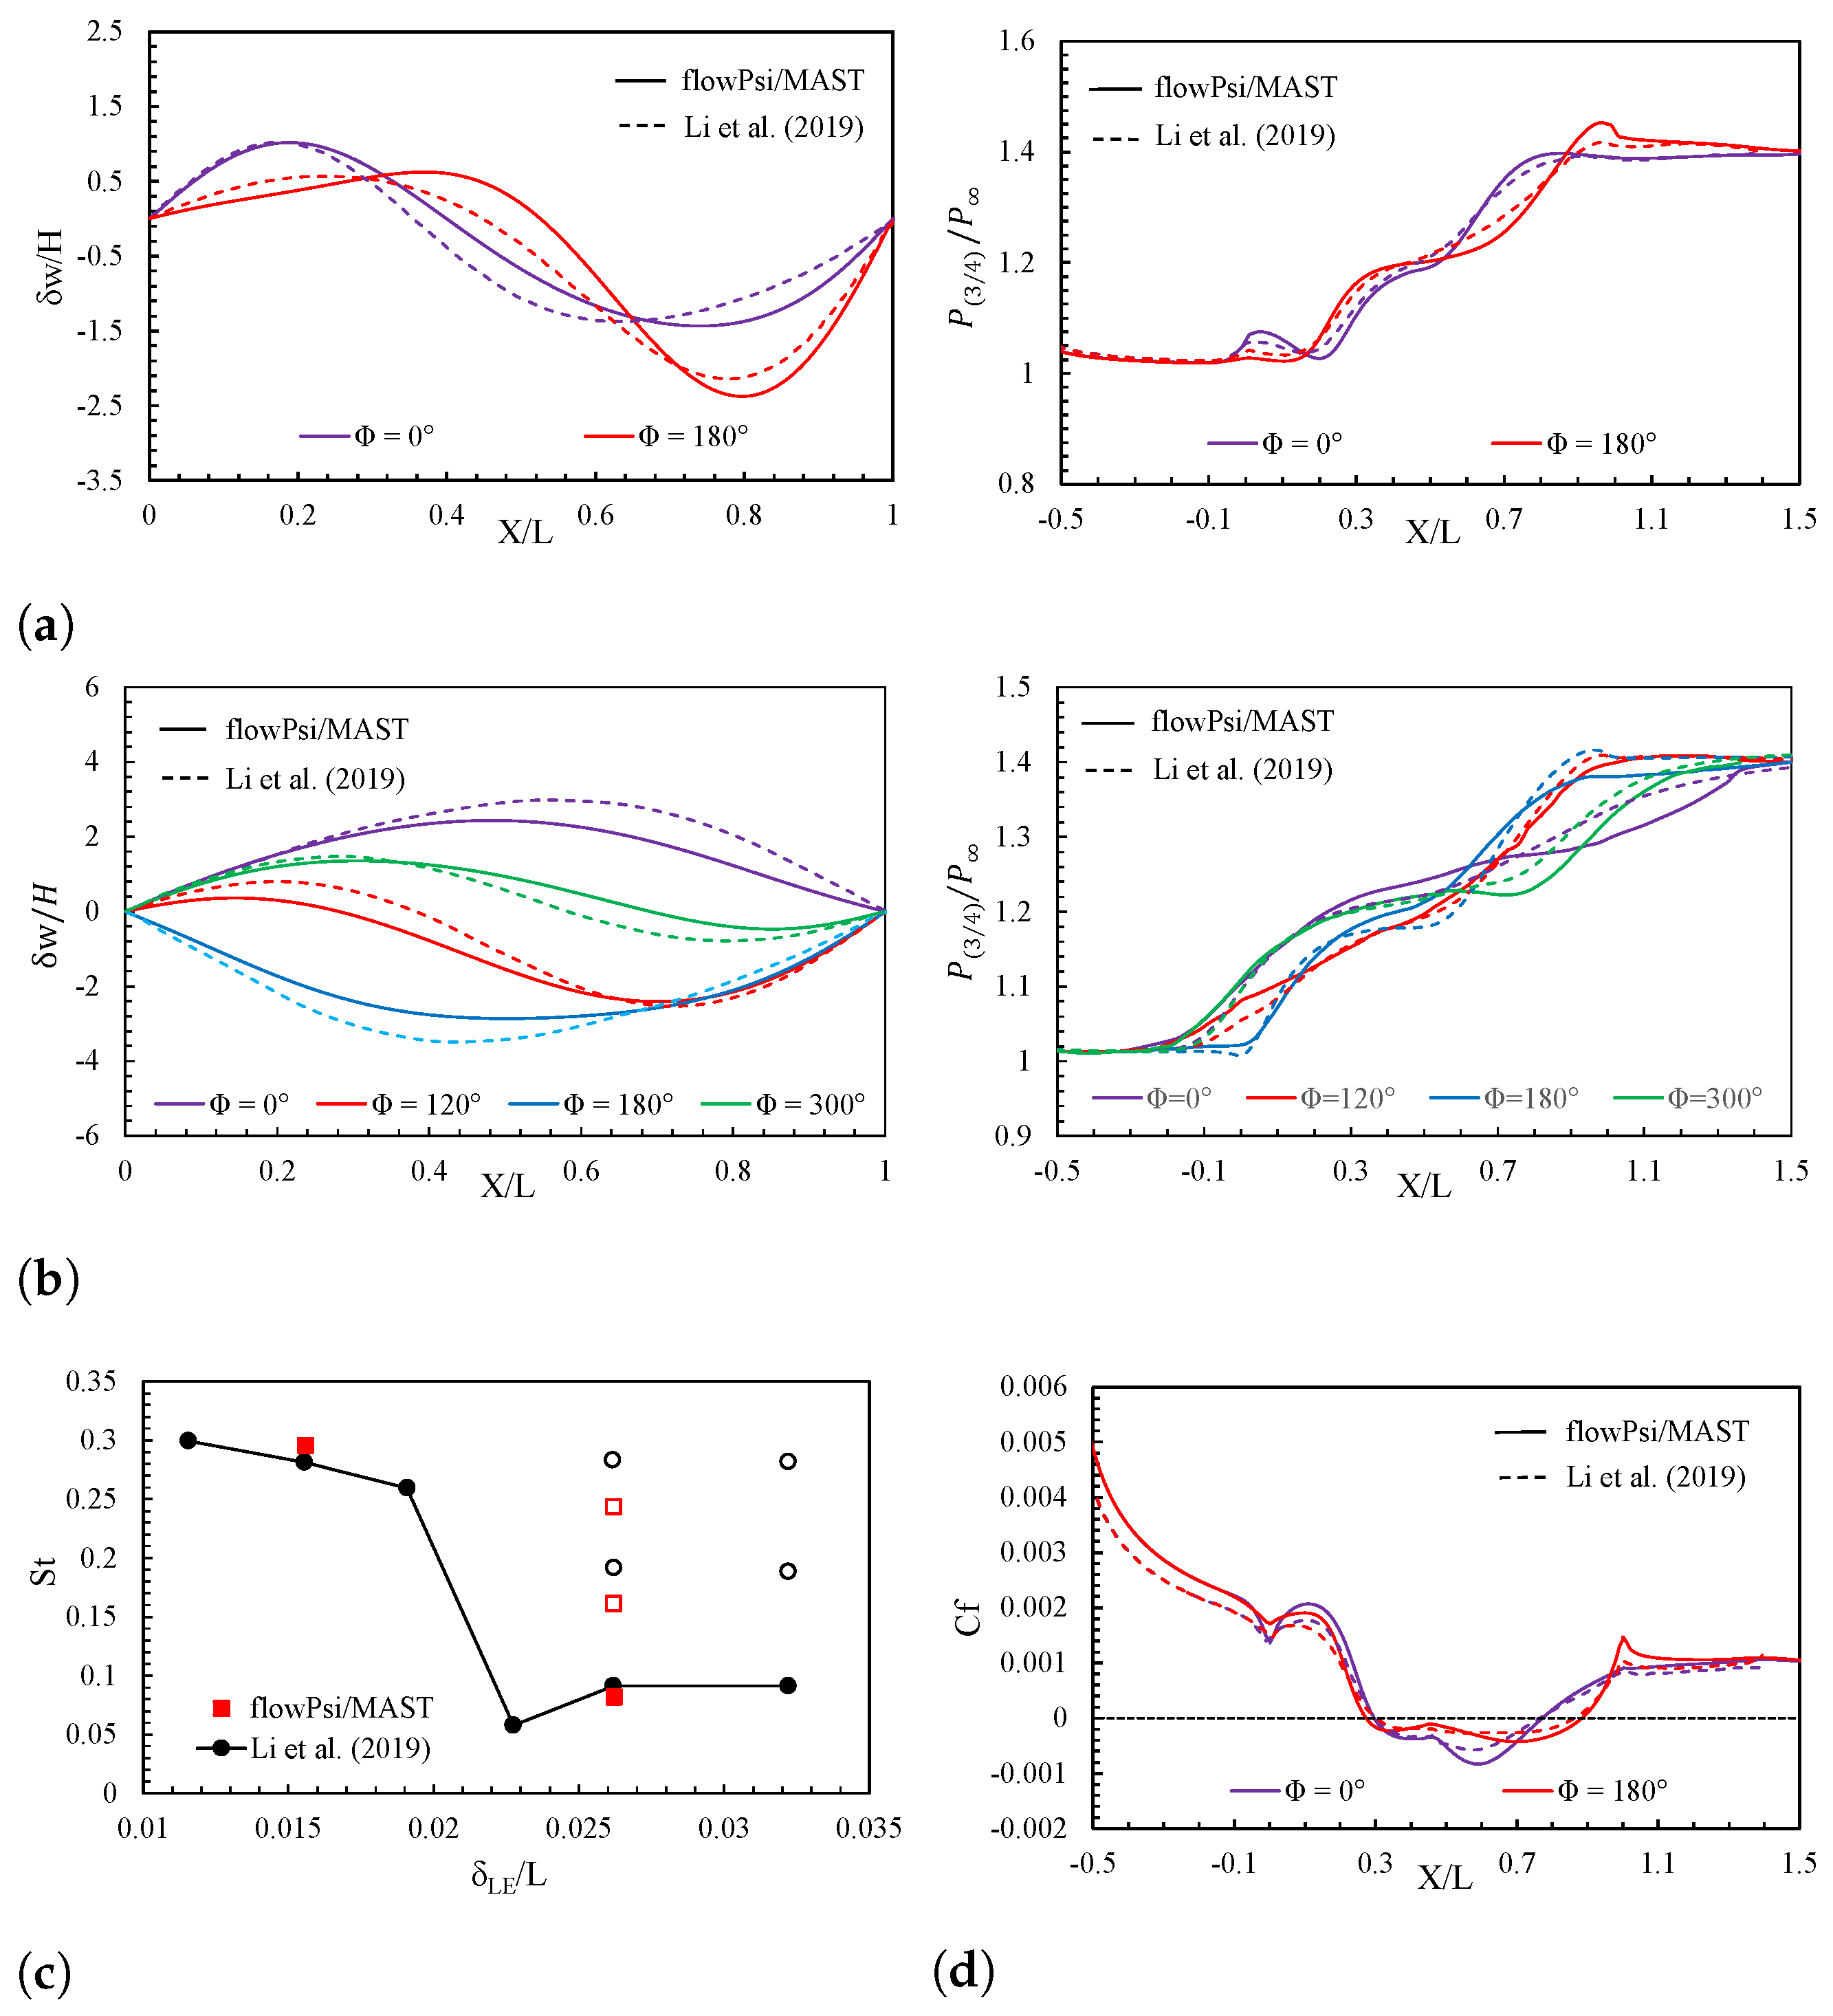
Laminar Flow Predictions (Set # 3): Laminar flow simulations were performed for P 3 / P 1 = 1.4 and λ = 875 for two different boundary layer thicknesses of δ LE = 0.0156 L and δ LE = 0.0262 L at the leading edge of the panel following the setup of Li et al. [23]. The flow over the flexible panel predicted an LCO. The panel deflection and surface pressure distribution at different phases of LCO were compared with [23] for both δ LE , and the predictions were reasonable with a slightly higher variation up to 10 % in the panel deflection. The δ LE = 0.0156 L case exhibited a dominant frequency of St = 0.3 , accompanied by a secondary harmonic with an order of magnitude smaller amplitude. The larger δ LE case displayed two significant harmonic frequencies. The dominant frequency was St = 0.08 , around one-fourth of the lower δ LE case. The secondary dominant frequency was St = 0.16 with an amplitude around one-fourth of the primary frequency. The tertiary harmonic was also detected but with a negligible amplitude. The St predictions of primary dominant frequencies compare well with [23]. The predictions of the coefficient of friction were also compared with the benchmark data for δ LE = 0.0156 L in Figure 13d for two different phase angles similar to panel deflection. The results indicated a very low difference on the panel when compared to the wall. Overall, lower δ LE cases compared better with Li et al., and the difference in the prediction could be because of different grid resolutions across the studies.

5.3. Configuration C: 3D Supersonic Uniform Flow (Set # 4)

Simulation set # 4 is focused on verifying the 3D FSI solver to predict the bifurcation point for a uniform supersonic flow of Mach M = 2 and a range of non-dimensional dynamic pressures λ = 700 to 3000. Figure 14 compares bifurcation point (onset of LCO) and flutter characteristics like amplitude and frequency of oscillations of a 2D square panel with the benchmark computational results of Boyer et al. [18] and Shinde et al. [26]. The results indicate that the panel exhibited supercritical Hopf bifurcation between λ = 800 and 900, and the characteristics of the oscillations matched well (with less than 2 % error) with the benchmark results. After the bifurcation, the panel exhibited oscillations with increasing amplitude and frequency, as shown for 2D simulations. Moreover, we can notice that the bifurcation point shifted to a higher λ compared to the 2D simulations. Perhaps this is due to the higher stiffness associated with the clamped boundary condition on all four edges. Note, that the non-dimensional frequency K f is related to the Strouhal number ( S t ), as shown in the nomenclature. In terms of S t , the frequency decreases with an increase in λ as shown in Figure 11.

6. Conclusions

This study aims to develop and verify a high-fidelity fluid-structure interaction solver for 2D and 3D supersonic flows to study the impact of shock boundary layer interactions in predicting the onset of flutter/buffet. A detailed description of the coupling mechanism using a conventional serial staggered (CSS) approach was presented, followed by grid and time-step convergence studies. The stability of the FSI solver was also shown to emphasize the role of higher Newton iterations and the superior stability characteristics of generalized-alpha structural time-integration scheme. The solver is then validated for subsonic and supersonic 2D inviscid flows, as well as 2D inviscid and laminar supersonic ( M = 2 ) flows with oblique shock impingement, against the benchmark computational results. The surface pressure distribution, panel deflection, LCO amplitude, and frequency predictions for inviscid and laminar flows were compared within 2, 4, and 10 % , respectively, with the benchmark results. The solver was extended to 3D supersonic inviscid flows over a square panel, which exhibited a good agreement with less than 2 % variation in the computational results with respect to benchmark results. Considering the reasonable error levels, the FSI solver was deemed verified. One of the significant limitations of this study is that the solver is not verified for 3D viscous flows and most practical applications require an FSI solver with such capability. Although the current verification is limited to 3D inviscid flows, future work will focus on extending the study to perform high-fidelity viscous simulations (using larger eddy simulation (LES) or dynamic hybrid RANS/LES) to study the effect of turbulent coherent structures on coupled fluid-structural instabilities and investigate the role of shock boundary layer interactions on the structural dynamics due to buffeting.

Author Contributions

Conceptualization, S.B. and E.C.; methodology, A.Z., E.C. and S.B.; software, A.Z. and E.C.; verification, S.P. and A.S.; formal analysis, S.P. and A.S.; investigation, S.P. and A.S.; writing-original draft preparation, S.P. and A.S.; writing-review and editing, A.Z., S.B. and S.P.; visualization, S.P. and A.S.; supervision, A.Z., E.C. and S.B.; project administration, S.B.; funding acquisition, S.B. All authors have read and agreed to the published version of the manuscript.

Funding

This work was funded by NASA EPSCoR under grant number 80NSSC17M0039, the High-Performance Computing Center at Mississippi State University graduate fellowship, and partially funded by NASA EPSCoR Award Number: 80NSSC21M0332.

Institutional Review Board Statement

Not applicable.

Informed Consent Statement

Not applicable.

Data Availability Statement

No new data were created or analyzed in this study. Data sharing is not applicable to this article.

Acknowledgments

The authors would like to express their sincere appreciation to the late Manav Bhatia for his guidance and support in developing the FSI solver.

Conflicts of Interest

The authors declare no conflicts of interest that may be perceived as inappropriately influencing the representation or interpretation of reported research results. Also, the funders had no role in the design of the study, in the collection, analysis, or interpretation of data, in the writing of the manuscript, or in the decision to publish the results.

Nomenclature

uFluid velocity [m/s]
TFluid temperature [K]
PFluid pressure [Pa]
ρ Fluid density [kg/m3]
u Free stream fluid velocity [m/s] u = M γ R T
T Free stream fluid temperature [K] T = P / ( ρ R )
P Free stream fluid pressure [Pa] P = λ D γ M 2 L 3
ρ Free stream fluid density [kg/m3] ρ = ρ s m r H L
γ Specific heat ratio
RFluid specific gas constant [J/kg-K]
aSpeed of sound in the fluid [m/s] a = γ R T
c p Fluid specific heat at constant pressure [J/kg-K] c p = γ R γ 1
μ Fluid dynamic viscosity [Pa-s]
ν Fluid kinematic viscosity [m2/s] ν = μ ρ
kFluid thermal conductivity [W/m-K]
MFluid Mach number  M =   u / a
P r Prandtl number P r = μ c p k
R e Reynold’s number R e = ρ u L r μ , where L r is reference length
δ Boundary layer thickness [m]
τ w Wall shear stress at a no-slip wall in the fluid domain
C f Skin friction coefficient at no-slip walls in the fluid domain C f = τ w 1 2 ρ u 2
T s Solid temperature [K]
E s Young’s modulus of the panel material [Pa]
ν s Poisson’s ratio of the panel material
c s Structure thermal heat capacity [J/kg-K]
ρ s Density of the panel material [kg/m3]
HPanel thickness [m]
LPanel streamwise length [m]
DPanel flexural rigidity [Pa-m3] D = E s H 3 12 ( 1 ν s 2 )
x s Panel deflection [m]
fFrequency [Hz]
K f Nondimensional frequency K f = 2 π f ρ s H L 4 / D
StStrouhal number S t = f L u
m r Mass ratio m r = ρ L ρ s H
λ Non-dimensional dynamic pressure λ = ρ u 2 L 3 D
[ · ] Fluid freestream property
[ · ] 0 Fluid stagnation property
[ · ] ^ Fluid filtered quantity
[ · ] ˜ Fluid Favre averaged quantity [40]

Appendix A. Fluid-Structure Coupling Algorithm
The FSI transfer scheme used in this work is an adaptation of the coupling framework developed by Zope et al. [41] for the fluid-thermal analysis. This approach employs a set of independent scaffolding elements to connect the fluid nodes on the FSI boundary to the nearest faces on the structural mesh. The integrated stresses over the fluid FSI boundary faces are transferred to the solid FSI boundary nodes using a system of equations derived from the finite element formulation of the steady-state heat conduction equation. Therefore, the scheme naturally works conservatively. A similar system of equations is used to transfer the displacements from the solid FSI boundary nodes to the fluid FSI boundary nodes. This method ensures that the displacement interpolation is consistent and allows the transfer scheme to work correctly even when the fluid and solid mesh on the interface are not point-matched.
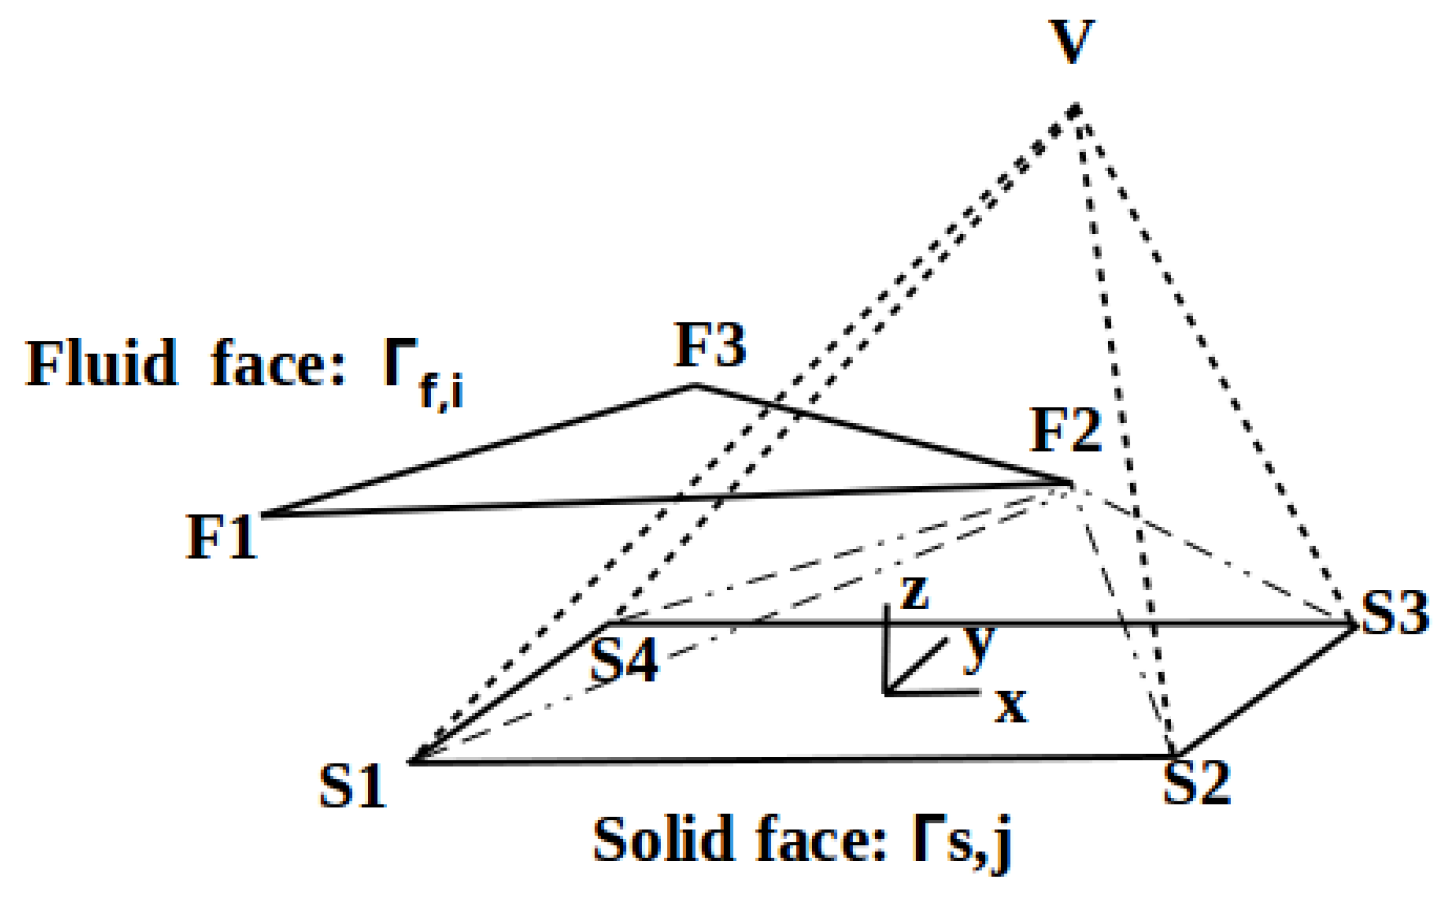
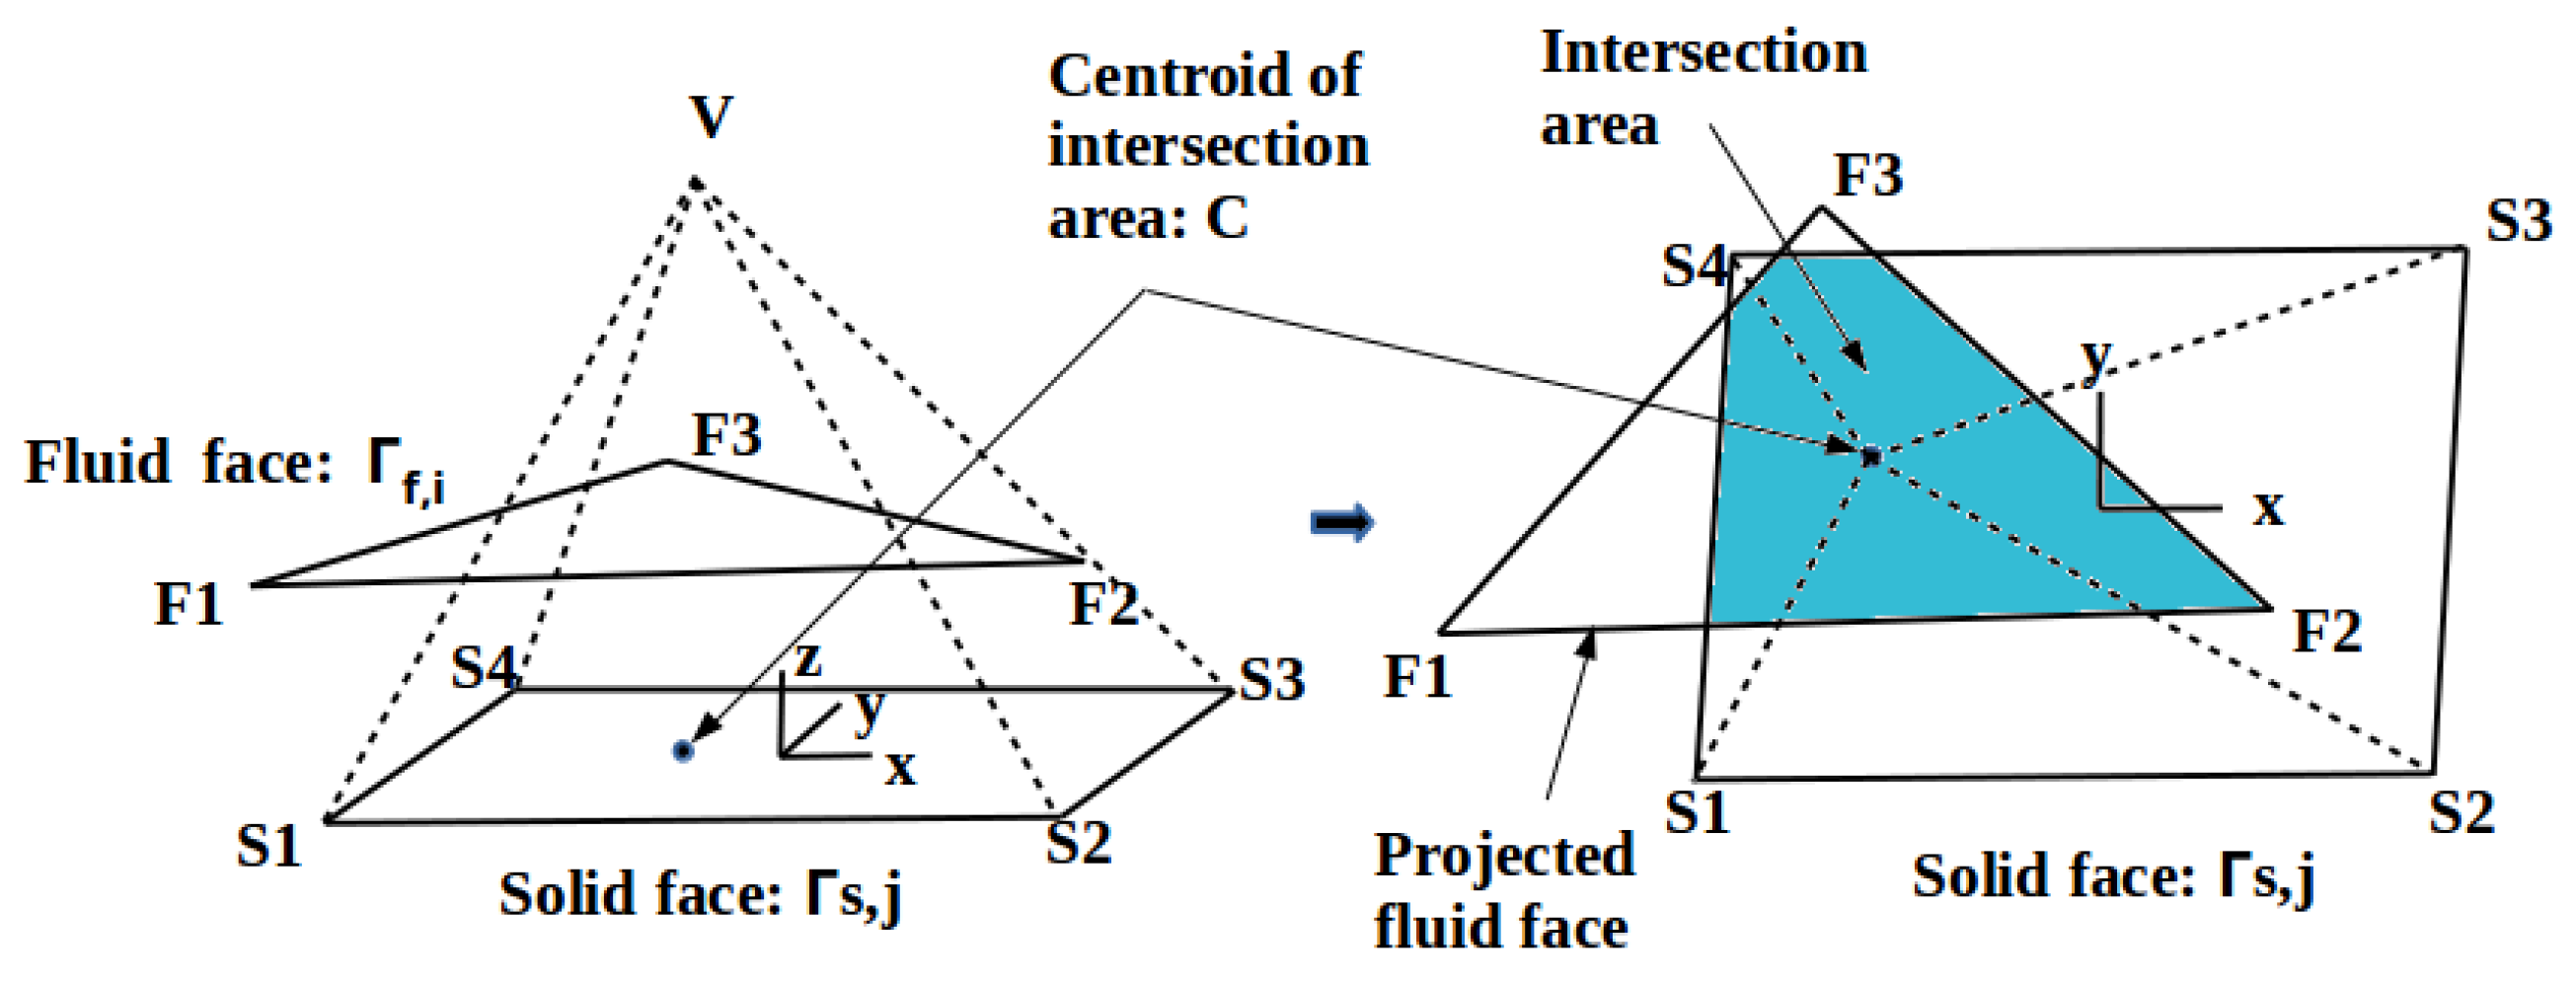
Let us denote the mapping from the fluid FSI boundary faces to the solid FSI boundary faces as M f s . The mapping M f s aggregates the force contributions from the fluid to the solid by utilizing an area-weighted linear combination of forces through the fluid faces. A local coordinate system is formed on the solid face as shown in Figure A1 and the fluid face is projected onto it. A weight, W Γ f i Γ s j , is computed between the i th fluid face, Γ f i , and the j th structural face, Γ s j , as the ratio of the projected intersection area, | Γ , f i Γ s j | , to the total area of the projected fluid face, | Γ , f i | , where Γ , f i is the projection of Γ f i onto Γ s j . The intersection polygon is computed using Sutherland and Hodgman [42] algorithm. Due to the nature of coupling at the interface, this ratio can be thought of as the fraction of the force from i th fluid face to be transferred to the nodes of j th solid face.
W Γ f i Γ s j = | Γ , f i Γ s j | | Γ , f i |
The centroid of the intersection area is also computed and is taken as the location where the force from the fluid face will be applied to the solid face. The force through this centroid location is given by:
f Γ f i Γ s j = W Γ f i Γ s j Γ f i P ^ f + σ · n f d Γ = W Γ f i Γ s j f Γ f i ,
where F ˜ Γ f i is the integrated stresses over the entire fluid face.
f Γ f i = Γ f i P ^ f + σ · n f d Γ
Figure A1. Force transfer from fluid to solid: Construction of scaffold element by projecting a fluid face onto a solid face.
Computation 12 00129 g0a1
In a similar manner, we denote the mapping from solid FSI boundary faces to the fluid FSI boundary nodes as M s f . The mapping M s f is formed by projecting fluid FSI nodes onto solid FSI faces and assigning each fluid node to the closest solid face that contains its projected point. The fluid node and the solid face are then used to construct another scaffolding element as shown in Figure A2. This element is then used to interpolate the displacements at the nodes of the solid boundary to the fluid nodes as described below.
Figure A2. Displacement transfer from solid to fluid: Construction of scaffold element by projecting a fluid node onto a solid face.
Computation 12 00129 g0a2
Each connection in the maps M f s and M s f is used to generate a scaffolding element. A schematic of a prototypical element is shown in Figure A3 in which a fluid mesh node, F, or projected-area centroid, C, is embedded inside a pyramid (or tetrahedron) element. For fluid-to-solid force transfer the centroid of the projected area, C, is used. For solid-to-fluid displacement transfer the fluid mesh node, F, is used. The base of the element is defined by the nodes of the solid face, S i , for i [ 1 , N s ] (tetrahedron: N s = 3 , pyramid: N s = 4 ) and a virtual vertex node, V, which is offset from the base to ensure that the volume element remains non-degenerate. The location of the vertex node x V is computed in a manner that guarantees that x F or x C will be located within the scaffolding element. For example, if we use the square root of the area of the solid face as its representative length scale, then the location of the apex can be computed as, to ensure that the centroid or the fluid node is within the element.
x V = x C + | Γ s , j | n s
or
x V = x F + | Γ s , j | n s
When taken together, the maps in M f s and M s f generate a layer of independent scaffold elements between the FSI boundary of the fluid and solid domain. Therefore, the contributions to the force at a solid FSI node from multiple fluid faces can be accumulated in parallel. Likewise, the displacement at each fluid FSI node can be independently interpolated from the nodes on its assigned FSI solid face.
Figure A3. Scaffold element.
Computation 12 00129 g0a3
The algebraic relations are obtained by invoking the concept of a scaffolding element that is in rigid body motion, that is, the Poisson’s ratio is 0.5. For a single scaffold element, from the principle of virtual work,
Ω scaff δ ϵ T σ δ x s T f ext d Ω = 0
where, Ω scaff is the domain of the scaffolding element, δ ϵ = ϵ x x , ϵ y y , ϵ z z , γ x y , γ y z , γ z x T is the variational strain, σ = σ x x , σ y y , σ z z , τ x y , τ y z , τ z x T is the stress. The external work on the element can be defined using discrete values of displacement and force vectors at the points within the element using Equation (A7).
Ω scaff δ x s T f ext = δ x S 1 T f S 1 + δ x S 2 T f S 2 + δ x S 3 T f S 3 + δ x S 4 T f S 4 + δ x V T f V + δ x C T f C
Note, that, the displacement at node C is related to the displacements at the other nodes through Equation (A8).
δ x C = B C ( 1 ) B C ( 2 ) B C ( 3 ) B C ( 4 ) B C ( 5 ) B C δ x S 1 δ x S 2 δ x S 3 δ x S 4 δ x V δ X
Here,
B C ( i ) = N i 0 0 0 N i 0 0 0 N i , i = 1 . . . 5
and N 1 , N 2 , N 3 , N 4 , and N 5 are the shape functions evaluated at node C. Using standard numerical quadrature, the following system of equations can be derived for the element.
K 11 K 12 K 13 K 14 K 15 K 21 K 22 K 23 K 24 K 25 K 31 K 32 K 33 K 34 K 35 K 41 K 42 K 43 K 44 K 45 K 51 K 52 K 53 K 54 K 55 δ x S 1 δ x S 2 δ x S 3 δ x S 4 δ x V = f S 1 f S 2 f S 3 f S 4 0 + B C ( 1 ) B C ( 2 ) B C ( 3 ) B C ( 4 ) B C ( 5 ) f C ,
A similar set of equations can be created for a tetrahedral element when the solid face is a triangle. To transfer force at node C to the nodes of the solid face, assume that δ x S 1 = δ x S 2 = δ x S 3 = δ x S 4 = 0 . Then,
δ x V = K 55 1 B C ( 5 ) f C
Substituting in the other equations,
f S 1 = K 15 K 55 1 B C ( 5 ) f C B C ( 1 ) f C
f S 2 = K 25 K 55 1 B C ( 5 ) f C B C ( 2 ) f C
f S 3 = K 35 K 55 1 B C ( 5 ) f C B C ( 3 ) f C
f S 4 = K 45 K 55 1 B C ( 5 ) f C B C ( 4 ) f C
Next, in order to obtain the displacement δ x F using the map M s f , we replace subscript C with subscript F in Equation (A10) and the scaffolding element is used as an interpolating device. Given the values of displacements on the structural nodes, δ x S i , i = 1 , , N S , it is assumed that no load is applied at any node of the element as well as the fluid node, that is, f S i = f F = 0 . Then, displacement δ x V is obtained from the last row of Equation (A10) such that the element is under rigid body motion:
δ x V = K 55 1 K 51 δ x S 1 + K 52 δ x S 2 + K 53 δ x S 3 + K 54 δ x S 4
Now, δ x F can be determined through interpolation within the element, which is then used as the nodal value of displacement at the fluid node corresponding to F.

References

  1. Collar, A. The expanding domain of aeroelasticity. Aeronaut. J. 1946, 50, 613–636. [Google Scholar] [CrossRef]
  2. Costanzo, A. Experimental Investigation of Shock Wave-Boundary Layer Interaction on a Generic Oscillating Bump; KTH Industrial Engineering and Management: Stockholm, Sweden, 2014. [Google Scholar]
  3. Dowell, E.H. Panel flutter-A review of the aeroelastic stability of plates and shells. AIAA J. 1970, 8, 385–399. [Google Scholar] [CrossRef]
  4. Mei, C.; Abdel-Motagaly, K.; Chen, R. Review of nonlinear panel flutter at supersonic and hypersonic speeds. Appl. Mech. Rev. 1999, 52, 321–332. [Google Scholar] [CrossRef]
  5. Ganji, H.F.; Dowell, E.H. Panel flutter prediction in two dimensional flow with enhanced piston theory. J. Fluids Struct. 2016, 63, 97–102. [Google Scholar] [CrossRef]
  6. Brouwer, K.R.; McNamara, J.J. Enriched Piston Theory for Expedient Aeroelastic Loads Prediction in the Presence of Shock Impingements. AIAA J. 2019, 57, 1288–1302. [Google Scholar] [CrossRef]
  7. Chai, Y.; Gao, W.; Ankay, B.; Li, F.; Zhang, C. Aeroelastic analysis and flutter control of wings and panels: A review. Int. J. Mech. Syst. Dyn. 2021, 1, 5–34. [Google Scholar] [CrossRef]
  8. Panchal, J.; Benaroya, H. Review of control surface freeplay. Prog. Aerosp. Sci. 2021, 127, 100729. [Google Scholar] [CrossRef]
  9. Antimirova, E.; Jung, J.; Zhang, Z.; Machuca, A.; Gu, G.X. Overview of Computational Methods to Predict Flutter in Aircraft. J. Appl. Mech. 2024, 91, 050801. [Google Scholar] [CrossRef]
  10. Christian, M.; Steven J, H.; E, H.v.B.; Rene, d.B. A monolithic approach to fluid–structure interaction. Comput. Fluids 2004, 33, 839–848. [Google Scholar]
  11. Meduri, S.; Cremonesi, M.; Perego, U.; Bettinotti, O.; Kurkchubasche, A.; Oancea, V. A partitioned fully explicit Lagrangian finite element method for highly nonlinear fluid–structure interaction problems. Int. J. Numer. Methods Eng. 2018, 113, 43–64. [Google Scholar] [CrossRef]
  12. Davis, G.; Bendiksen, O. Transonic panel flutter. In Proceedings of the 34th Structures, Structural Dynamics and Materials Conference, La Jolla, CA, USA, 19–22 April 1993; p. 1476. [Google Scholar]
  13. Lee-Rausch, E.M.; Batina, J.T. Wing flutter boundary prediction using unsteady Euler aerodynamic method. J. Aircr. 1995, 32, 416–422. [Google Scholar] [CrossRef]
  14. Chen, X.; Zha, G.C.; Yang, M.T. Numerical simulation of 3-D wing flutter with fully coupled fluid-structural interaction. Comput. Fluids 2007, 36, 856–867. [Google Scholar] [CrossRef]
  15. Visbal, M. On the interaction of an oblique shock with a flexible panel. J. Fluids Struct. 2012, 30, 219–225. [Google Scholar] [CrossRef]
  16. Shishaeva, A.; Vedeneev, V.; Aksenov, A. Nonlinear single-mode and multi-mode panel flutter oscillations at low supersonic speeds. J. Fluids Struct. 2015, 56, 205–223. [Google Scholar] [CrossRef]
  17. Bhatia, M.; Beran, P. Transonic panel flutter predictions using a linearized stability formulation. AIAA J. 2017, 55, 3499–3516. [Google Scholar] [CrossRef]
  18. Boyer, N.R.; McNamara, J.; Gaitonde, D.; Barnes, C.J.; Visbal, M.R. Features of shock-induced panel flutter in three-dimensional inviscid flow. J. Fluids Struct. 2018, 83, 490–506. [Google Scholar] [CrossRef]
  19. Gordnier, R.E.; Visbal, M.R. Development of a three-dimensional viscous aeroelastic solver for nonlinear panel flutter. J. Fluids Struct. 2002, 16, 497–527. [Google Scholar] [CrossRef]
  20. Gordnier, R.E.; Visbal, M.R. Computation of three-dimensional nonlinear panel flutter. J. Aerosp. Eng. 2003, 16, 155–166. [Google Scholar] [CrossRef]
  21. Vedeneev, V. Interaction of panel flutter with inviscid boundary layer instability in supersonic flow. J. Fluid Mech. 2013, 736, 216–249. [Google Scholar] [CrossRef]
  22. Ostoich, C.M.; Bodony, D.J.; Geubelle, P.H. Interaction of a Mach 2.25 turbulent boundary layer with a fluttering panel using direct numerical simulation. Phys. Fluids 2013, 25, 110806. [Google Scholar] [CrossRef]
  23. Li, Y.; Luo, H.; Chen, X.; Xu, J. Laminar boundary layer separation over a fluttering panel induced by an oblique shock wave. J. Fluids Struct. 2019, 90, 90–109. [Google Scholar] [CrossRef]
  24. Boyer, N.R.; McNamara, J.; Gaitonde, D.; Barnes, C.J.; Visbal, M.R. Features of panel flutter response to shock boundary layer interactions. J. Fluids Struct. 2021, 101, 103207. [Google Scholar] [CrossRef]
  25. Shinde, V.; McNamara, J.J.; Gaitonde, D.V.; Barnes, C.J.; Visbal, M.R. Panel Flutter Induced by Transitional Shock Wave Boundary Layer Interaction. In Proceedings of the 2018 Fluid Dynamics Conference, Atlanta, GA, USA, 25–29 June 2018; p. 3548. [Google Scholar]
  26. Shinde, V.J.; McNamara, J.J.; Gaitonde, D.V. Shock wave turbulent boundary layer interaction over a flexible panel. In Proceedings of the AIAA Scitech 2021 Forum, Virtual Event, 11–15 and 19–21 January 2021; p. 0488. [Google Scholar]
  27. Cavagna, L.; Quaranta, G.; Mantegazza, P. Application of Navier–Stokes simulations for aeroelastic stability assessment in transonic regime. Comput. Struct. 2007, 85, 818–832. [Google Scholar] [CrossRef]
  28. Ozcatalbas, M.; Acar, B.; Uslu, S. Investigation of Aeroelastic Stability on AGARD 445.6 Wing at Transonic Regime. In Proceedings of the 2018 9th International Conference on Mechanical and Aerospace Engineering (ICMAE), Budapest, Hungary, 10–13 July 2018; pp. 565–569. [Google Scholar]
  29. Wang, J. Transonic static aeroelastic and longitudinal aerodynamic characteristics of a low-aspect-ratio swept wing. AIP Adv. 2019, 9, 045203. [Google Scholar] [CrossRef]
  30. Im, H.; Chen, X.; Zha, G. Prediction of a supersonic wing flutter boundary using a high fidelity detached eddy simulation. In Proceedings of the 50th AIAA Aerospace Sciences Meeting including the New Horizons Forum and Aerospace Exposition, Nashville, TN, USA, 9–12 January 2012; p. 39. [Google Scholar]
  31. Gan, J.; Zha, G. Delayed Detached Eddy Simulation of Supersonic Panel Aeroelasticity Using Fully Coupled Fluid Structure Interaction with High Order Schemes. In Proceedings of the 34th AIAA Applied Aerodynamics Conference, Washington, DC, USA, 13–17 June 2016; p. 4046. [Google Scholar]
  32. Luke, E.; Cinnella, P. Numerical simulations of mixtures of fluids using upwind algorithms. Comput. Fluids 2007, 36, 1547–1566. [Google Scholar] [CrossRef]
  33. Bhatia, M.; Beran, P.S. MAST: An Open-Source Computational Framework for Design of Multiphysics Systems. In Proceedings of the 2018 AIAA/ASCE/AHS/ASC Structures, Structural Dynamics, and Materials Conference, Kissimmee, FL, USA, 8–12 January 2018; p. 1650. [Google Scholar]
  34. Luke, E.; Collins, E.; Blades, E. A fast mesh deformation method using explicit interpolation. J. Comput. Phys. 2012, 231, 586–601. [Google Scholar] [CrossRef]
  35. Babinsky, H.; Harvey, J. (Eds.) Shock Wave-Boundary-Layer Interactions; Cambridge Aerospace Series; Cambridge University Press: Cambridge, UK, 2011. [Google Scholar] [CrossRef]
  36. Gordnier, R.E.; Fithen, R. Coupling of a nonlinear finite element structural method with a Navier—Stokes solver. Comput. Struct. 2003, 81, 75–89. [Google Scholar] [CrossRef]
  37. Dowell, E.H. Nonlinear oscillations of a fluttering plate. II. AIAA J. 1967, 5, 1856–1862. [Google Scholar] [CrossRef]
  38. Chung, J.; Hulbert, G.M. A Time Integration Algorithm for Structural Dynamics with Improved Numerical Dissipation: The Generalized-α Method. J. Appl. Mech. 1993, 60, 371–375. [Google Scholar] [CrossRef]
  39. Visbal, M. Viscous and inviscid interactions of an oblique shock with a flexible panel. J. Fluids Struct. 2014, 48, 27–45. [Google Scholar] [CrossRef]
  40. Favre, A. Turbulence: Space-time statistical properties and behavior in supersonic flows. Phys. Fluids 1983, 26, 2851–2863. [Google Scholar] [CrossRef]
  41. Zope, A.D.; Schemmel, A.; Bhatia, M.; Bhushan, S.; Collins, E. Development and Validation of Fluid-Thermal Interaction Solver for High Fidelity Transient Simulations. In Proceedings of the AIAA Aviation 2020 Forum, Virtual Event, 15–19 June 2020; p. 3006. [Google Scholar]
  42. Sutherland, I.E.; Hodgman, G.W. Reentrant polygon clipping. Commun. ACM 1974, 17, 32–42. [Google Scholar] [CrossRef]
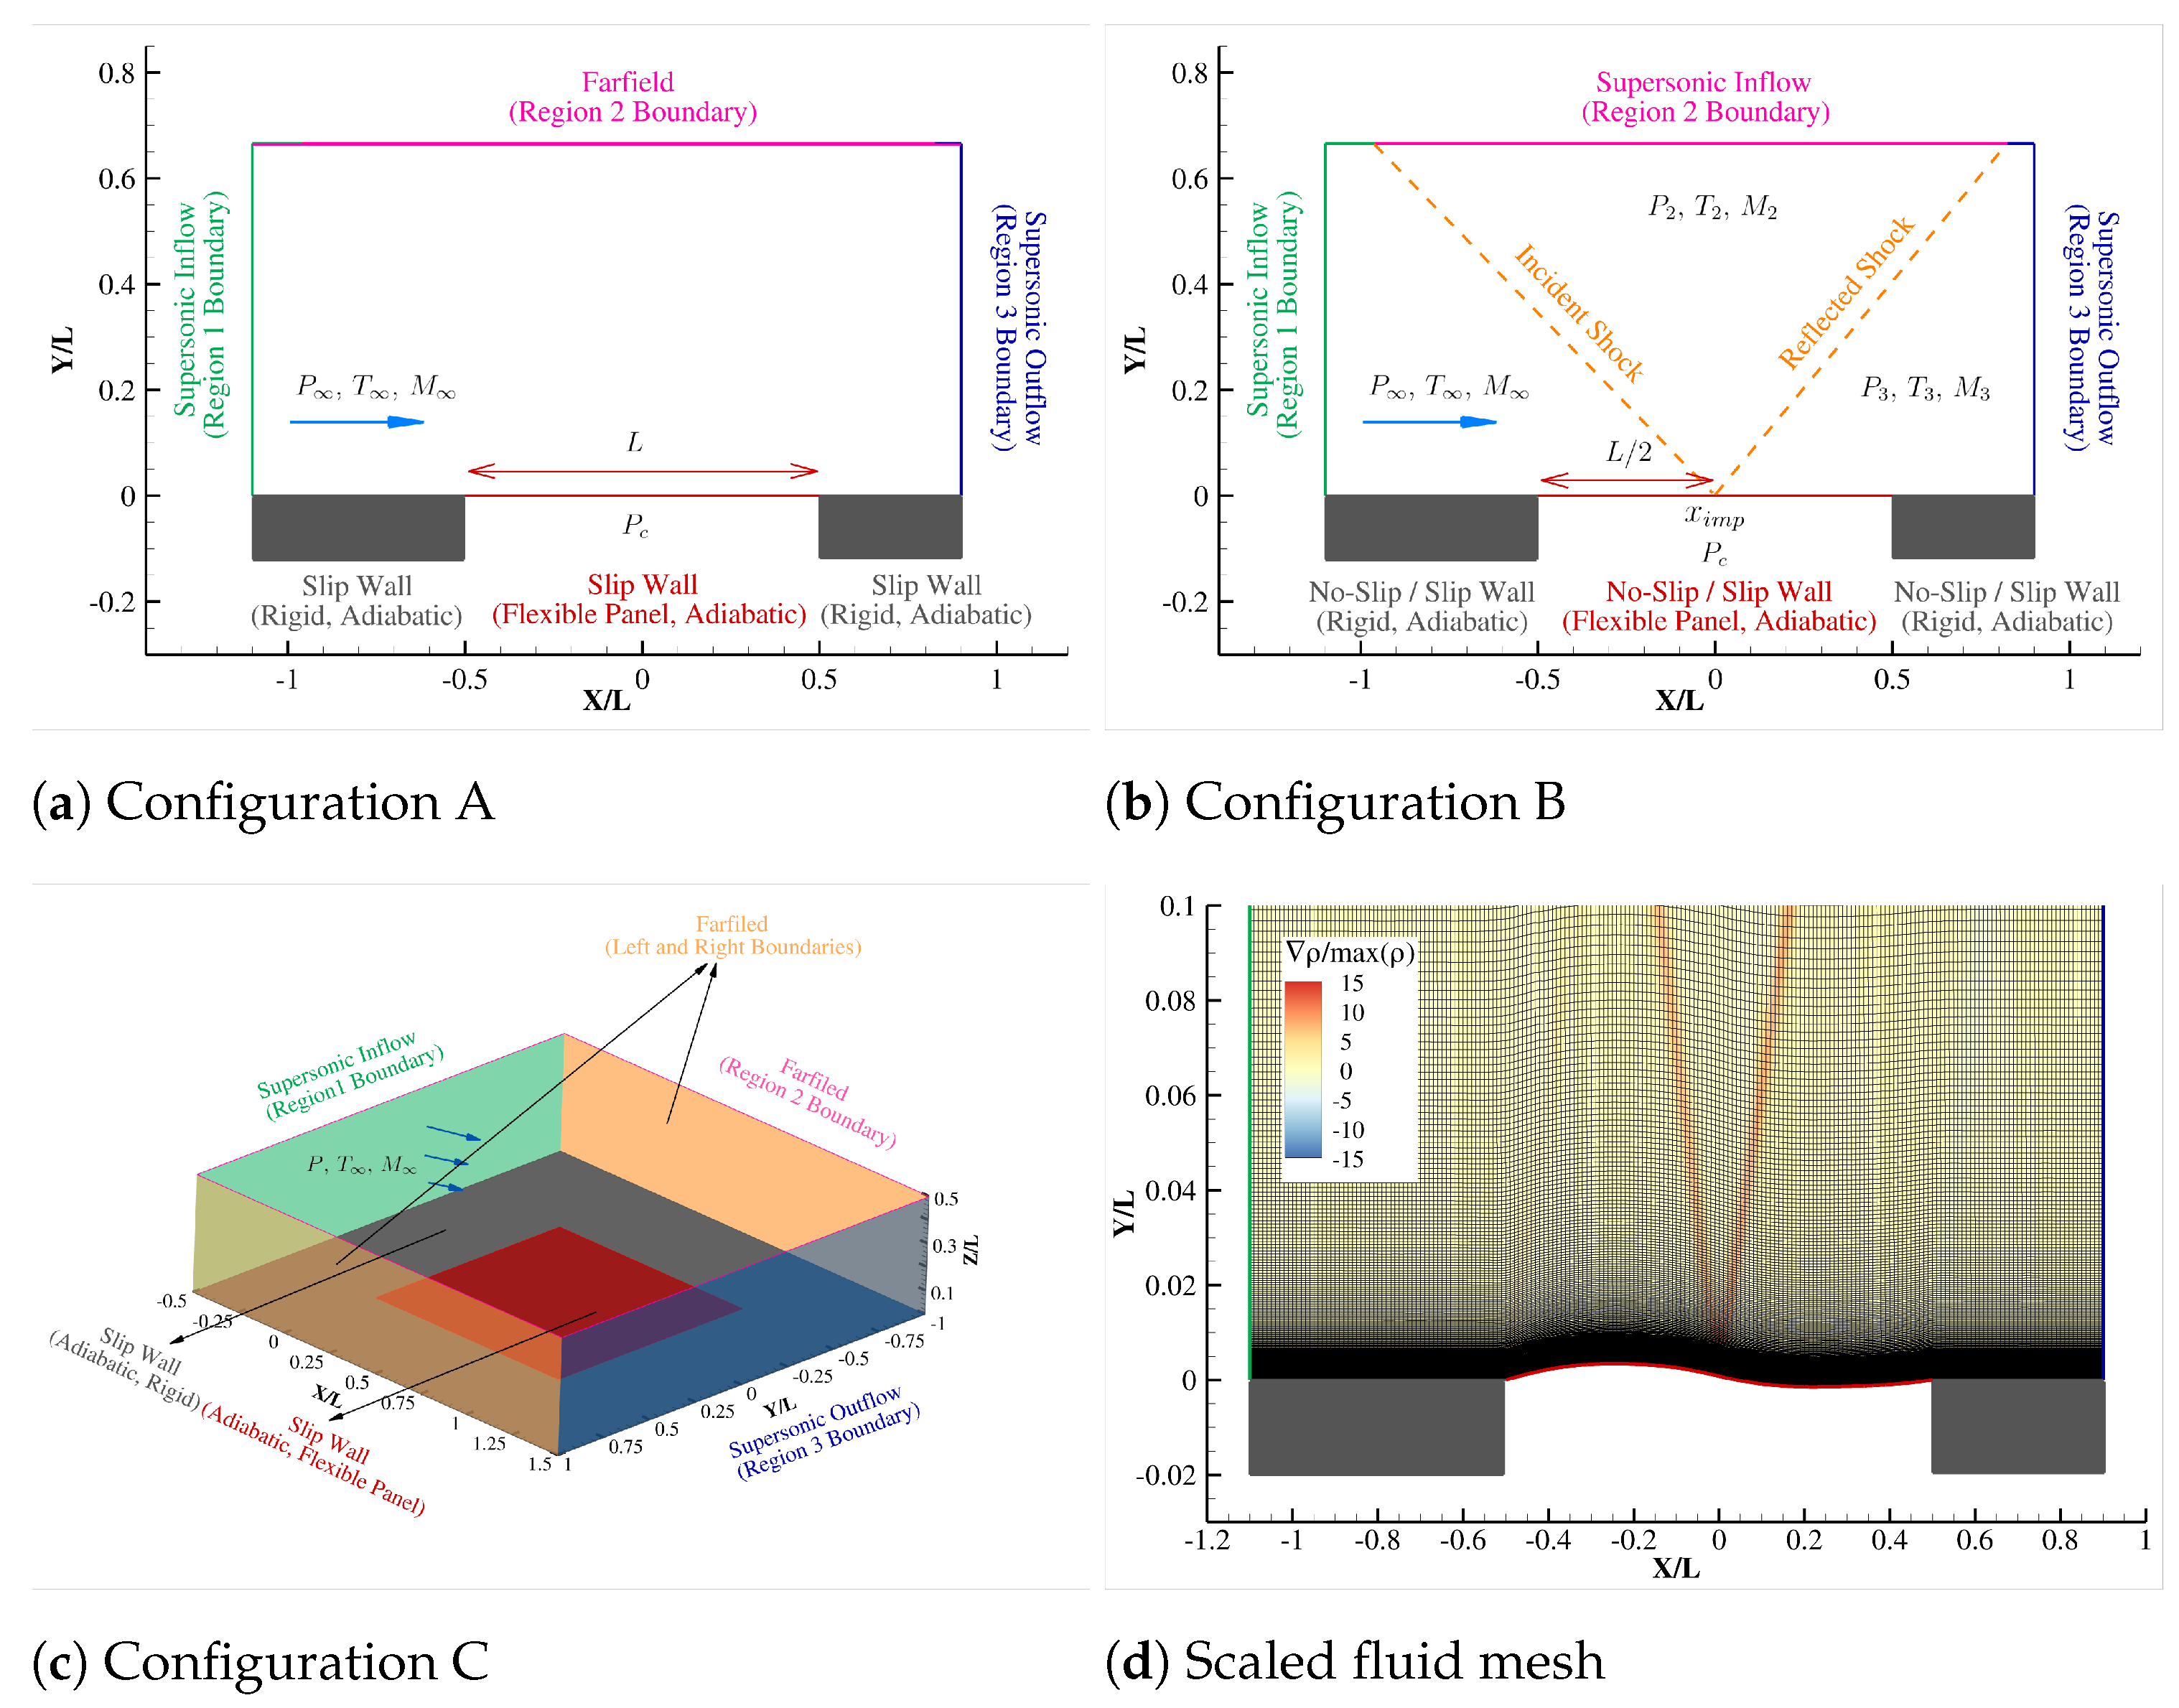
Figure 1. (ac) Schematics of FSI system with boundary conditions, (d) 2D fluid domain consisting of 70 K grid cells 200 × 350 with uniform spacing in the axial direction and hyperbolic tangent distribution in the wall-normal direction.
Computation 12 00129 g001
Figure 2. Grid independence is shown through (a) displacement time history, (b) convergence ratio, (c) normalized pressure, and (d) coefficient of friction plots for a semi-infinite panel subjected to a supersonic laminar flow of M = 2 , P 3 / P 1 = 1.4 at 3/4th chord location phase angles Φ = 0 . (a,b) show the convergence of the FSI solution, (c,d) show the convergence of the fluid solution.
Computation 12 00129 g002
Figure 3. Time-step convergence is shown through (a) displacement time history, (b) convergence ratio, (c) normalized pressure, and (d) coefficient of friction plots for a semi-infinite panel subjected to a supersonic laminar flow of M = 2 , P 3 / P 1 = 1.4 and λ = 875 at 3/4th chord location phase angles Φ = 0 . (a,b) show the convergence of the FSI solution, (c,d) show the convergence of the fluid solution.
Computation 12 00129 g003
Figure 4. (a) Fluid residual (left), Displacement time history (right) of the limit cycle solution (b) Structural residual of the FSI problem (left), and Panel deflection at t = 1.8945 s (right), obtained for a panel exposed to a laminar flow at M = 2 , λ = 875 , with a shock strength of P 3 / P 1 = 1.4 impinging at the center of the panel.
Computation 12 00129 g004
Figure 5. (a) Non-dimensional dynamic pressure of bifurcation point obtained for inviscid solution for the Mach number range of 0.4 < M < 2.0 compared with the benchmark results by reference [17] and (b) zoomed-in view around M = 1.0 .
Computation 12 00129 g005
Figure 6. Bifurcation point analysis for the uniform transonic M = 0.9 inviscid flow over a flat panel compared with the benchmark results of reference [19]. (a) The variation of mid-chord deflection with the increase in λ . The bifurcation point is obtained at λ = 15.5 . (b) panel deflection profiles for the range λ = 105 to 3500. (c,d) The time history of the panel deflection for λ = 700 and the resulting pressure contours. Results are shown for convex and concave deflections (c) and (d), respectively.
Computation 12 00129 g006
Figure 7. Non-dimensional flutter frequency ( K f ) of the flat panel near bifurcation compared with the benchmark results by reference [17]. For M = 1.6 , two different bifurcation points were identified. The second circle indicates the non-dimensional frequency of the secondary bifurcation prediction.
Computation 12 00129 g007
Figure 8. Panel flutter modes and corresponding pressure contours obtained for the inviscid solution for M = (a) 1.2 , (b) 1.414 , (c) 1.6 , and (d) 2.0 close to the bifurcation location. The left panel shows panel structure at three different phases for a phase angle Φ = 0 , 90 , and 180 .
Computation 12 00129 g008
Figure 9. Bifurcation point analysis for the uniform supersonic M = 1.2 inviscid flow over a panel compared with the benchmark results by reference [19]. (a) Variation of the 3/4th-chord location amplitude with the increase in λ . Bifurcation point is obtained at λ = 16.25 . Time history of the 3/4th-chord deflection (b) for λ = 15 , which is slightly lower than the bifurcation point and (c) for λ = 30 , which is larger than the bifurcation point. (d) Variation of the FFT amplitude of the 3/4th-chord deflection time history and (e) dominant LCO frequency with increasing λ .
Computation 12 00129 g009
Figure 10. FFT of the time history of the 3/4th-chord deflection for LCO predictions for inviscid flow. Predictions for (a) M = 1.414 and λ = 75 to 125, (b) M = 1.414 and λ = 440 to 560, (c) M = 1.6 and λ = 185 to 250, (d) M = 1.6 and λ = 640 to 880, and (e) M = 2.0 and λ = 525 to 1500.
Computation 12 00129 g010
Figure 11. Panel deformation characteristics obtained for oblique shock impinging on a 2D semi-infinite panel for inviscid flow simulations over the range λ = 2 to 900 at M = 2 compared with the benchmark results by reference [15]. (a) Deformation amplitude (b) dominant frequency of the oscillations.
Computation 12 00129 g011
Figure 12. Static panel deformation (left panel) and surface pressure (right panel) for steady-state equilibrium solutions for M = 2 inviscid flow at different shock strengths. (a) Results for P 3 / P 1 = 1.2 and λ = 200 and 875 compared with benchmark results of Visbal [15]. (b) Results for P 3 / P 1 = 1.4 and λ = 875 at two different phase angles of 3/4th-chord location compared with the benchmark results of Li et al. [23]. (c) Results for P 3 / P 1 = 1.8 and λ = 875 at two different phase angles of 3/4th -chord location along with mean surface pressure verification with Visbal [39].
Computation 12 00129 g012
Figure 13. Instantaneous panel deflection (left panel) and surface pressures (right panel) of limit cycle solutions of laminar flow for M = 2 , λ = 875 flow with a shock strength of P 3 / P 1 = 1.4 and (a) δ LE = 0.0156 L and (b) δ LE = 0.0262 L for several phase angles. Dotted lines correspond with the benchmark of Li et al. [23]. (c) Strouhal number for increasing boundary layer thickness for M = 2 flow with a shock strength of P 3 / P 1 = 1.4 shows primary and secondary frequencies with Li et al. [23] benchmark predictions. (d) The instantaneous coefficient of friction is shown similar to panel deflection and surface pressure for δ LE = 0.0156 L .
Computation 12 00129 g013
Figure 14. Panel deformation characteristics obtained for 3D uniform flow over a square panel at M = 2 and λ = 700 to 3000 compared with the benchmark results of Boyer et al. [18] and Shinde et al. [26]. (a) Deformation amplitude (b) dominant frequency of the oscillations.
Computation 12 00129 g014
Disclaimer/Publisher’s Note: The statements, opinions and data contained in all publications are solely those of the individual author(s) and contributor(s) and not of MDPI and/or the editor(s). MDPI and/or the editor(s) disclaim responsibility for any injury to people or property resulting from any ideas, methods, instructions or products referred to in the content.