Abstract
In recent years, multidisc wet friction clutches are used in demanding powertrains of automatic and dual clutch transmissions targeting high efficiency and smoothness during gearshift. However, the developed flow pattern between the clutch discs is significantly complex and the Computational Fluid Dynamics (CFD) methods employed are quite demanding in terms of computational cost. To deal with this issue semi-analytical solutions were derived, which are limited, however, to specific problems, in order to obtain handy expressions, while also providing insight to the wet clutch physics. Nevertheless, this lack of global validity is counterbalanced by the fact that the governing equations become analytically solvable at specific operational conditions with satisfactory accuracy, provided that the simplifications rendering the truncated terms inactive hold true. In this work, a quantitative way of determining the relative weight of each term of the Navier-Stokes (NS) equations set is presented, based on the post-processing of CFD results using the Buckingham “π-theorem”. The sets of nondimensional numbers created were used to describe and model the physics of the wet clutch.
1. Introduction
Multidisc wet friction clutches have been used widely in automotive transmission systems since the beginning of the 21st century due to their efficiency and flexible operation regarding torque and motion transmission during gearshift. The major difference from their single-disc dry friction counterparts is the use of hydraulic fluid, which is responsible for the hydrodynamic transmission of the clutch. During hydrodynamic transmission, the fluid is subjected to a torsional Couette-type flow, therefore, applying viscous shear stresses on the surface of the driven discs and consequently enabling the gradual increase or decrease of the torque and speed to the values required by the clutch output shaft in acceleration and deceleration situations, respectively. The engagement pressure is applied onto the first from the series of discs (clutch-pack) resulting in squeezing-out action of the fluid between discs. As soon as the fluid has been squeezed out of the gap, the discs come into contact and additional shear stresses are developed due to asperity contact (mixed or dry lubrication). This procedure describes briefly the engagement phase of a wet friction clutch that takes place during gearshift [1,2]. In a similar way, when the clutch is to be disengaged, the compressive force needed for the engagement is lifted and an internal flow is developed, usually from the inner radius of the discs forcing them to assume their normal open position with the help of springs. The main design goal for both transitional states is the minimization of the clutching time (in the order of hundredths of a second) along with achieving smooth and effective torque-speed transmission. An ideal such transition is qualitatively illustrated in Figure 1.
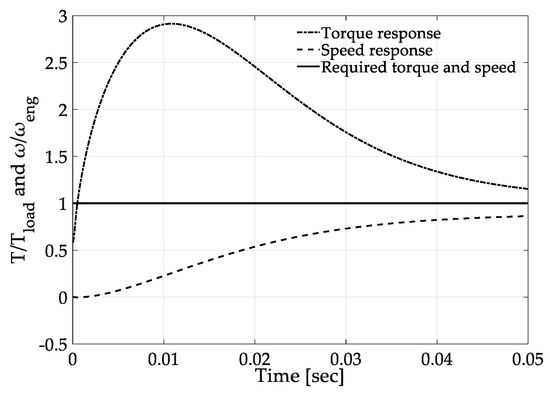
Figure 1.
Qualitative responses of the clutch, torque, and speed.
When the clutch is inactive (i.e., no power is transmitted), it is assumed to be in a steady disengaged state. In this position the clutch acts as power loss to the transmission system, due to the drag torque developed on the discs. This matter has been investigated thoroughly [3,4,5] because the efficient calculation and understanding of drag torque can lead to its minimization and, therefore, to further improvement of the wet clutch technology. While the design objectives are different for each state, they do happen to counteract each other sometimes. An approximate expression of drag torque (T) [6] which is valid at low speeds is:
where (r) is the reference radius, (A) the surface area, (μ) the dynamic viscosity, (v) the speed, and (h) the film thickness. Since the torque is inversely proportional to (h), its increase could minimize losses, but, on the other hand, clutching time would increase.
It is clear that the efficient modeling, optimization, and design process of a multidisc wet friction clutch implies the solution of the fluid mechanics problem in the gap between two consecutive discs, within the total operational envelope of the clutch. The developed flow pattern is significantly complex, not being able to admit a fully analytical solution of the governing flow equations. Instead, this is achieved using CFD analysis and conclusions are drawn regarding the evaluation and effect of most design parameters on clutch response. The influence of friction disc groove pattern, shape, and size on drag torque as well as on the engagement torque has been investigated in [7,8,9,10], respectively, using CFD models, which were further validated by experimental results. Additionally, many works have been conducted to simulate the two-phase flow of Automatic Transmission (AT) fluid with air in order to predict aeration in disengaged clutches in regimes of high rotational speed where air is inserted between the discs [11,12,13,14]. Especially the flow in the disengaged condition resembles the well-known flow between rotating discs as initially studied by v. Karman and thus a plethora of literature reports are available, which deal with the derivation of velocity and pressure fields, boundary layers, flow instabilities, etc. Launder et al. [15] provided a review article regarding the swirling flows between cylindrical or annular cavities.
Nonetheless, the numerical treatment of the flow dynamics problem is sometimes quite demanding in terms of computational cost. Especially in simulations including the complete power transmission systems involving wet multidisc clutches, (full disc-pack, discs elasticity problem, transient simulation, etc.) the computational cost becomes excessive since the simulation should include the real-time solution of fluid dynamics problem and calculation of the necessary flow parameters. This matter was reported in [13] and researchers inevitably made use of simplified, case-specific, and usually two-disc models to investigate the problem. On top of that, the need for the extraction of generalized results, able to provide a general insight in the complex dynamics of the clutch along with the excessive theoretical background existing in the analytical and experimental study of flows between rotating discs, has concluded in the extraction of analytical or empirical expressions regarding the calculation of the necessary flow parameters. This procedure is based on the derivation of truncated forms of the Navier–Stokes equations set, which is analytically solvable [3,16].
However, as indicated in this work, those truncated forms are not valid throughout the total operational envelope of the device, as the terms neglected may lead to considerable truncation errors. In this paper, a quantitative way of determining the relative weight of each term of the NS equations set based on nondimensional analysis is presented. Groups of nondimensional parameters constructed using the Buckingham pi theorem and other parameters from the post-processing of CFD results were correlated with each other, leading to the formation of equations describing the clutch operation and, therefore, drawing limits defining the validity of regimes of the available analytical expressions.
2. Fluid Film Model
2.1. Geometry Modifications and Basic Parameters
The simplified model of the fluid film between two consecutive discs of the clutch is presented in Figure 2. The upper disc rotates with angular velocity (ω1) (representing engine speed) and at the same is moving axially downwards due to the force applied on it by a linear actuator, representing the working principle of a wet multidisc clutch. The lower disc is rotating with angular velocity (ω2) (representing output shaft speed) and is assumed to be fixed along the axial direction. The discs are considered rigid and flat, the flow outlet pressure is equal to atmospheric, and the inner and outer radius of discs are denoted as (rin) and (rout), respectively.
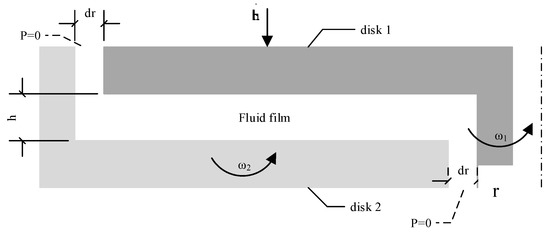
Figure 2.
Axisymmetric fluid film model between two consecutive discs of the clutch.
Regarding the flow developed in the gap, its two dominant types are the torsional Couette flow, due to the rotation of the discs, and the outflow towards the openings (P = 0) located at rin and rout, due to the squeezing effect occurring as the gap closes. While the first type is very well investigated in the literature as the single most important flow component between rotating discs, the superposition of the squeeze-flow on the previous one is not fully studied yet. Indicatively, in relative studies, the axial (closing) velocity is not considered and the modeling implies fluid supply to the system from an external flow source located at the inner radius [3,4,5,11,13,17]. This model takes into account the gap closing velocity, which however does not lead to an exactly equivalent formulation with respect to the literature due to the fact that the axial velocity of the top disc is a product of an actuation force variable with time and highlights many of the undesirable characteristics of wet clutches (i.e., fluctuations in position due to high fluid inertia as small fluid volume is concentrated and activated via a hydraulic actuator).
Το proceed with the study, the flow type (laminar, turbulent, or transitional) developed in various areas of the gap were examined. Defining the rotational Reynolds number as and the gap to radius aspect ratio as G = h/(rout−rin), the flow type can be identified using the chart provided by Daily and Nece [18] (for rotor-stator configurations). The values of the parameters used in the present study are concentrated in Table 1.

Table 1.
Parameter values.
In the present study, the aeration process was not investigated and, therefore, the gap was considered fully filled with AT fluid, independently of the rotational speed. Regarding the gap closing velocity, its maximum value of 0.5 m/s was included in the simulation range despite its high magnitude, in order to study possible overload conditions of the applied engagement force. Due to the thin film, the developed fluid pressure reached values in the order of tens of bars, and, therefore, the applied force, which had been reported to reach very high peak values in [1], may result in instantaneous dramatic increase of closing velocity. It is noted that closing velocity gets its maximum value shortly after the start of the engagement phase and it gradually decreased asymptotically to zero where discs attained their stacked condition enabling the dry friction transmission process.
For the above problem, it was calculated that G = 0.013 and 3.1 104 ≤ ≤ 1.3 105 (for h = 0.5 mm). Therefore, it can be assumed that the flow was laminar, which agreed with the remarks made in [15,19].
2.2. Flow Equations
The flow was considered steady, incompressible, and isothermal, and the fluid was Newtonian, so (ρ) and (μ) are constant. The velocity vector was and the continuity and Navier–Stokes equations in the stationary reference frame are written in polar coordinates r, and z, taking into account that ∂⁄∂ϑ = 0 due to the axisymmetry of the problem [20].
Continuity equation:
Momentum equation in radial direction:
Momentum equation in angular direction:
Momentum equation in axial direction:
The boundary conditions for the Equations (2)–(5) are:
The nondimensionalization of the flow equations took place, introducing the following nondimensional terms.
where
As previously mentioned, there do exist analytical expressions for the pressure field and velocity distributions within the fluid film, and they were derived from truncated forms of the Navier–Stokes equations. To further facilitate nondimensionalization, only one velocity component, namely Vϑ, was used for all velocity components. However, this over-simplification led to non-acceptable expressions, such us in the case of (uϑ), where, if all terms except (∂2uϑ⁄∂z2) were neglected, it followed a linear distribution with respect to (z) [3], which in the general case is erroneous, as illustrated in Figure 3. Referring to Figure 3, the order of magnitude of the momentum equations terms was presented for two working points of the clutch, corresponding to open and almost closed gap. It was evident that the variation of their values was significant and, thus, no global conclusions may be extracted concerning their truncation, except for the case of (∂P⁄∂z) in Equation (5) and the second derivatives with respect to (z) in the second part of Equations (2) and (3), respectively, which are dominant.
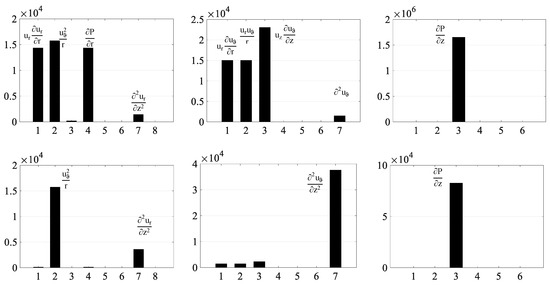
Figure 3.
Bar plots of the order of magnitude of various terms in Navier–Stokes equations (Equations (3)–(5)) at indicative operating conditions depicting the relative importance of each term. Top: h = 0.5 mm, ω1 = 5000 rpm, = 0.5 m/s. Bottom: h = 0.1 mm, ω1 = 5000 rpm, = 0.01 m/s.
3. Analytical Solutions and CFD Results
3.1. Analytical Solutions
The majority of the available analytical expressions for pressure and velocity distributions within the film were derived mainly for flows between rotating discs and they do not take into account the squeezing effect that exists in a wet clutch. For the needs of this stud, they were modified accordingly to include the axial closing velocity of the gap instead of an inflow to the system. The expression of radial velocity, ur(r,z), which contained the pressure gradient (dP⁄dr), was used in Equation (2), which was integrated with respect to (z) under the boundary conditions of Equation (7). Therefore, the second order differential equation for pressure was obtained, which was integrated with respect to (r) under the boundary conditions of Equation (6) and the final expression for pressure was derived. The two cases considered corresponded to the following system of truncated Navier–Stokes equations [3,16].
The major differences of Equations (11) and (12) are the terms in the first part of the momentum equation in the angular direction, which differentiate the variation of uϑ(r,z) with respect to (z), being a first and fifth order polynomial, respectively, according to [3,16]. Since the researchers in [3,16] assumed that the raised pressure within the fluid film was associated with the radial velocity profile or equivalently with the inflow to the system (Q), they both yield the same Ordinary Differential Equation (ODE) for the pressure:
In this work, instead of the inflow (Q), the closing velocity () was considered and, therefore, the pressured ODE had the form:
where Δω = ω1−ω2. Equation (14) was solved under the boundary conditions of Equation (6), yielding the analytical pressure distribution:
3.2. Computational Model
The validity of the pressure distribution corresponding to Equation (15) was investigated through a comparative study with the results from a CFD model where the full set of equations was used for solving the problem. The geometry of the model along with the boundary conditions (Equations (6)–(9)) are presented in Figure 4. The CFD environment used was ANSYS Fluent and the model was treated as 3D. However, in order to save computational time, the problem was modeled as 2D axisymmetric including swirl. For both approaches a mesh independency study was conducted (Figure 5) and the results were compared and found to be in good agreement.
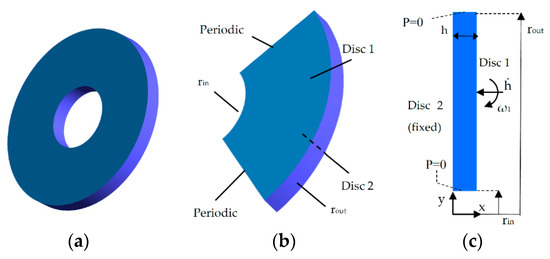
Figure 4.
(a): A 3D model of the fluid film on the left; (b): One-quarter 3D model; (c): A 2D axisymmetric model. The computational cost decreases from left to right.
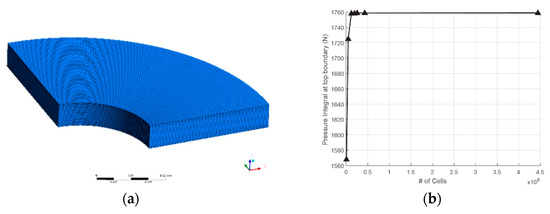
Figure 5.
(a): A 3D periodic hexahedral mesh of the fluid film model; (b): Number of cells required for mesh independency is 144.640. The same accuracy can be obtained from the 2D model of Figure 4-Right with 16,500 cells.
The tangential momentum equation for 2D swirling flows may be written as [21]:
where (w) is the swirl velocity. The flow was considered steady for each gap closing velocity, , laminar, and the sum of residuals was set below 10−6 for all equations. For the needs of this study, Disc 2 was assumed fixed. SIMPLE algorithm was used for the couple of pressure and velocity, and second order upwind spatial discretization scheme was used for the momentum conservation and pressure equations. The results of the pressure distribution versus radius are presented in Figure 6 for six operational points of the clutch. Examining Figure 6, the deviation of the pressure analytical expressions to the CFD results is observed, especially in the case where the film thickness had the value of the normal open gap (0.5 mm). This happens because the terms neglected in Equations (11) and (12) hold a considerable influence in these operating conditions. As the film thickness decreases (0.1 mm), the agreement of the analytical results to the CFD-obtained ones improved, as expected because terms including first- and second-order derivatives with respect to (z) became dominant.
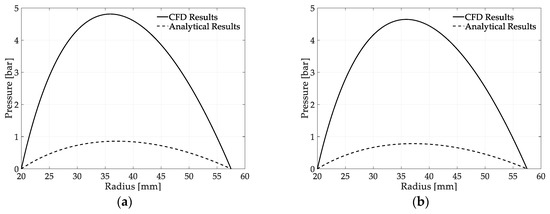
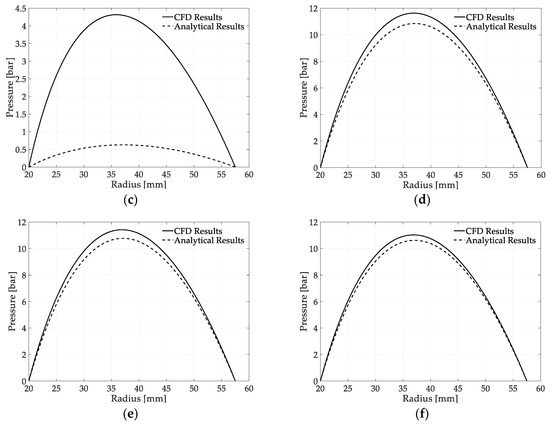
Figure 6.
Pressure distribution vs. radius, (a) h = 0.5 mm, = 0.5 m/s, and ω = 1000 rpm; (b) h = 0.5 mm, = 0.5 m/s, and ω = 3000 rpm; (c) h = 0.5 mm, = 0.5 m/s, and ω = 5000 rpm; (d) h = 0.1 mm, = 0.05 m/s, and ω = 1000 rpm; (e) h = 0.1 mm, = 0.05 m/s and, ω = 3000 rpm; (f) h = 0.1 mm, = 0.05 m/s, and ω = 5000 rpm.
In Figure 7 and Figure 8, pressure contours and streamlines together with velocity vector fields are presented for four of the above six cases. The pressure distribution was parabolic, which is also depicted in Figure 6, and its maximum value was in a zone between rin and rout, where flow lines were less dense, since the radial component of velocity was zero and, therefore, a zero-flow zone was developed at this region. Regarding the influence of rotational speed, it was concluded that when squeezing motion was significant, which was characterized by the term (/h3) [3], then variation of rotational speed did not affect significantly developed pressure. In contrast, as film thickness increased, the correlation between Couette and squeeze mechanisms changed with increasing of rotational speed while fluid pressure tended to decrease.
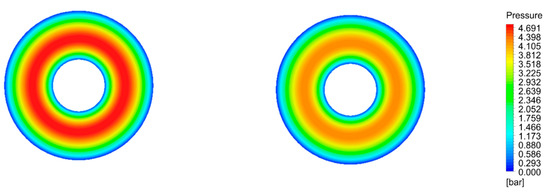
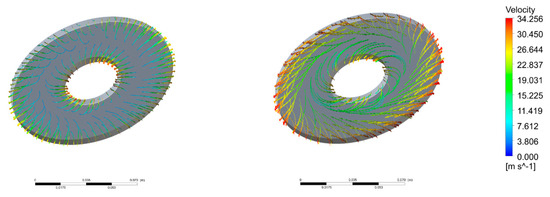
Figure 7.
Pressure contours and streamlines colored by velocity magnitude. Left: h = 0.5 mm, = 0.5 m/s, and ω = 114 rad/s. Right: h = 0.5 mm, = 0.5 m/s, and ω = 514 rad/s.
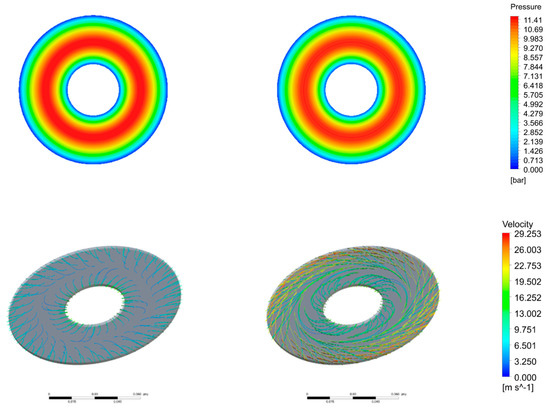
Figure 8.
Pressure contours and streamlines colored by velocity magnitude. Left: h = 0.1 mm, = 0.05 m/s and ω = 114 rad/s and right: h = 0.1 mm, = 0.05 m/s and ω = 514 rad/s.
4. Nondimensional Analysis and Post-Process of CFD Results
4.1. Creation of Nondimensional Numbers
The purpose of this study was the characterization of the behavior observed in Figure 6 regarding the pressure variation with respect to variables h, , and ω1. This was achieved through the creation of nondimensional parameters using the Vaschy–Buckingham “π-theorem“ [22]. According to that theorem, if a physical process is described by a group of N natural quantities, it is possible to reduce the number of independent parameters to N-M nondimensional quantities, where M is the total number of the basic dimensions (length (L), time (T), mass (M), absolute temperature (Θ), etc.) that appear in the process. Regarding the clutch operational envelope, the most important parameters describing the pressure variations are eight: Density ρ (M)(L)−3, dynamic viscosity μ (M)(L)−1(T)1, film thickness h (L), closing velocity (L)(T)−1, top disc annular velocity ω1 (T)−1, inner and outer radius rin, rout (L), and the integral of pressure on the surface of the discs F (M) (L) (T)−2. If (ρ), (ω1), and (h) are selected as the repeating variables, then according to the “π-theorem”, five nondimensional parameters may be created:
Finally, the following five nondimensional numbers describing the operation of the clutch are obtained:
4.2. Post-Processing of CFD Results
In order to describe the variation of pressure with respect to h, , and ω1, it is necessary to draw a relation between Π2 and Π5 in the form of Π5 = f (Π2). To achieve that, a multiparameter CFD analysis of the variation of the pressure integral with respect to above variables was conducted for a limited number of cases (five different values for each variable leading to the study of 125 separate cases in total, as shown in Table 2.

Table 2.
Values of h, , ω1 used for calculation of F.
For a better understanding of the range of (Π2), Figure 9 illustrates its magnitude, calculated for the parameter values given in Table 2.
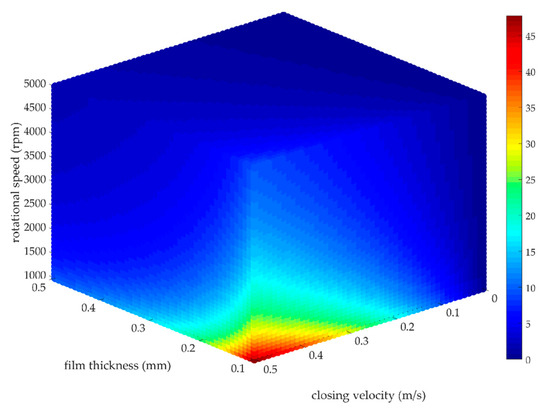
Figure 9.
A 3D dense scatter plot of (Π2).
In Figure 10 and Figure 11, the comparison of the value of (Π5) obtained from the CFD results and the calculated (Π5) from the analytical pressure distribution (Equation (15)) is presented with respect to (Π2). For the needs of illustration, the results are given for a specific value of (ω = 3000 rpm), while (h) and () were used as independent varying parameters in the plots. Selecting a specific value of (ω) was justified from the small influence it had on the developed pressure compared to (h) and (), as depicted in Figure 7 and Figure 8. Due to increased magnitude of (Π5), Log10 scale was used for its axis and, therefore, negative values were omitted. Furthermore, two sets of plots are presented in Figure 10 and Figure 11, where one of (h), () was varying and the other one was assumed fixed, having the values of Table 2. The case where (h) was varied and () was assumed constant (Figure 10), was associated with the utilization of a constant closing velocity which is maintained by the clutch actuator during the engagement process. Instead, the case where () was varied and (h) was assumed constant (Figure 11) corresponded to a constant engagement force.
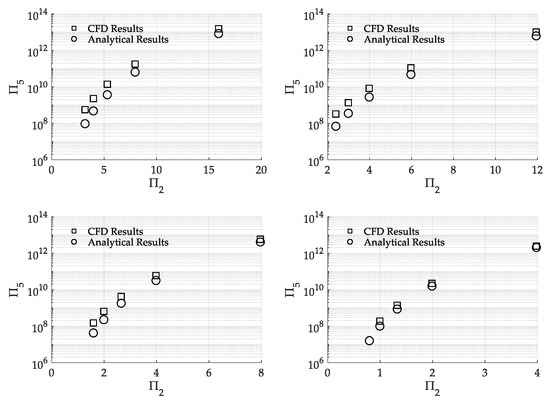
Figure 10.
Comparison between CFD obtained and analytically calculated (Π5) for various operating conditions of the clutch: Top left: Varying h, = 0.5 m/s, and ω = 3000 rpm. Top right: Varying h, = 0.375 m/s, and ω = 3000 rpm. Bottom left: Varying h, = 0.25 m/s, and ω = 3000 rpm. Bottom right: Varying h, = 0.125 m/s, and ω = 3000 rpm.
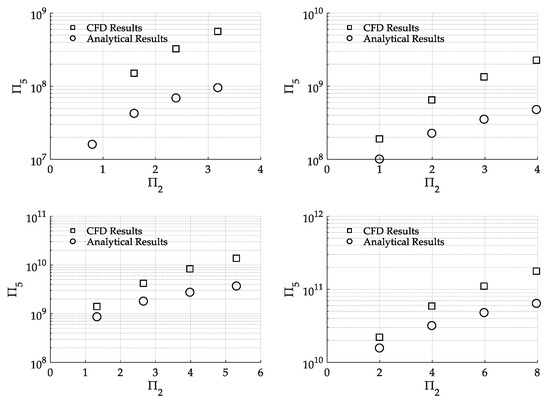
Figure 11.
Comparison between CFD obtained and analytically calculated (Π5) for various operating conditions of the clutch: Top left: Varying , h = 0.5 mm, and ω = 3000 rpm. Top right: Varying , h = 0.4 mm, and ω = 3000 rpm. Bottom left: Varying , h = 0.3 mm, and ω = 3000 rpm. Bottom right: Varying , h = 0.2 mm, and ω = 3000 rpm.
Investigating Figure 11, it can be concluded that there was a continuous deviation between the analytical expression and CFD results for the developed pressure within the fluid film over the total regime of (h) and, therefore, it is proposed that CFD analysis should be used in the case where a constant force model is simulated. On the other hand, in the case depicted in Figure 10, a constant limit of (Π2) under which the CFD and analytical results agreed may be extracted at Π2 ≤ 4, combined with closing velocity less than ≤ 0.125 m/s (Figure 10-Bottom right). This trend can be used by researchers to optimize the use of pressure analytical expressions in order to calculate the necessary actuator force in wet clutch models and save computational cost.
5. Conclusions
In this study a quantitative analysis was performed in order to evaluate the validity of the currently available analytical solutions of the governing flow equations (obtained from truncated sets of Navier–Stokes equations) to prescribe accurately the physics of a wet friction clutch throughout most of its operational envelope. The investigation was focused on the deviation of the pressure distribution within the fluid film and a comparative study was performed between the results of the analytical expressions and the CFD analysis. Finally, via the creation of newly introduced nondimensional numbers, the characterization of the clutch operation was achieved.
Author Contributions
Data curation, Investigation, Methodology, Writing—original draft, N.R.; Formal analysis, Software, Visualization, N.R., C.V., G.V. and C.M.; Validation, N.R. and C.M.; Conceptualization, Writing—review and editing, N.R. and V.S.; Supervision, V.S. All authors have read and agreed to the published version of the manuscript.
Funding
This research received no external funding.
Acknowledgments
This research was co-financed by Greece and the European Union (European Social Fund (ESF)) through the Operational Programme “Human Resources Development, Education, and Lifelong Learning” in the context of the project “Strengthening Human Resources Research Potential via Doctorate Research” (MIS-5000432), implemented by the State Scholarships Foundation (ΙΚΥ).
Conflicts of Interest
The authors declare no conflict of interest.
References
- Wang, Y.; Li, Y.; Liu, Y.; Zhang, W. Modeling and experimental research on engaging characteristics of wet clutch. Ind. Lubr. Tribol. 2019, 71, 94–101. [Google Scholar] [CrossRef]
- Cho, J.; Lee, Y.; Kim, W.; Jang, S. Wet single clutch engagement behaviors in the dual-clutch transmission system. Int. J. Automot. Technol. 2018, 19, 463–472. [Google Scholar] [CrossRef]
- Iqbal, S.; Al-Bender, F.; Pluymers, B.; Desmet, W. Mathematical model and experimental evaluation of drag torque in disengaged wet clutches. Isrn Tribol. 2013, 2013, 206539. [Google Scholar] [CrossRef]
- Aphale, C.R.; Cho, J.; Schultz, W.W.; Ceccio, S.L.; Yoshioka, T.; Hiraki, H. Modeling and parametric study of torque in open clutch plates. J. Tribol. 2006, 128, 422–430. [Google Scholar] [CrossRef]
- Yuan, Y.; Liu, E.A.; Hill, J.; Zou, Q. An improved hydrodynamic model for open wet transmission clutches. J. Fluids Eng. 2007, 129, 333–337. [Google Scholar] [CrossRef]
- Fujii, Y.; Kapas, N.; Tseng, J. Clutch Wet. In Encyclopedia of Automotive Engineering; John Wiley & Sons: New York, NY, USA, 2014; pp. 1–15. [Google Scholar] [CrossRef]
- Neupert, T.; Benke, E.; Bartel, D. Parameter study on the influence of a radial groove design on the drag torque of wet clutch discs in comparison with analytical models. Tribol. Int. 2018, 119, 809–821. [Google Scholar] [CrossRef]
- Zhang, L.; Wei, C.; Hu, J.B. Model for the prediction of drag torque characteristics in wet clutch with radial grooves. Proc. Inst. Mech. Eng. Part D: J. Automob. Eng. 2019, 233, 3043–3056. [Google Scholar] [CrossRef]
- Wu, P.H.; Zhou, X.; Yang, C.; Lv, H.; Lin, T.; Wu, X. Parametric analysis of the drag torque model of wet multi-plate friction clutch with groove consideration. Ind. Lubr. Tribol. 2018, 70, 1268–1281. [Google Scholar] [CrossRef]
- Wu, P.; Xu, J.; Zhou, X.-J. Numerical and experimental research on engagement process of wet multi-plate friction clutches with groove consideration. Proc. Inst. Mech. Eng. Part J J. Eng. Tribol. 2019, 233, 1464–1482. [Google Scholar] [CrossRef]
- Pardeshi, I.; Shih, T.I. A Computational Fluid Dynamics Methodology for Predicting Aeration in Wet Friction Clutches. ASME. J. Fluids Eng. 2019, 141, 121304. [Google Scholar] [CrossRef]
- Wu, W.; Xiong, Z.; Hu, J.; Yuan, S. Application of CFD to model oil–air flow in a grooved two-disc system. Int. J. Heat Mass Transf. 2015, 91, 293–301. [Google Scholar] [CrossRef]
- Neupert, T.; Bartel, D. High-resolution 3D CFD multiphase simulation of the flow and the drag torque of wet clutch discs considering free surfaces. Tribol. Int. 2019, 129, 283–296. [Google Scholar] [CrossRef]
- Aphale, C.R.; Schultz, W.W.; Ceccio, S.L. Aeration in lubrication with application to drag torque reduction. J. Tribol. 2011, 133, 031701. [Google Scholar] [CrossRef]
- Launder, B.; Poncet, S.; Serre, E. Laminar, transitional, and turbulent flows in rotor stator cavities. Ann. Rev. Fluid Mech. 2010, 42, 229–248. [Google Scholar] [CrossRef]
- Huang, J.; Wei, J.; Qiu, M. Laminar flow in the gap between two rotating parallel frictional plates in hydro-viscous drive. Chin. J. Mech. Eng. 2012, 25, 144–152. [Google Scholar] [CrossRef]
- Bassi, A.; Milani, M.; Montorsi, L.; Terzi, S. Dynamic analysis of the lubrication in a wet clutch of a hydromechanical variable transmission. SAE Int. J. Commer. Veh. 2016, 9, 280–290. [Google Scholar] [CrossRef]
- Daily, J.W.; Nece, R.E. Chamber dimension effects on induced flow and frictional resistance of enclosed rotating disks. ASME J. Basic Eng. 1960, 82, 217–232. [Google Scholar] [CrossRef]
- Haddadi, S.; Poncet, S. Turbulence modeling of torsional Couette flows. Int. J. Rotating Mach. 2008, 2008, 635138. [Google Scholar] [CrossRef]
- Spurk, H.J.; Askel, N. Fluid Mechanics, 3rd ed.; Springer Nature Switzerland AG: Basel, Switzerland, 2020. [Google Scholar]
- ANSYS Fluent Theory Guide; ANSYS, Inc.: Canonsburg, PA, USA, 2013.
- Gibbings, J.C. Dimensional Analysis; Springer: London, UK, 2011; pp. 55–82. [Google Scholar]
© 2020 by the authors. Licensee MDPI, Basel, Switzerland. This article is an open access article distributed under the terms and conditions of the Creative Commons Attribution (CC BY) license (http://creativecommons.org/licenses/by/4.0/).