Delving into the Complexity of Analogical Reasoning: A Detailed Exploration with the Generalized Multicomponent Latent Trait Model for Diagnosis


Abstract
:1. Introduction
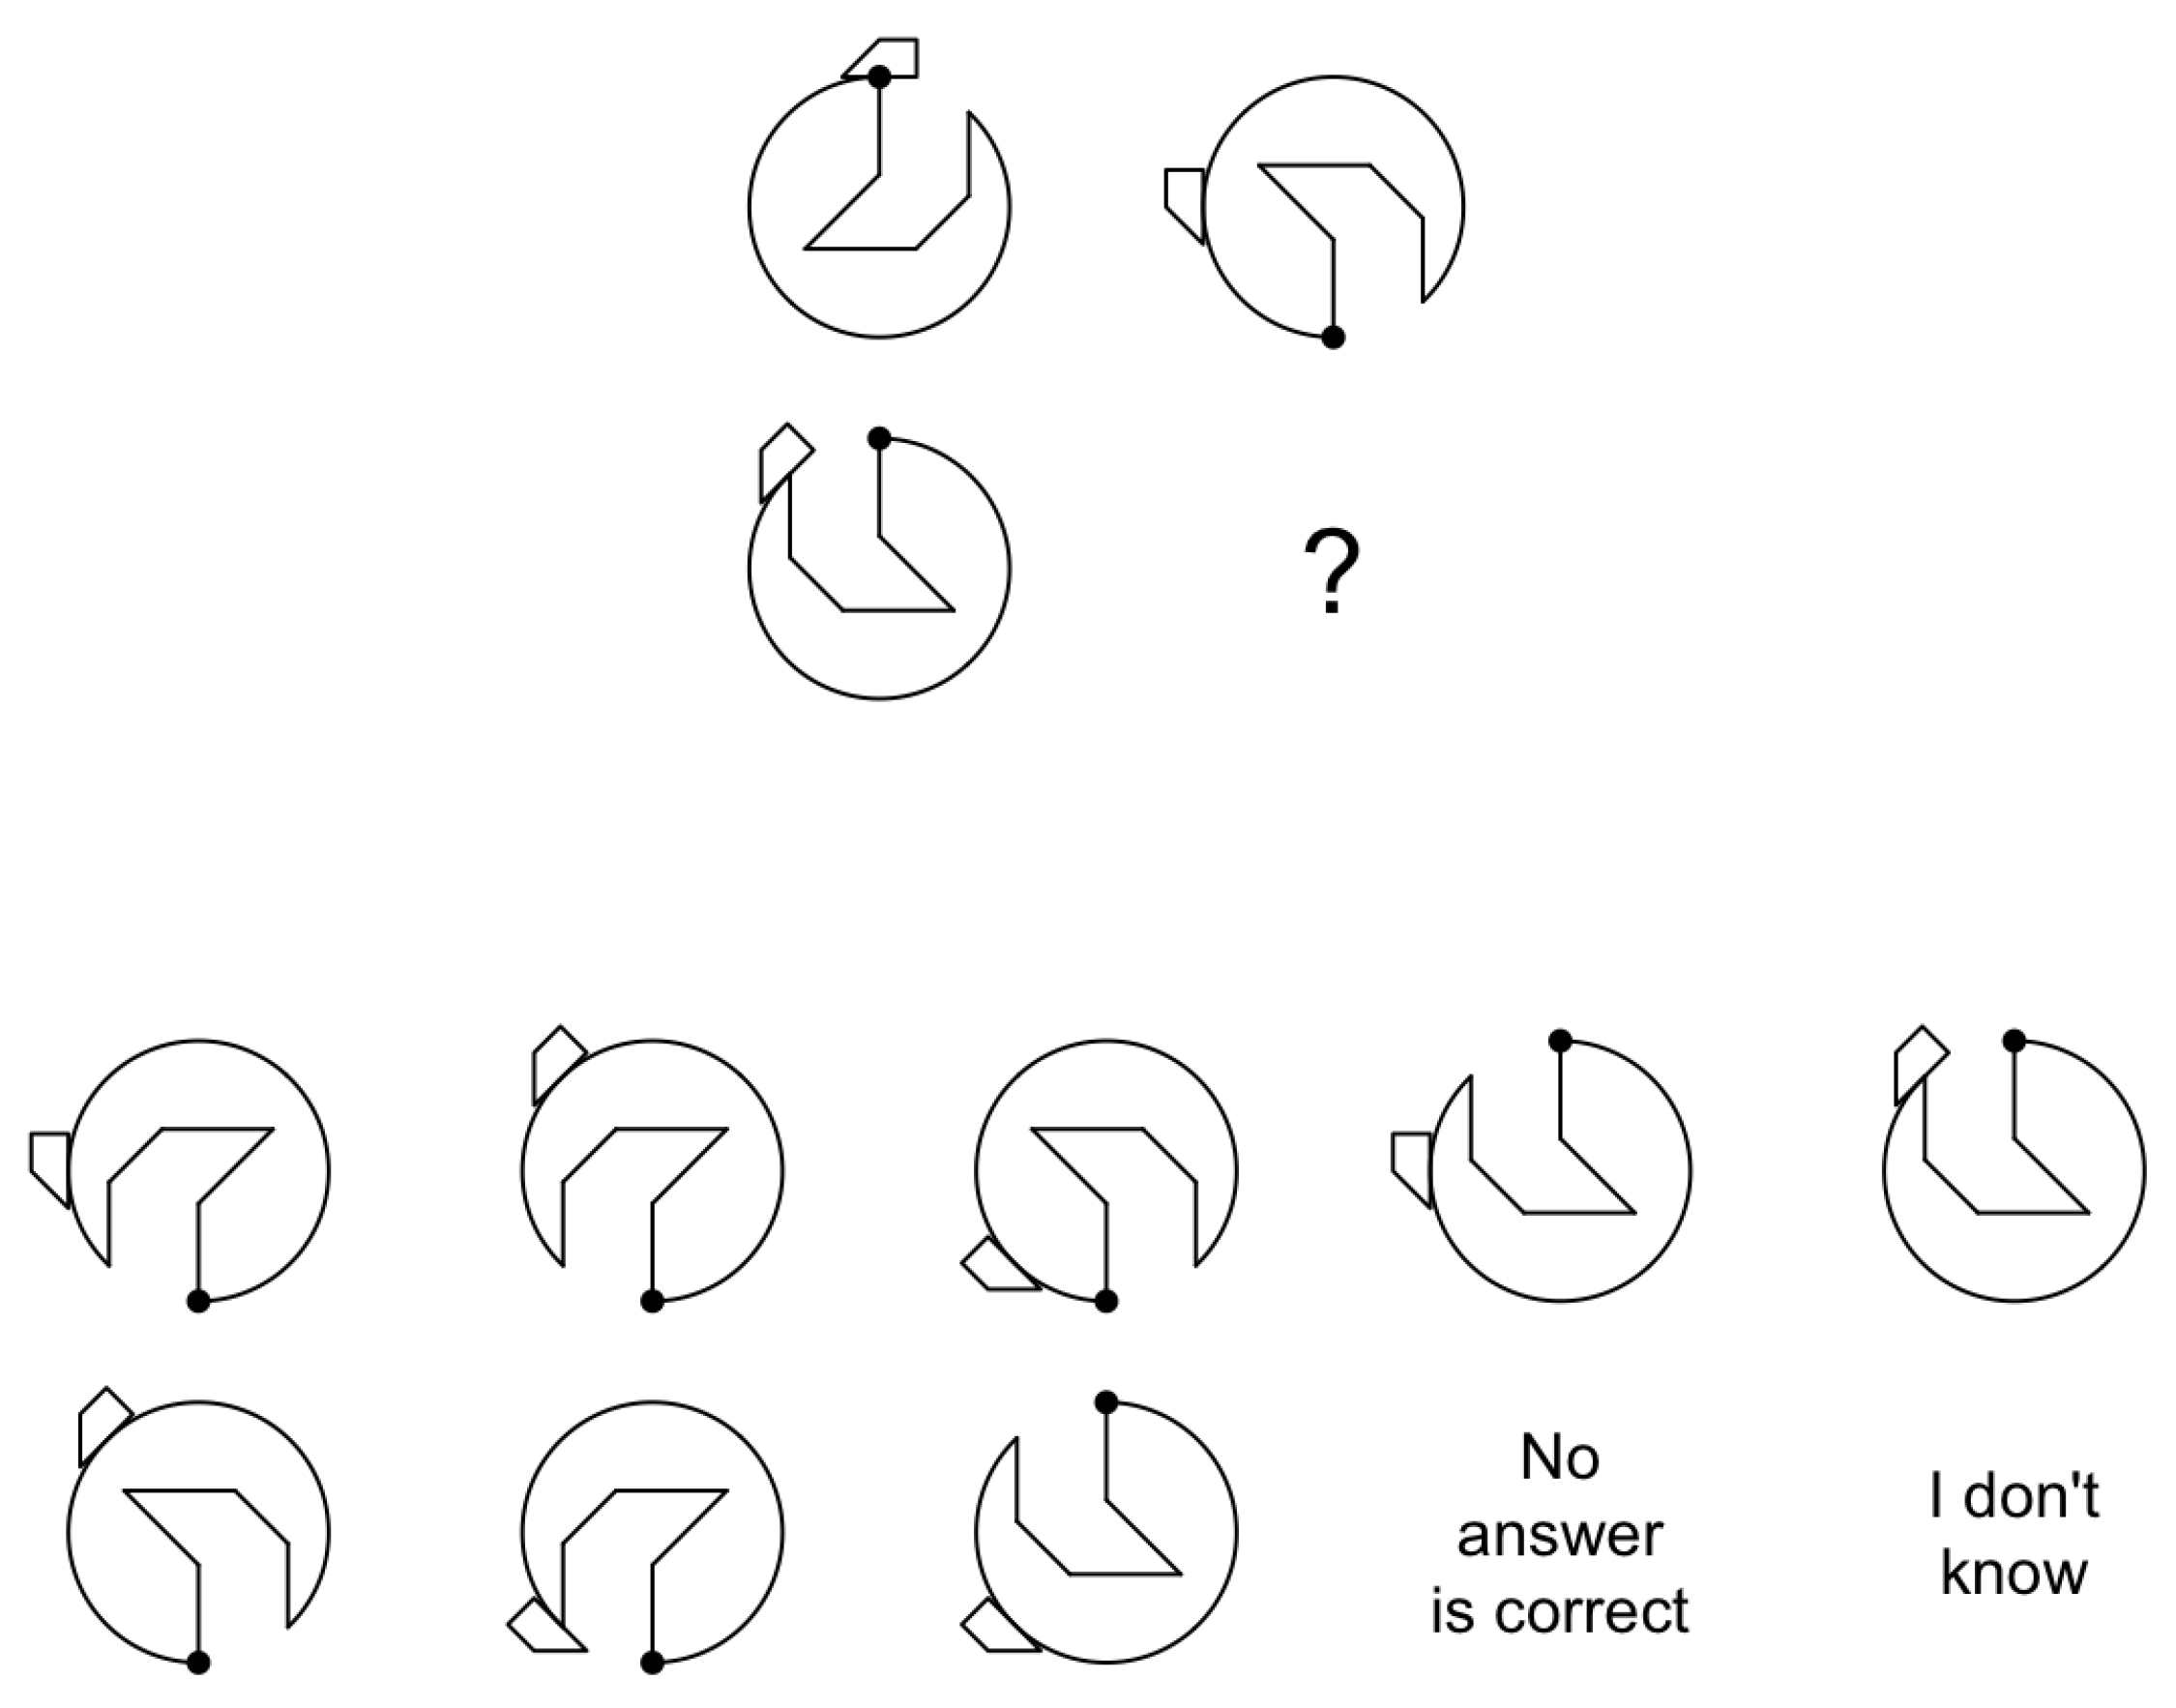
1.1. Analogical Reasoning
1.2. Construct Representation
1.3. Limitations of the LLTM and Alternative Models
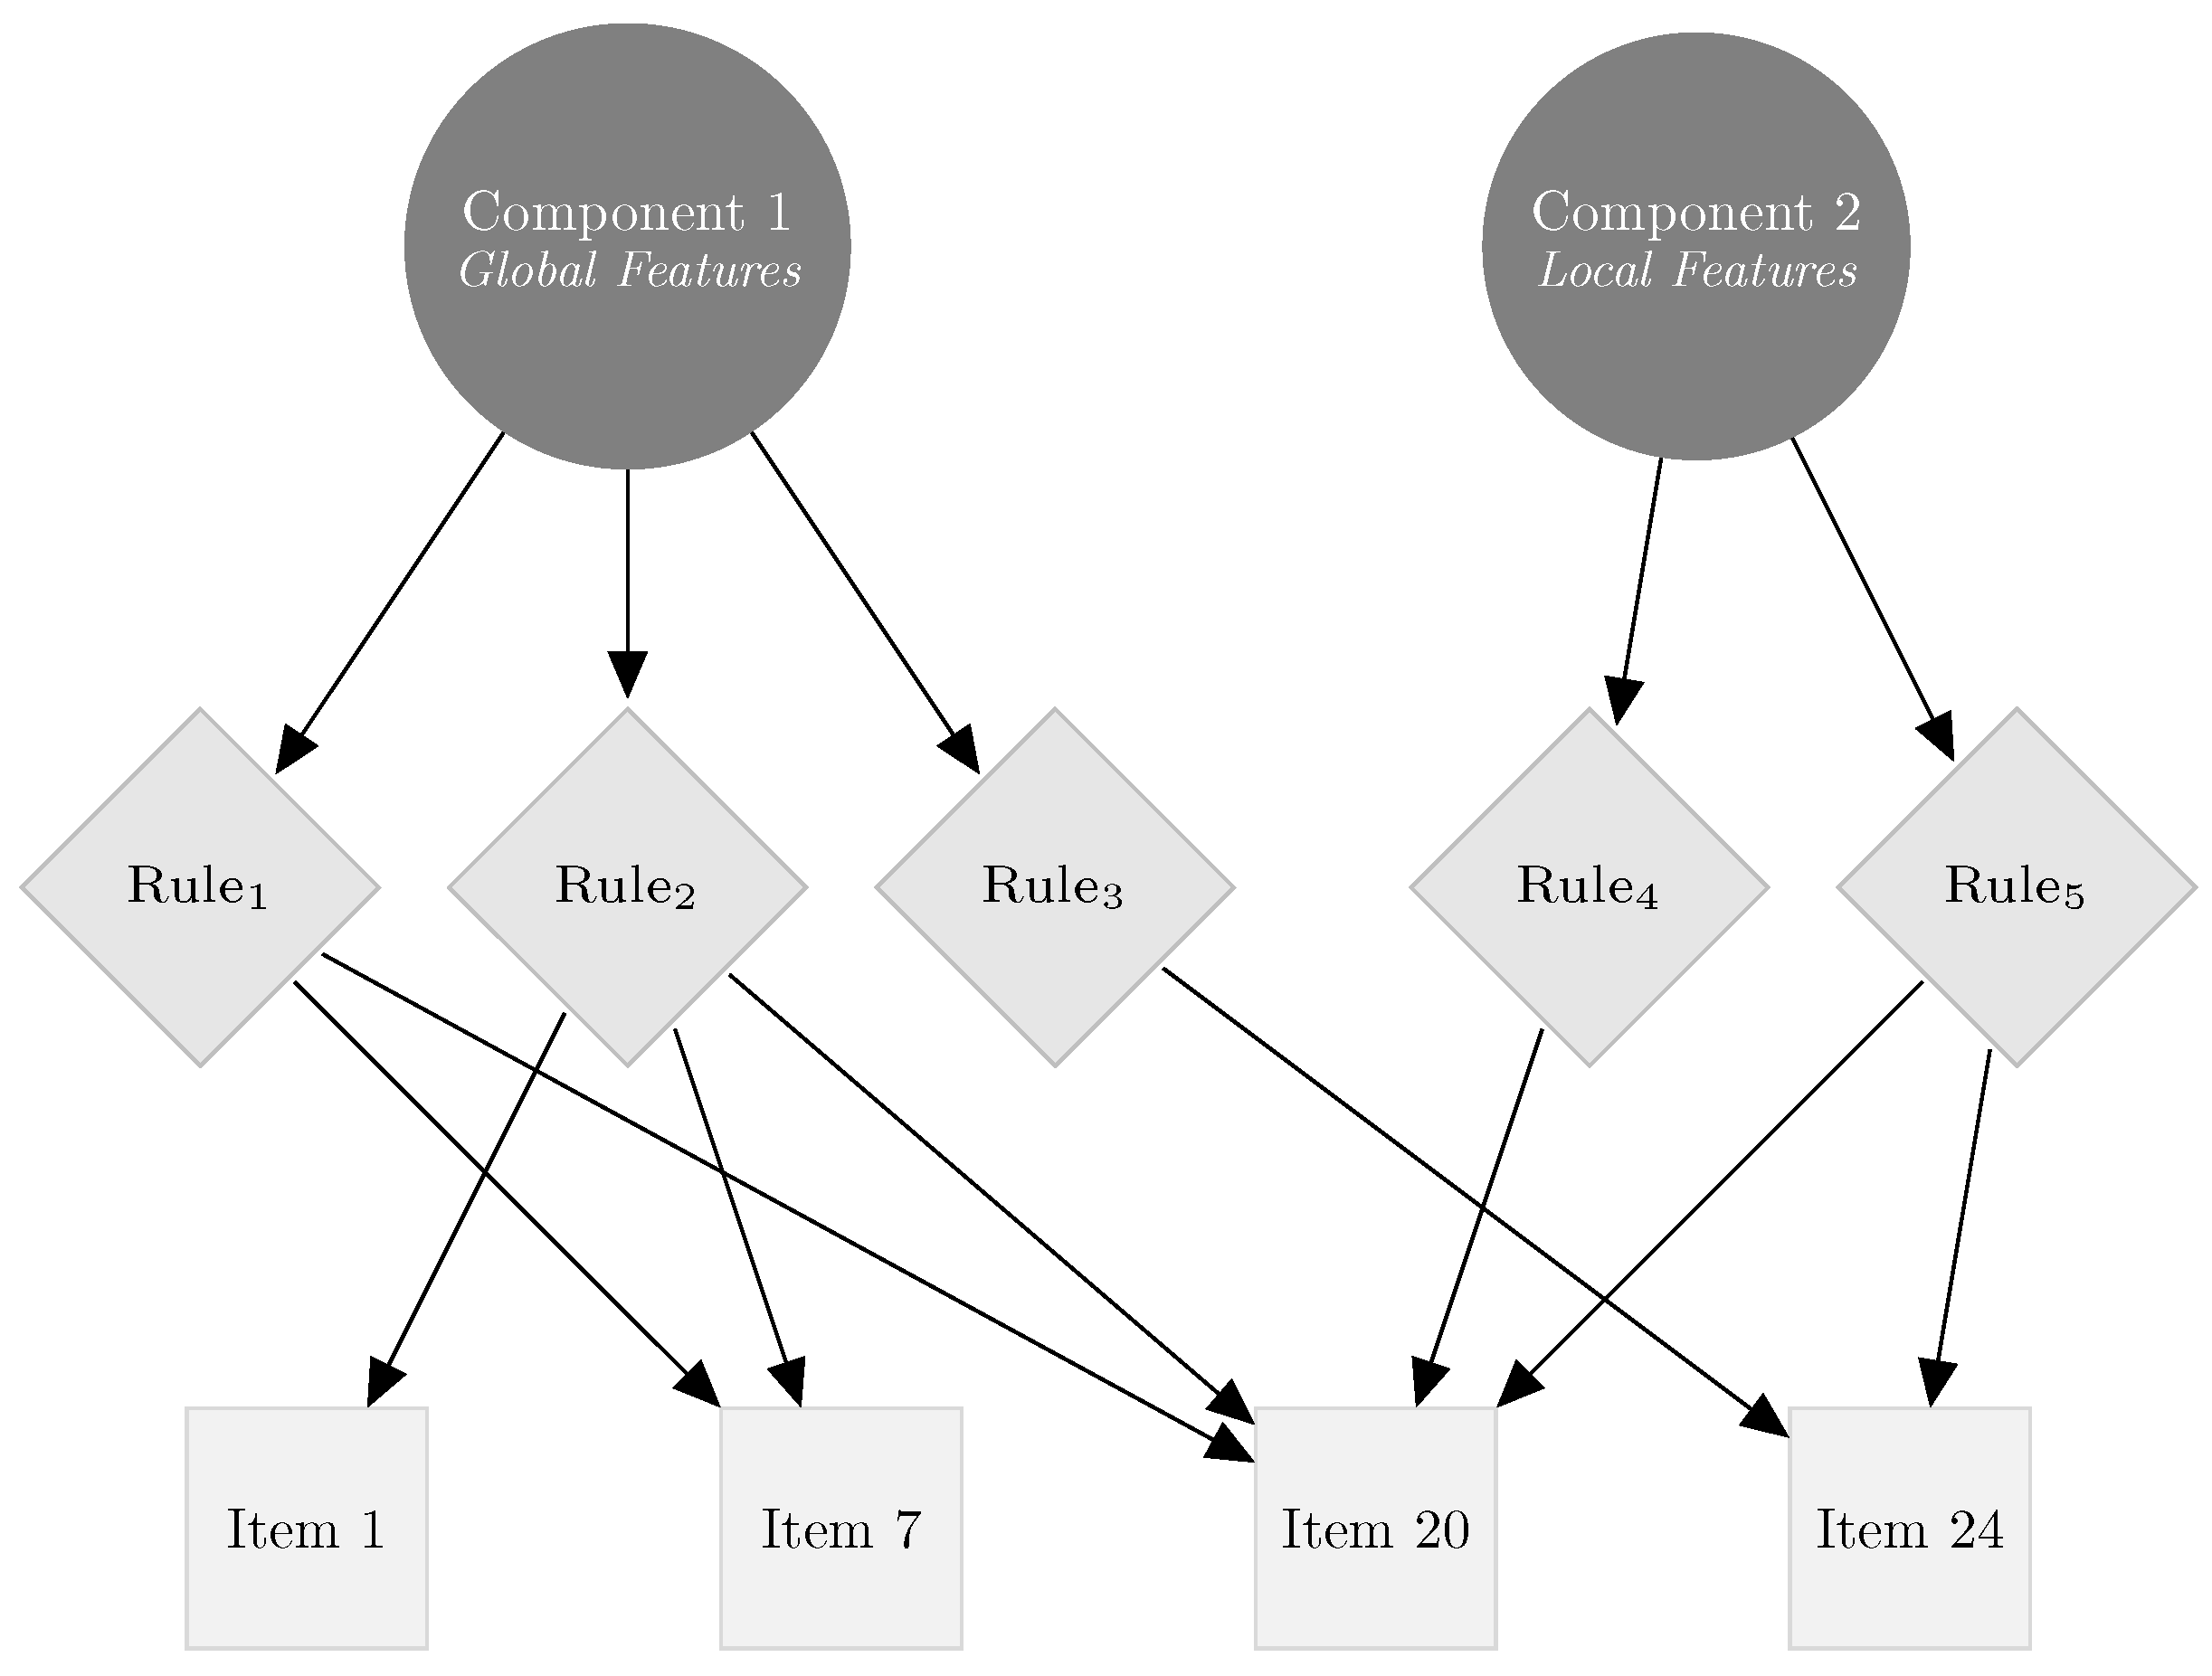
1.4. Multicomponent Models
1.5. The Generalized Multicomponent Latent Trait Model for Diagnosis (GMLTM-D)
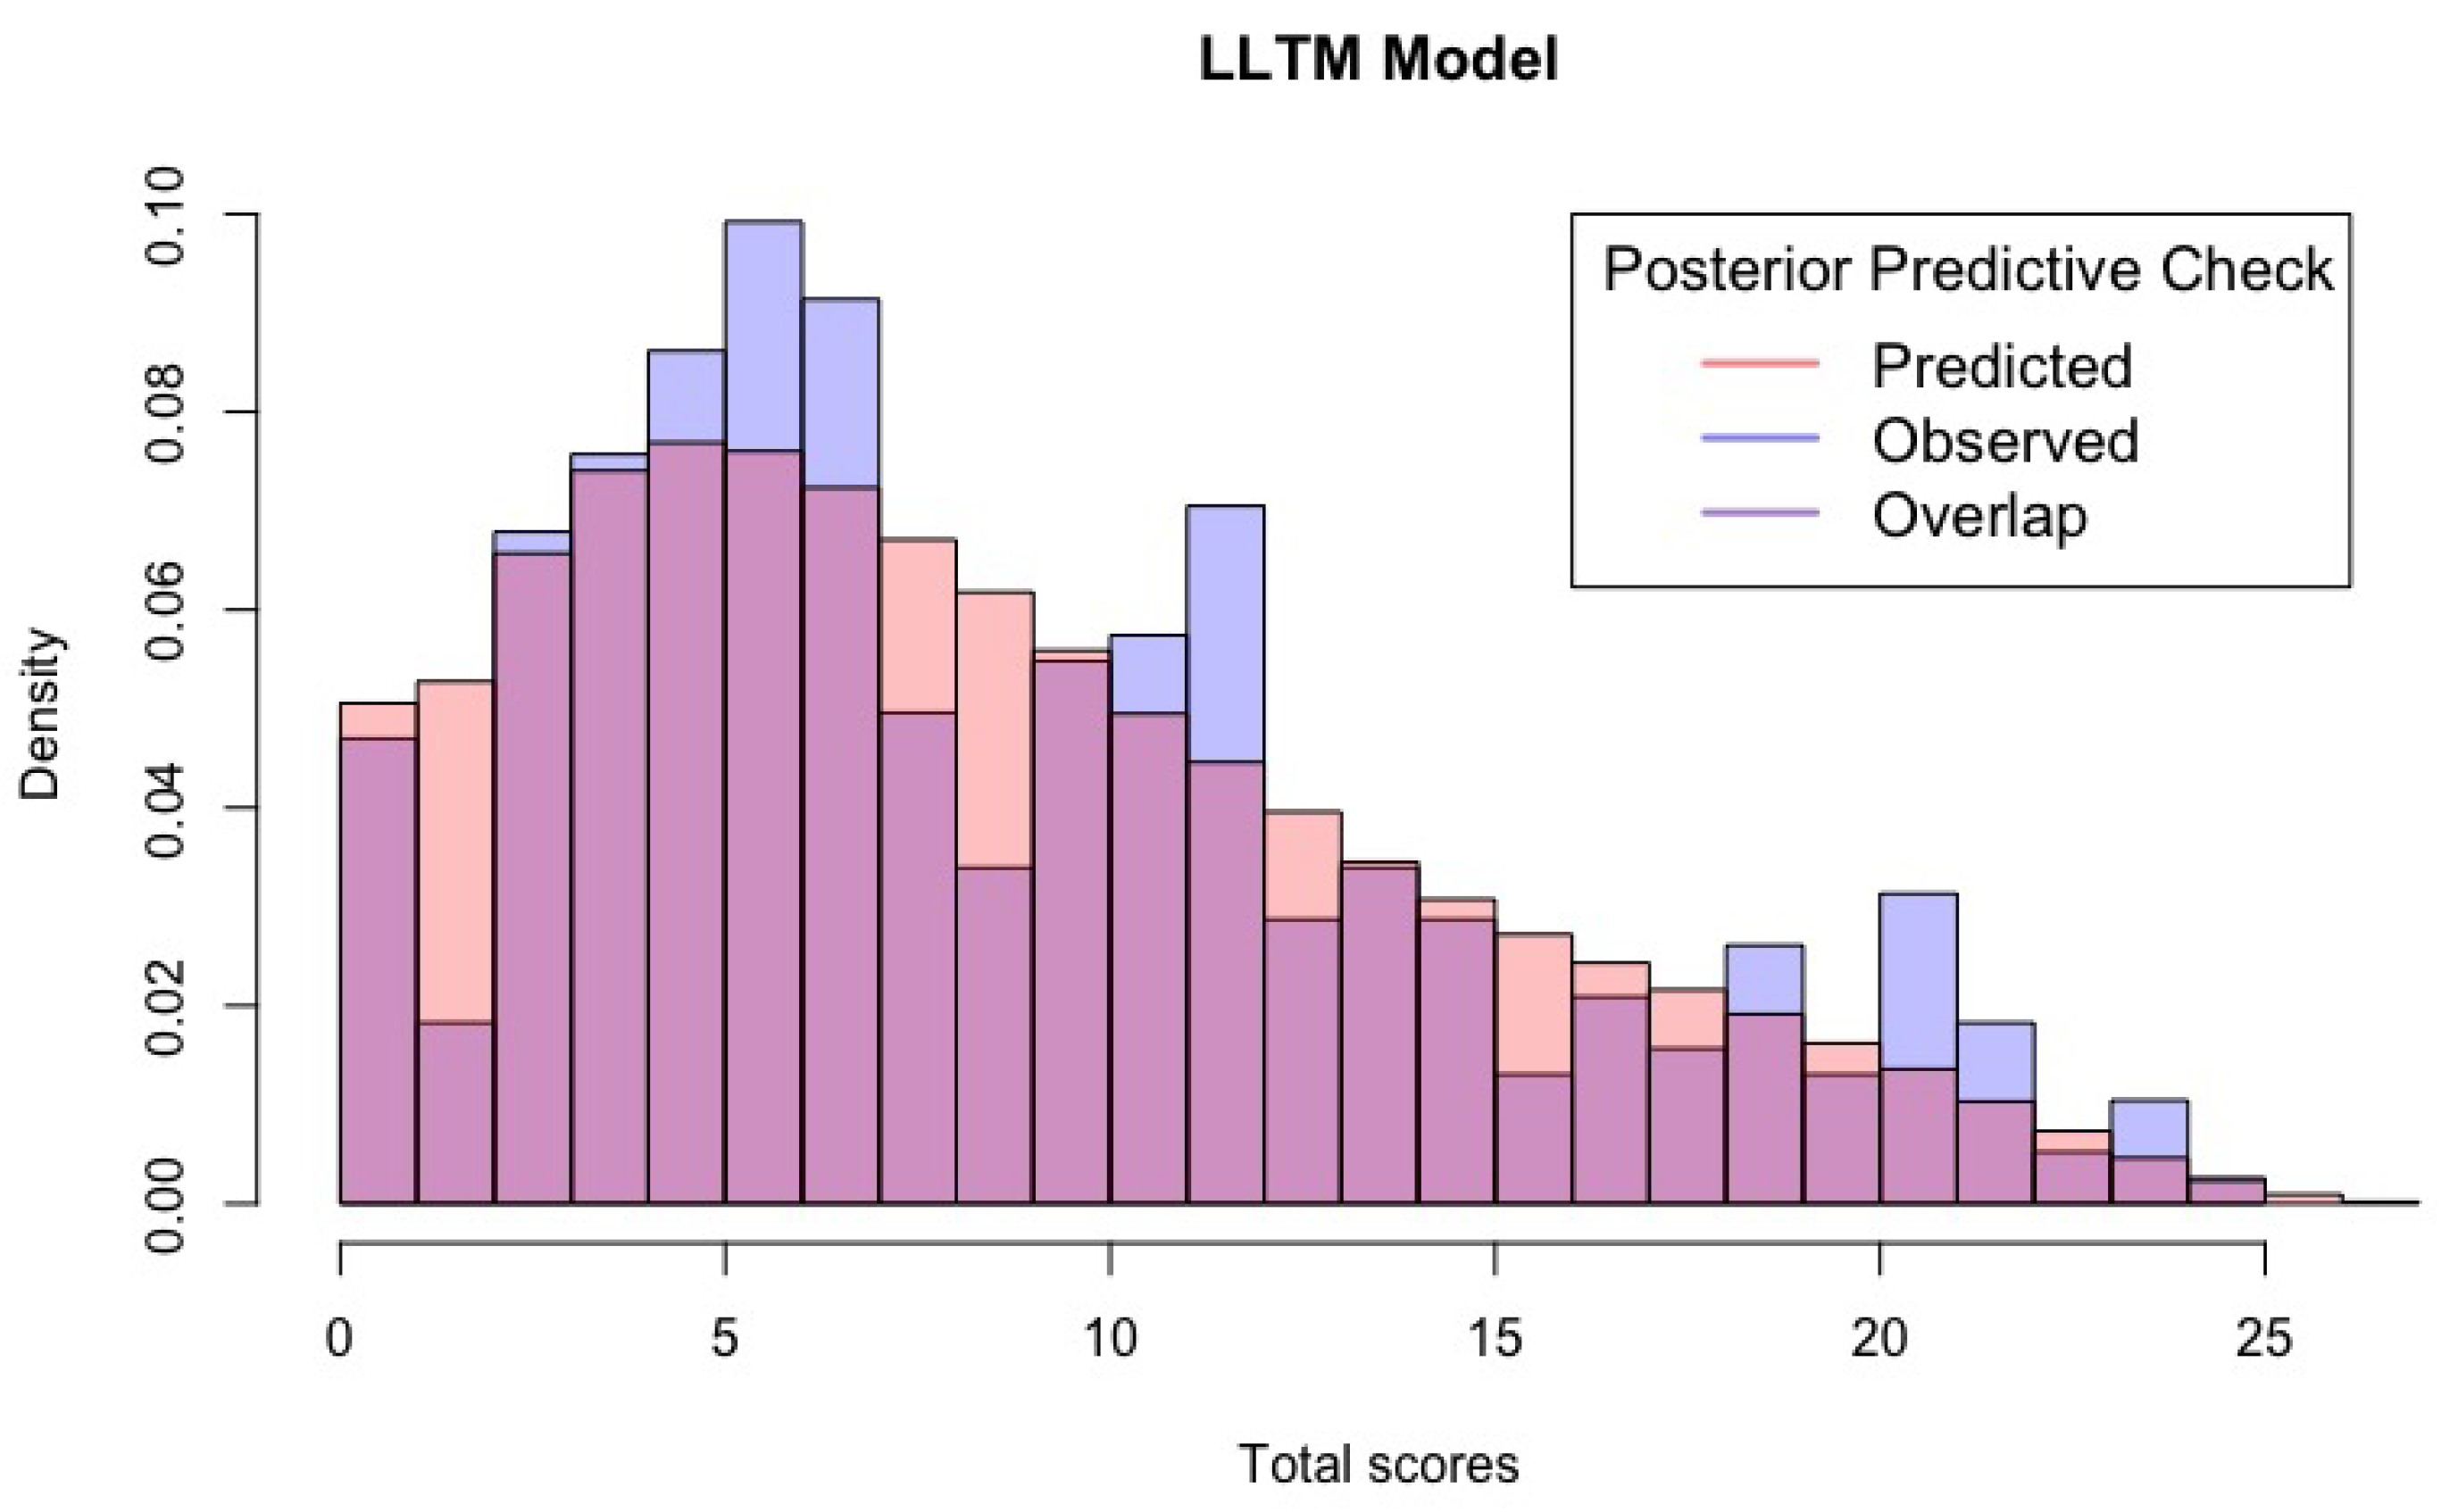
1.6. Comparison of Bayesian Models in Data Analysis
2. Methods
3. Results
4. Discussion
5. Conclusions
Author Contributions
Funding
Institutional Review Board Statement
Informed Consent Statement
Data Availability Statement
Conflicts of Interest
Abbreviations
| IRT | Item Response Theory |
| LLTM | Logistic Latent Trait Model |
| MLTM-D | Multicomponent Latent Trait Model for Diagnosis |
| GMLTM-D | Generalized Multicomponent Latent Trait Model for Diagnosis |
Appendix A
Appendix B
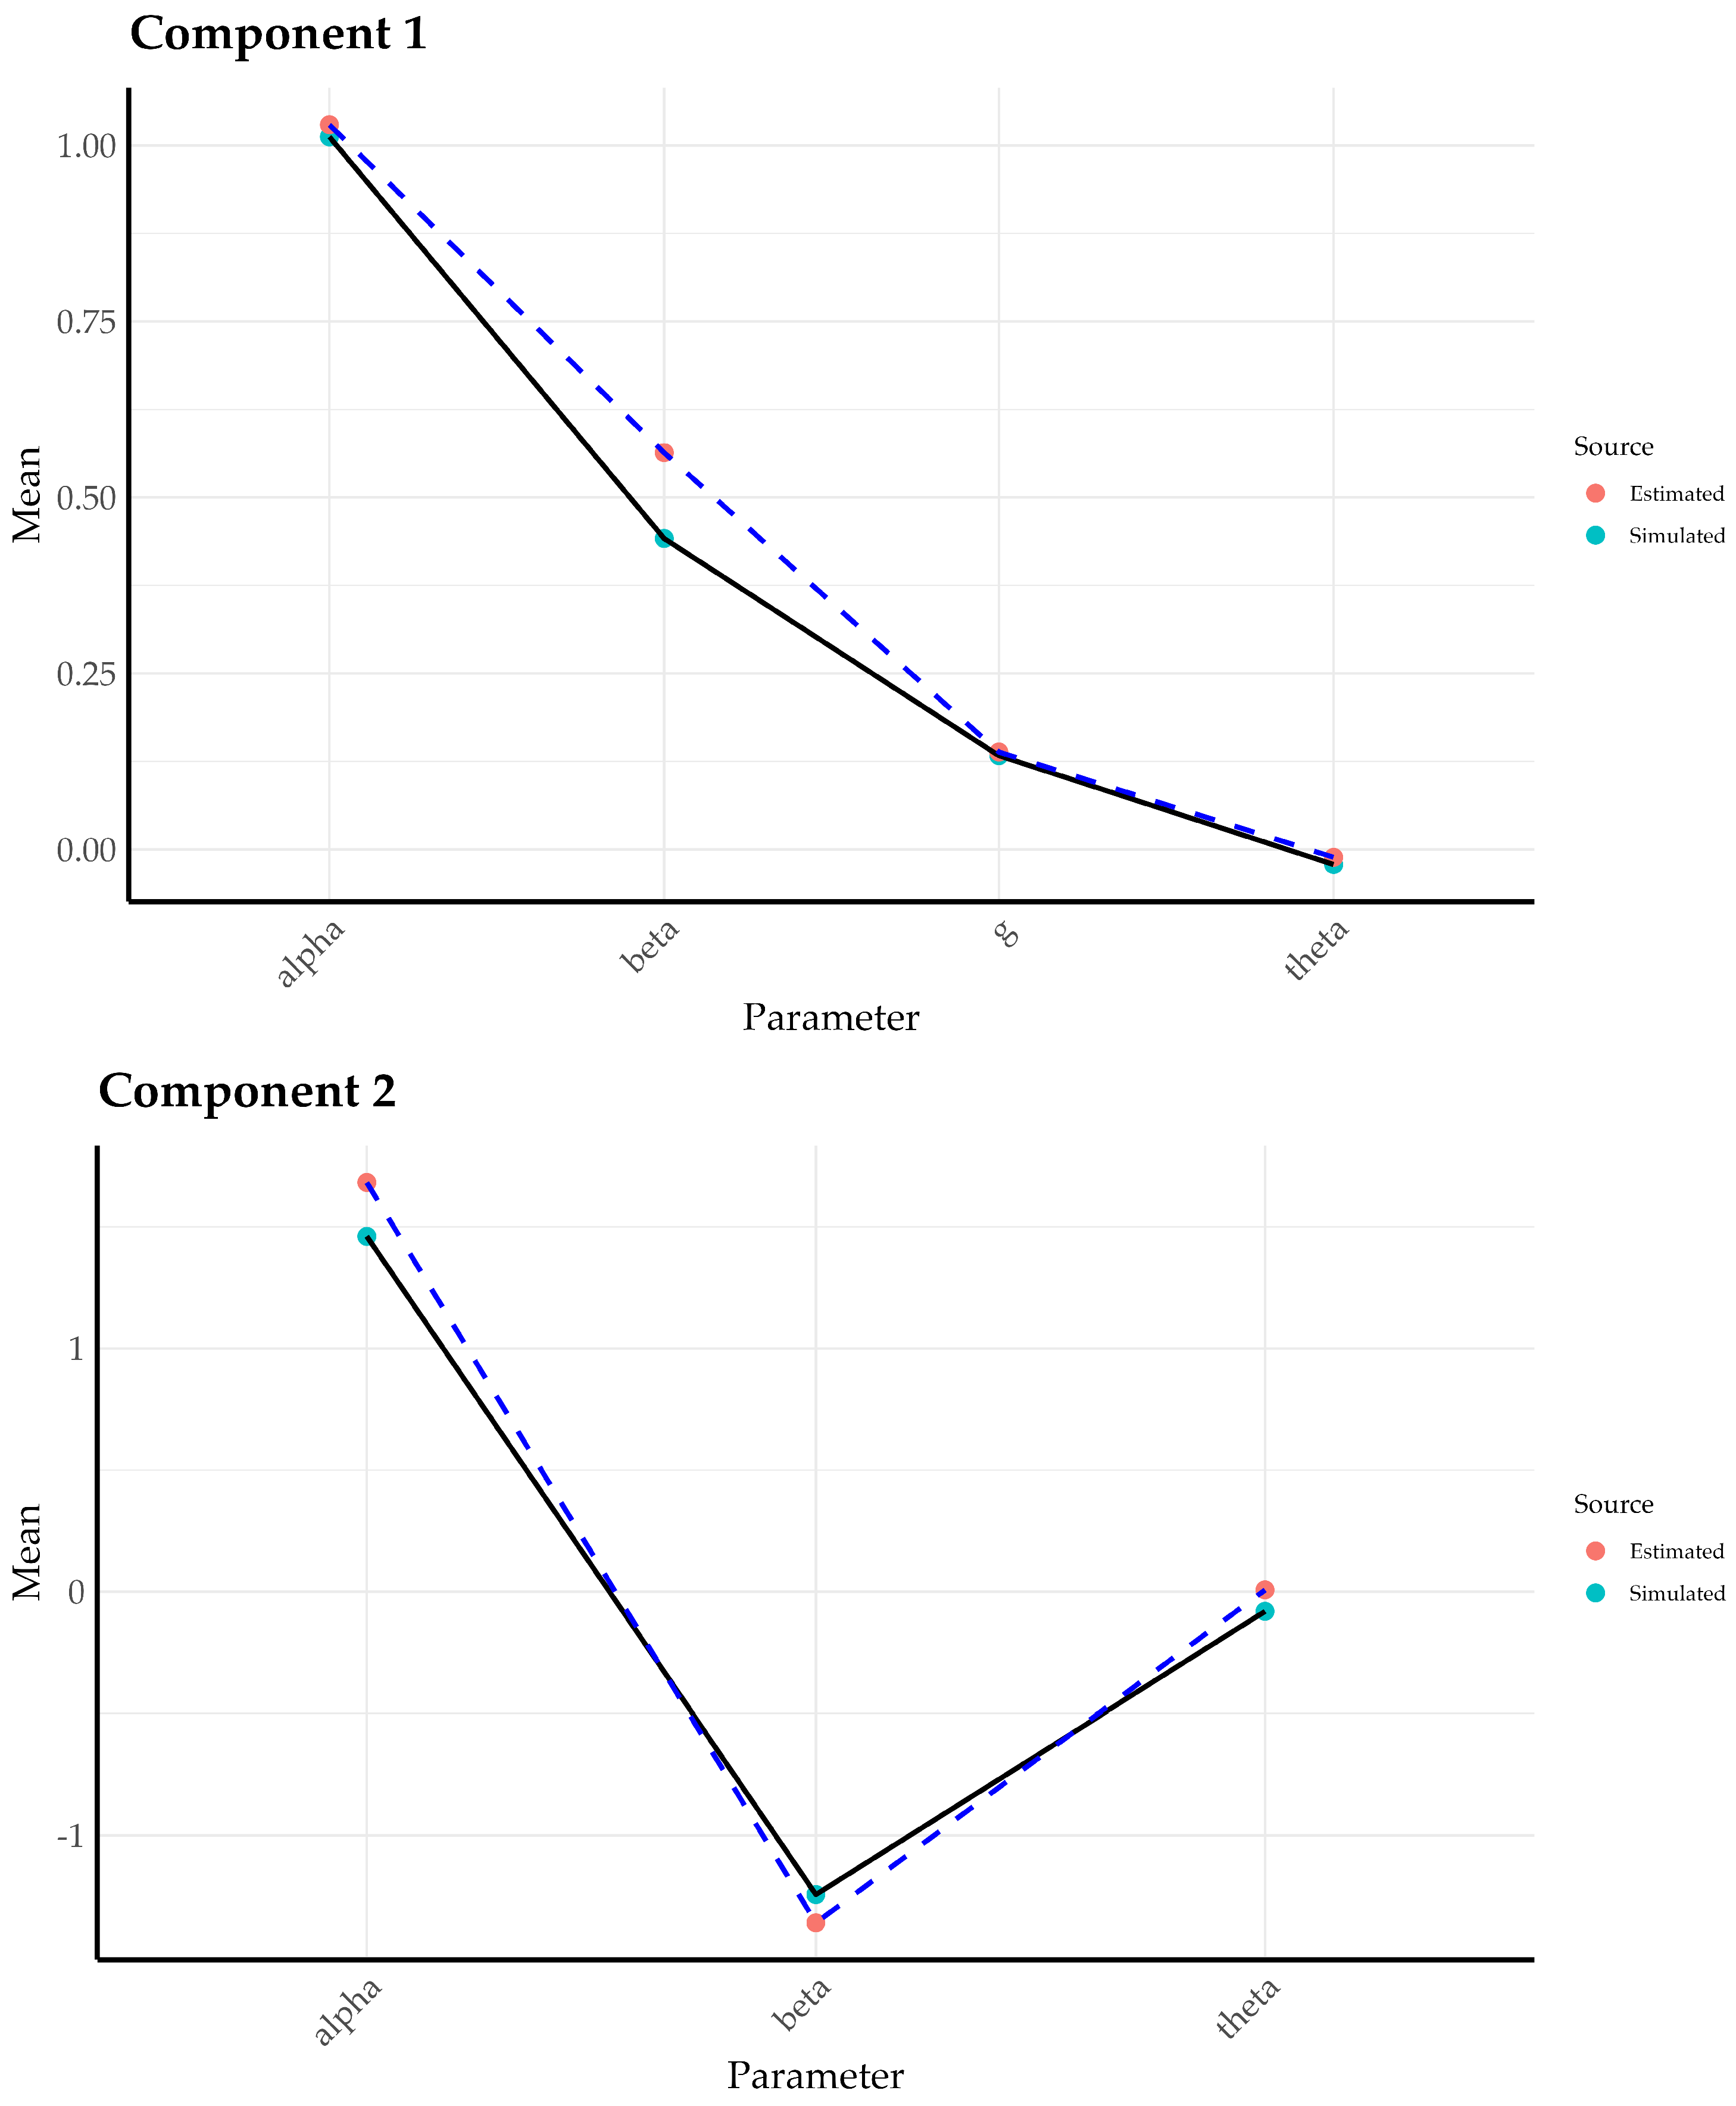
Appendix C. Parameter Recovery Simulation Study
| 1 | In the original parameterization, Embretson and Yang (2013) included an intercept for each component m. We omitted these intercepts because are not required for model identification. |
References
- Alvarado, Jesus Ma, Zuleyma Santalla, and Carmen Santisteban. 1999. An evaluation of the code theory of visual attention extended to two dimensions. Acta Psychologica 103: 239–55. [Google Scholar] [CrossRef]
- Arendasy, Martin, and Markus Sommer. 2005. The effect of different types of perceptual manipulations on the dimensionality of automatically generated figural matrices. Intelligence 33: 307–24. [Google Scholar] [CrossRef]
- Baghaei, Purya, and Christine Hohensinn. 2017. A Method of Q-Matrix Validation for the Linear Logistic Test Model. Frontiers in Psychology 8: 897. [Google Scholar] [CrossRef] [PubMed]
- Blum, Diego, and Heinz Holling. 2018. Automatic Generation of Figural Analogies With the IMak Package. Frontiers in Psychology 9: 1286. [Google Scholar] [CrossRef] [PubMed]
- Blum, Diego, Heinz Holling, Maria Silvia Galibert, and Boris Forthmann. 2016. Task difficulty prediction of figural analogies. Intelligence 6: 72–81. [Google Scholar] [CrossRef]
- Bundesen, Claus, Signe Vangkilde, and Anders Petersen. 2015. Recent developments in a computational theory of visual attention (TVA). Vision Research 116: 210–18. [Google Scholar] [CrossRef]
- Cattell, Raymond B. 1971. Abilities: Their Structure, Growth, and Action. Oxford: Houghton Mifflin. [Google Scholar]
- Chechlacz, Magdalena, Dante Mantini, Celine R. Gillebert, and Glyn W. Humphreys. 2015. Asymmetrical white matter networks for attending to global versus local features. Cortex 72: 54–64. [Google Scholar] [CrossRef]
- Combs, Kara, Hongjing Lu, and Trevor J. Bihl. 2023. Transfer Learning and Analogical Inference: A Critical Comparison of Algorithms, Methods, and Applications. Algorithms 16: 146. [Google Scholar] [CrossRef]
- Daniel, Robert C., and Susan E. Embretson. 2010. Designing cognitive complexity in mathematical problem-solving items. Applied Psychological Measurement 34: 348–64. [Google Scholar] [CrossRef]
- Embretson, Susan. 1983. Construct Validity: Construct Representation Versus Nomothetic Span. Psychological Bulletin 93: 179–97. [Google Scholar]
- Embretson, Susan. 1996. The new rules of measurement. Psychological Assessment 8: 341–49. [Google Scholar] [CrossRef]
- Embretson, Susan. 2002. Generating abstract reasoning items with cognitive theory. In Item Generation for Test Development. London: Routledge, pp. 219–50. [Google Scholar]
- Embretson, Susan. 2019. Explanatory Item Response Theory Models: Impact on Validity and Test Development? In Quantitative Psychology. Edited by M. Wiberg, S. Culpepper, R. Janssen, J. González and D. Molenaar. Springer Proceedings in Mathematics & Statistics. Cham: Springer International Publishing, pp. 1–11. [Google Scholar]
- Embretson, Susan, and Joanna Gorin. 2001. Improving construct validity with cognitive psychology principles. Journal of Educational Measurement 38: 343–68. [Google Scholar] [CrossRef]
- Embretson, Susan, and Xiangdong Yang. 2006. Item Response Theory. In Handbook of Complementary Methods in Education Research, 3rd ed. London: Routledge, p. 26. [Google Scholar]
- Embretson, Susan E. 1998. A cognitive design system approach to generating valid tests: Application to abstract reasoning. Psychological Methods 3: 380–96. [Google Scholar] [CrossRef]
- Embretson, Susan E. 1999. Generating items during testing: Psychometric issues and models. Psychometrika 64: 407–33. [Google Scholar] [CrossRef]
- Embretson, Susan E. 2015. The Multicomponent Latent Trait Model for Diagnosis: Applications to Heterogeneous Test Domains. Applied Psychological Measurement 39: 16–30. [Google Scholar] [CrossRef] [PubMed]
- Embretson, Susan E., and Xiangdong Yang. 2013. A multicomponent latent trait model for diagnosis. Psychometrika 78: 14–36. [Google Scholar] [CrossRef] [PubMed]
- Fischer, Gerhard H. 1973. The linear logistic test model as an instrument in educational research. Acta Psychologica 37: 359–74. [Google Scholar] [CrossRef]
- Fischer, Gerhard H. 1997. Unidimensional Linear Logistic Rasch Models. In Handbook of Modern Item Response Theory. Edited by Willem J. van der Linden and R.K. Hambleton. New York: Springer, pp. 225–43. [Google Scholar]
- Fischer, Gerhard H., and Anton K. Formann. 1982. Some applications of logistic latent trait models with linear constraints on the parameters. Applied Psychological Measurement 6: 397–416. [Google Scholar] [CrossRef]
- Gelman, Andrew, Jessica Hwang, and Aki Vehtari. 2013. Understanding predictive information criteria for Bayesian models. arXiv arXiv:1307.5928. [Google Scholar] [CrossRef]
- Gelman, Andrew, Aki Vehtari, Daniel Simpson, Charles C. Margossian, Bob Carpenter, Yuling Yao, Lauren Kennedy, Jonah Gabry, Paul-Christian Bürkner, and Martin Modrák. 2020. Bayesian Workflow. arXiv arXiv:2011.01808. [Google Scholar]
- Gentner, Dedre, and L. Smith. 2012. Analogical reasoning. In Encyclopedia of Human Behavior, 2nd ed. Amsterdam: Elsevier Inc., pp. 130–32. [Google Scholar]
- Harris, Alexandra, Jeremiah McMillan, Benjamin Listyg, Laura Matzen, and Nathan Carter. 2020. Measuring Intelligence with the Sandia Matrices: Psychometric Review and Recommendations for Free Raven-Like Item Sets. Personnel Assessment and Decisions 6: 6. [Google Scholar] [CrossRef]
- Holyoak, Keith J. 2005. Analogy. In The Cambridge Handbook of Thinking and Reasoning. New York: Cambridge University Press, pp. 117–42. [Google Scholar]
- Logan, Gordon D. 1996. The CODE theory of visual attention: An integration of space-based and object-based attention. Psychological Review 103: 603–49. [Google Scholar] [CrossRef]
- Messick, Samuel. 1995. Validity of psychological assessment: Validation of inferences from persons’ responses and performances as scientific inquiry into score meaning. American Psychologist 50: 741–49. [Google Scholar] [CrossRef]
- Meyer, J. Patrick. 2010. A Mixture Rasch Model With Item Response Time Components. Applied Psychological Measurement 34: 521–38. [Google Scholar] [CrossRef]
- Mitchell, Melanie. 2021. Abstraction and Analogy-Making in Artificial Intelligence. arXiv arXiv:2102.10717. [Google Scholar] [CrossRef] [PubMed]
- Molenaar, Dylan, and Paul Boeck. 2018. Response mixture modeling: Accounting for heterogeneity in item characteristics across response times. Psychometrika 83: 279–97. [Google Scholar] [CrossRef]
- Nelson, Nickola, and Letitia L. Gillespie. 1991. Analogies for Thinking and Talking: Words, Pictures, and Figures. Tucson: Communication Skill Builders. [Google Scholar]
- Ramírez, Eduar S., Francisco J. Ruiz, Andrés Peña-Vargas, and Paola A. Bernal. 2021. Empirical Investigation of the Verbal Cues Involved in Delivering Experiential Metaphors. International Journal of Environmental Research and Public Health 18: 10630. [Google Scholar] [CrossRef]
- Raven, John C., and John Hugh Court. 2003. Manual for Raven’s Progressive Matrices and Vocabulary Scales. Section 1. San Antonio: Harcourt Assessment, OCLC: 750774351. [Google Scholar]
- Ruiz, Francisco J., and Carmen Luciano. 2011. Cross-Domain Analogies as Relating Derived Relations among Two Separate Relational Networks. Journal of the Experimental Analysis of Behavior 95: 369–85. [Google Scholar] [CrossRef] [PubMed]
- Schneider, W. Joel, and Kevin S. McGrew. 2018. The cattell-horn-carroll theory of cognitive abilities. In Contemporary Intellectual Assessment: Theories, Tests, and Issues. New York: The Guilford Press, pp. 73–163. [Google Scholar]
- Spearman, C. 1904. “General Intelligence”, Objectively Determined and Measured. The American Journal of Psychology 15: 201–92. [Google Scholar] [CrossRef]
- Sternberg, Robert J. 1977. Intelligence, Information Processing, and Analogical Reasoning: The Componential Analysis of Human Abilities. Hillsdale: Lawrence Erlbaum Associates. [Google Scholar]
- Sternberg, Robert J. 2018. The Nature of Human Intelligence. Cambridge: Cambridge University Press. [Google Scholar]
- Sternberg, Robert J., ed. 2020. Intelligence and Information Processing. In The Cambridge Handbook of Intelligence, 2nd ed. Cambridge Handbooks in Psychology. Cambridge: Cambridge University Press, pp. 469–656. [Google Scholar]
- Vehtari, Aki, Andrew Gelman, and Jonah Gabry. 2017. Practical Bayesian model evaluation using leave-one-out cross-validation and WAIC. Statistics and Computing 27: 1413–32. [Google Scholar] [CrossRef]
- Watanabe, Sumio. 2013. A widely applicable Bayesian information criterion. The Journal of Machine Learning Research 14: 867–97. [Google Scholar]


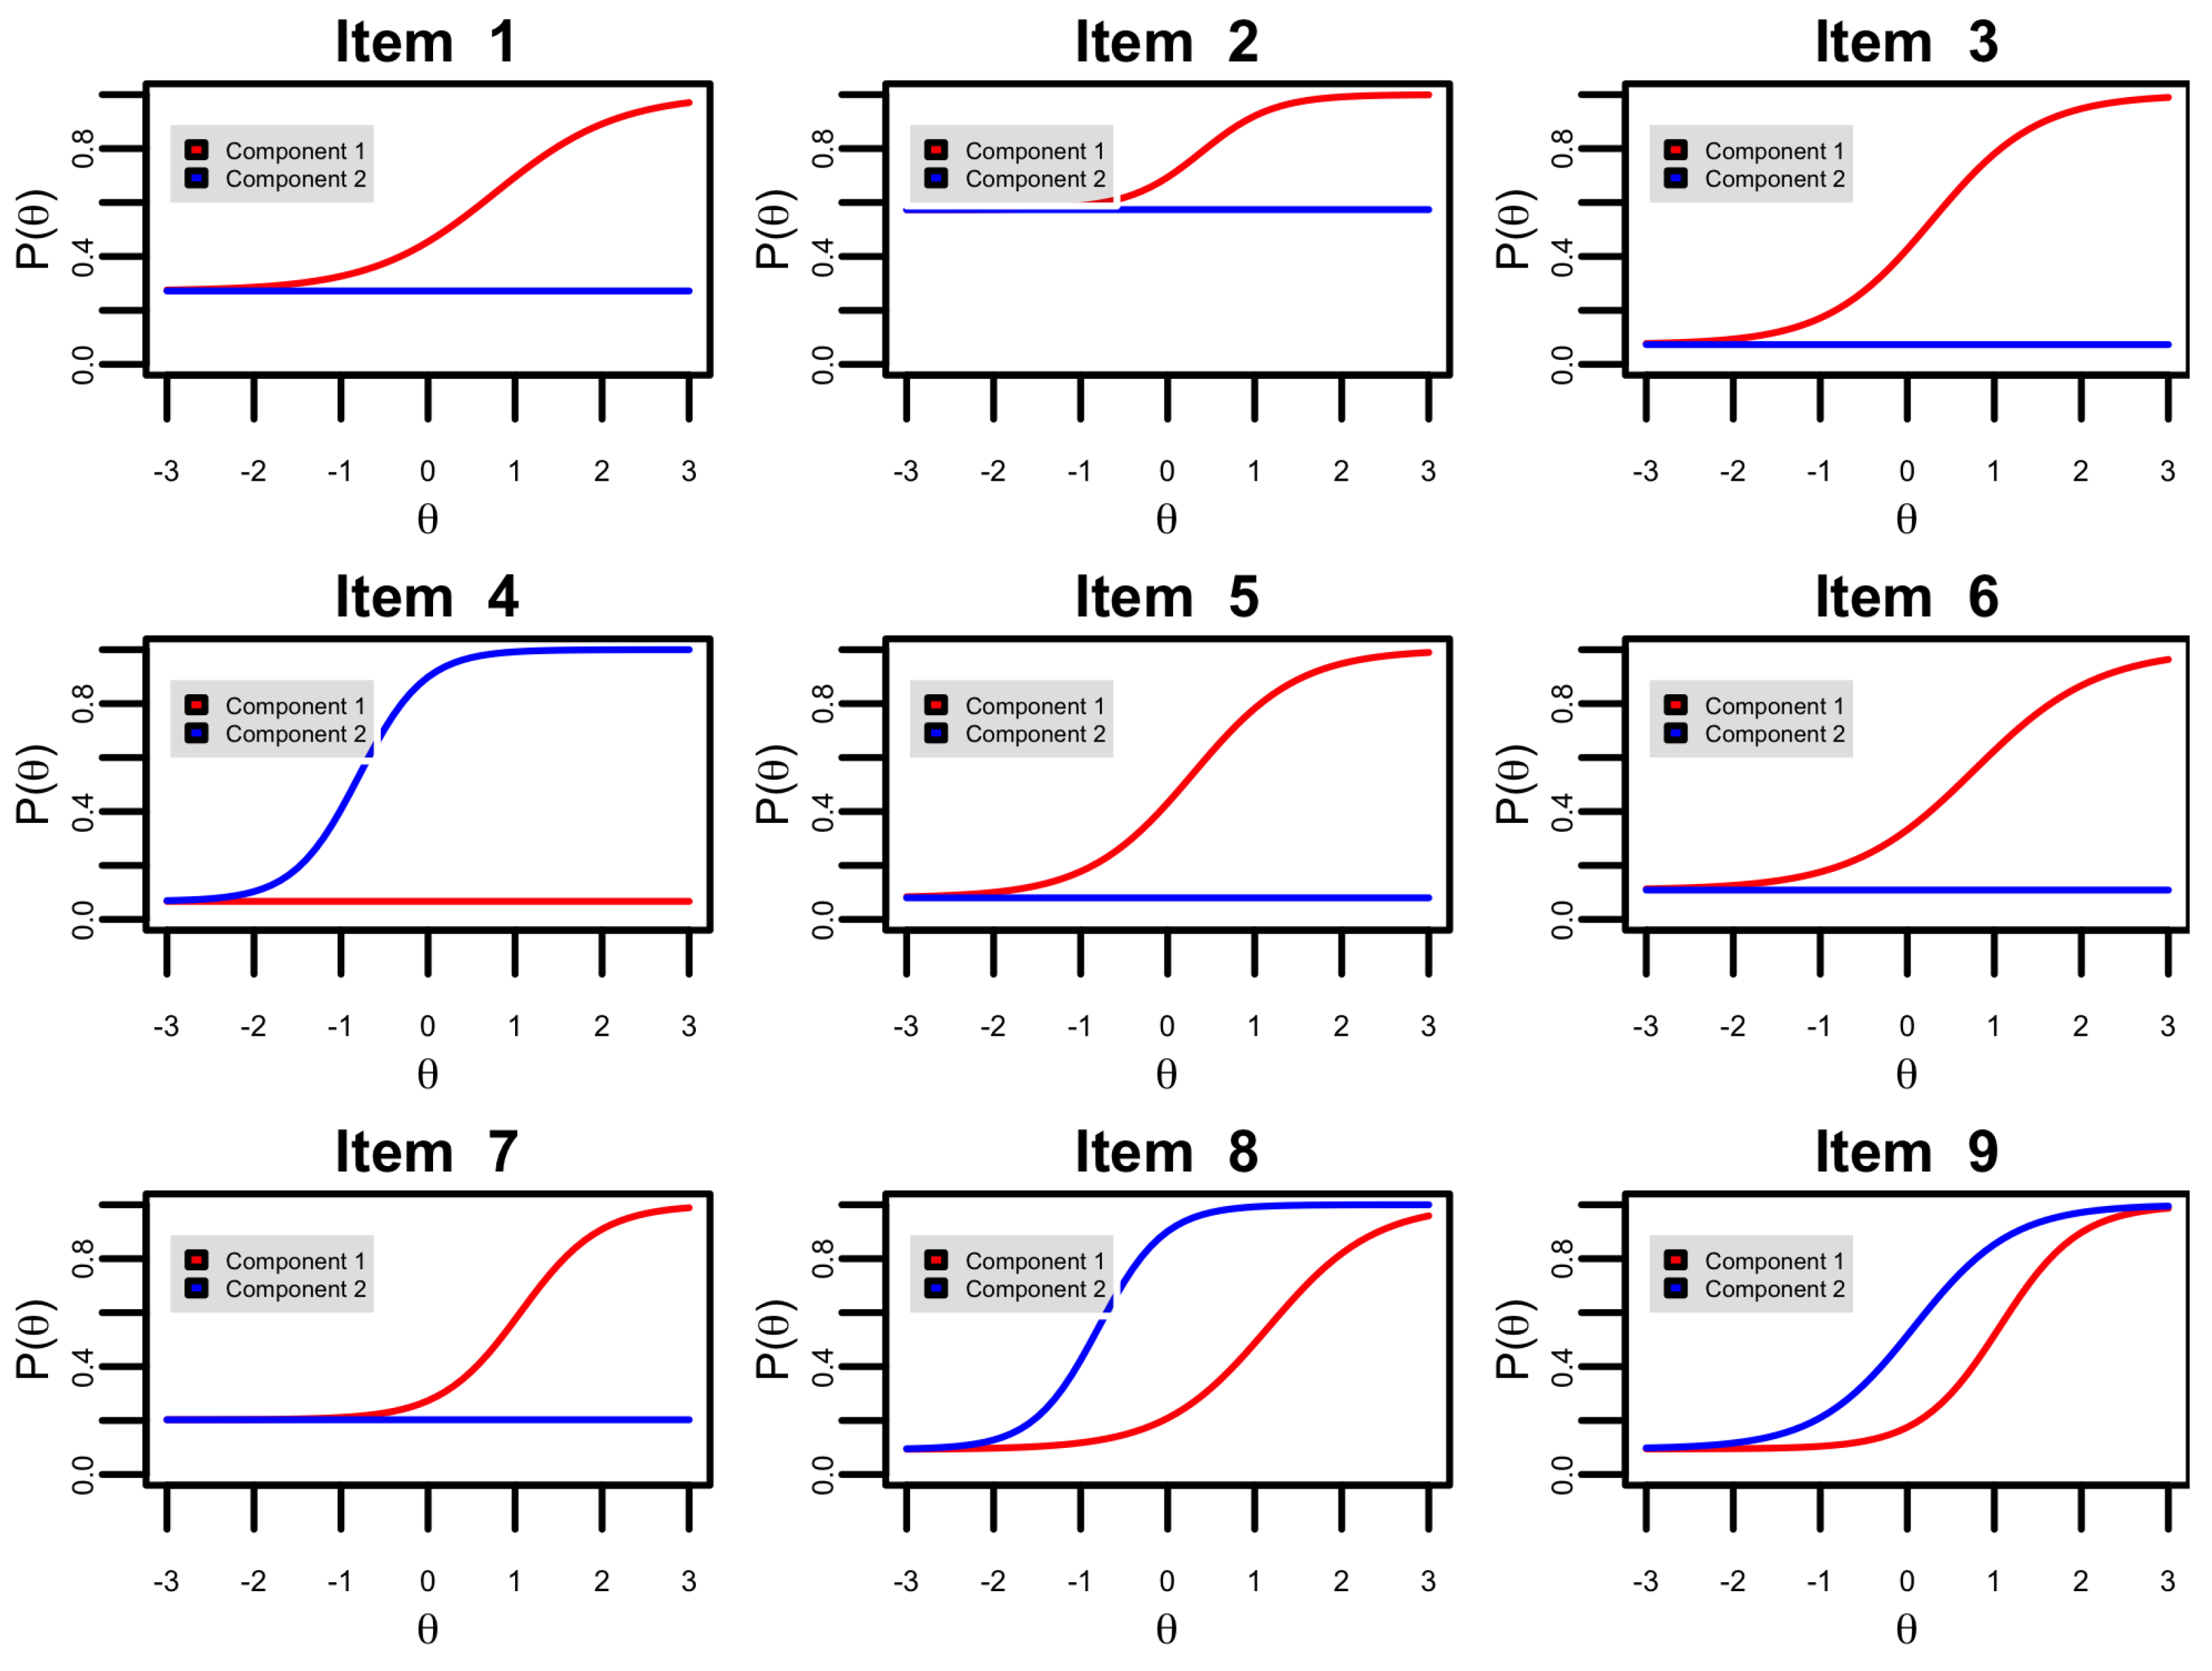
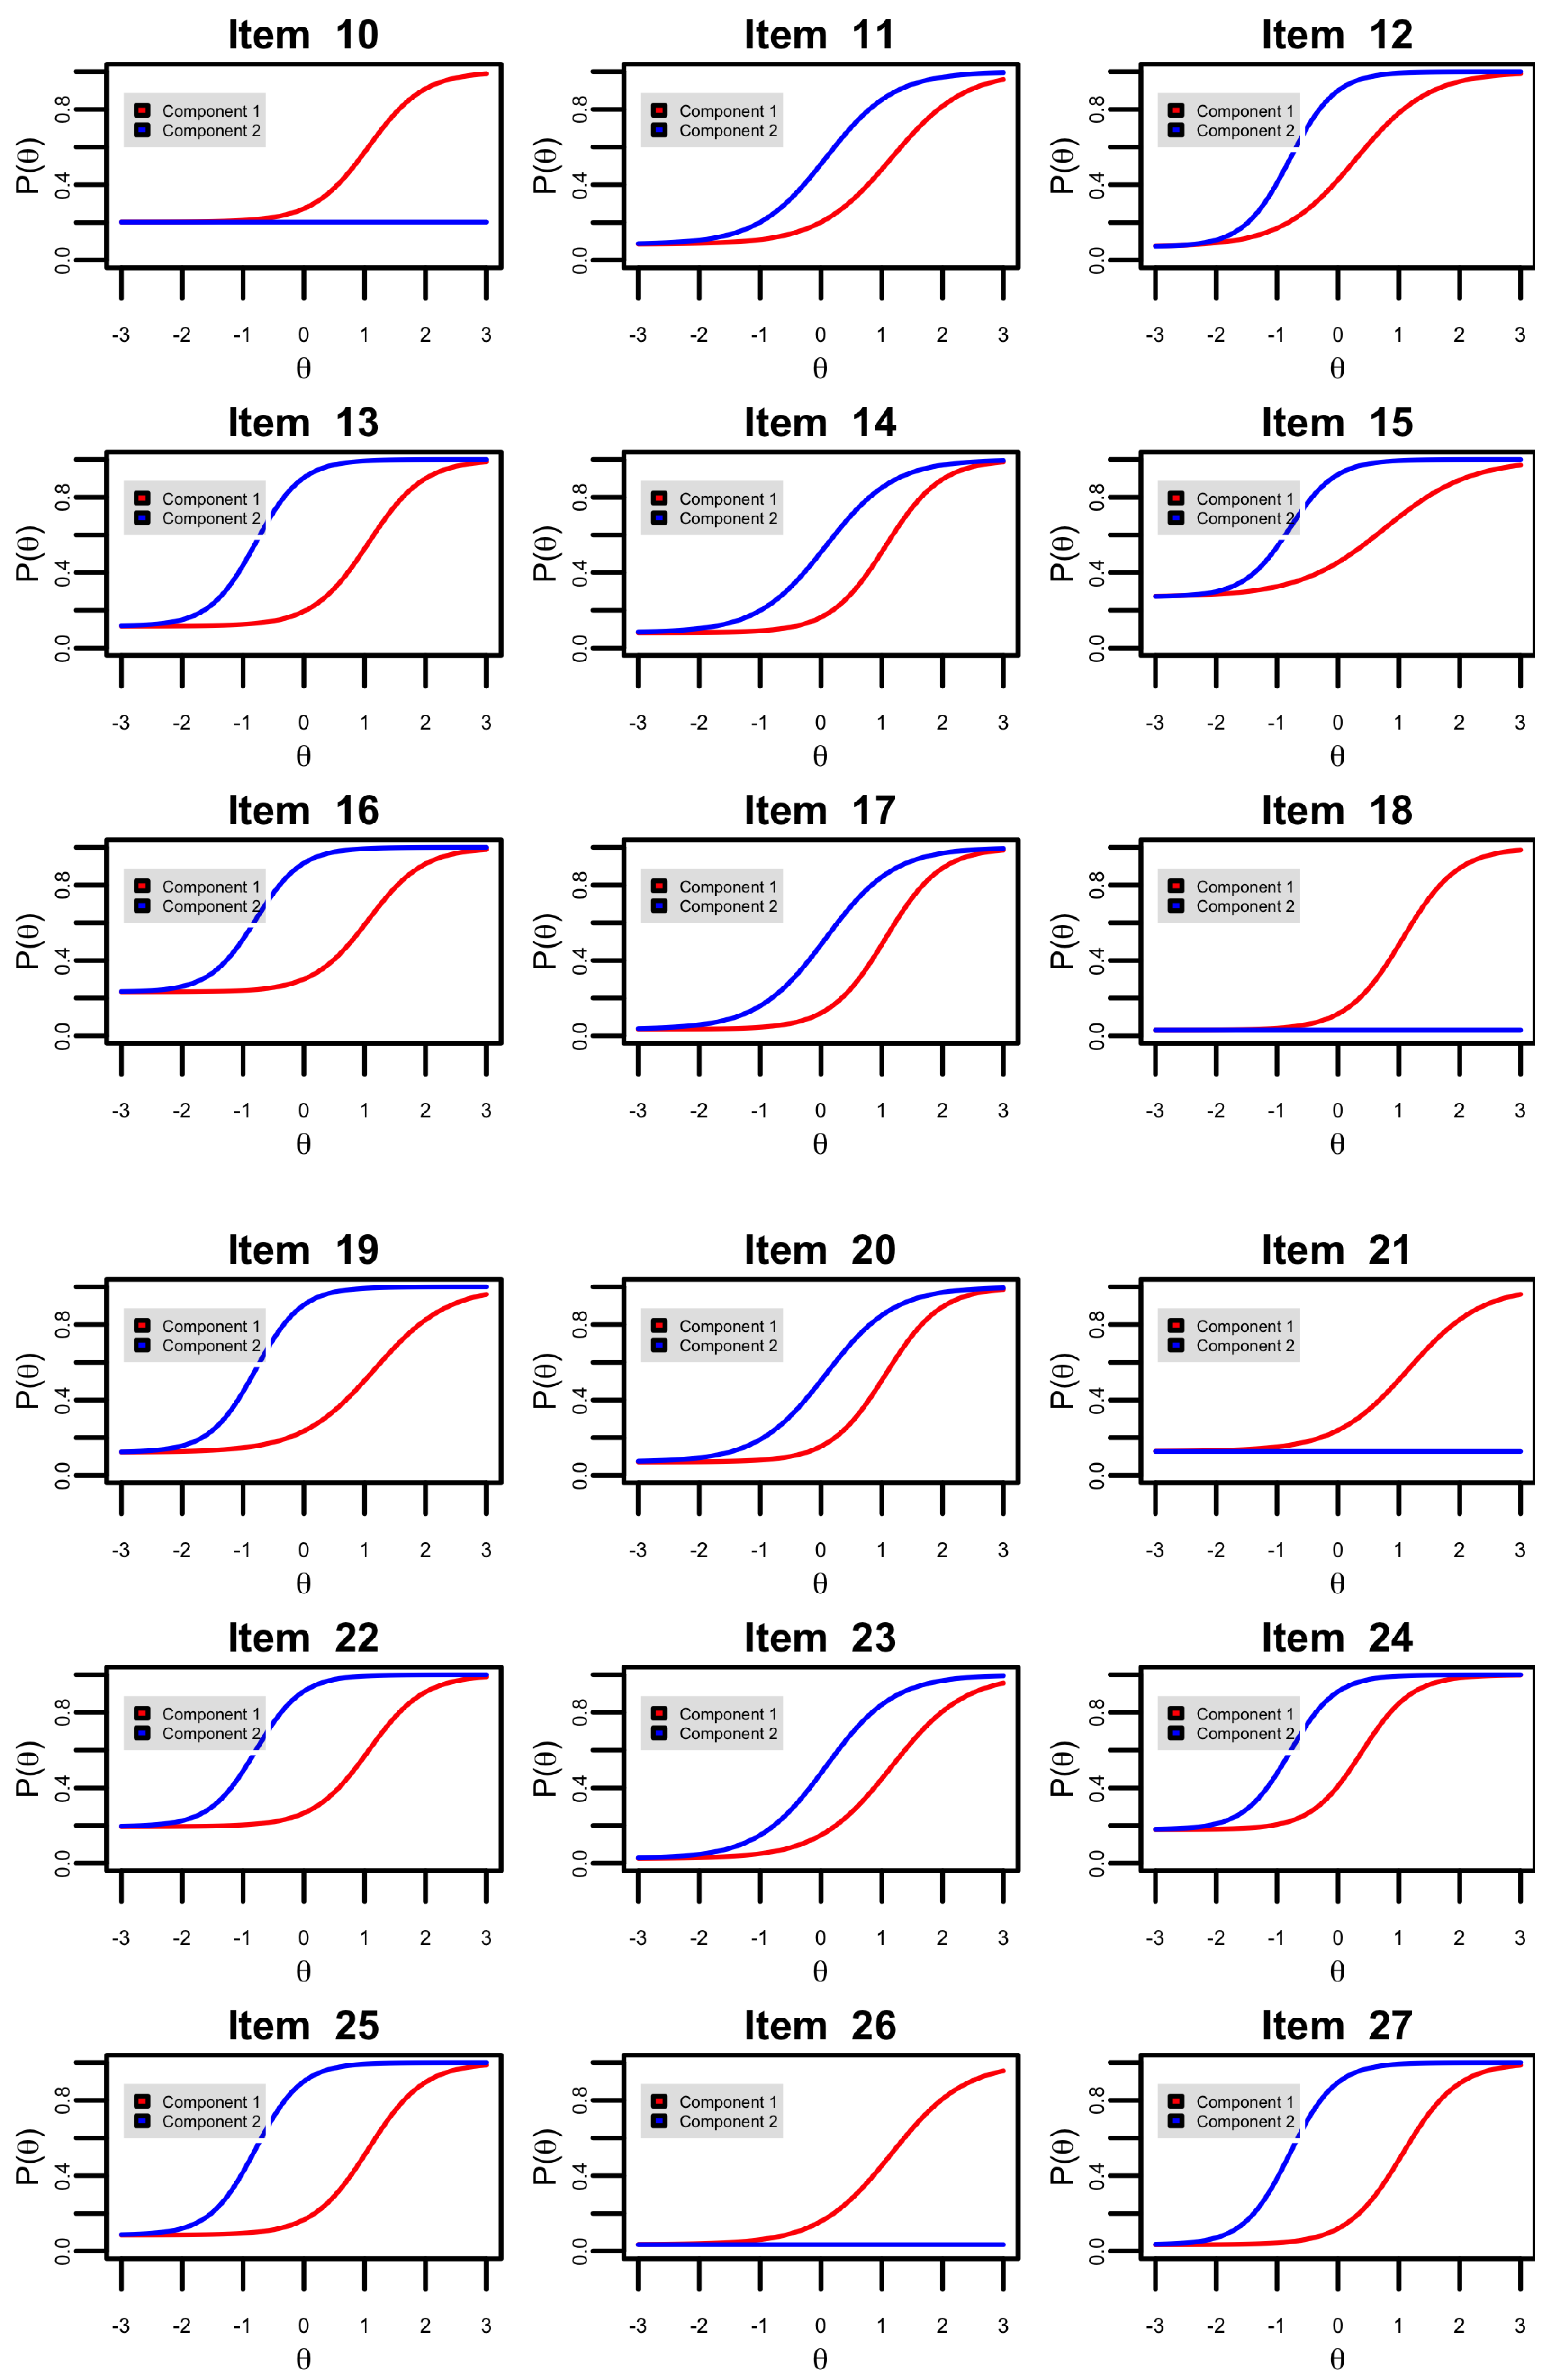
| Item | Rules | ||||
|---|---|---|---|---|---|
| Rule 1 | Rule 2 | Rule 3 | Rule 4 | Rule 5 | |
| 1 | 0 | 1 | 0 | 0 | 0 |
| 2 | 0 | 0 | 1 | 0 | 0 |
| 3 | 1 | 0 | 0 | 0 | 0 |
| 4 | 0 | 0 | 0 | 0 | 1 |
| 5 | 1 | 0 | 0 | 0 | 0 |
| 6 | 0 | 1 | 0 | 0 | 0 |
| 7 | 1 | 1 | 0 | 0 | 0 |
| 8 | 0 | 1 | 1 | 0 | 1 |
| 9 | 1 | 1 | 0 | 1 | 1 |
| 10 | 1 | 1 | 0 | 0 | 0 |
| 11 | 0 | 1 | 1 | 1 | 1 |
| 12 | 1 | 0 | 0 | 0 | 1 |
| 13 | 1 | 1 | 0 | 0 | 1 |
| 14 | 1 | 1 | 0 | 1 | 1 |
| 15 | 0 | 1 | 0 | 0 | 1 |
| 16 | 1 | 1 | 0 | 0 | 1 |
| 17 | 1 | 1 | 0 | 1 | 1 |
| 18 | 1 | 1 | 0 | 0 | 0 |
| 19 | 0 | 1 | 1 | 0 | 1 |
| 20 | 1 | 1 | 0 | 1 | 1 |
| 21 | 0 | 1 | 1 | 0 | 0 |
| 22 | 1 | 1 | 0 | 0 | 1 |
| 23 | 0 | 1 | 1 | 1 | 1 |
| 24 | 0 | 0 | 1 | 0 | 1 |
| 25 | 1 | 1 | 0 | 0 | 1 |
| 26 | 0 | 1 | 1 | 0 | 0 |
| 27 | 1 | 1 | 0 | 0 | 1 |
| Item | GMLT-D | MLTM-D | LLTM | |||||||||||
|---|---|---|---|---|---|---|---|---|---|---|---|---|---|---|
| 2.5% | EAP | 97.5% | Dobs | 2.5% | EAP | 97.5% | Dobs | 2.5% | EAP | 97.5% | Dobs | |||
| 1 | 0.47 | 0.51 | 0.56 | 0.52 | 0.39 | 0.42 | 0.44 | 0.52 | 0.39 | 0.41 | 0.43 | 0.52 | ||
| 2 | 0.70 | 0.75 | 0.79 | 0.78 | 0.50 | 0.52 | 0.55 | 0.78 | 0.47 | 0.49 | 0.51 | 0.78 | ||
| 3 | 0.45 | 0.48 | 0.52 | 0.48 | 0.47 | 0.49 | 0.51 | 0.48 | 0.45 | 0.47 | 0.49 | 0.48 | ||
| 4 | 0.73 | 0.76 | 0.79 | 0.74 | 0.77 | 0.79 | 0.82 | 0.74 | 0.55 | 0.57 | 0.59 | 0.74 | ||
| 5 | 0.45 | 0.49 | 0.52 | 0.47 | 0.47 | 0.49 | 0.51 | 0.47 | 0.45 | 0.47 | 0.49 | 0.47 | ||
| 6 | 0.37 | 0.40 | 0.44 | 0.42 | 0.39 | 0.42 | 0.44 | 0.42 | 0.39 | 0.41 | 0.43 | 0.42 | ||
| 7 | 0.34 | 0.38 | 0.43 | 0.40 | 0.33 | 0.34 | 0.36 | 0.40 | 0.29 | 0.31 | 0.33 | 0.40 | ||
| 8 | 0.23 | 0.26 | 0.29 | 0.22 | 0.28 | 0.30 | 0.32 | 0.22 | 0.31 | 0.32 | 0.34 | 0.22 | ||
| 9 | 0.17 | 0.20 | 0.24 | 0.22 | 0.16 | 0.17 | 0.19 | 0.22 | 0.16 | 0.17 | 0.19 | 0.22 | ||
| 10 | 0.34 | 0.38 | 0.42 | 0.40 | 0.33 | 0.34 | 0.36 | 0.40 | 0.29 | 0.31 | 0.33 | 0.40 | ||
| 11 | 0.16 | 0.20 | 0.23 | 0.22 | 0.17 | 0.19 | 0.20 | 0.22 | 0.17 | 0.18 | 0.20 | 0.22 | ||
| 12 | 0.36 | 0.39 | 0.43 | 0.39 | 0.38 | 0.40 | 0.42 | 0.39 | 0.44 | 0.46 | 0.49 | 0.39 | ||
| 13 | 0.25 | 0.28 | 0.31 | 0.28 | 0.27 | 0.28 | 0.29 | 0.28 | 0.29 | 0.31 | 0.32 | 0.28 | ||
| 14 | 0.16 | 0.19 | 0.23 | 0.19 | 0.16 | 0.17 | 0.19 | 0.19 | 0.16 | 0.17 | 0.19 | 0.19 | ||
| 15 | 0.42 | 0.46 | 0.51 | 0.50 | 0.32 | 0.34 | 0.36 | 0.50 | 0.38 | 0.40 | 0.43 | 0.50 | ||
| 16 | 0.33 | 0.37 | 0.42 | 0.41 | 0.27 | 0.28 | 0.29 | 0.41 | 0.29 | 0.31 | 0.32 | 0.41 | ||
| 17 | 0.13 | 0.15 | 0.18 | 0.14 | 0.16 | 0.17 | 0.19 | 0.14 | 0.16 | 0.17 | 0.19 | 0.14 | ||
| 18 | 0.22 | 0.25 | 0.28 | 0.20 | 0.33 | 0.34 | 0.36 | 0.20 | 0.29 | 0.31 | 0.33 | 0.20 | ||
| 19 | 0.25 | 0.29 | 0.32 | 0.31 | 0.28 | 0.30 | 0.32 | 0.31 | 0.31 | 0.32 | 0.34 | 0.31 | ||
| 20 | 0.16 | 0.18 | 0.22 | 0.18 | 0.16 | 0.17 | 0.19 | 0.18 | 0.16 | 0.17 | 0.19 | 0.18 | ||
| 21 | 0.29 | 0.33 | 0.37 | 0.34 | 0.35 | 0.37 | 0.39 | 0.34 | 0.31 | 0.33 | 0.35 | 0.34 | ||
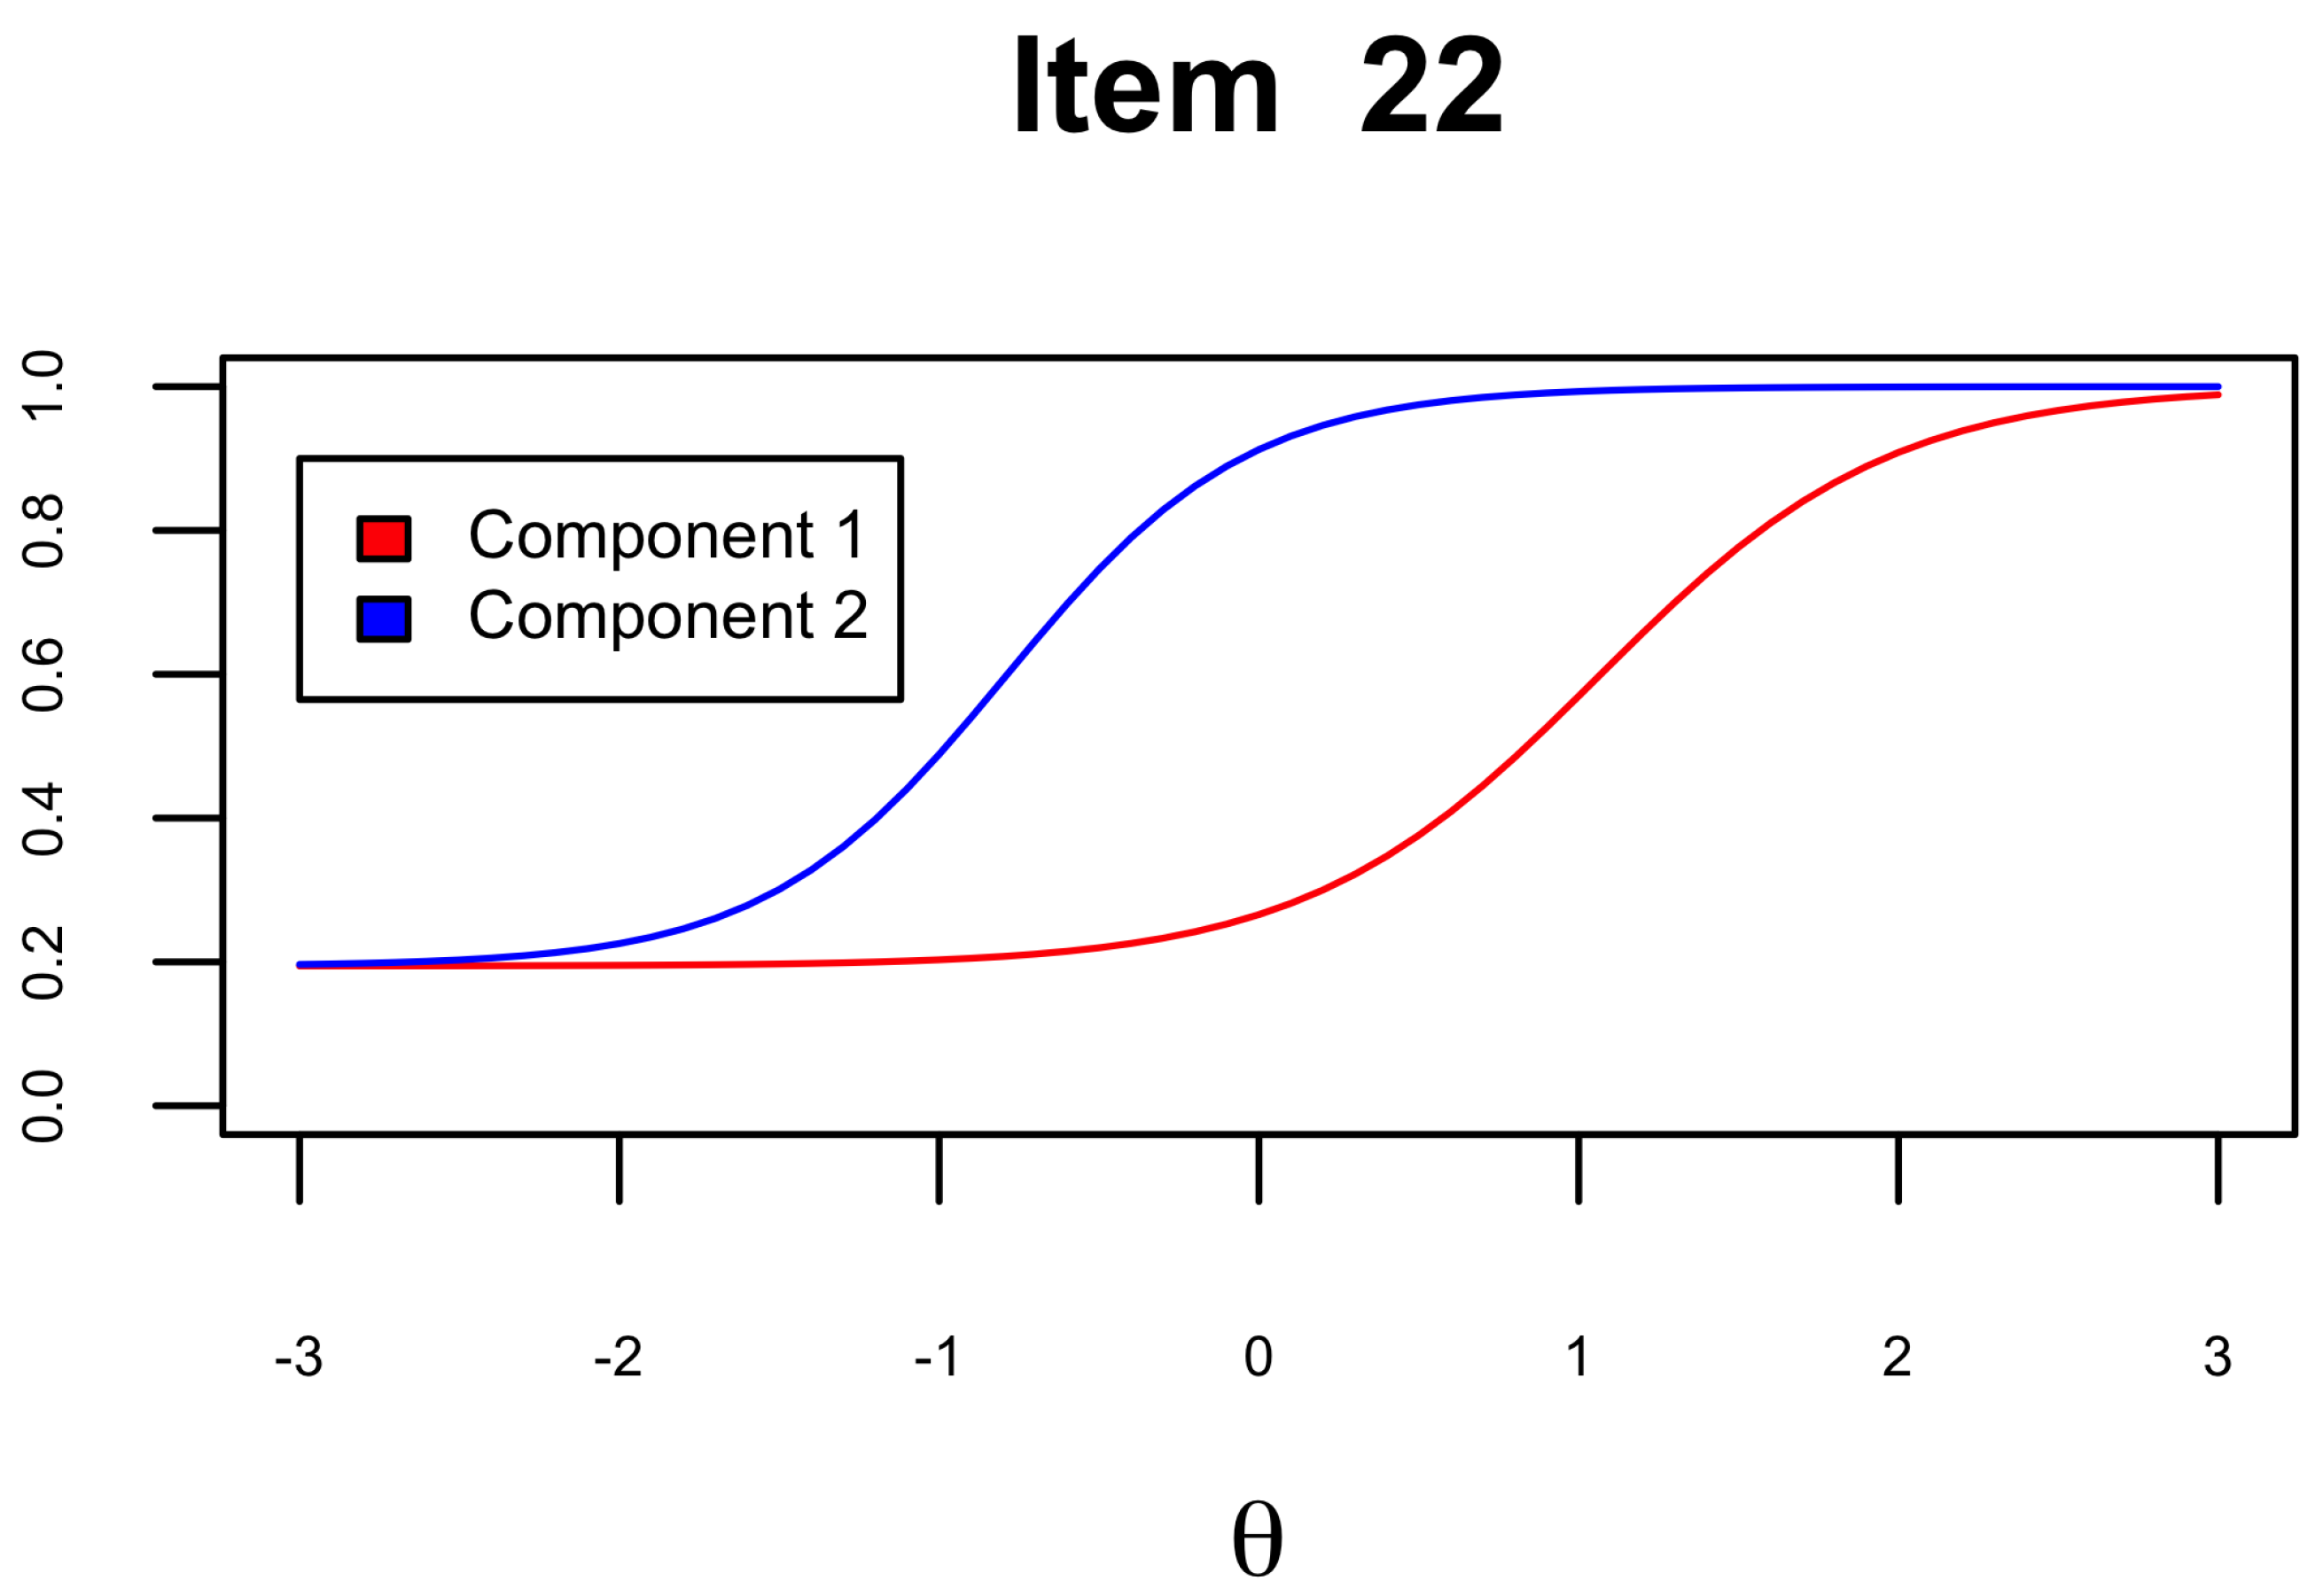
| 22 | 0.30 | 0.34 | 0.38 | 0.36 | 0.27 | 0.28 | 0.29 | 0.36 | 0.29 | 0.31 | 0.32 | 0.36 | ||
| 23 | 0.12 | 0.14 | 0.17 | 0.11 | 0.17 | 0.19 | 0.20 | 0.11 | 0.17 | 0.18 | 0.20 | 0.11 | ||
| 24 | 0.40 | 0.44 | 0.48 | 0.46 | 0.40 | 0.42 | 0.44 | 0.46 | 0.46 | 0.48 | 0.51 | 0.46 | ||
| 25 | 0.22 | 0.25 | 0.28 | 0.26 | 0.27 | 0.28 | 0.29 | 0.26 | 0.29 | 0.31 | 0.32 | 0.26 | ||
| 26 | 0.23 | 0.26 | 0.29 | 0.20 | 0.35 | 0.37 | 0.39 | 0.20 | 0.31 | 0.33 | 0.35 | 0.20 | ||
| 27 | 0.19 | 0.21 | 0.24 | 0.17 | 0.27 | 0.28 | 0.29 | 0.17 | 0.29 | 0.31 | 0.32 | 0.17 | ||
| GMLT-D | MLTM-D | LLTM | |||||
|---|---|---|---|---|---|---|---|
| Rules | Component 1 | Component 2 | Component 1 | Component 2 | Component 1 | ||
| IC [2.5%, 97.5%] | IC [2.5%, 97.5%] | IC [2.5%, 97.5%] | IC [2.5%, 97.5%] | IC [2.5%, 97.5%] | |||
| 1 | 0.29 [0.15, 0.43] | 0.00 [0.00, 0.00] | 0.32 [0.22, 0.42] | 0.00 [0.00, 0.00] | 0.53 [0.41, 0.64] | ||
| 2 | 0.77 [0.64, 0.92] | 0.00 [0.00, 0.00] | 0.65 [0.55, 0.75] | 0.00 [0.00, 0.00] | 0.83 [0.73, 0.93] | ||
| 3 | 0.39 [0.22, 0.56] | 0.00 [0.00, 0.00] | 0.20 [0.09, 0.31] | 0.00 [0.00, 0.00] | 0.43 [0.30, 0.55] | ||
| 4 | 0.00 [0.00, 0.00] | 0.87 [0.48, 1.22] | 0.00 [0.00, 0.00] | 1.34 [1.09, 1.62] | 0.91 [0.77, 1.06] | ||
| 5 | 0.00 [0.00, 0.00] | −0.79 [−1.01, −0.60] | 0.00 [0.00, 0.00] | −1.23 [−1.48, −1.02] | 0.03 [−0.07, 0.13] | ||
| Item Discrimination Parameter (a) | Item Difficulty Parameter (b) | Item Guessing Parameter (c) | |||||
|---|---|---|---|---|---|---|---|
| Item | Component 1 | Component 2 | Component 1 | Component 2 | Component 1 | ||
| EAP [2.5%, 97.5%] | EAP [2.5%, 97.5%] | EAP [2.5%, 97.5%] | EAP [2.5%, 97.5%] | EAP [2.5%, 97.5%] | |||
| 1 | 1.42 [1.03, 1.93] | 0.00 [0.00, 0.00] | 0.77 [0.64, 0.92] | 0.00 [0.00, 0.00] | 0.27 [0.19, 0.35] | ||
| 2 | 2.42 [1.64, 3.37] | 0.00 [0.00, 0.00] | 0.39 [0.22, 0.56] | 0.00 [0.00, 0.00] | 0.57 [0.50, 0.64] | ||
| 3 | 1.65 [1.32, 2.02] | 0.00 [0.00, 0.00] | 0.29 [0.15, 0.43] | 0.00 [0.00, 0.00] | 0.07 [0.02, 0.14] | ||
| 4 | 0.00 [0.00, 0.00] | 2.66 [1.79, 3.67] | 0.00 [0.00, 0.00] | −0.79 [−1.01, −0.60] | 0.07 [0.01, 0.15] | ||
| 5 | 1.65 [1.32, 2.02] | 0.00 [0.00, 0.00] | 0.29 [0.15, 0.43] | 0.00 [0.00, 0.00] | 0.08 [0.02, 0.15] | ||
| 6 | 1.42 [1.03, 1.93] | 0.00 [0.00, 0.00] | 0.77 [0.64, 0.92] | 0.00 [0.00, 0.00] | 0.11 [0.04, 0.18] | ||
| 7 | 2.19 [1.81, 2.66] | 0.00 [0.00, 0.00] | 1.06 [0.91, 1.21] | 0.00 [0.00, 0.00] | 0.20 [0.15, 0.26] | ||
| 8 | 1.66 [1.32, 2.05] | 2.66 [1.79, 3.67] | 1.16 [0.99, 1.33] | −0.79 [−1.01, −0.60] | 0.09 [0.05, 0.14] | ||
| 9 | 2.19 [1.81, 2.66] | 1.78 [0.94, 2.84] | 1.06 [0.91, 1.21] | 0.08 [−0.30, 0.40] | 0.09 [0.06, 0.13] | ||
| 10 | 2.19 [1.81, 2.66] | 0.00 [0.00, 0.00] | 1.06 [0.91, 1.21] | 0.00 [0.00, 0.00] | 0.20 [0.15, 0.26] | ||
| 11 | 1.66 [1.32, 2.05] | 1.78 [0.94, 2.84] | 1.16 [0.99, 1.33] | 0.08 [−0.30, 0.40] | 0.08 [0.05, 0.13] | ||
| 12 | 1.65 [1.32, 2.02] | 2.66 [1.79, 3.67] | 0.29 [0.15, 0.43] | −0.79 [−1.01, −0.60] | 0.07 [0.03, 0.13] | ||
| 13 | 2.19 [1.81, 2.66] | 2.66 [1.79, 3.67] | 1.06 [0.91, 1.21] | −0.79 [−1.01, −0.60] | 0.12 [0.07, 0.16] | ||
| 14 | 2.19 [1.81, 2.66] | 1.78 [0.94, 2.84] | 1.06 [0.91, 1.21] | 0.08 [−0.30, 0.40] | 0.08 [0.05, 0.12] | ||
| 15 | 1.42 [1.03, 1.93] | 2.66 [1.79, 3.67] | 0.77 [0.64, 0.92] | −0.79 [−1.01, −0.60] | 0.27 [0.20, 0.34] | ||
| 16 | 2.19 [1.81, 2.66] | 2.66 [1.79, 3.67] | 1.06 [0.91, 1.21] | −0.79 [−1.01, −0.60] | 0.23 [0.18, 0.29] | ||
| 17 | 2.19 [1.81, 2.66] | 1.78 [0.94, 2.84] | 1.06 [0.91, 1.21] | 0.08 [−0.30, 0.40] | 0.04 [0.01, 0.06] | ||
| 18 | 2.19 [1.81, 2.66] | 0.00 [0.00, 0.00] | 1.06 [0.91, 1.21] | 0.00 [0.00, 0.00] | 0.03 [0.01, 0.06] | ||
| 19 | 1.66 [1.32, 2.05] | 2.66 [1.79, 3.67] | 1.16 [0.99, 1.33] | −0.79 [−1.01, −0.60] | 0.12 [0.07, 0.18] | ||
| 20 | 2.19 [1.81, 2.66] | 1.78 [0.94, 2.84] | 1.06 [0.91, 1.21] | 0.08 [−0.30, 0.40] | 0.07 [0.04, 0.11] | ||
| 21 | 1.66 [1.32, 2.05] | 0.00 [0.00, 0.00] | 1.16 [0.99, 1.33] | 0.00 [0.00, 0.00] | 0.13 [0.07, 0.18] | ||
| 22 | 2.19 [1.81, 2.66] | 2.66 [1.79, 3.67] | 1.06 [0.91, 1.21] | −0.79 [−1.01, −0.60] | 0.19 [0.15, 0.25] | ||
| 23 | 1.66 [1.32, 2.05] | 1.78 [0.94, 2.84] | 1.16 [0.99, 1.33] | 0.08 [−0.30, 0.40] | 0.02 [0.01, 0.05] | ||
| 24 | 2.42 [1.64, 3.37] | 2.66 [1.79, 3.67] | 0.39 [0.22, 0.56] | −0.79 [−1.01, −0.60] | 0.18 [0.11, 0.25] | ||
| 25 | 2.19 [1.81, 2.66] | 2.66 [1.79, 3.67] | 1.06 [0.91, 1.21] | −0.79 [−1.01, −0.60] | 0.08 [0.05, 0.13] | ||
| 26 | 1.66 [1.32, 2.05] | 0.00 [0.00, 0.00] | 1.16 [0.99, 1.33] | 0.00 [0.00, 0.00] | 0.03 [0.01, 0.07] | ||
| 27 | 2.19 [1.81, 2.66] | 2.66 [1.79, 3.67] | 1.06 [0.91, 1.21] | −0.79 [−1.01, −0.60] | 0.03 [0.01, 0.06] | ||
Disclaimer/Publisher’s Note: The statements, opinions and data contained in all publications are solely those of the individual author(s) and contributor(s) and not of MDPI and/or the editor(s). MDPI and/or the editor(s) disclaim responsibility for any injury to people or property resulting from any ideas, methods, instructions or products referred to in the content. |
© 2024 by the authors. Licensee MDPI, Basel, Switzerland. This article is an open access article distributed under the terms and conditions of the Creative Commons Attribution (CC BY) license (https://creativecommons.org/licenses/by/4.0/).
Share and Cite
Ramírez, E.S.; Jiménez, M.; Franco, V.R.; Alvarado, J.M. Delving into the Complexity of Analogical Reasoning: A Detailed Exploration with the Generalized Multicomponent Latent Trait Model for Diagnosis. J. Intell. 2024, 12, 67. https://doi.org/10.3390/jintelligence12070067
Ramírez ES, Jiménez M, Franco VR, Alvarado JM. Delving into the Complexity of Analogical Reasoning: A Detailed Exploration with the Generalized Multicomponent Latent Trait Model for Diagnosis. Journal of Intelligence. 2024; 12(7):67. https://doi.org/10.3390/jintelligence12070067
Chicago/Turabian StyleRamírez, Eduar S., Marcos Jiménez, Víthor Rosa Franco, and Jesús M. Alvarado. 2024. "Delving into the Complexity of Analogical Reasoning: A Detailed Exploration with the Generalized Multicomponent Latent Trait Model for Diagnosis" Journal of Intelligence 12, no. 7: 67. https://doi.org/10.3390/jintelligence12070067
APA StyleRamírez, E. S., Jiménez, M., Franco, V. R., & Alvarado, J. M. (2024). Delving into the Complexity of Analogical Reasoning: A Detailed Exploration with the Generalized Multicomponent Latent Trait Model for Diagnosis. Journal of Intelligence, 12(7), 67. https://doi.org/10.3390/jintelligence12070067