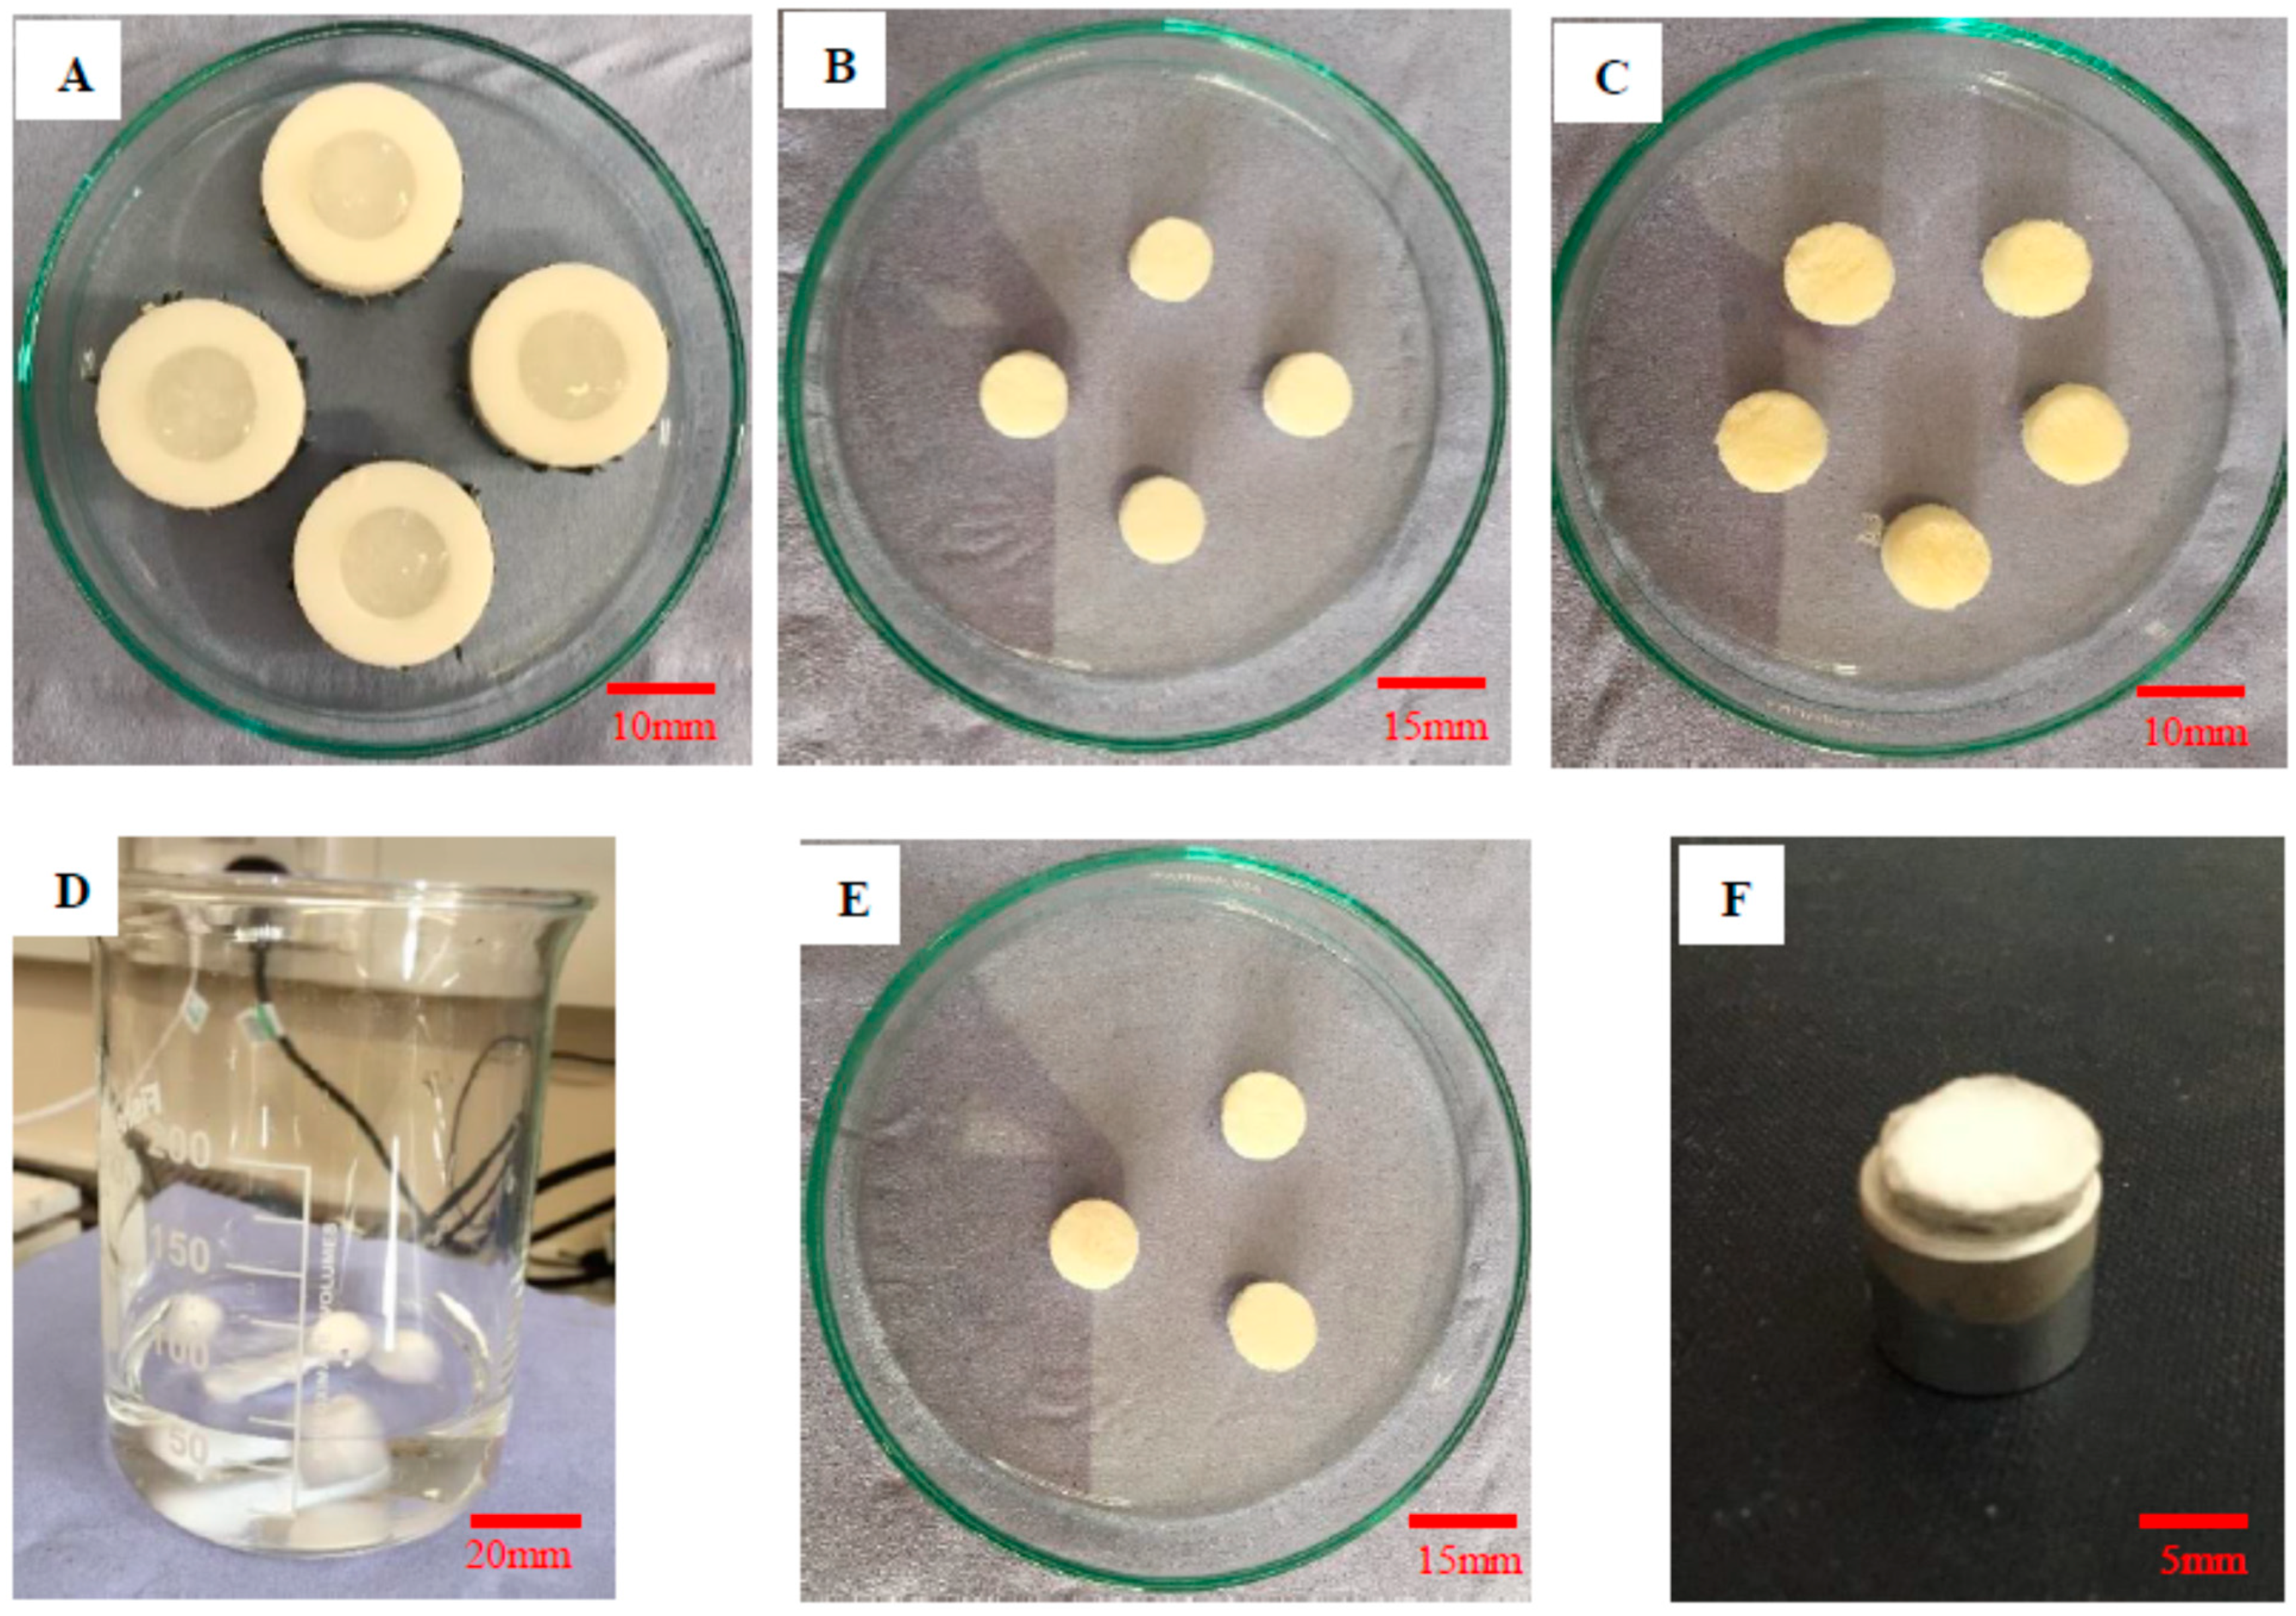
Figure 1.
(A) Collagen suspension in PTFE molds, (B) freeze-dried collagen scaffolds, (C) freeze-dried HA scaffolds, (D) Collagen scaffolds in crosslinking HA solution, (E) freeze-dried collagen/HA hybrid scaffolds, and (F) platinum-coated collagen/HA scaffold sample for SEM.
Figure 1.
(A) Collagen suspension in PTFE molds, (B) freeze-dried collagen scaffolds, (C) freeze-dried HA scaffolds, (D) Collagen scaffolds in crosslinking HA solution, (E) freeze-dried collagen/HA hybrid scaffolds, and (F) platinum-coated collagen/HA scaffold sample for SEM.
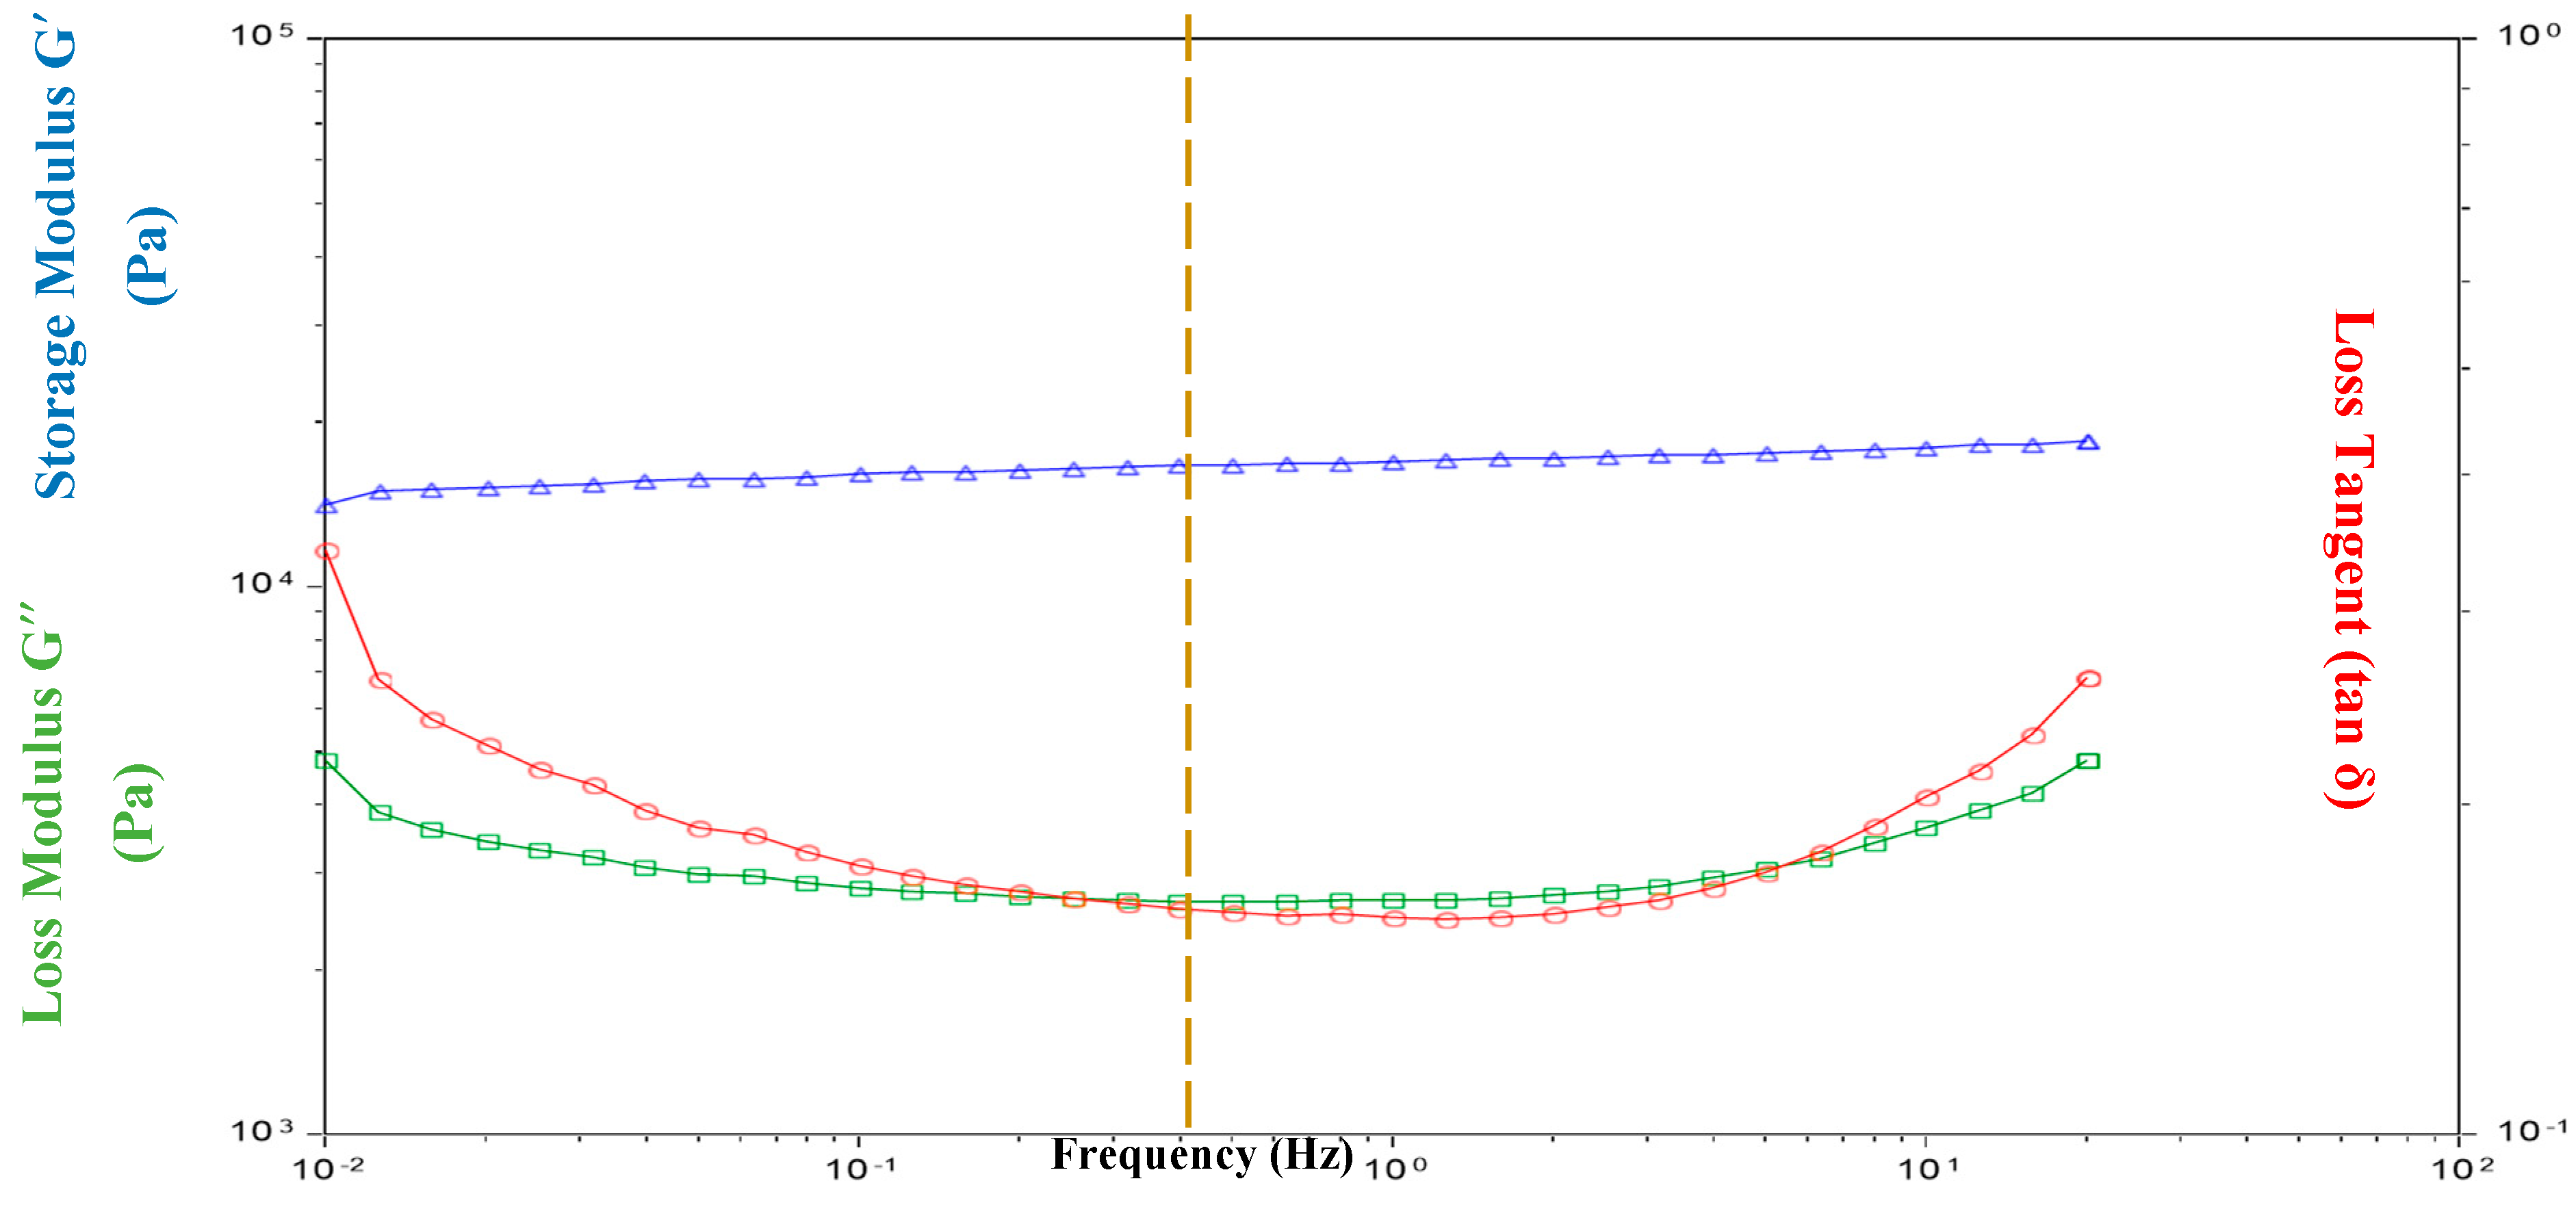
Figure 2.
Variation of storage modulus G′ (Pa), loss modulus G″ (Pa) and loss tangent (tan δ) of the collagen network in the dry state at 37 °C. G′ > G″ suggests that collagen scaffold behaves as elastic solid. The dashed line indicates the reference point for the values of G′, G″ and tan δ as presented in
Table 2 and
Table 3.
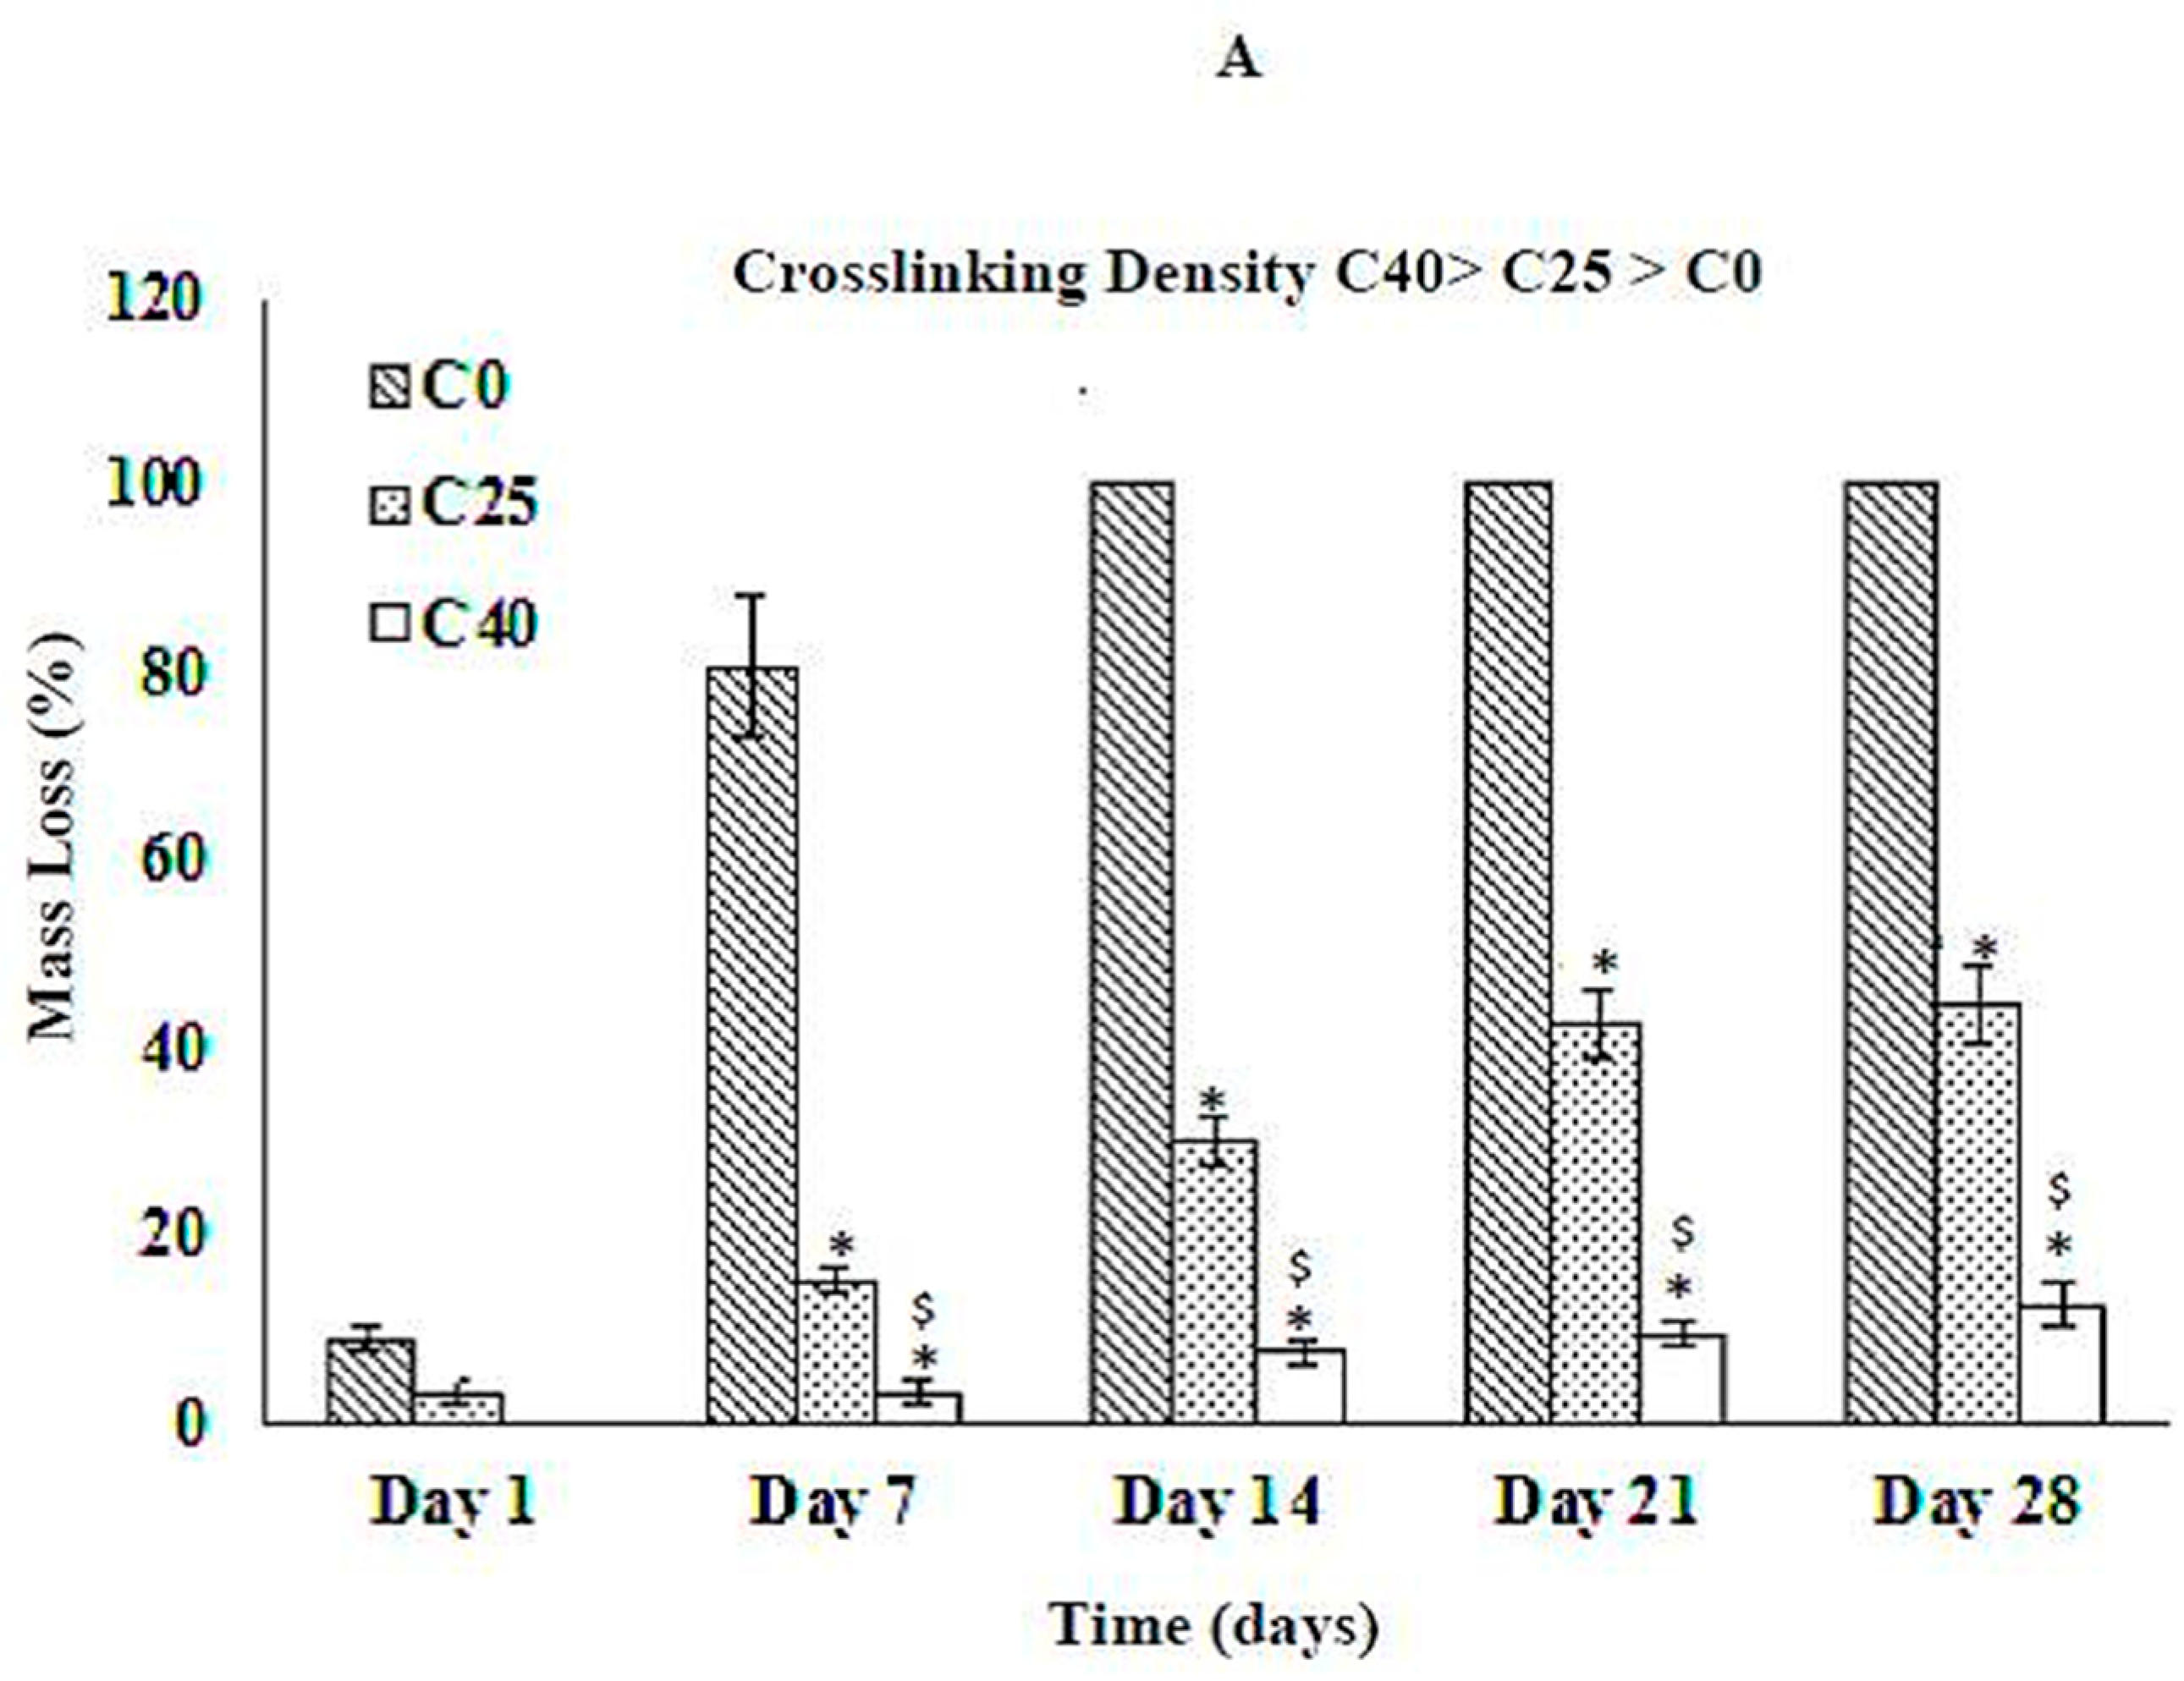
Figure 3.
Effect of crosslinking density on the degradation behavior of collagen scaffolds at (A) pH 4.0, (B) pH 7.4, and (C) pH 10. * and $ represent statistically significant values (p < 0.05) within collagen scaffolds on a given day as compared to C0 and C25, respectively.
Figure 3.
Effect of crosslinking density on the degradation behavior of collagen scaffolds at (A) pH 4.0, (B) pH 7.4, and (C) pH 10. * and $ represent statistically significant values (p < 0.05) within collagen scaffolds on a given day as compared to C0 and C25, respectively.
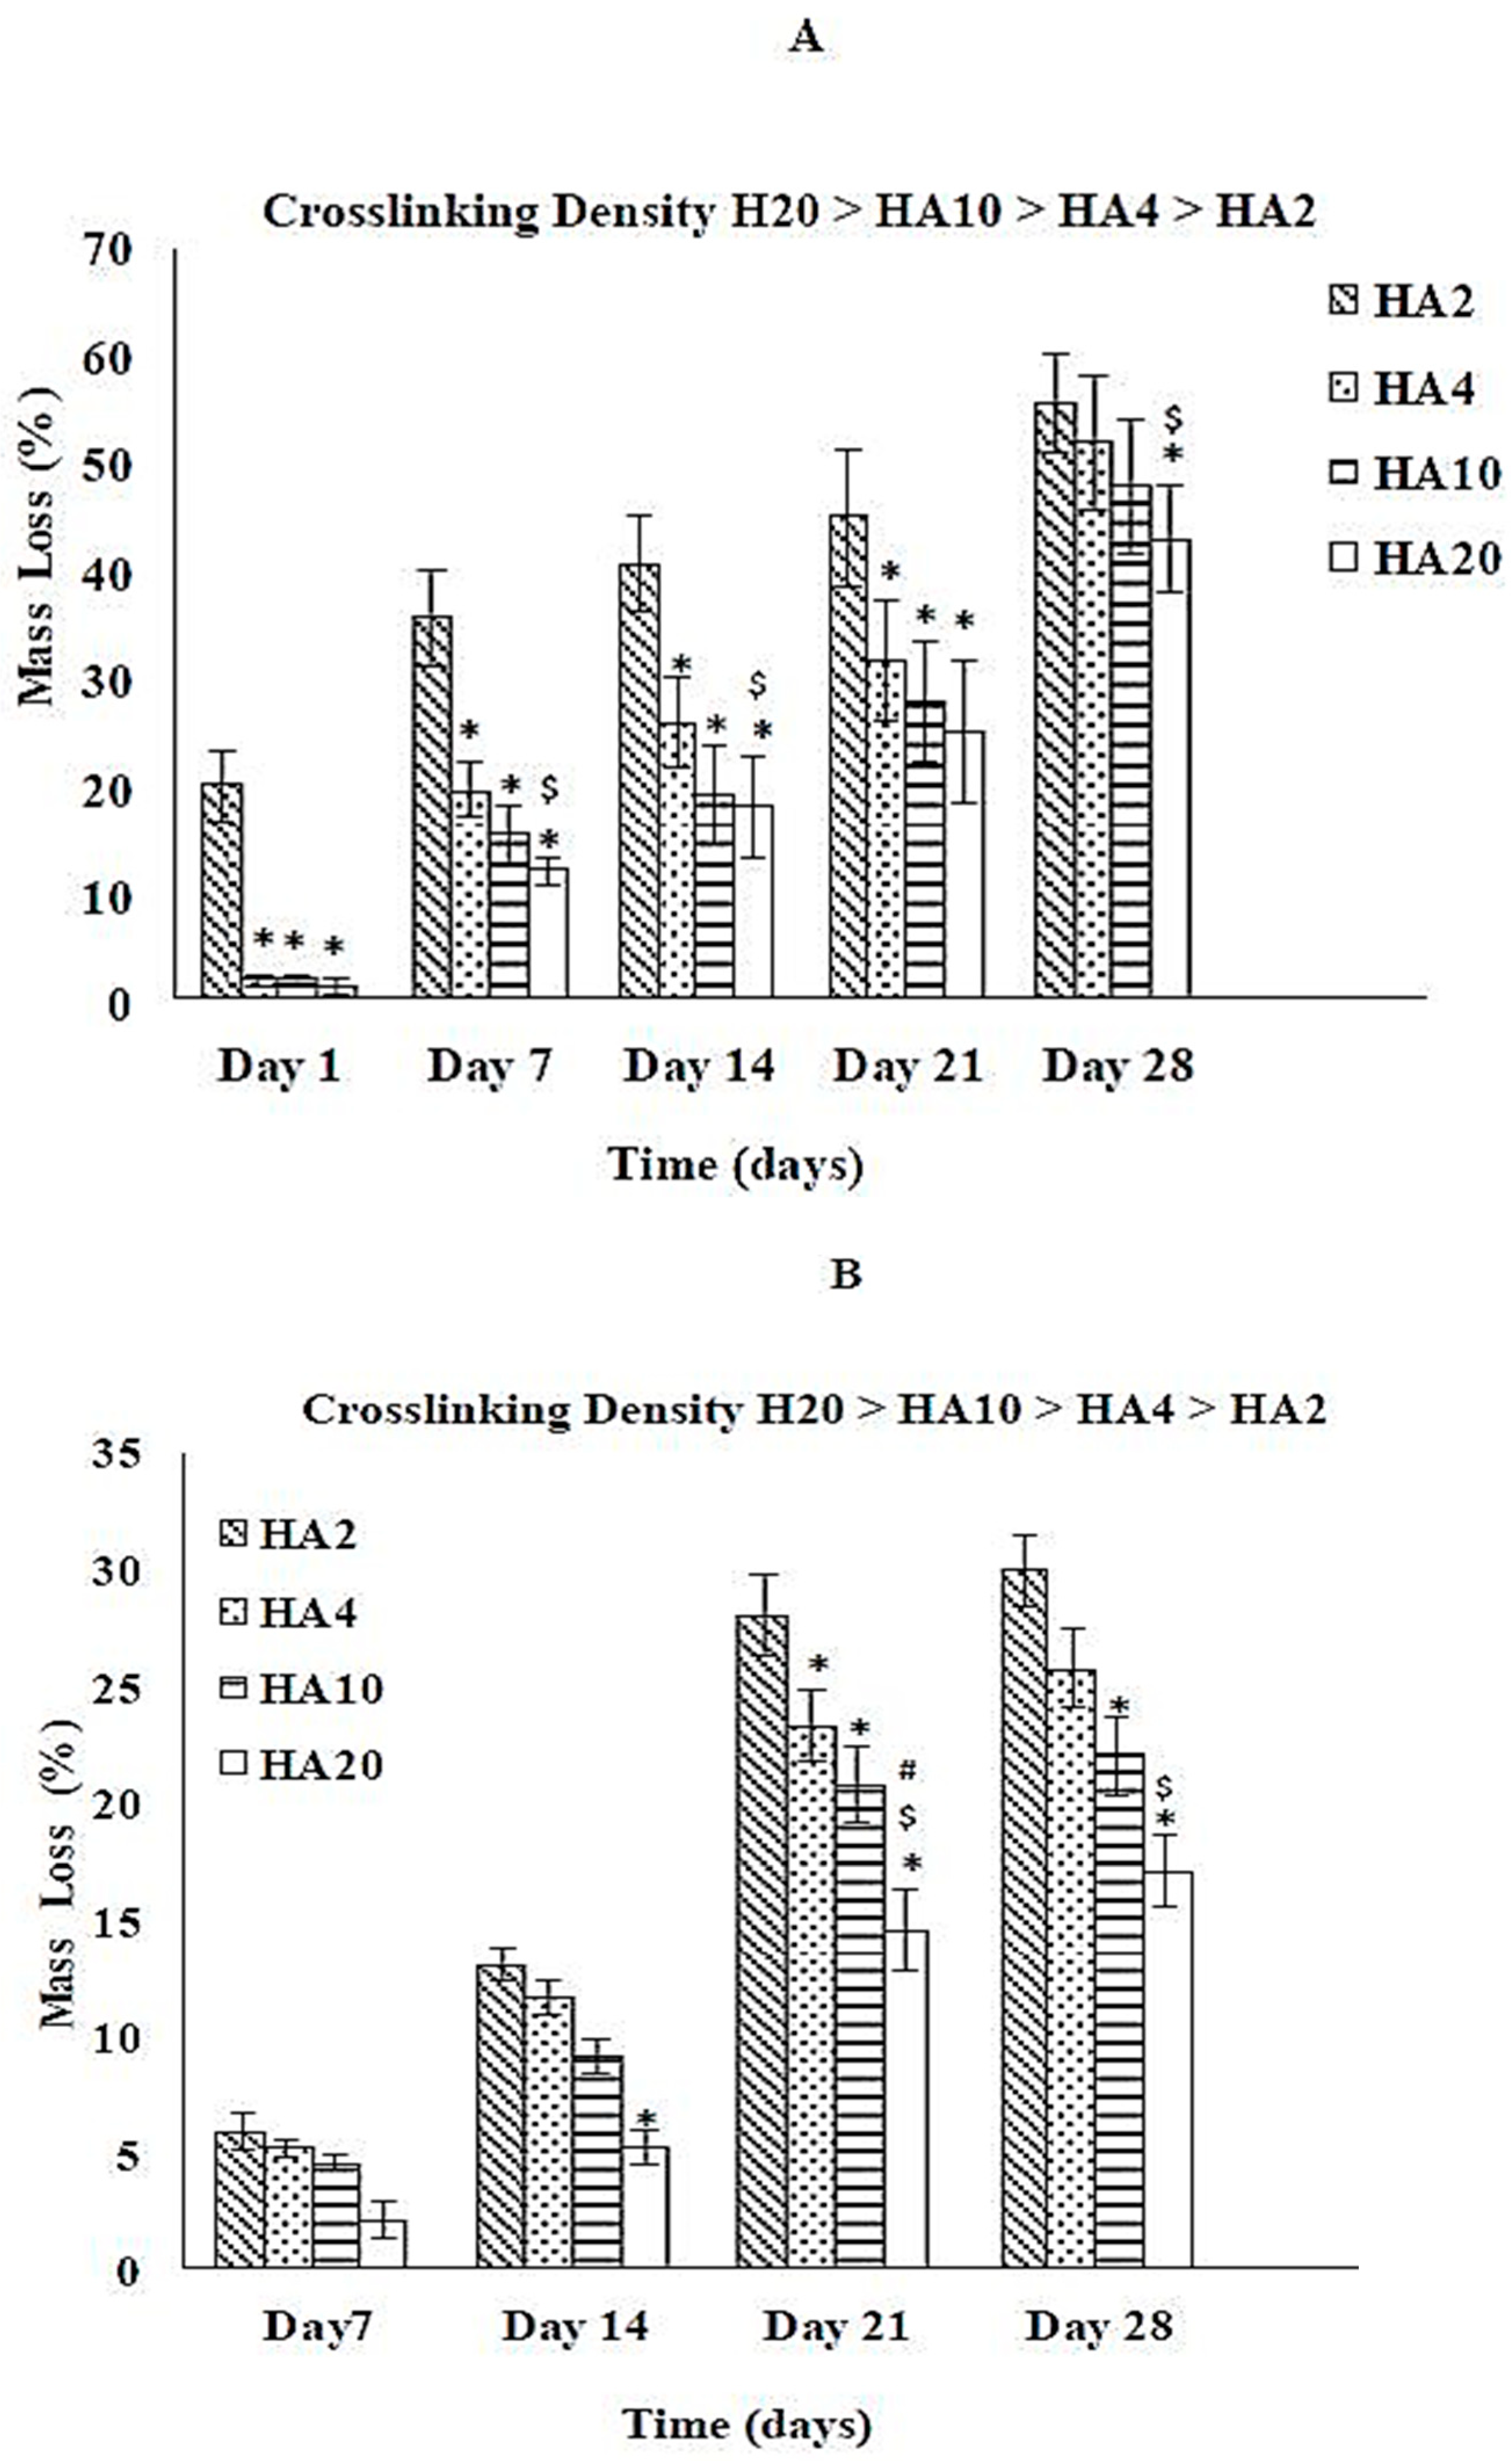
Figure 4.
Effect of crosslinking density on the degradation behavior of HA scaffolds (A) pH 4.0 and (B) pH 7.4. *, $ and # represent statistically significant values (p < 0.05) within HA scaffolds on a given day as compared to HA2, HA4, and HA10, respectively.
Figure 4.
Effect of crosslinking density on the degradation behavior of HA scaffolds (A) pH 4.0 and (B) pH 7.4. *, $ and # represent statistically significant values (p < 0.05) within HA scaffolds on a given day as compared to HA2, HA4, and HA10, respectively.
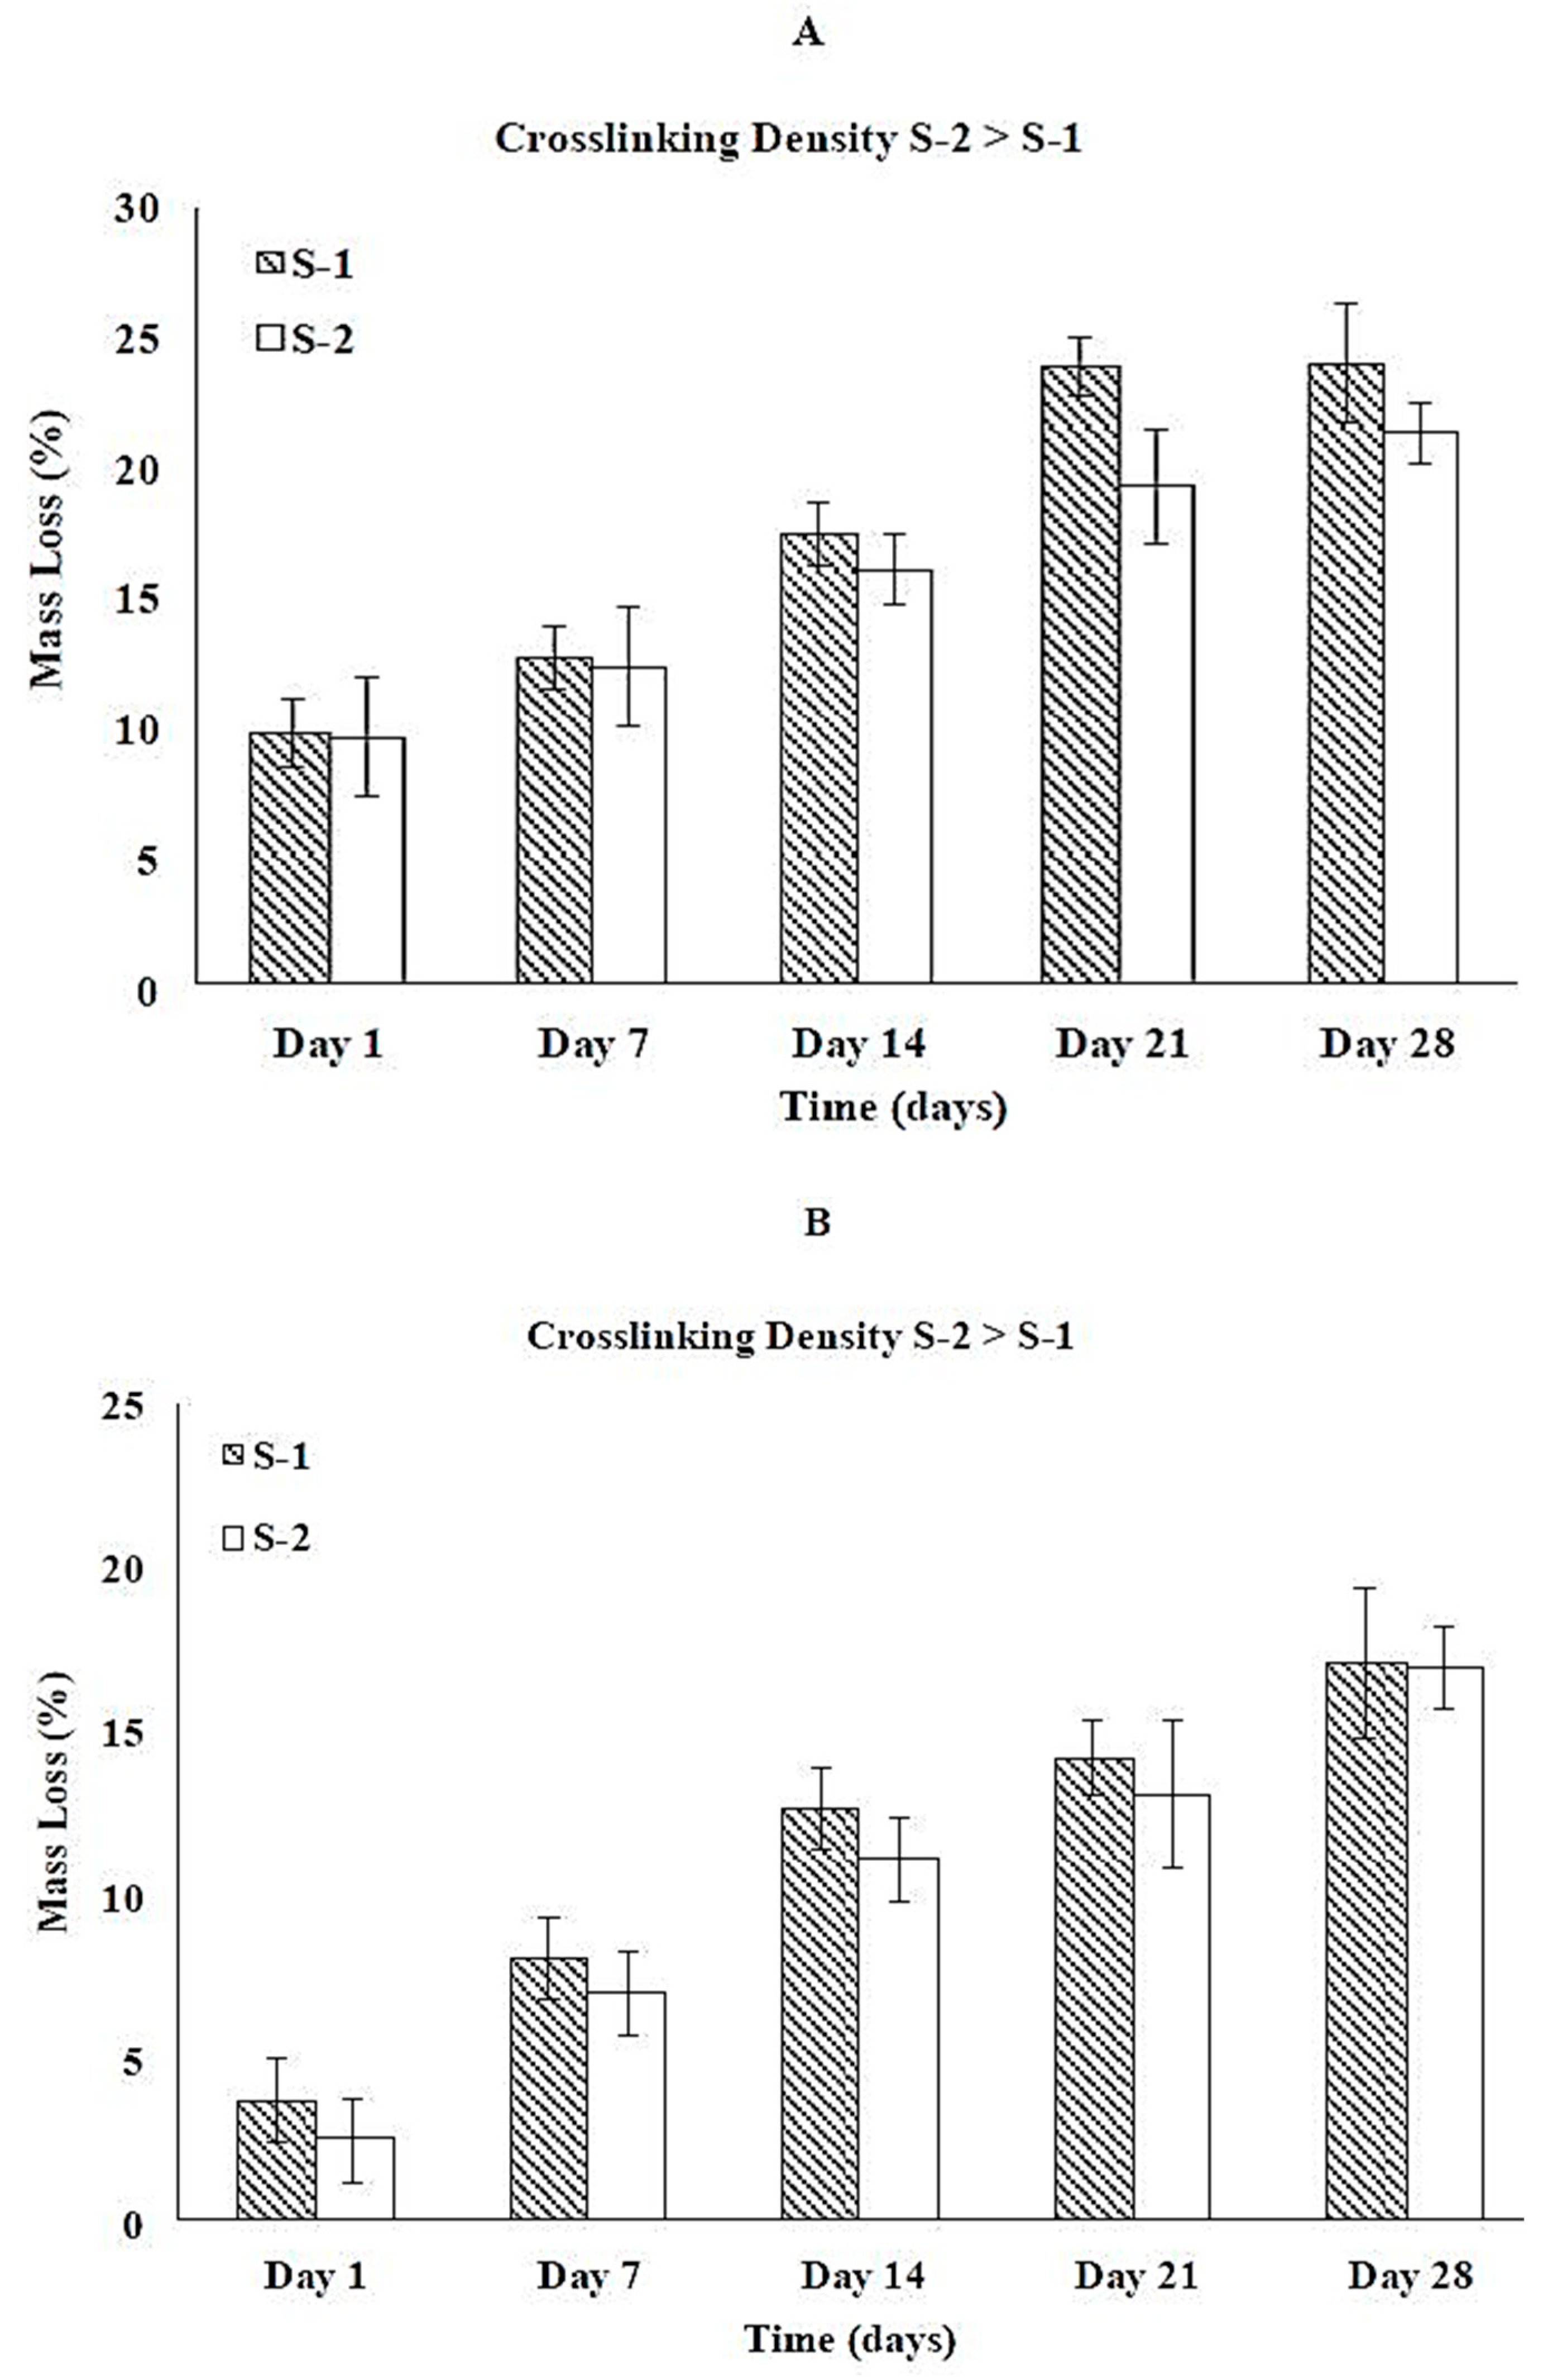
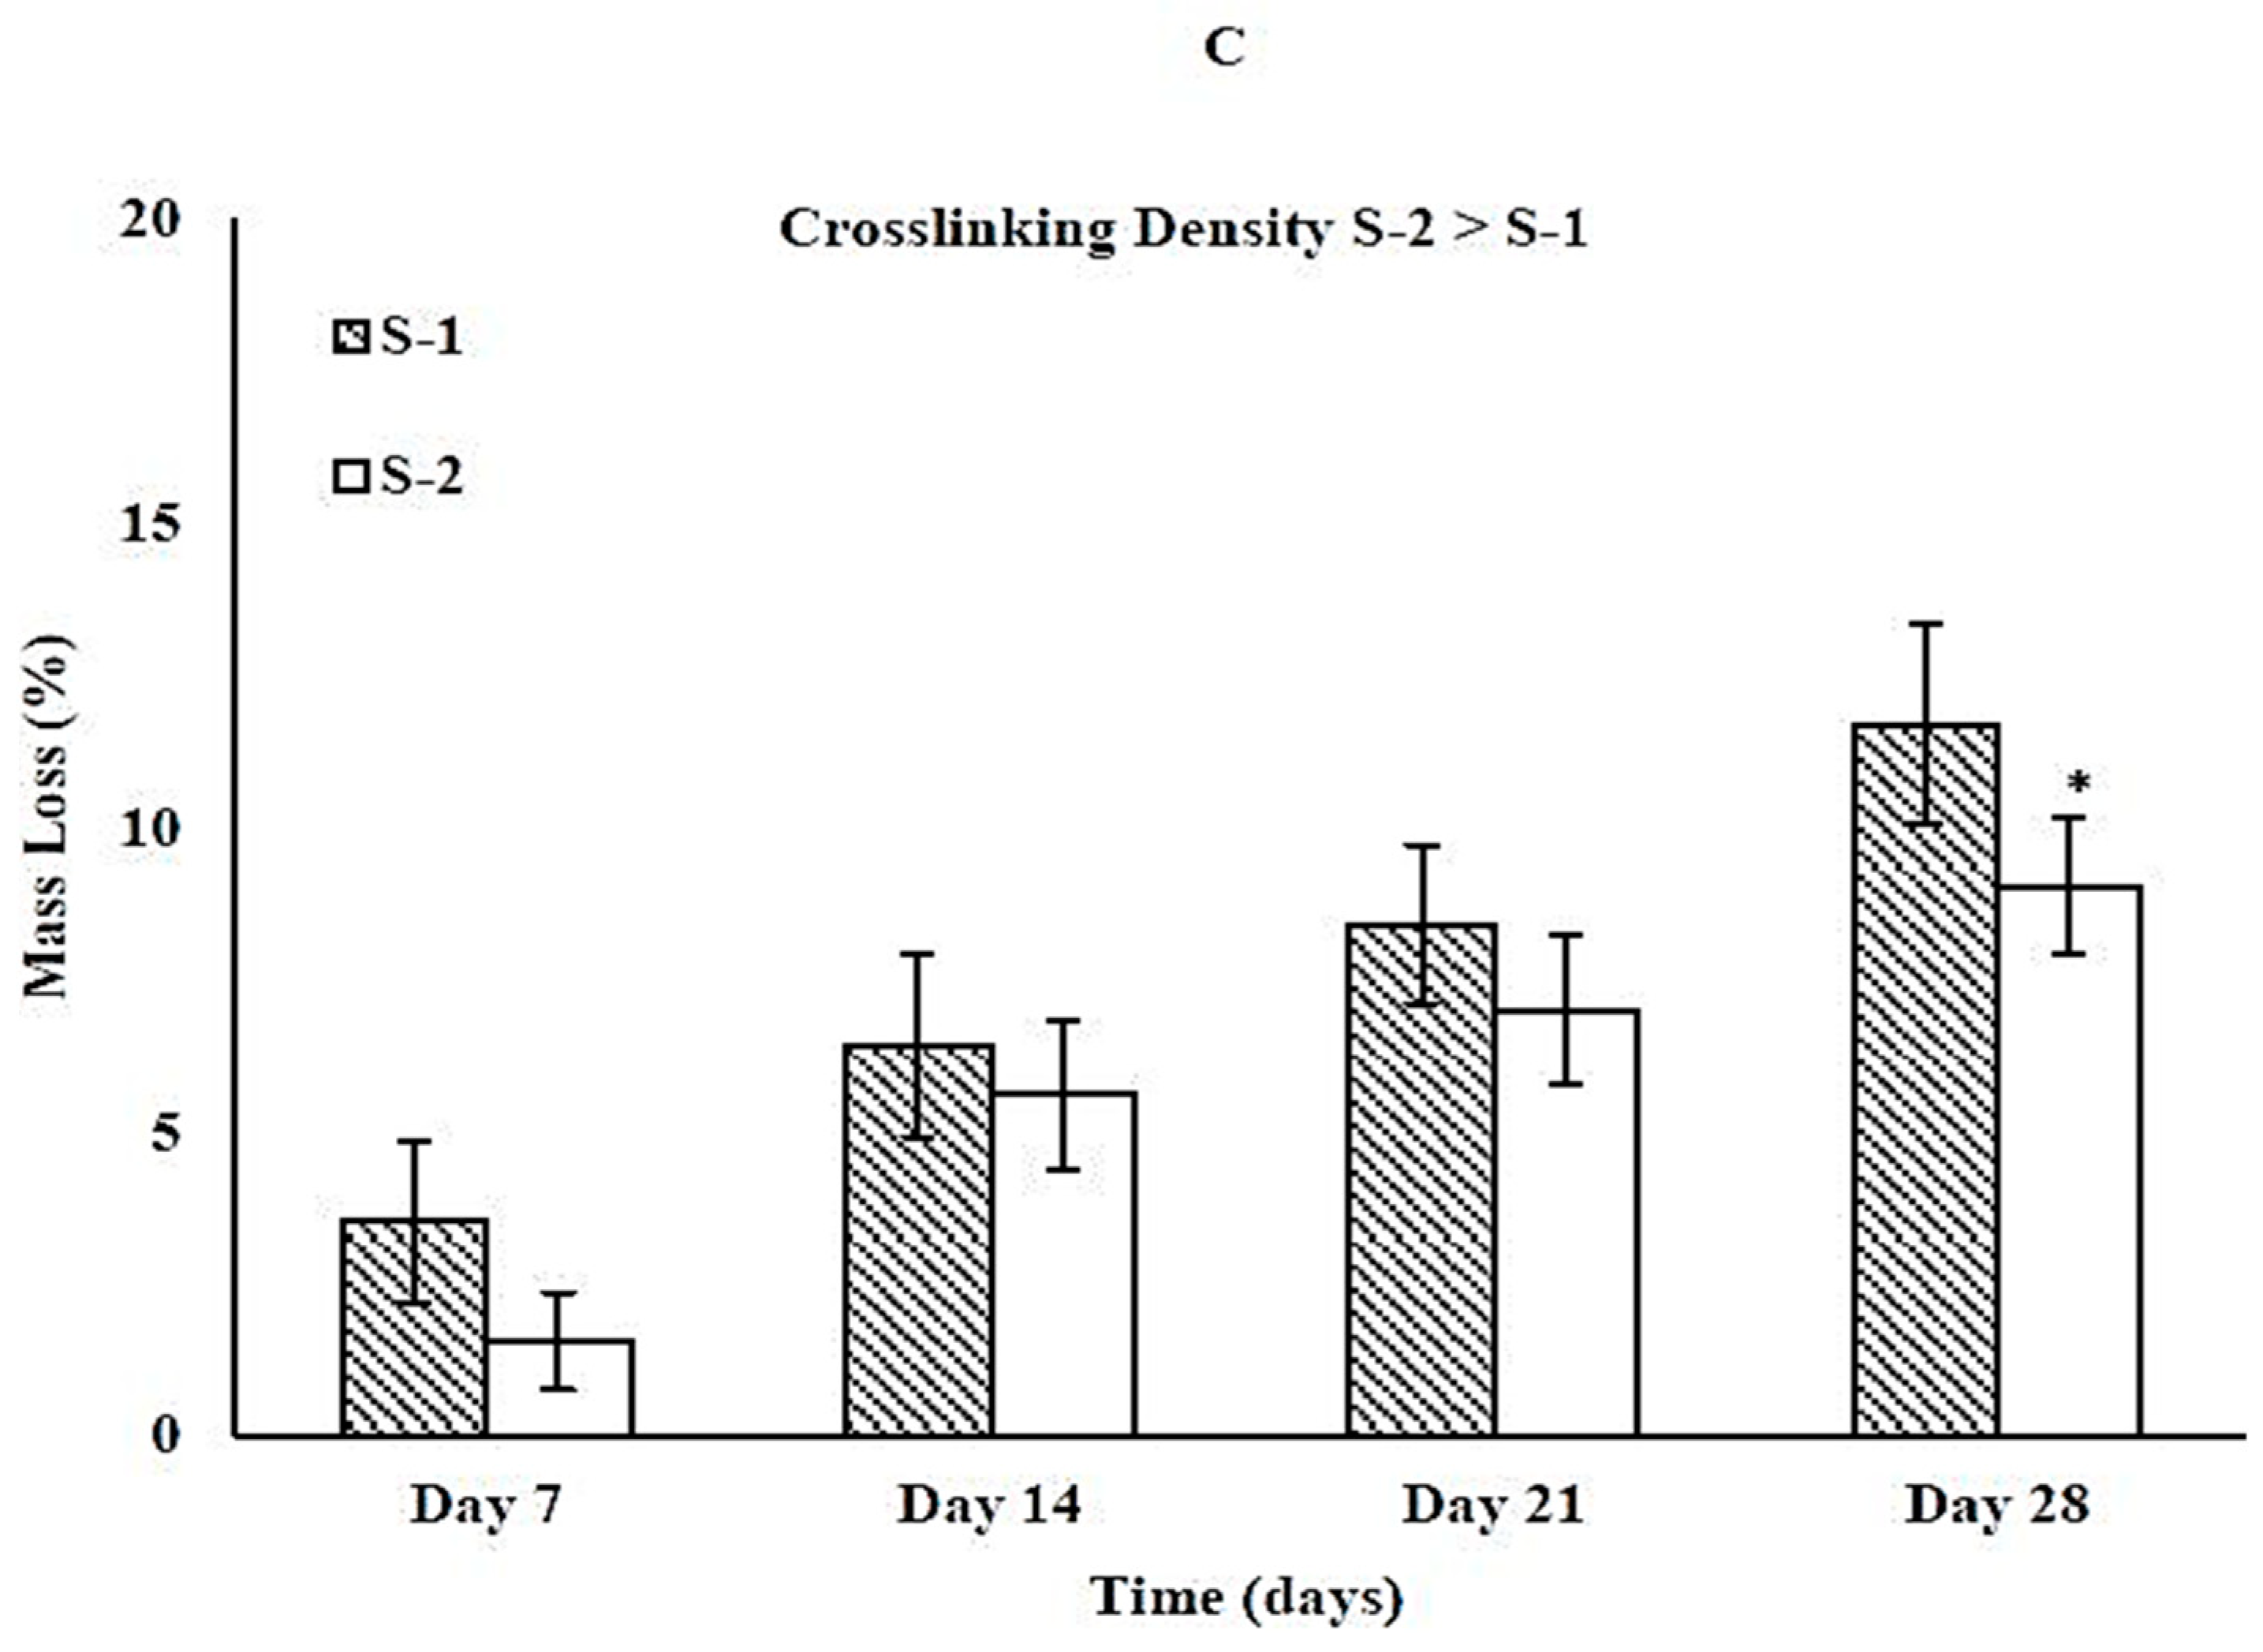
Figure 5.
Effect of crosslinking density on the degradation behavior of collagen/HA hybrid scaffolds at (A) pH 4.0, (B) pH 7.4, and (C) pH 10.0. S-3 and S-4 did not show any mass loss. * represent statistically significant values (p < 0.05) within collagen/HA hybrid scaffolds on a given day as compared to S-1.
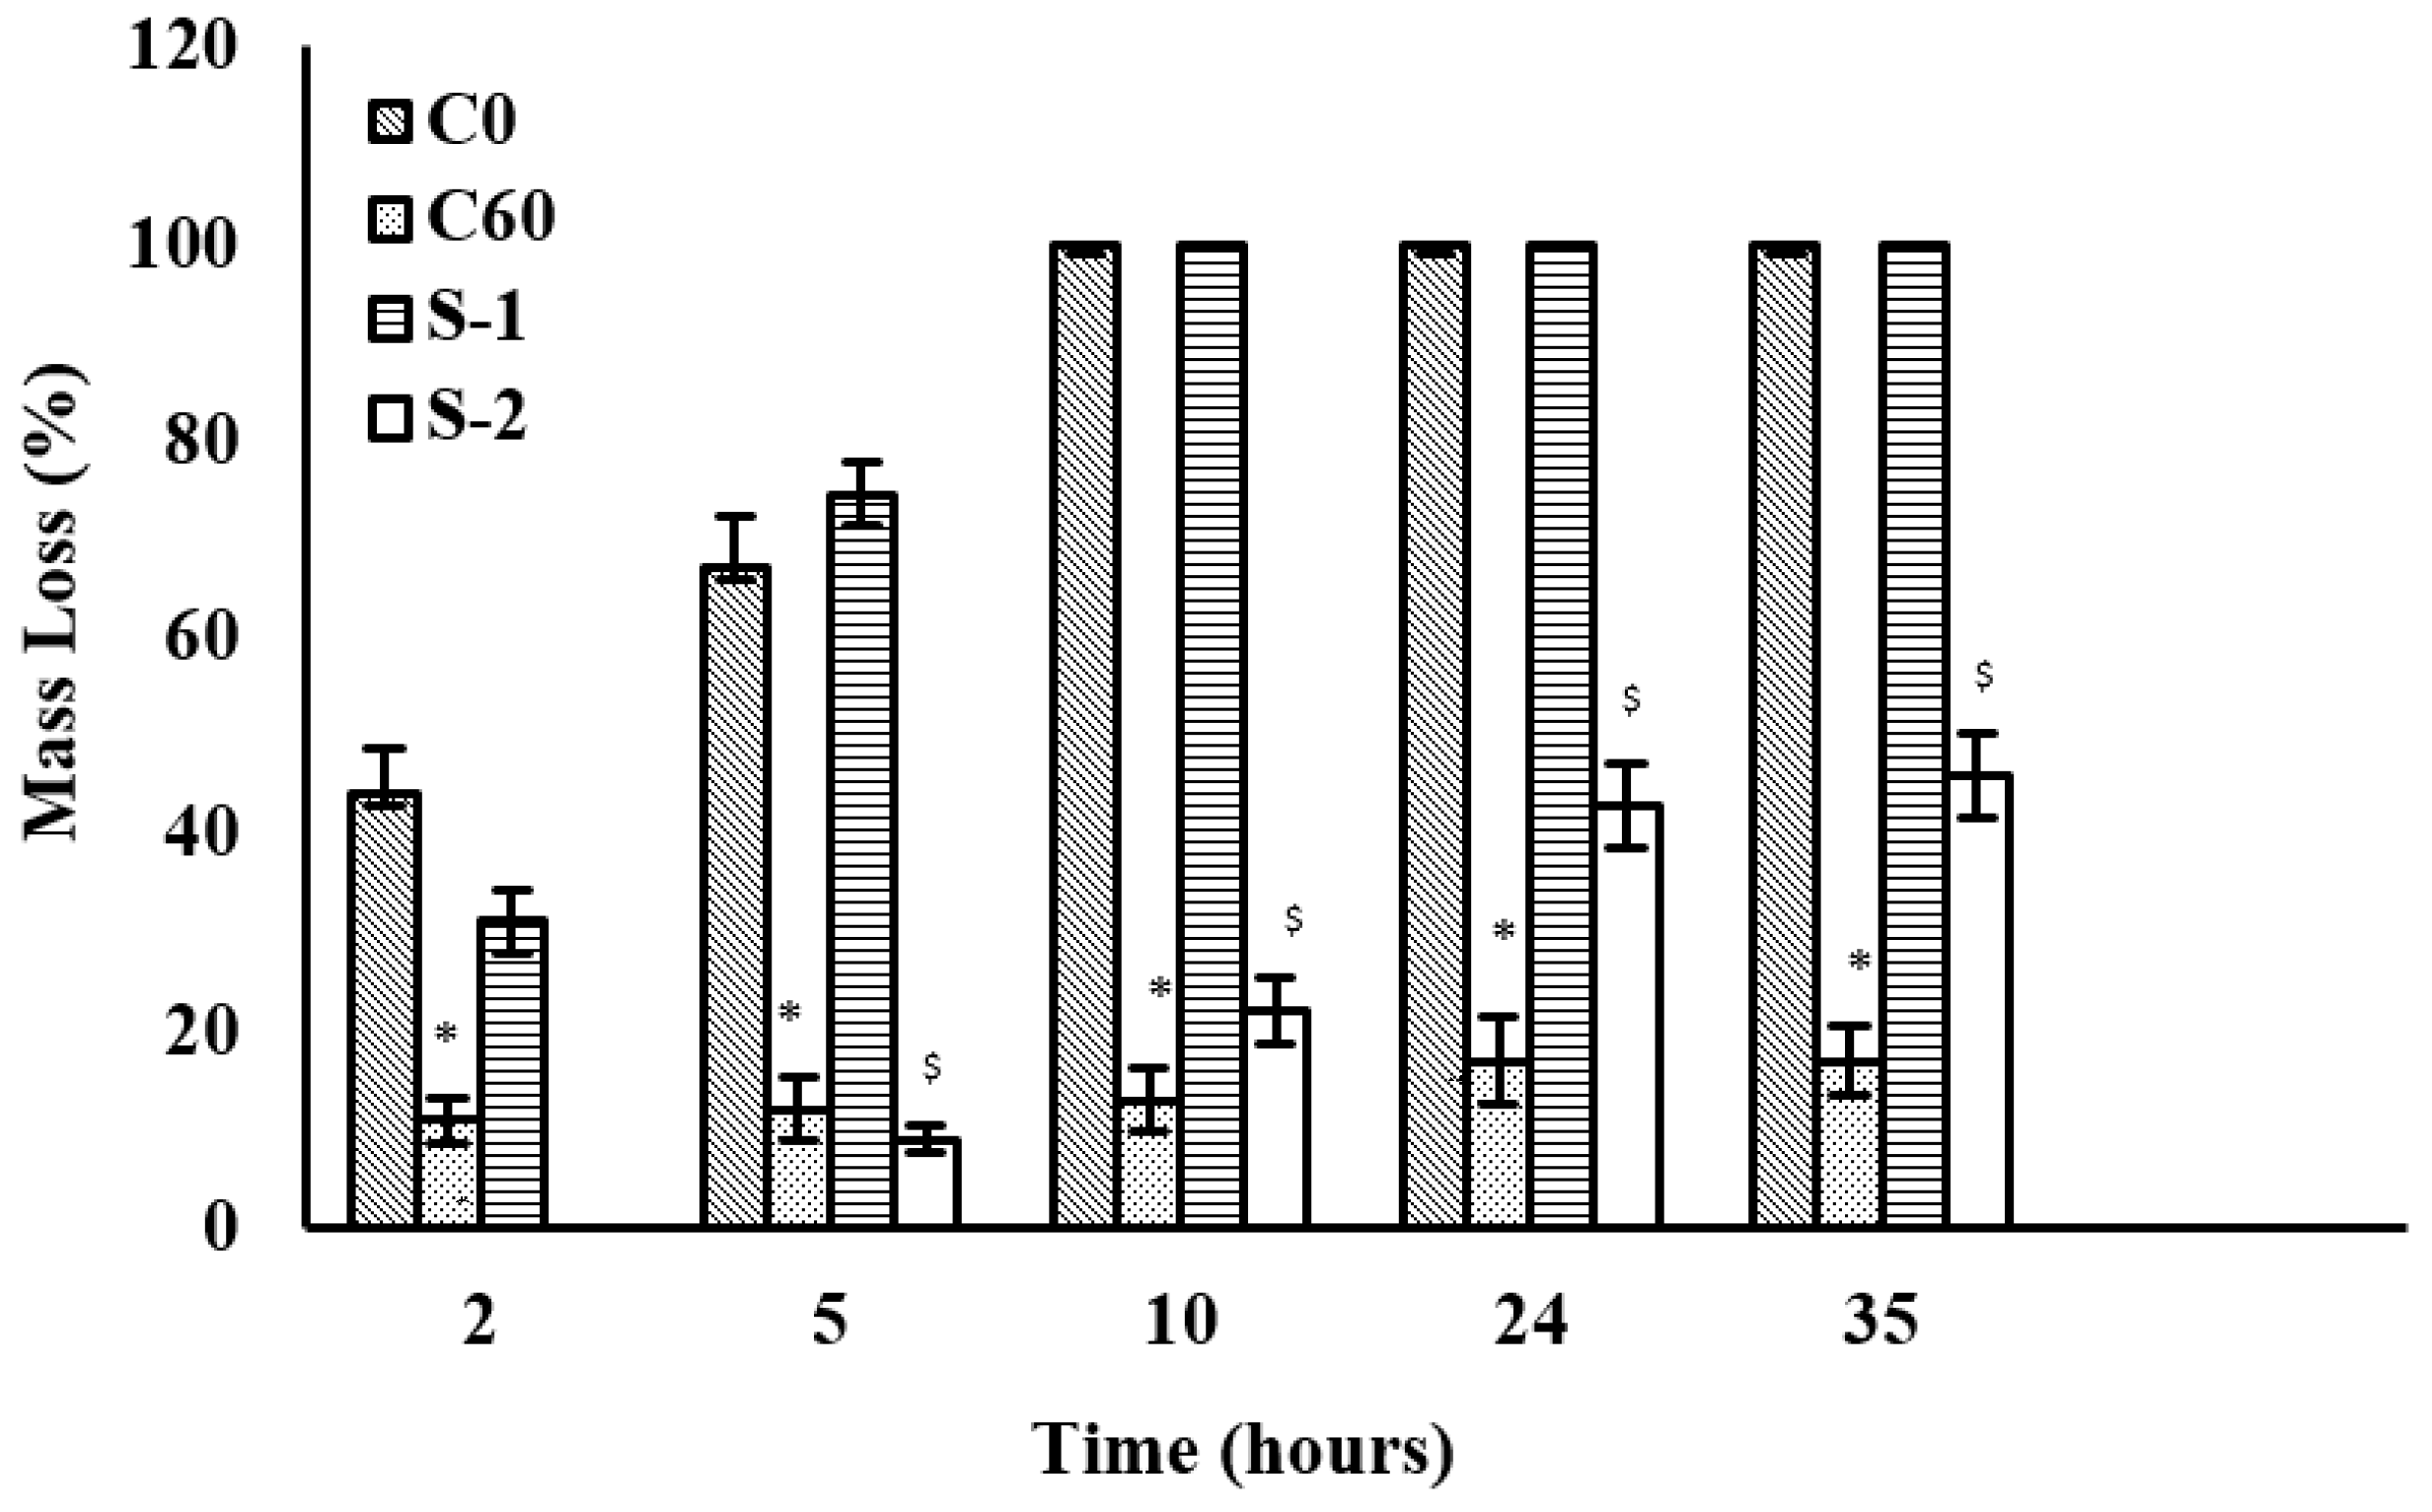
Figure 6.
Degradation behavior of collagen/HA-based hybrid scaffolds in the presence of collagenase (10 U/mL, PBS pH 7.4, 35 h). Collagen networks (C0 and C60) were degraded by respective enzymes as controls. * and $ represent the statistically significant values (p < 0.05) as compared to C0 and S-1, respectively within controls and hybrid scaffolds.
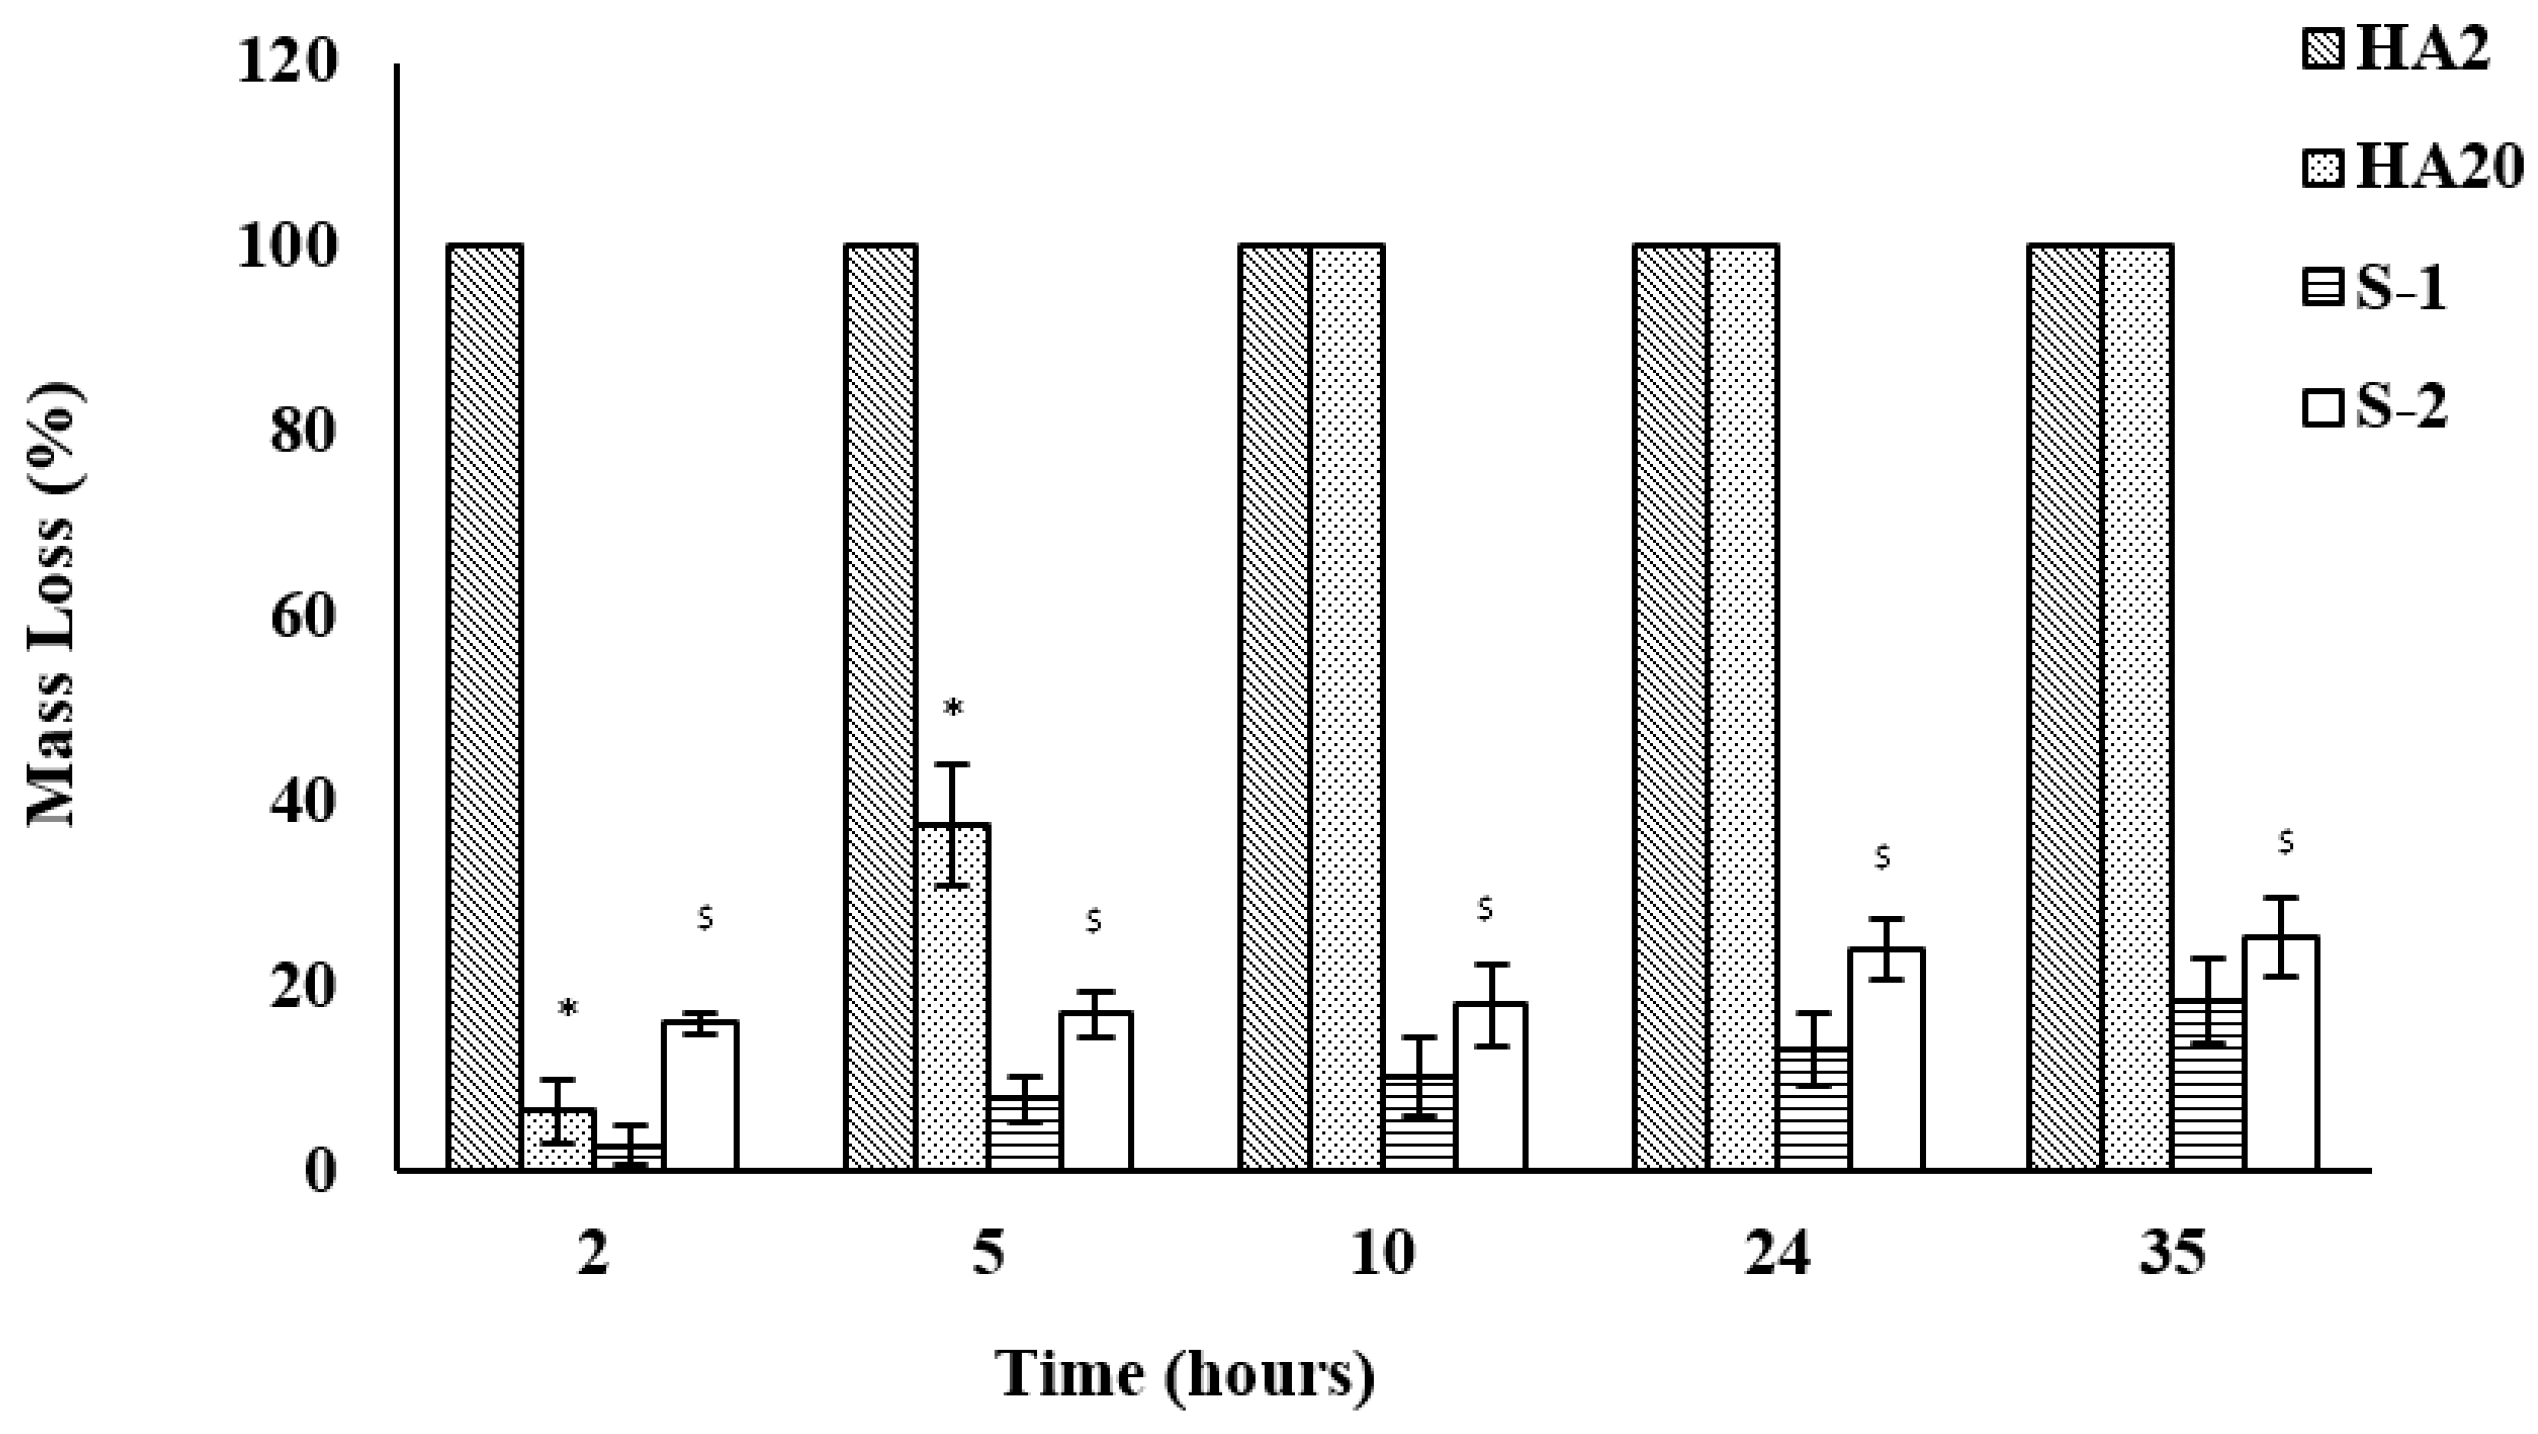
Figure 7.
Degradation behavior of collagen/HA hybrid scaffolds in the presence of hyaluronidase (10 U/mL, PBS pH 7.4, 35 h). HA networks (HA2 and HA20) were degraded by respective enzymes as controls. * and $ represent the statistically significant values (p < 0.05) as compared to HA2 and S-1, respectively within controls and hybrid scaffolds.
Figure 8.
Degradation behavior of collagen/HA hybrid scaffolds in the presence of collagenase and hyaluronidase (10 U/mL of each, PBS, pH 7.4) at 37 °C for 35 h. $ represents the statistically significant values (p < 0.05) as compared to S-1. S-3 and S-4 did not show any mass loss under given conditions.
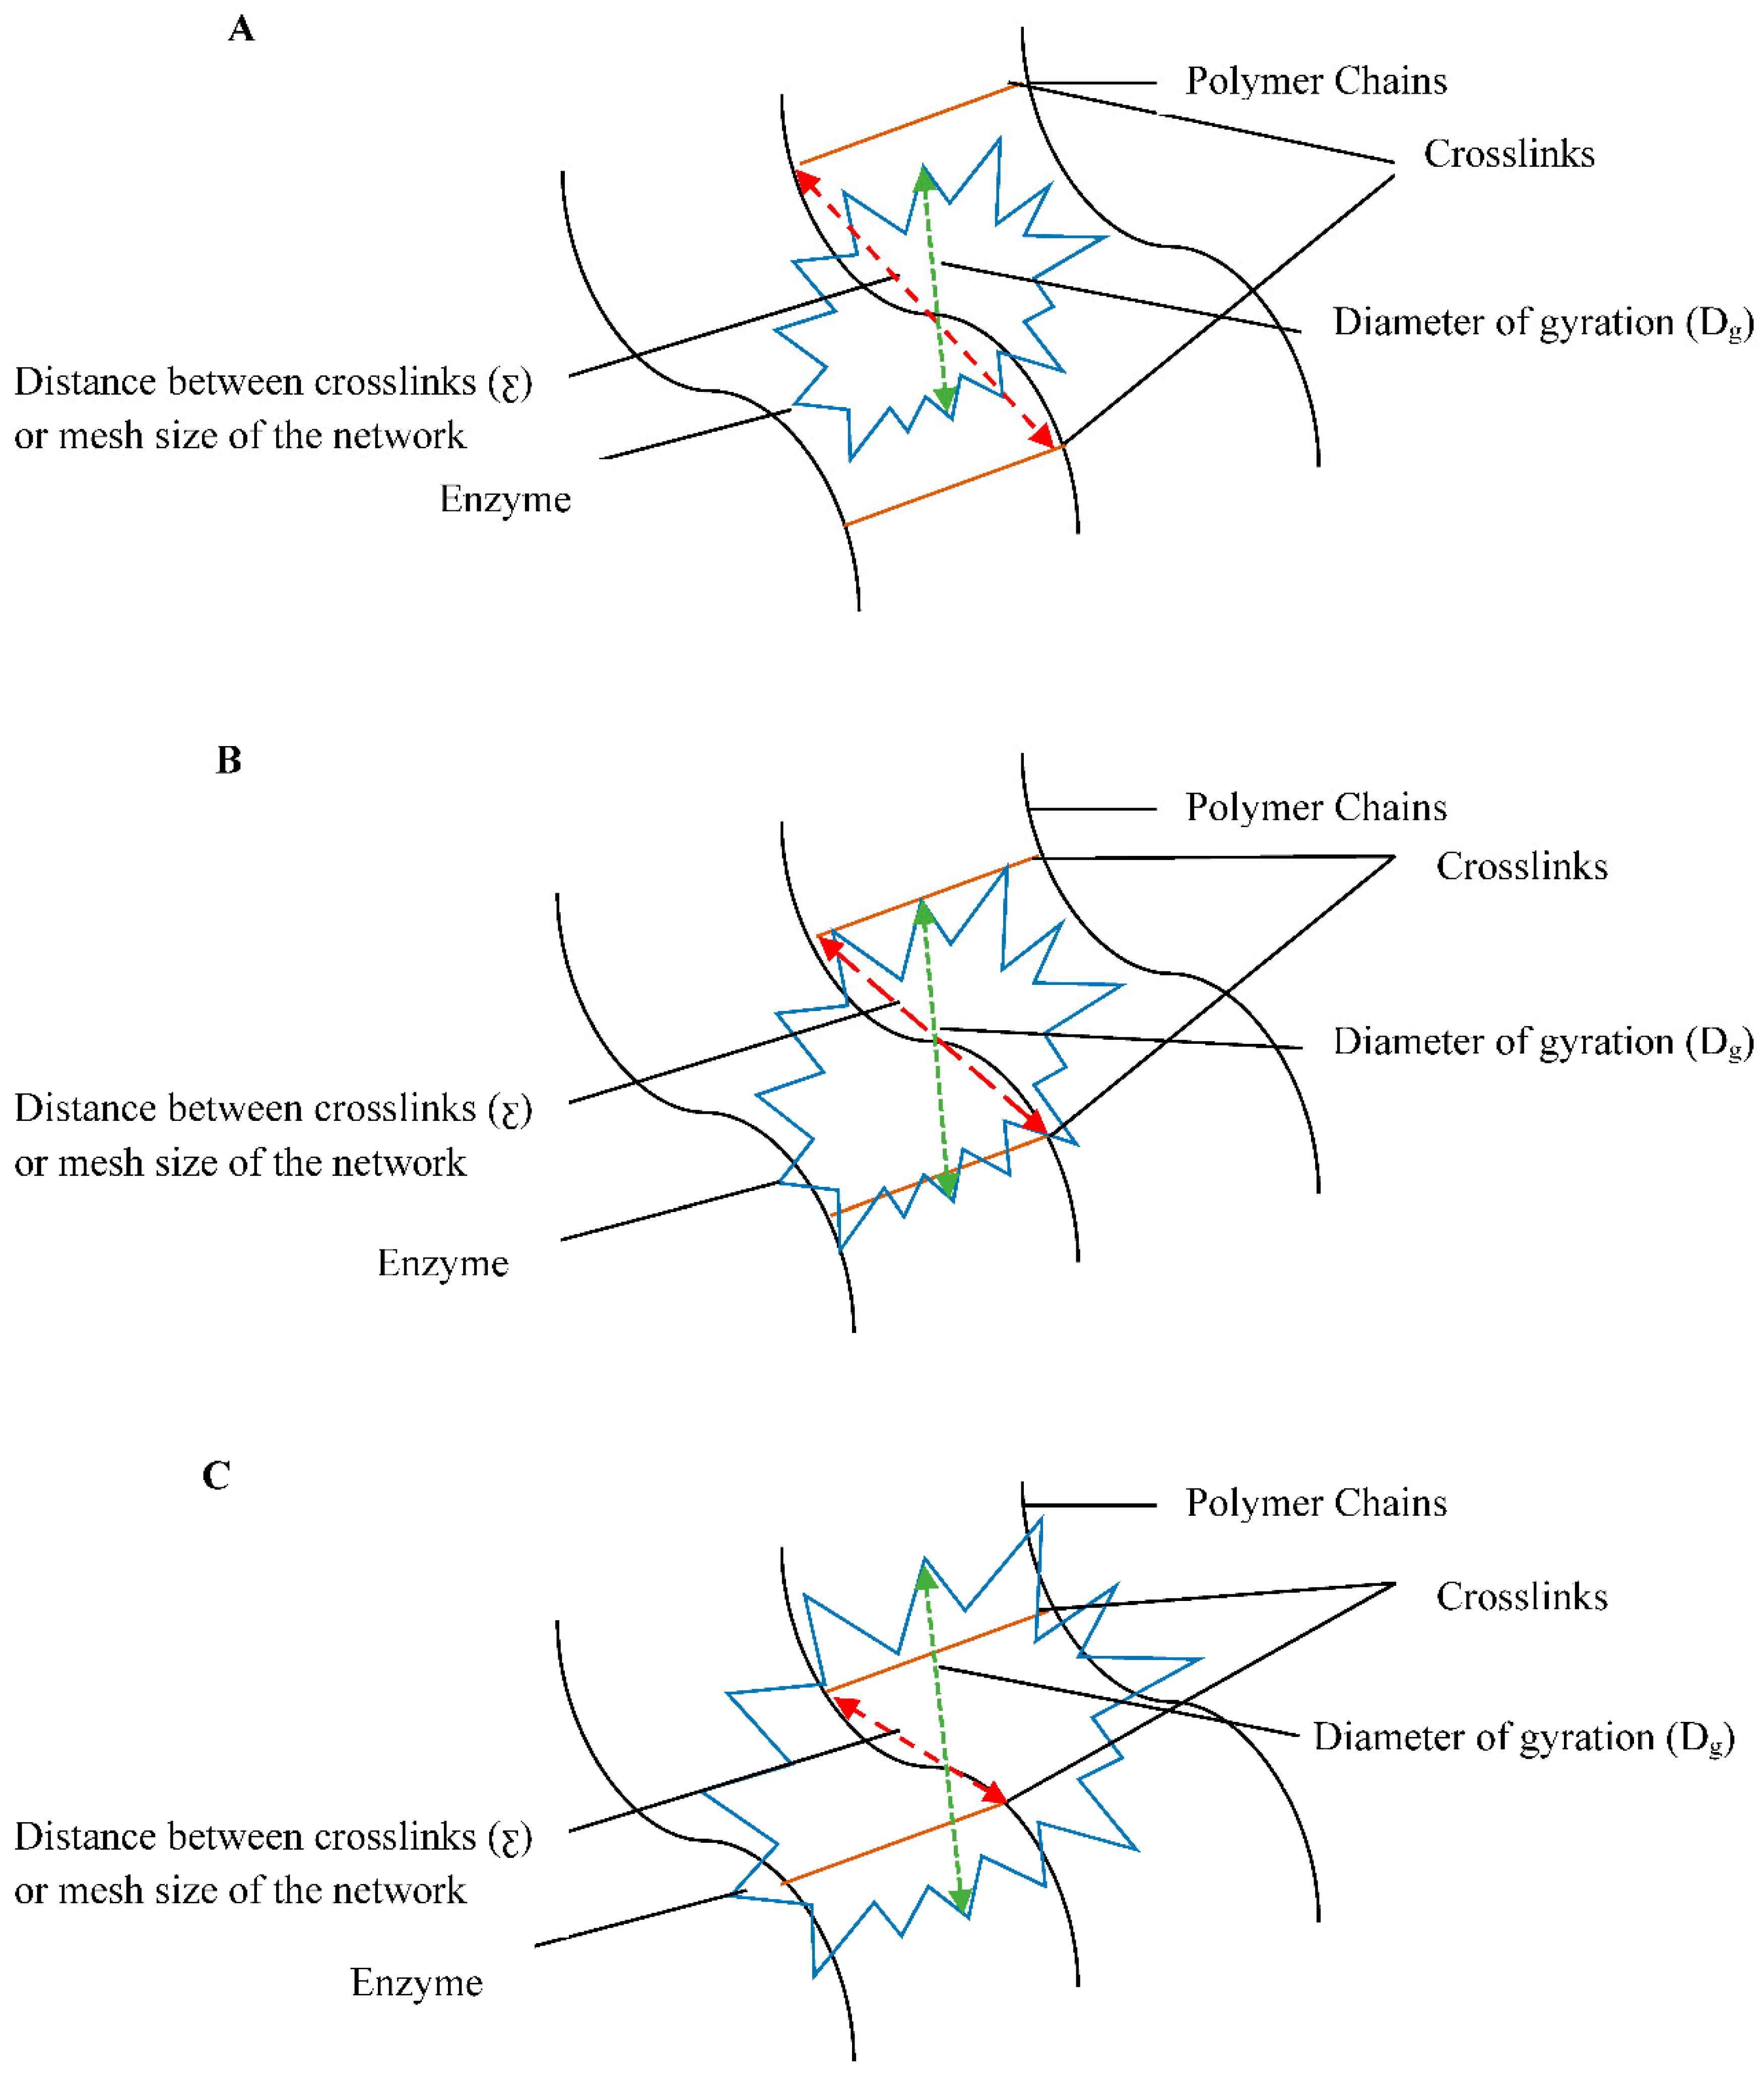
Figure 9.
Schematic diagram for enzyme-assisted degradation of the crosslinked network (A) ƹ > Dg, the degradation rate is high (B) ƹ ~ Dg, the degradation rate is suppressed (C) ƹ < Dg, degradation is stopped.
Figure 9.
Schematic diagram for enzyme-assisted degradation of the crosslinked network (A) ƹ > Dg, the degradation rate is high (B) ƹ ~ Dg, the degradation rate is suppressed (C) ƹ < Dg, degradation is stopped.
Table 1.
Nomenclature of parent collagen type I and HA scaffolds.
Table 1.
Nomenclature of parent collagen type I and HA scaffolds.
| Sample ID | Conc. of EDC (mM) | Conc. of NHS (mM) |
|---|
| C0 | 0 | 0 |
| C25 | 25 | 12.5 |
| C40 | 40 | 20 |
| C60 | 60 | 30 |
| HA2 | 2 | 0 |
| HA4 | 4 | 0 |
| HA10 | 10 | 0 |
| HA20 | 20 | 0 |
Table 2.
Nomenclature and composition details of collagen/HA hybrid scaffolds.
Table 2.
Nomenclature and composition details of collagen/HA hybrid scaffolds.
| Sample ID | Primary Collagen Network | Secondary HA Network |
|---|
| S-1 | C0 | HA2 |
| S-2 | C0 | HA20 |
| S-3 | C60 | HA2 |
| S-4 | C60 | HA20 |
Table 3.
Crosslinking densities of collagen network, HA network, and hybrid scaffolds. a,b represents statistically significant values within collagen networks as compared to C0 and C25, respectively. c,d,e represent statistically significant values within HA networks as compared to HA2, HA4, and HA10, respectively. f,g,h represent statistically significant values within hybrid scaffolds as compared to S-1, S-2, and S-3, respectively.
| Sample ID | Average Molecular Weight between the Two Crosslinks (Mc, ×102 kg/mol) | Effective Crosslinking Density (ve, kmol/m3) | Distance between Crosslinks Points (ƹ, nm) |
|---|
| C0 | 32 ± 2.5 | 0.4 ± 0.03 | 37 ± 1 |
| C25 | 10 ± 1 a | 1.3 ± 0.2 | 19 ± 1a |
| C40 | 6.7 ± 2.5 a | 2 ± 1 a | 15 ± 3 a |
| C60 | 4.1 ± 0.5 a,b | 3.3 ± 0.4 a,b | 11 ± 1 a,b |
| HA2 | 6.4 ± 0.9 | 2 ± 0.3 | 9.7 ± 1 |
| HA4 | 5.2 ± 0.2 | 2.5 ± 0.1 | 8.3 ± 0.2 |
| HA10 | 3.3 ± 0.6 c | 4.3 ± 0.1 | 6.0 ± 0.6 c,d |
| HA20 | 0.8 ± 0.2 c,d,e | 17 ± 4 c,d,e | 2.4 ± 0.3 c,d,e |
| S-1 | 16 ± 2.1 | 0.8 ± 0.1 | 13 ± 1 |
| S-2 | 14 ± 2.4 | 0.9 ± 0.1 | 10 ± 1 f |
| S-3 | 7 ± 0.2 f,g | 5.0 ± 0.6 f,g | 8.2 ± 0.1 f |
| S-4 | 5 ± 0.1 f,g | 6.8 ± 0.7 f,g,h | 7.3 ± 0.1f,g |
Table 4.
Compressive modulus (Ecomp, kPa) of collagen networks and hybrid scaffolds. a,b represent statistically significant values (p < 0.05) within collagen networks as compared to C0 and C25, respectively. c,d,e represent statistically significant values within hybrid scaffolds as compared to S-1, S-2, and S-3, respectively.
| Sample ID | Effective Crosslinking Density (ve, kmol/m3) [23] | Compression Modulus (Ecomp, kPa) |
|---|
| C0 | 0.4 ± 0.03 | 35 ± 5 |
| C25 | 1.3 ± 0.2 | 56 ± 6 a |
| C40 | 2 ± 1 a | 63 ± 5 a |
| C60 | 3.3 ± 0.4 a,b | 68 ± 7 a,b |
| S-1 | 0.8 ± 0.1 | 41 ± 4 |
| S-2 | 0.9 ± 0.1 | 73 ± 5 c |
| S-3 | 5.0 ± 0.6 c,d | 68 ± 5 c |
| S-4 | 6.8 ± 0.7 c,d,e | 95 ± 4 c,d,e |
Table 5.
Storage modulus G′ (kPa), loss modulus G″ (kPa), and loss tangent (tan δ) of collagen networks and hybrid scaffolds in the dry state (37 °C, 1 Hz). a,b,c represent statistically significant values within collagen networks as compared to C0, C25, and C40, respectively. d,e,f represent statistically significant values (p < 0.05) within hybrid scaffolds as compared to S-1, S-2, and S-3, respectively.
| Sample ID | Effective Crosslinking Density (ve, kmol/m3) | Rheology Properties |
|---|
| Storage Modulus (G′, kPa) | Loss Modulus (G″, kPa) | Loss Tangent (tan δ) |
|---|
| C0 | 0.4 ± 0.03 | 16 ± 2 | 3 ± 1 | 0.17 |
| C25 | 1.3 ± 0.2 | 45 ± 3 a | 7 ± 2 a | 0.17 |
| C40 | 2 ± 1 a | 49 ± 4 a | 7 ± 2 a | 0.14 |
| C60 | 3.3 ± 0.4 a,b | 74 ± 3 a,b,c | 9 ± 1 a | 0.12 a,b |
| S-1 | 0.8 ± 0.1 | 52 ± 6 | 6 ± 1 | 0.12 |
| S-2 | 0.9 ± 0.1 | 64 ± 4 | 7 ± 2 | 0.12 |
| S-3 | 5.0 ± 0.6 d,e | 68 ± 5 | 7 ± 2 | 0.11 |
| S-4 | 6.8 ± 0.7 d,e,f | 113 ± 6 d,e,f | 10 ± 2 d | 0.09 d,e |
Table 6.
Storage modulus G′ (kPa), loss modulus G″ (kPa), and loss tangent (tanδ) of collagen networks and hybrid scaffolds in a hydrated state (37 °C, 1 Hz). a,b,c represent statistically significant values within collagen networks as compared to C0, C25, and C40, respectively. d,e,f represent statistically significant values (p < 0.05) within hybrid scaffolds as compared to S-1, S-2, and S-3, respectively.
| Sample ID | Effective Crosslinking Density (ve, kmol/m3) | Rheology Properties |
|---|
| Storage Modulus (G′, kPa) | Loss Modulus (G″, kPa) | Loss Tangent (tan δ) |
|---|
| >C0 | 0.4 ± 0.03 | >7 ± 2 | >9 ± 2 | >1.17 |
| C25 | >1.3 ± 0.2 | 10 ± 3 | 6 ± 1 | 0.62 a |
| >C40 | 2 ± 1 a | >10 ± 3 | >5 ± 1 | >0.46 a |
| C60 | >3.3 ± 0.4 a,b | 18 ± 3 a,b,c | 3 ± 1 a | 0.18 a,b,c |
| >S-1 | 0.8 ± 0.1 | >11 ± 3 | >4 ± 1 | >0.38 |
| S-2 | >0.9 ± 0.1 | 15 ± 3 | 2 ± 0.6 d | 0.24 d |
| >S-3 | 5.0 ± 0.6 d,e | >53 ± 4 d,e | >5 ± 2 | >0.1 d |
| S-4 | 6.8 ± 0.7 d,e,f | 55 ± 3 d,e | 6 ± 1 e | 0.1 d |
Table 7.
Storage modulus G′(Pa), loss modulus G″(Pa), and loss tangent (tanδ) of HA network soaked in PBS at 37 °C. a,b,c represent statistically significant values (p < 0.05) within HA networks as compared to HA2, HA4, and HA10, respectively.
Table 7.
Storage modulus G′(Pa), loss modulus G″(Pa), and loss tangent (tanδ) of HA network soaked in PBS at 37 °C. a,b,c represent statistically significant values (p < 0.05) within HA networks as compared to HA2, HA4, and HA10, respectively.
| Sample ID | Effective Crosslinking Density (ve, kmol/m3) | Storage Modulus (G′, Pa) | Loss Modulus (G″, Pa) | Loss Tangent (tanδ) |
|---|
| HA2 | 2 ± 0.3 | 320 ± 24 | 19 ± 6 | 0.05 |
| HA4 | 2.5 ± 0.1 | 480 ± 19 a | 19 ± 3 | 0.04 |
| HA10 | 4.3 ± 0.1 | 660 ± 23 a,b | 25 ± 6 a | 0.04 |
| HA20 | 17 ± 0.4 a,b,c | 870 ± 21 a,b,c | 33 ± 4 a | 0.03 a |
Table 8.
Comparison of mechanical properties of HAVL and hybrid scaffolds in the dry state.
Table 8.
Comparison of mechanical properties of HAVL and hybrid scaffolds in the dry state.
| Mechanical Property | HAVL | Hybrid Scaffolds |
|---|
| S-1 | S-2 | S-3 | S-4 |
|---|
| Storage Modulus (G′, kPa) | 0.545–10.5 kPa(aortic leaflet + sinus) [53] | 52 ± 6 | 64 ± 4 | 68 ± 5 | 113 ± 6 |
| Tanδ | 0.3–0.4 [53] | 0.12 | 0.12 | 0.11 | 0.09 |
Table 9.
Comparison of mechanical properties of HAVL and hybrid scaffolds in the wet state.
Table 9.
Comparison of mechanical properties of HAVL and hybrid scaffolds in the wet state.
| Mechanical Property | HAVL | Hybrid Scaffolds |
|---|
| S-1 | S-2 | S-3 | S-4 |
|---|
| Storage modulus (G′, kPa) | 0.545–10.5 kPa
(aortic leaflet + sinus) [53] | 11 ± 3 | 15 ± 3 | 53 ± 4 | 55 ± 3 |
| Tanδ | 0.3–0.4 [53] | 0.38 | 0.24 | 0.1 | 0.1 |
Table 10.
Comparison of the diameter of gyration (D
g) or molecular weight (M
z) of the active enzymes with the average molecular weight (M
c) or average distance between the two crosslinks (ƹ) in the target network.
a,b represents statistically significant values within collagen networks as compared to C0 and C25, respectively.
c,d,e represent statistically significant values within HA networks as compared to HA2, HA4, and HA10, respectively.
f,g,h represent statistically significant values within hybrid scaffolds as compared to S-1, S-2, and S-3, respectively (Please see
Table 3).
| Active Enzyme with Approx. Molecular Weight (Mz, kg/mol) | Diameter of Gyration (Dg, nm) | Target Network | Distance between Crosslinks Points (ƹ, nm) | Average Molecular Weight between the Two Crosslinks
(Mc, ×102 kg/mol) |
|---|
Collagenase
(68–130) | 4.8 | C0 | 37 ± 3 | 32 ± 2.5 |
| C60 | 11 ± 1 a,b | 4.1 ± 0.5 a,b |
Hyaluronidase
(55) | 4.4 | HA2 | 9.7 ± 1 | 6.4 ± 0.9 |
| HA20 | 2.4 ± 1 c,d,e | 0.8 ± 0.2 c,d,e |
| Collagenase + Hyaluronidase | | S-1 | 13 ± 1 | 16 ± 2.1 |
| S-2 | 10 ± 2 | 14 ± 2.4 |
| S-3 f,g | 8.2 ± 3 f,g | 0.7 ± 0.2 f |
| S-4 f,g | 7.3 ± 1 f,g,h | 0.5 ± 0.1 f,g |


