
The Influence of Residuals Combining Temperature and Reaction Time on Calcium Phosphate Transformation in a Precipitation Process


Abstract
:1. Introduction
2. Materials and Methods
3. Results
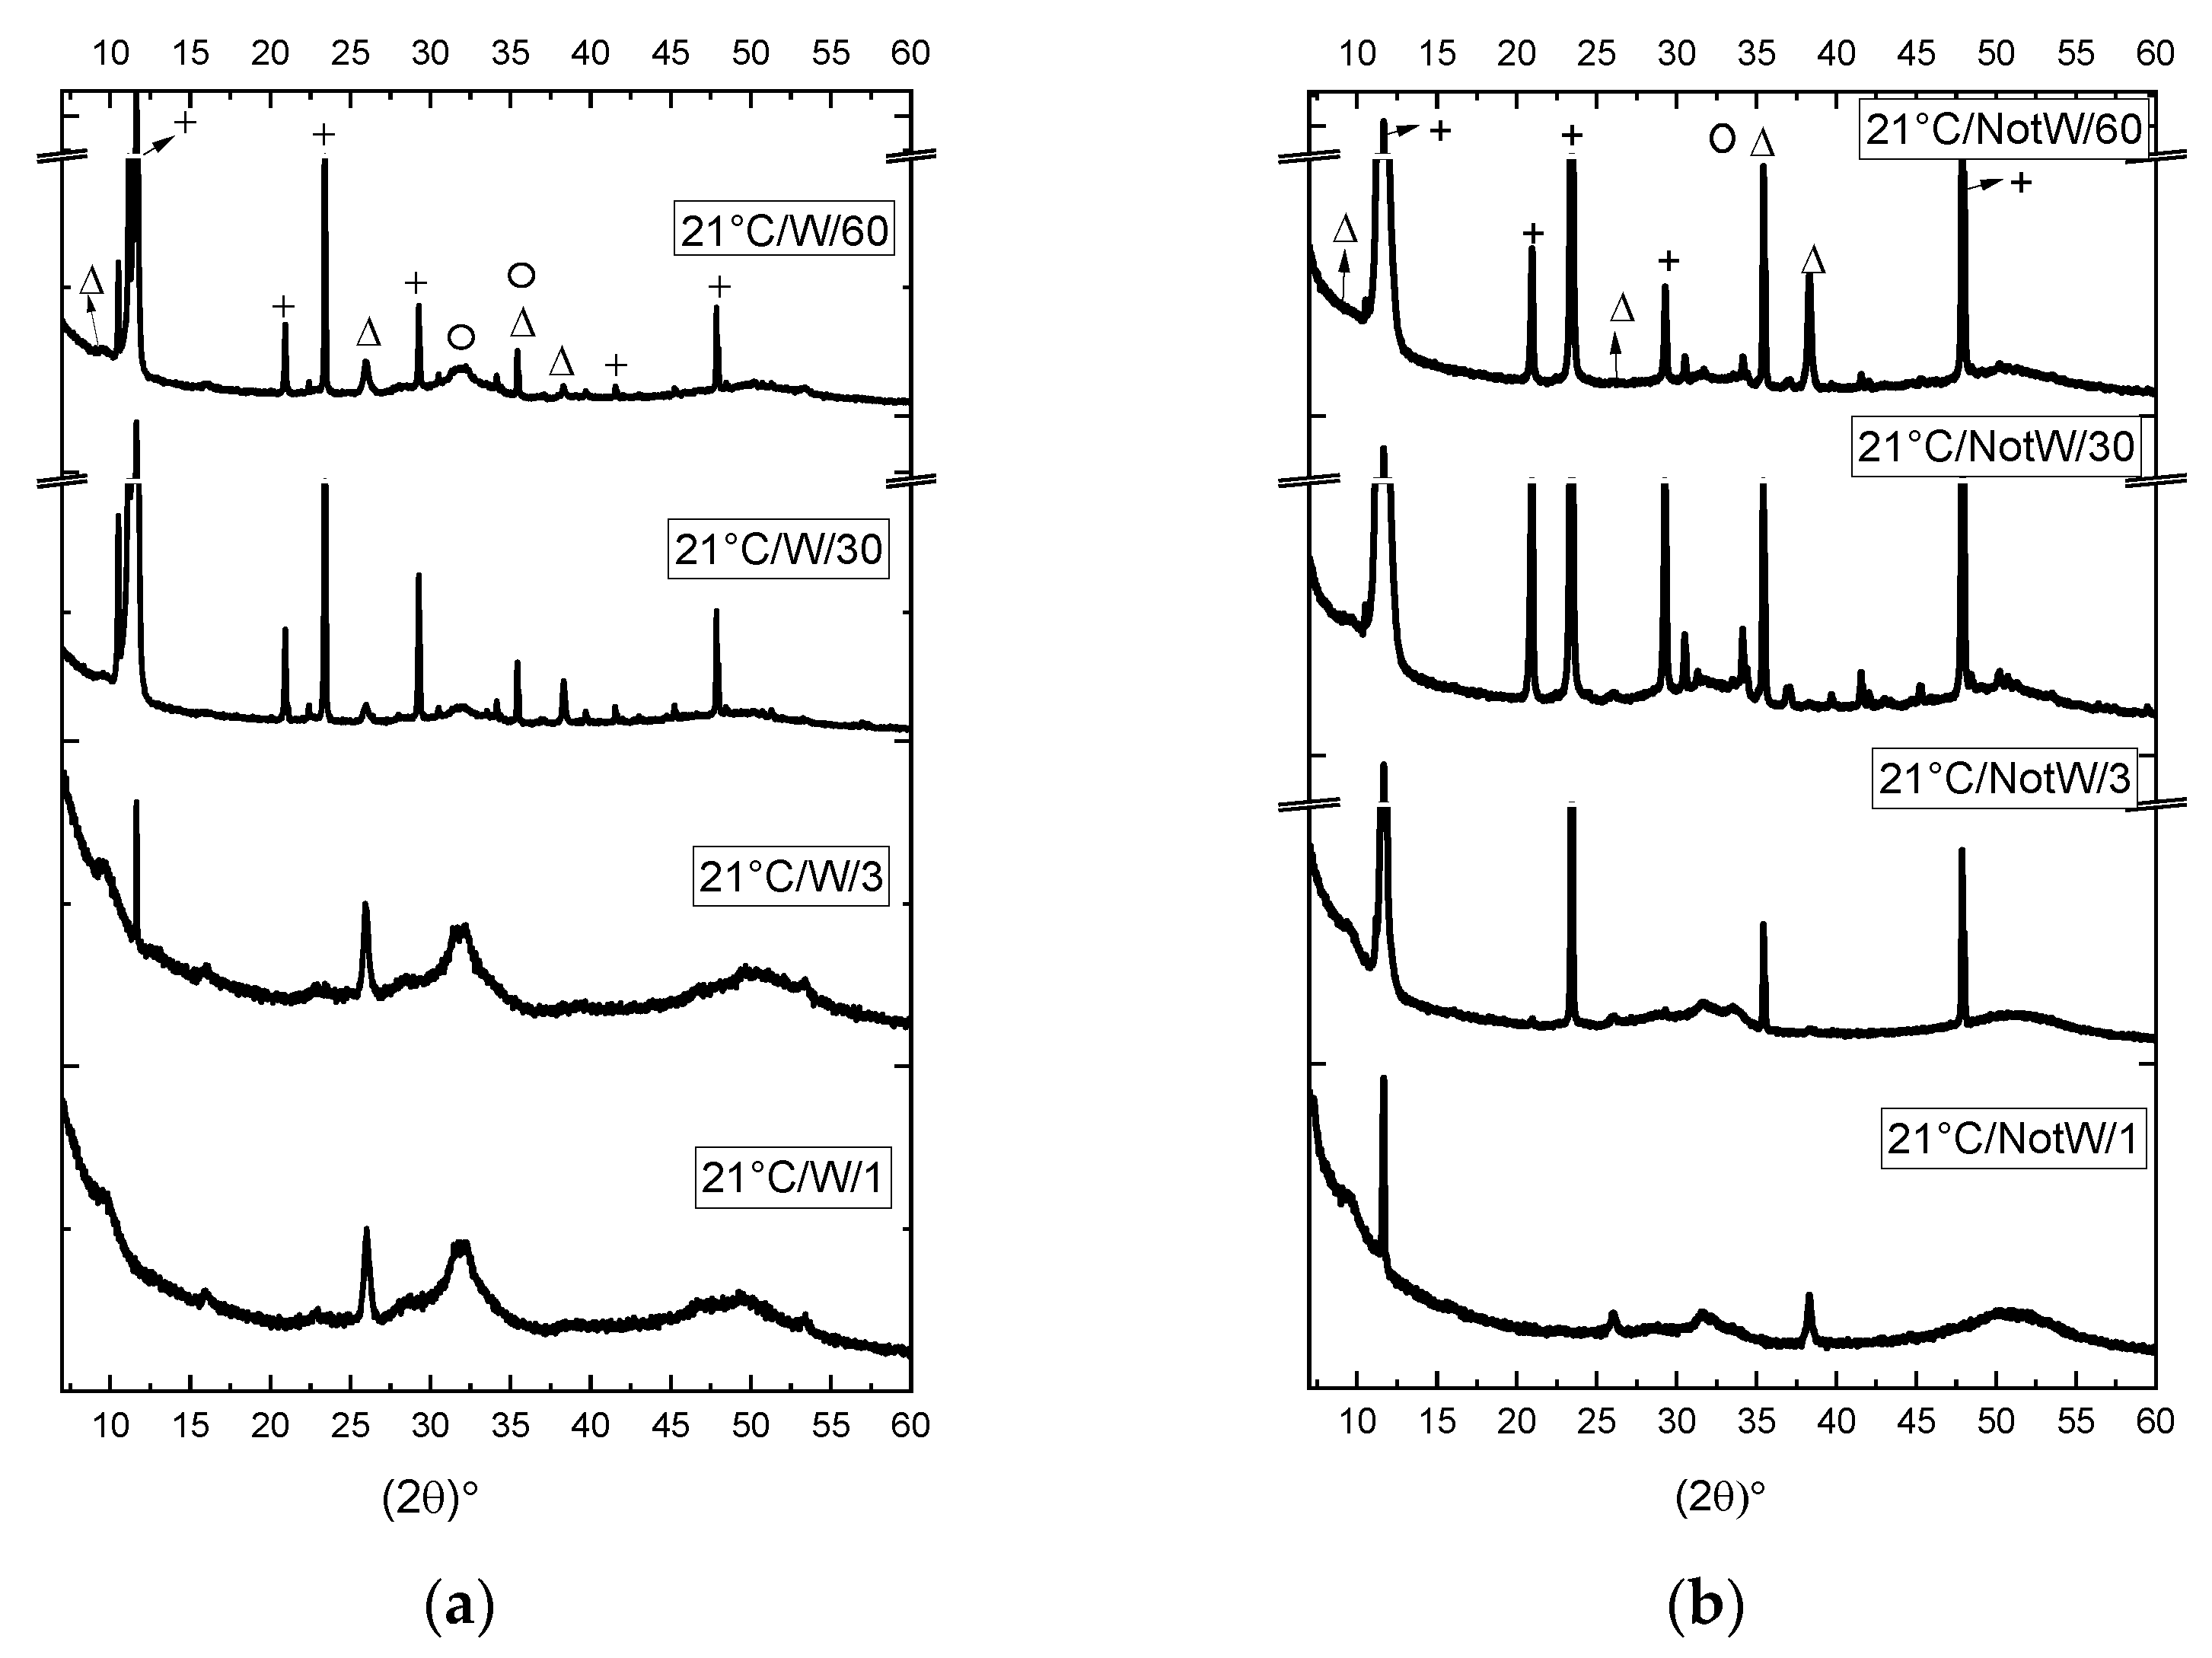
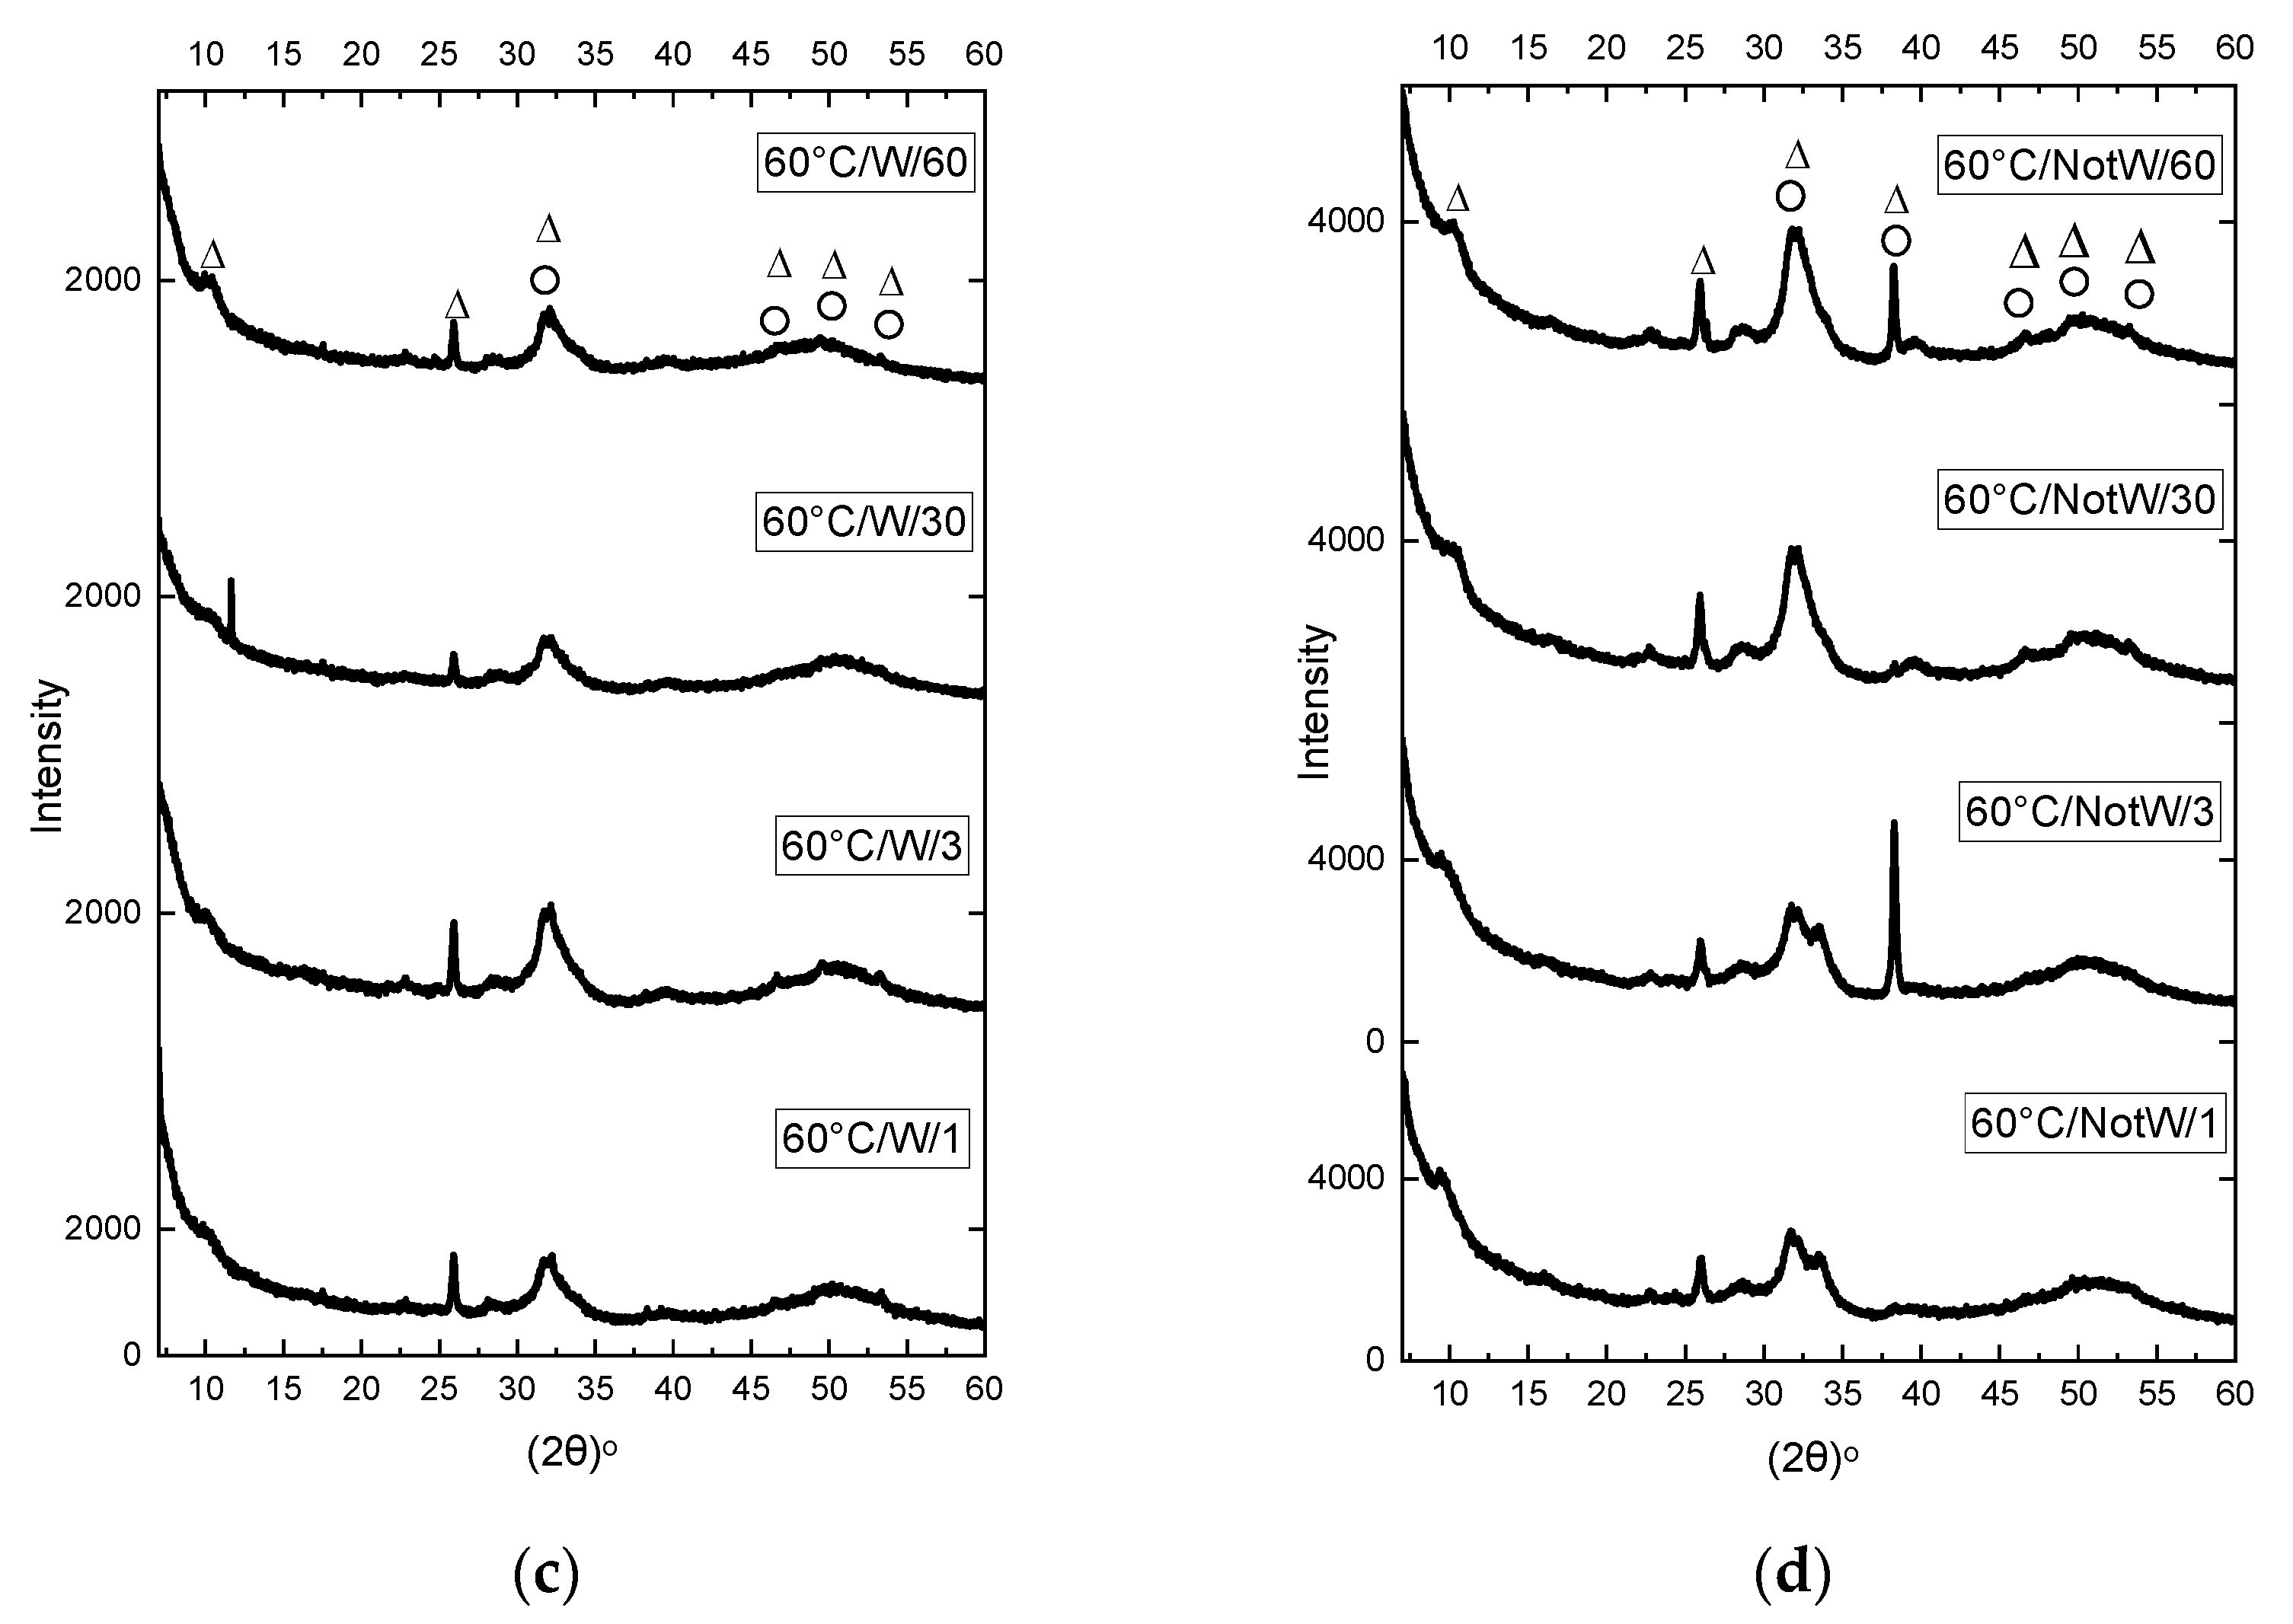
3.1. XRD Analysis
3.2. pH Analysis
5Ca8 H2(PO4)6 + 8 H2O → 4Ca10 (PO4)6 (OH)2 (HA) + 6 H3PO4
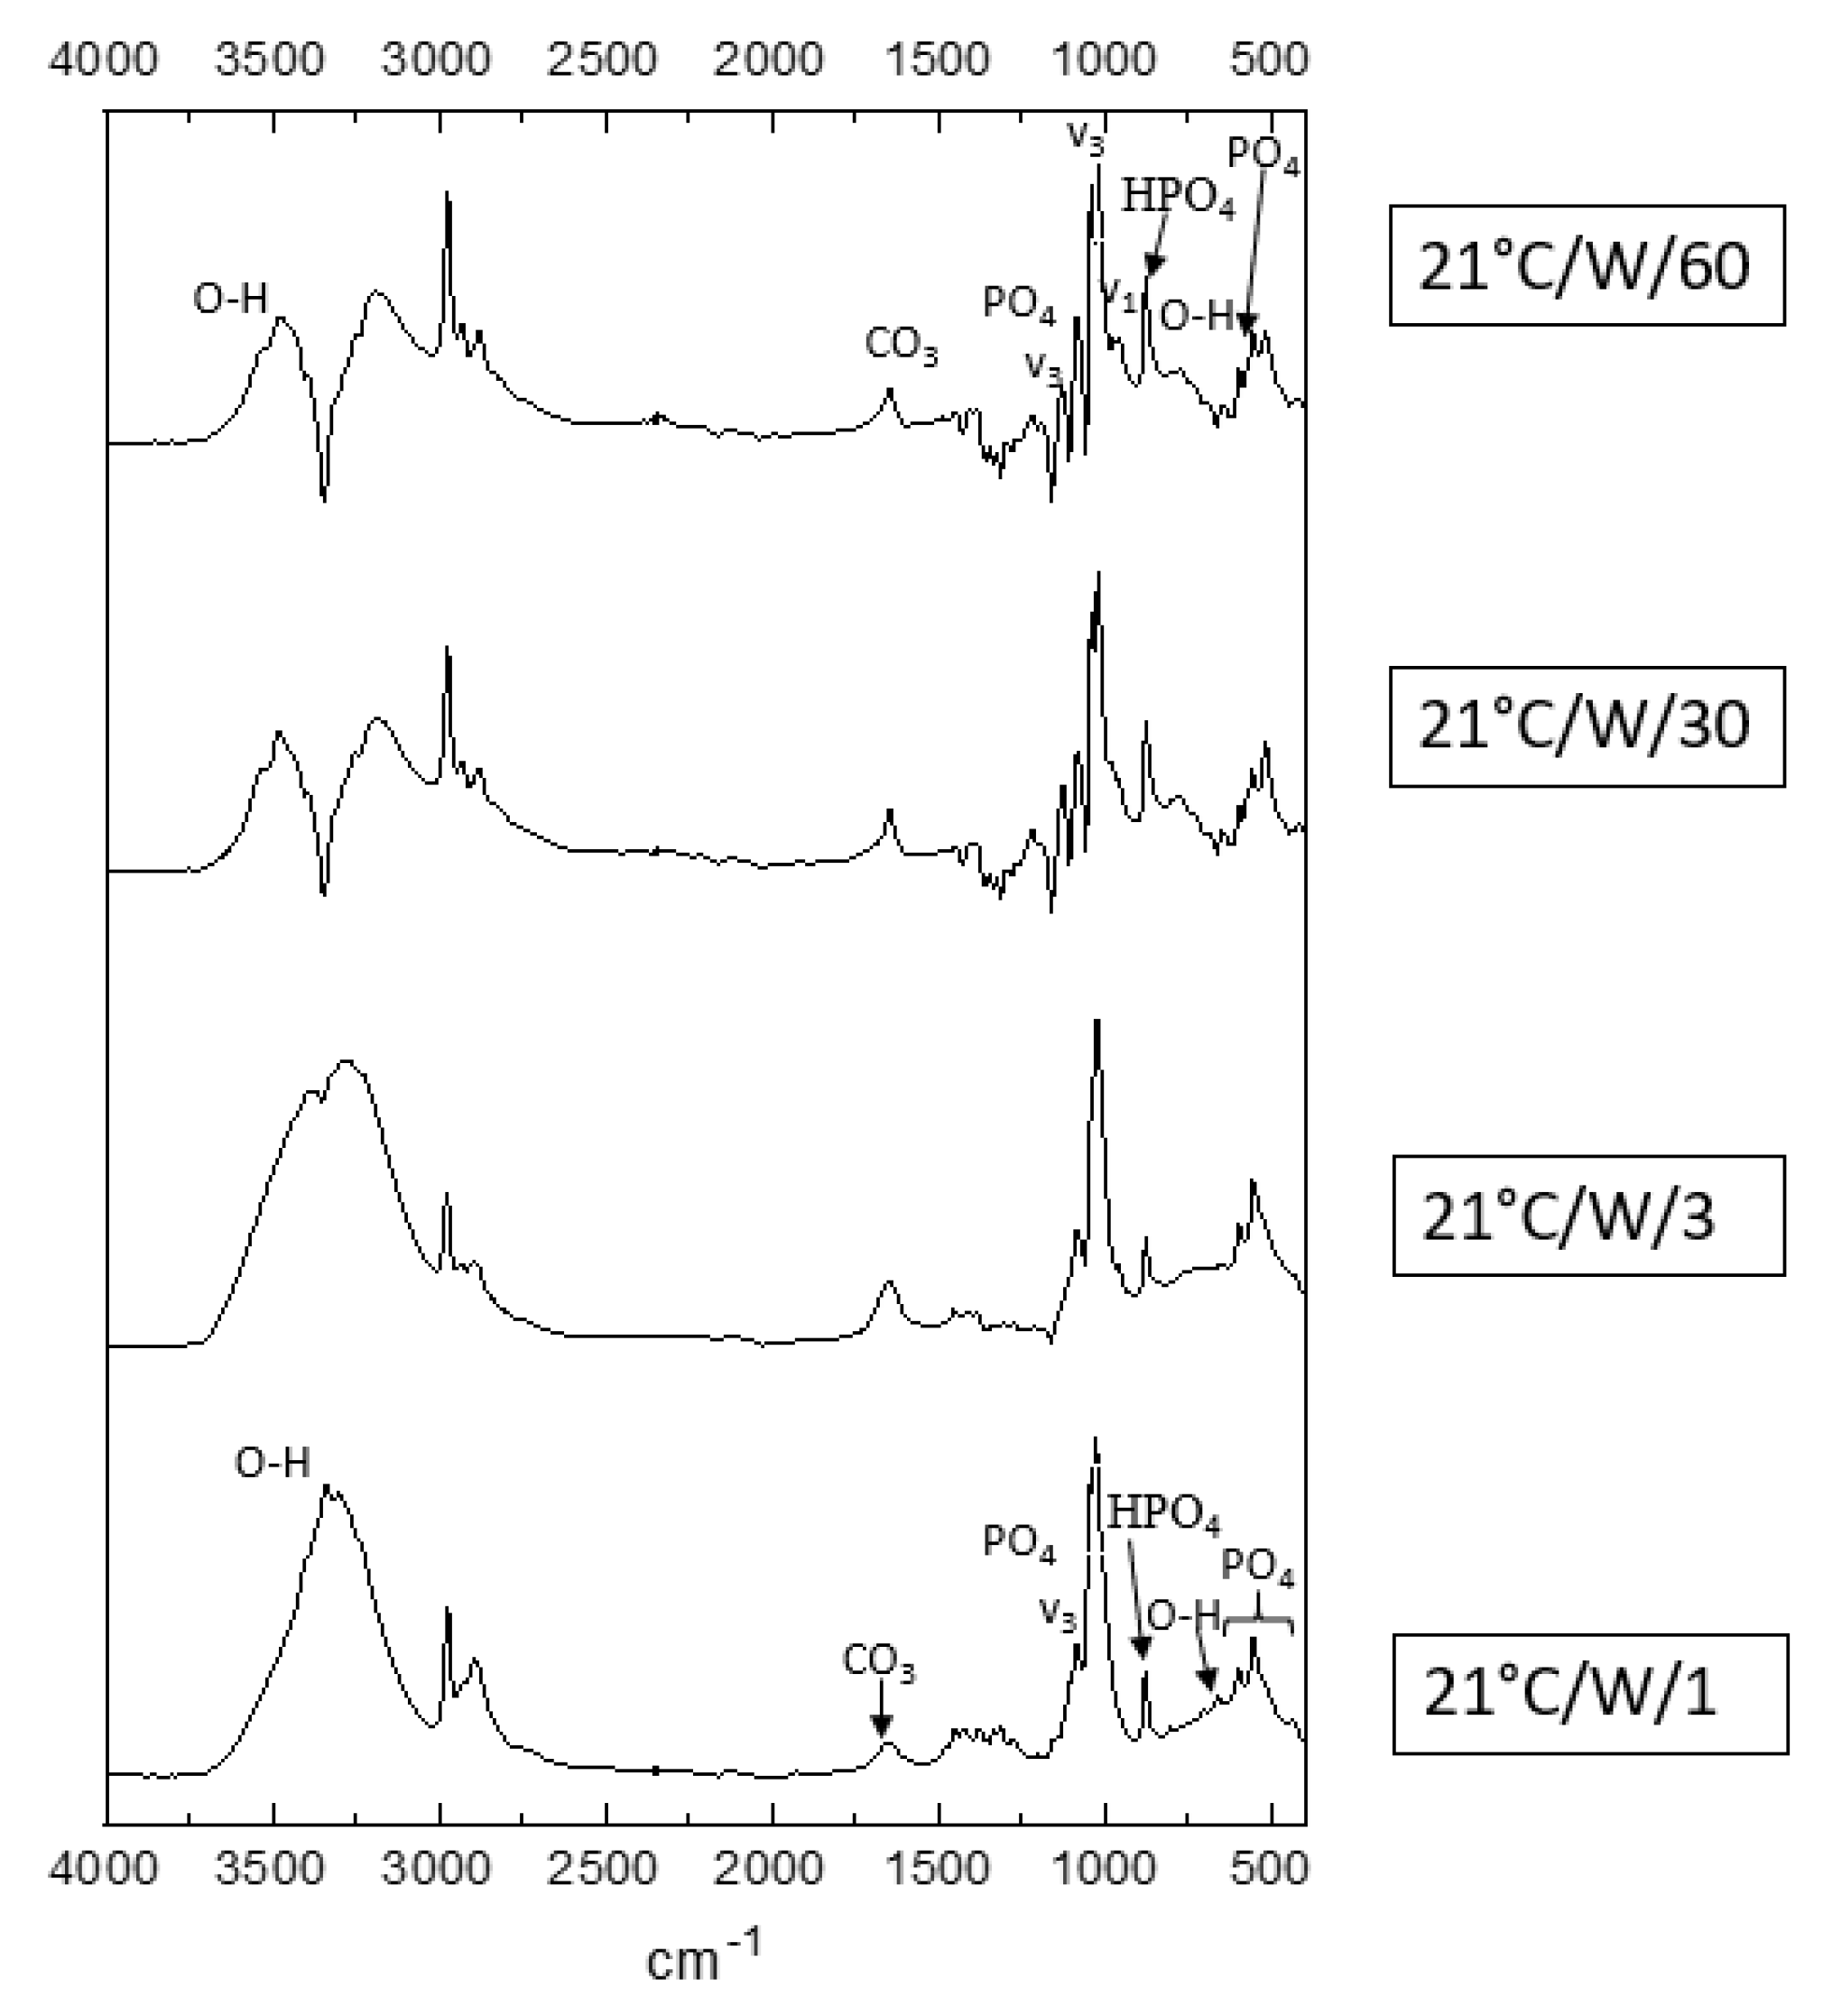
3.3. FTIR Analysis
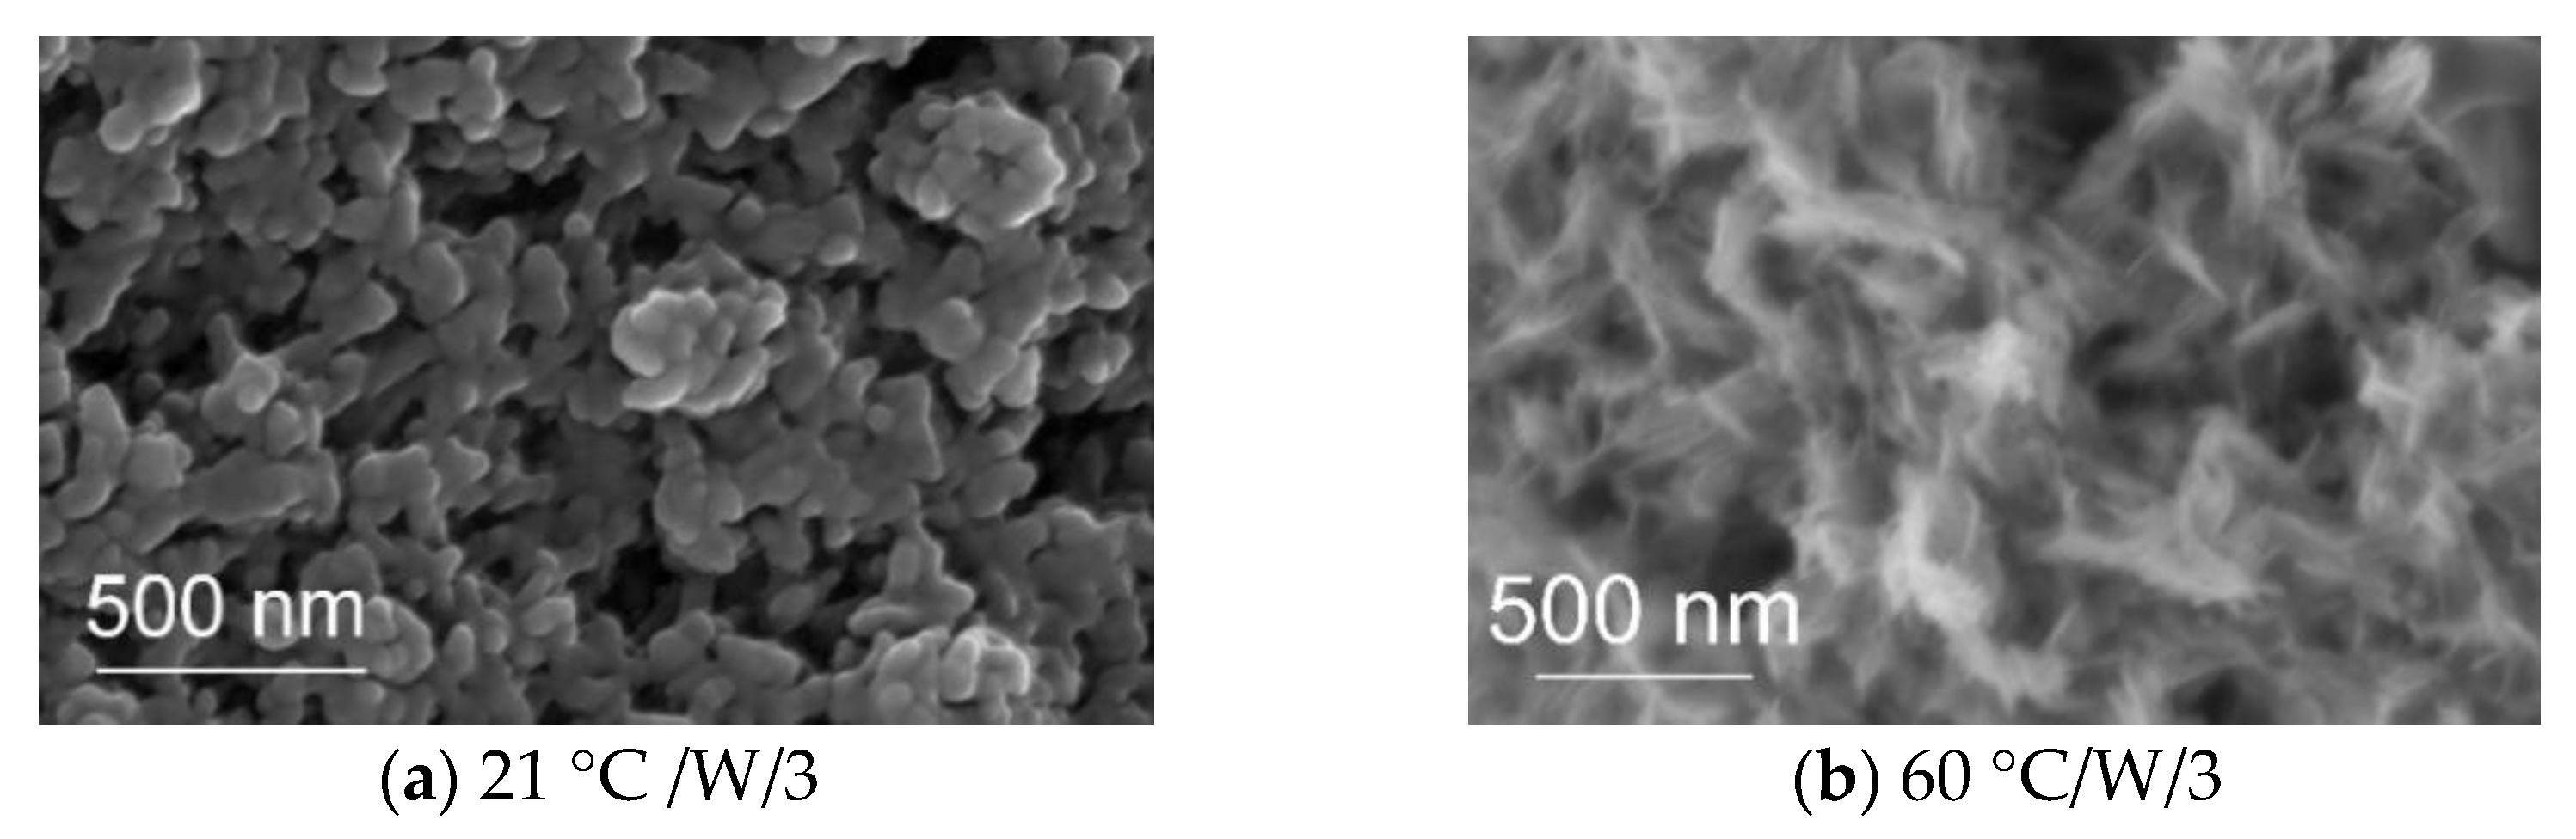
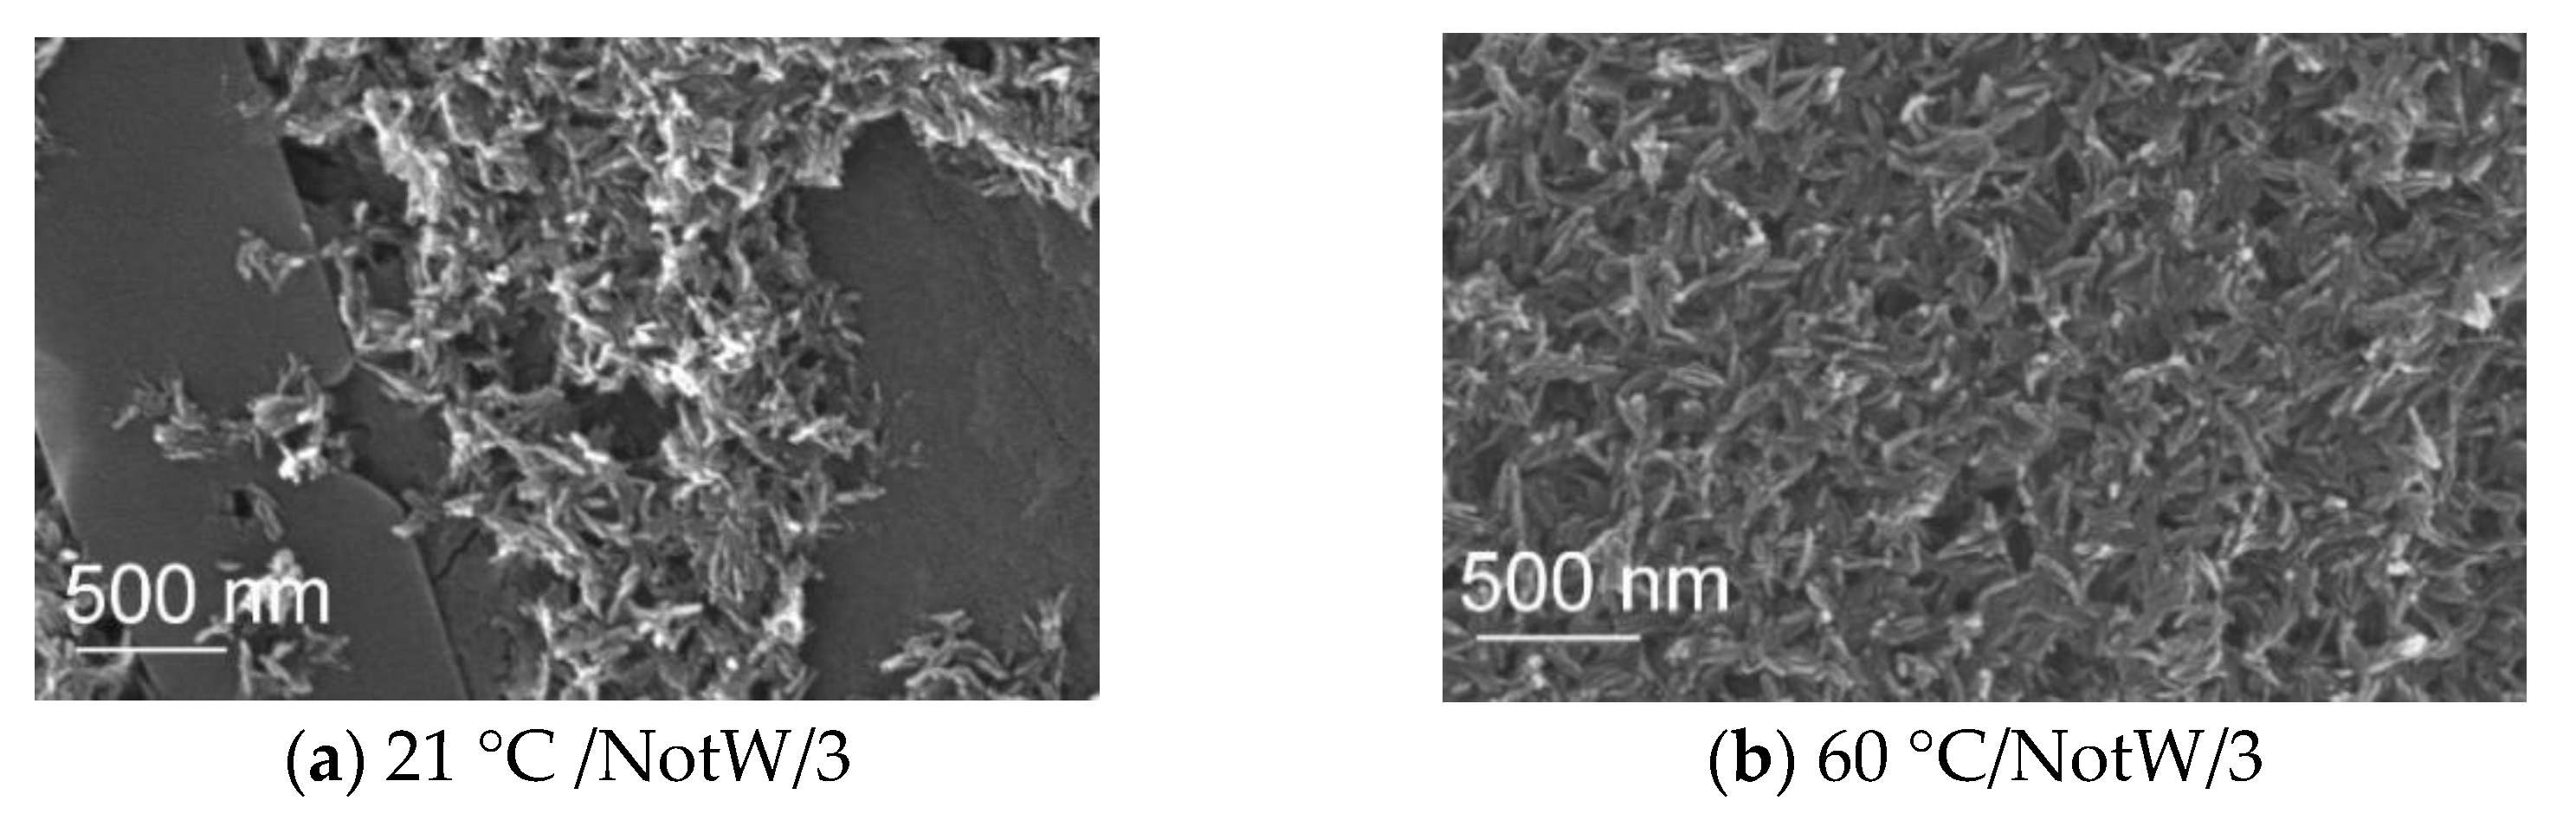
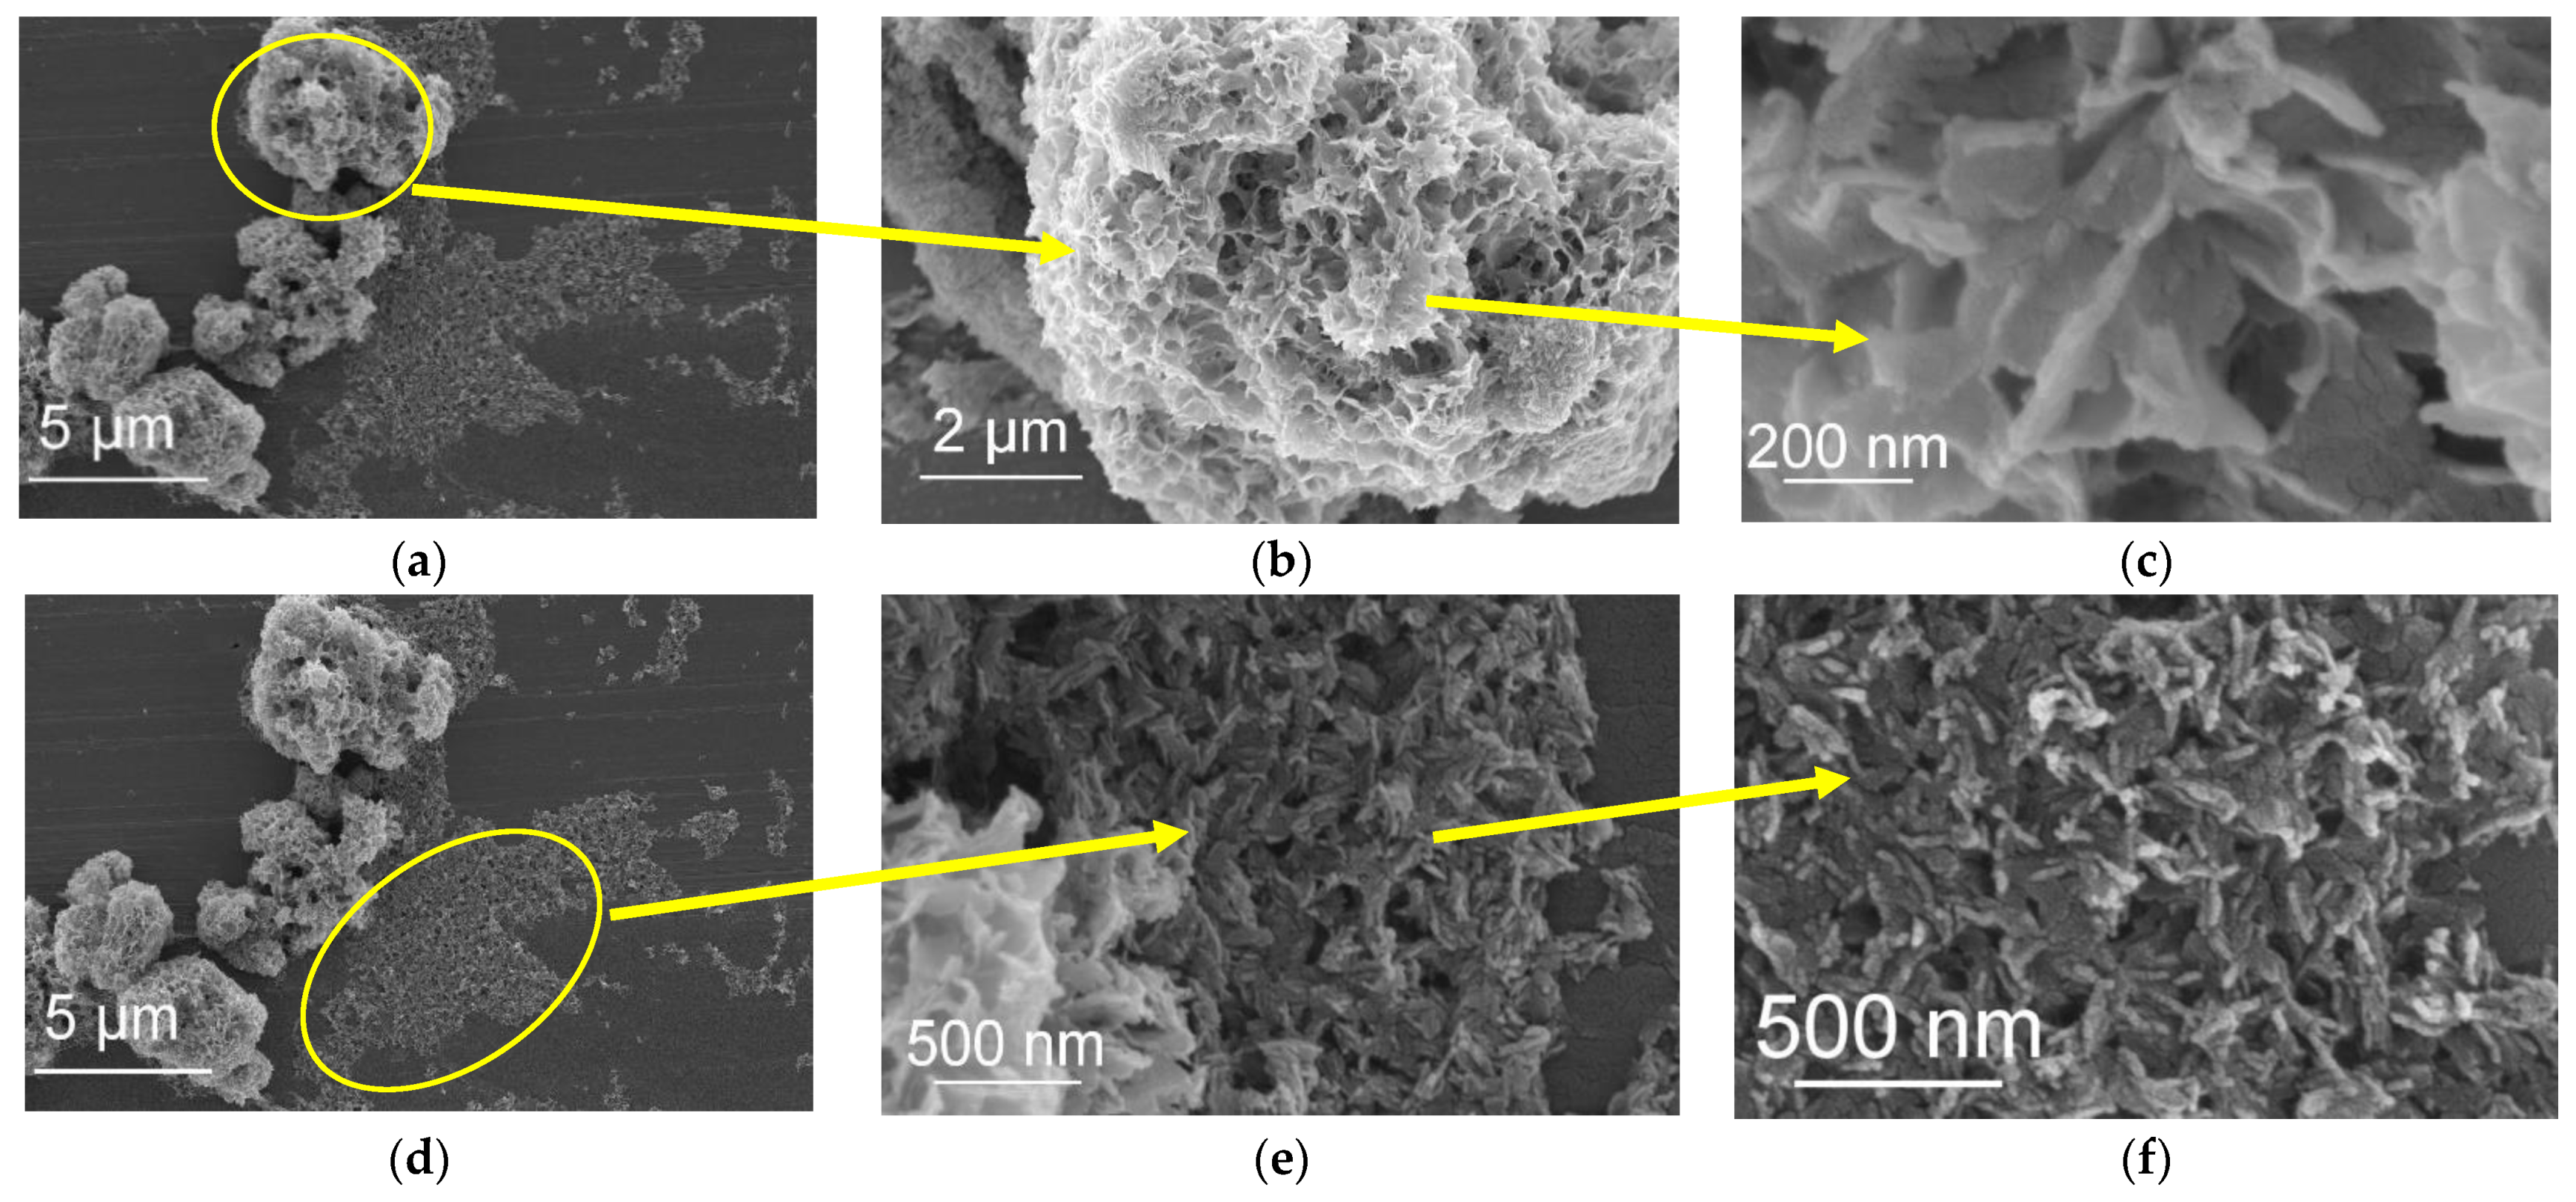
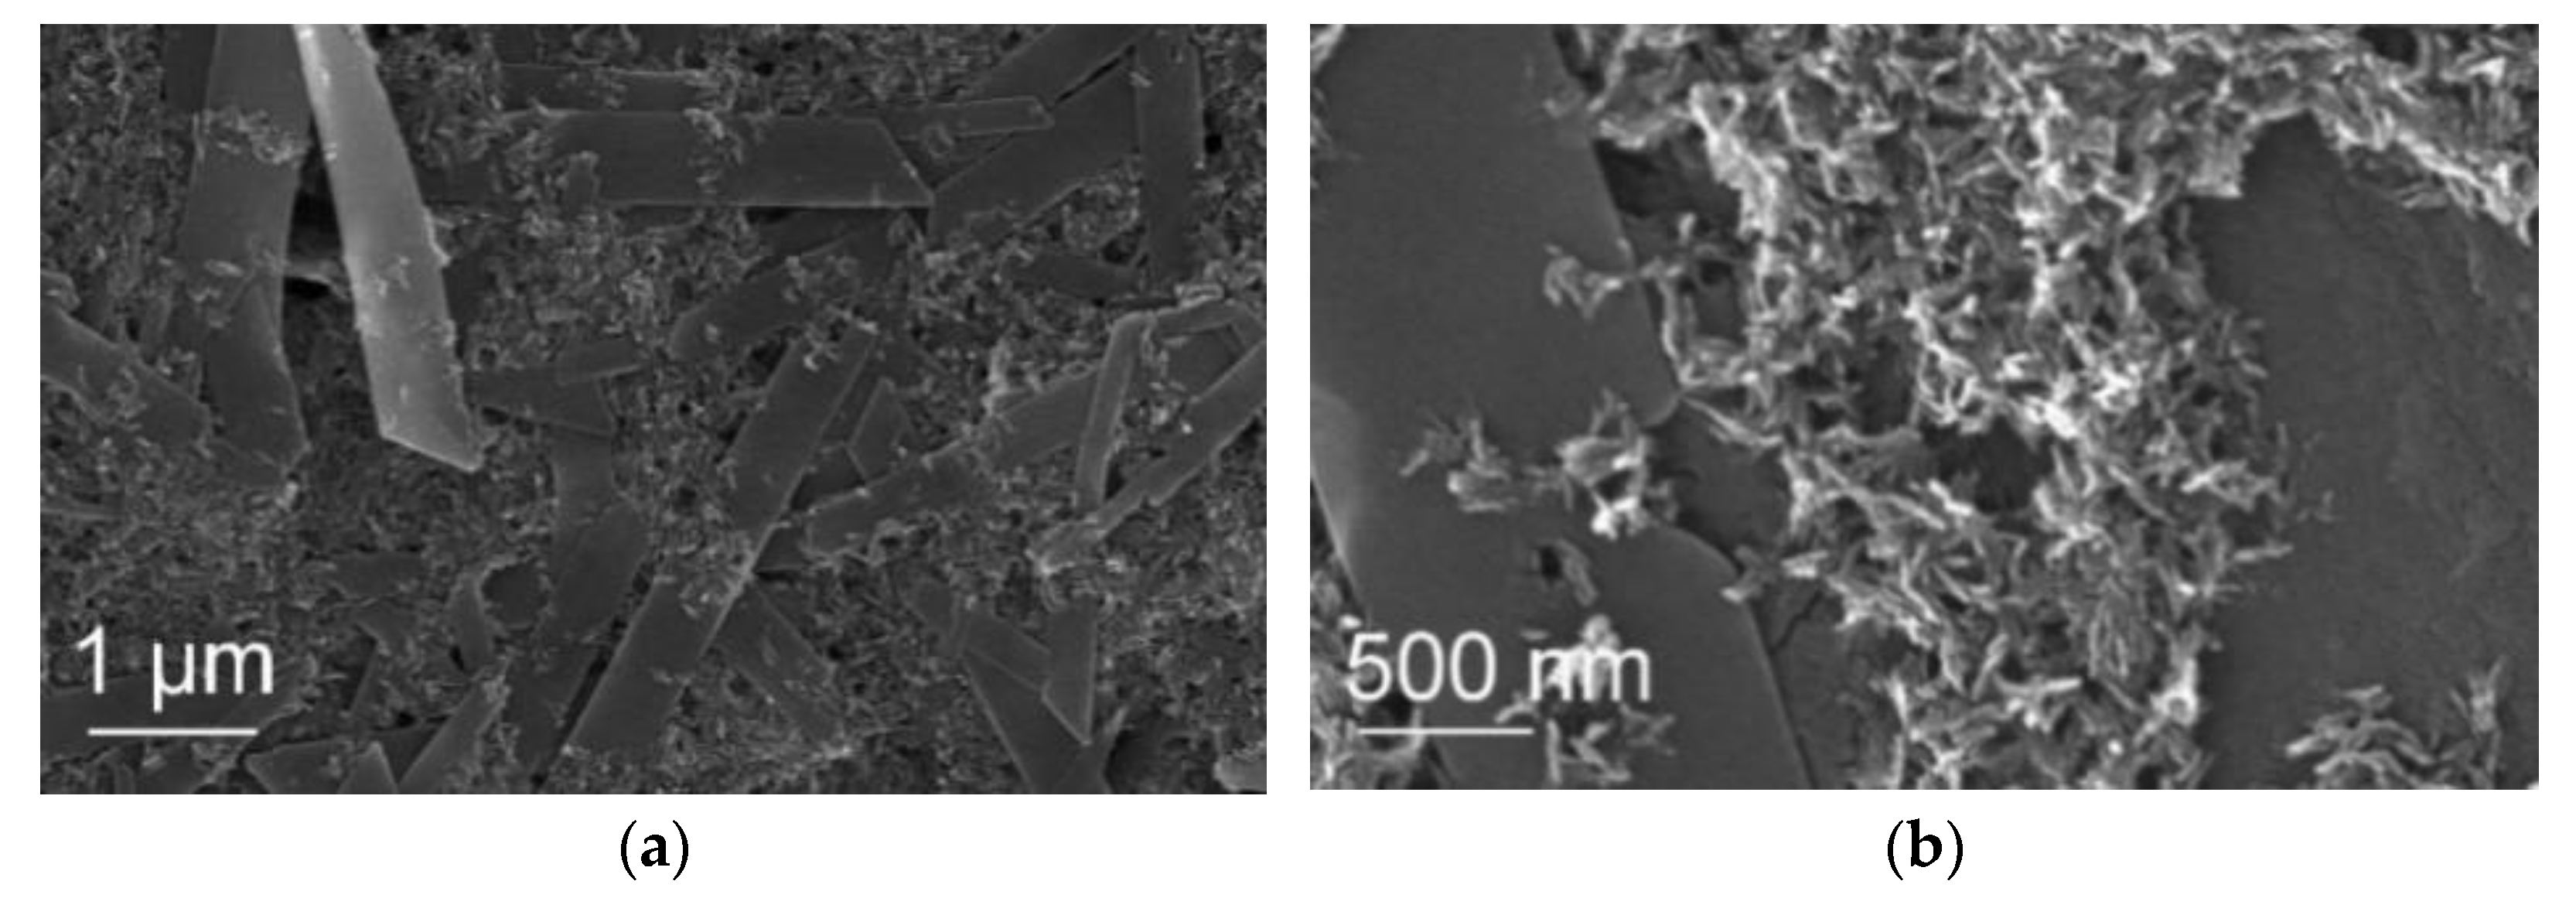
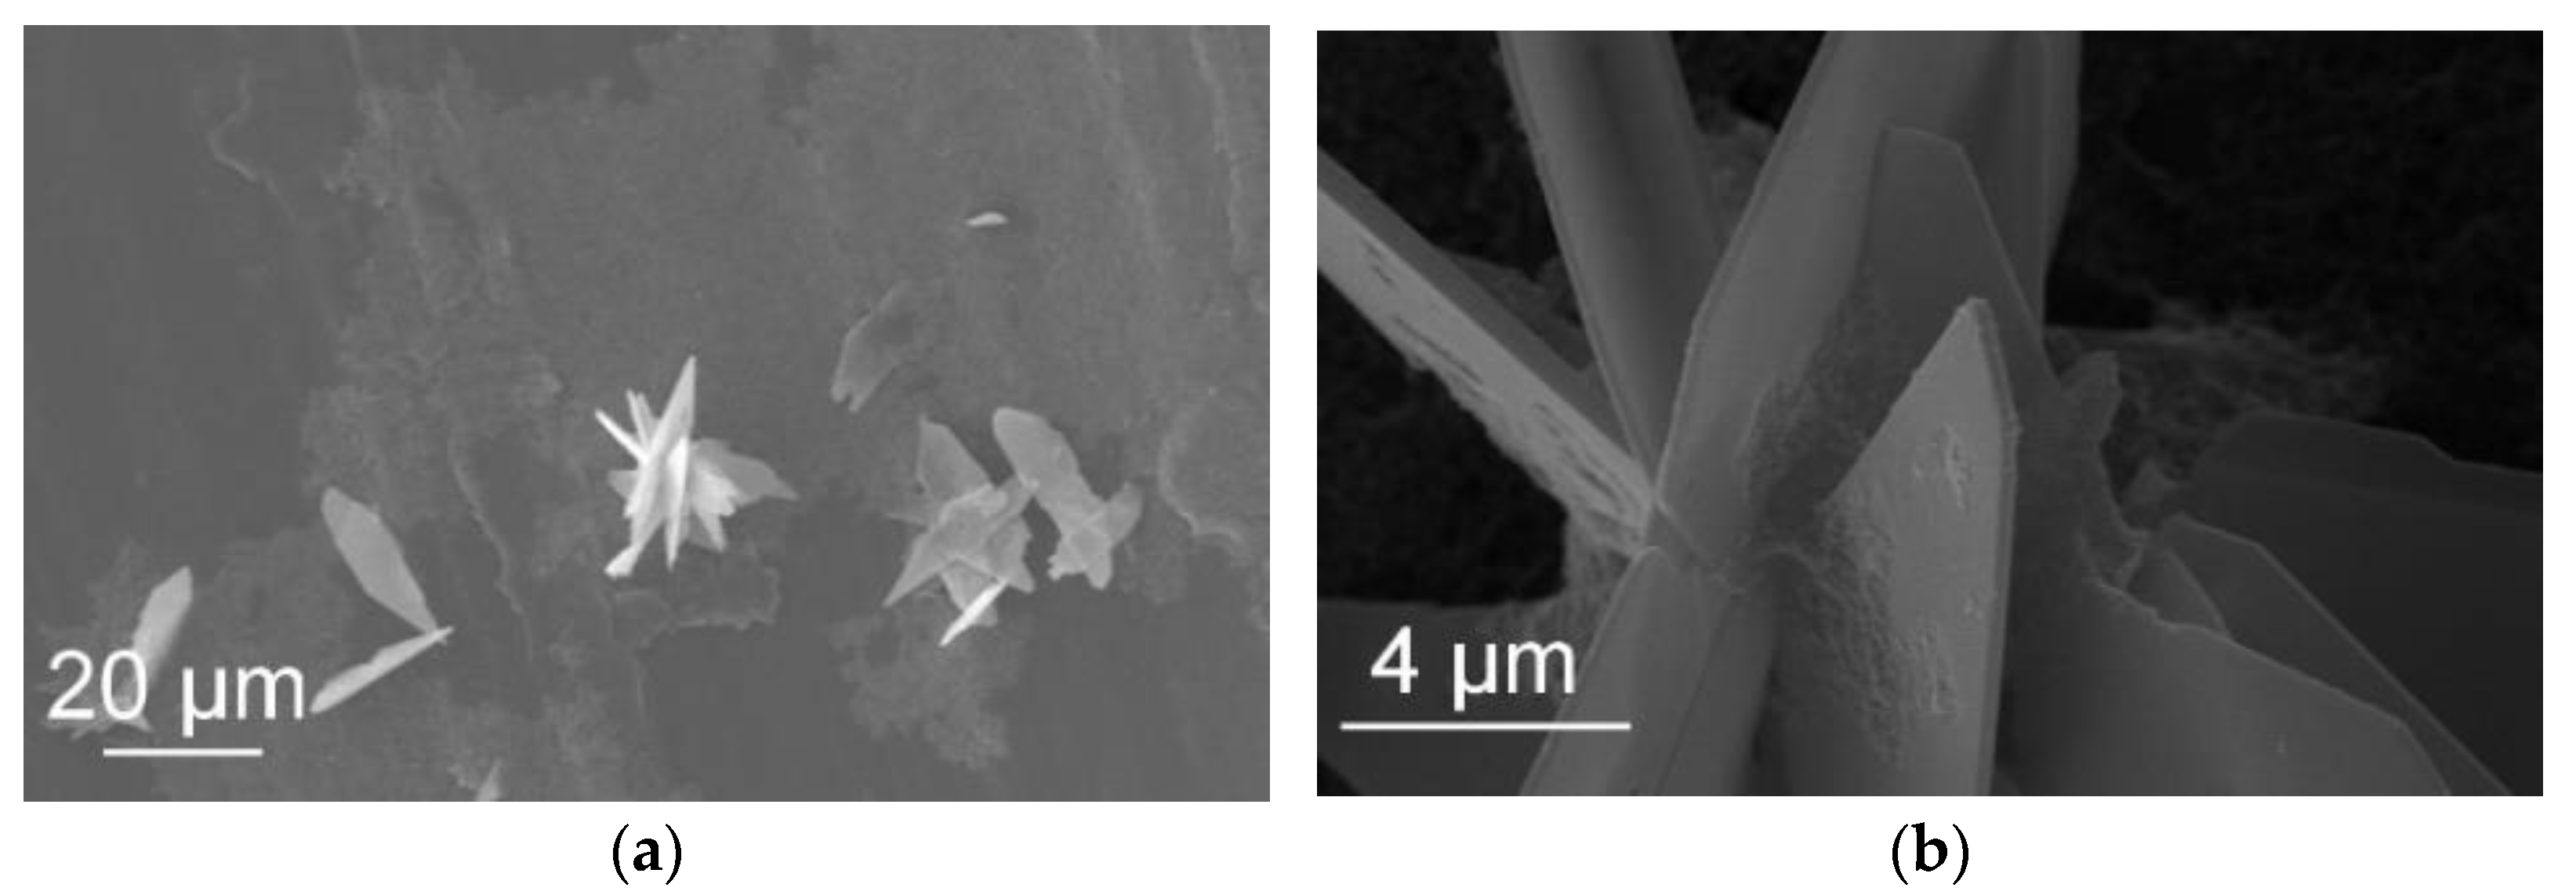
3.4. SEM Analysis
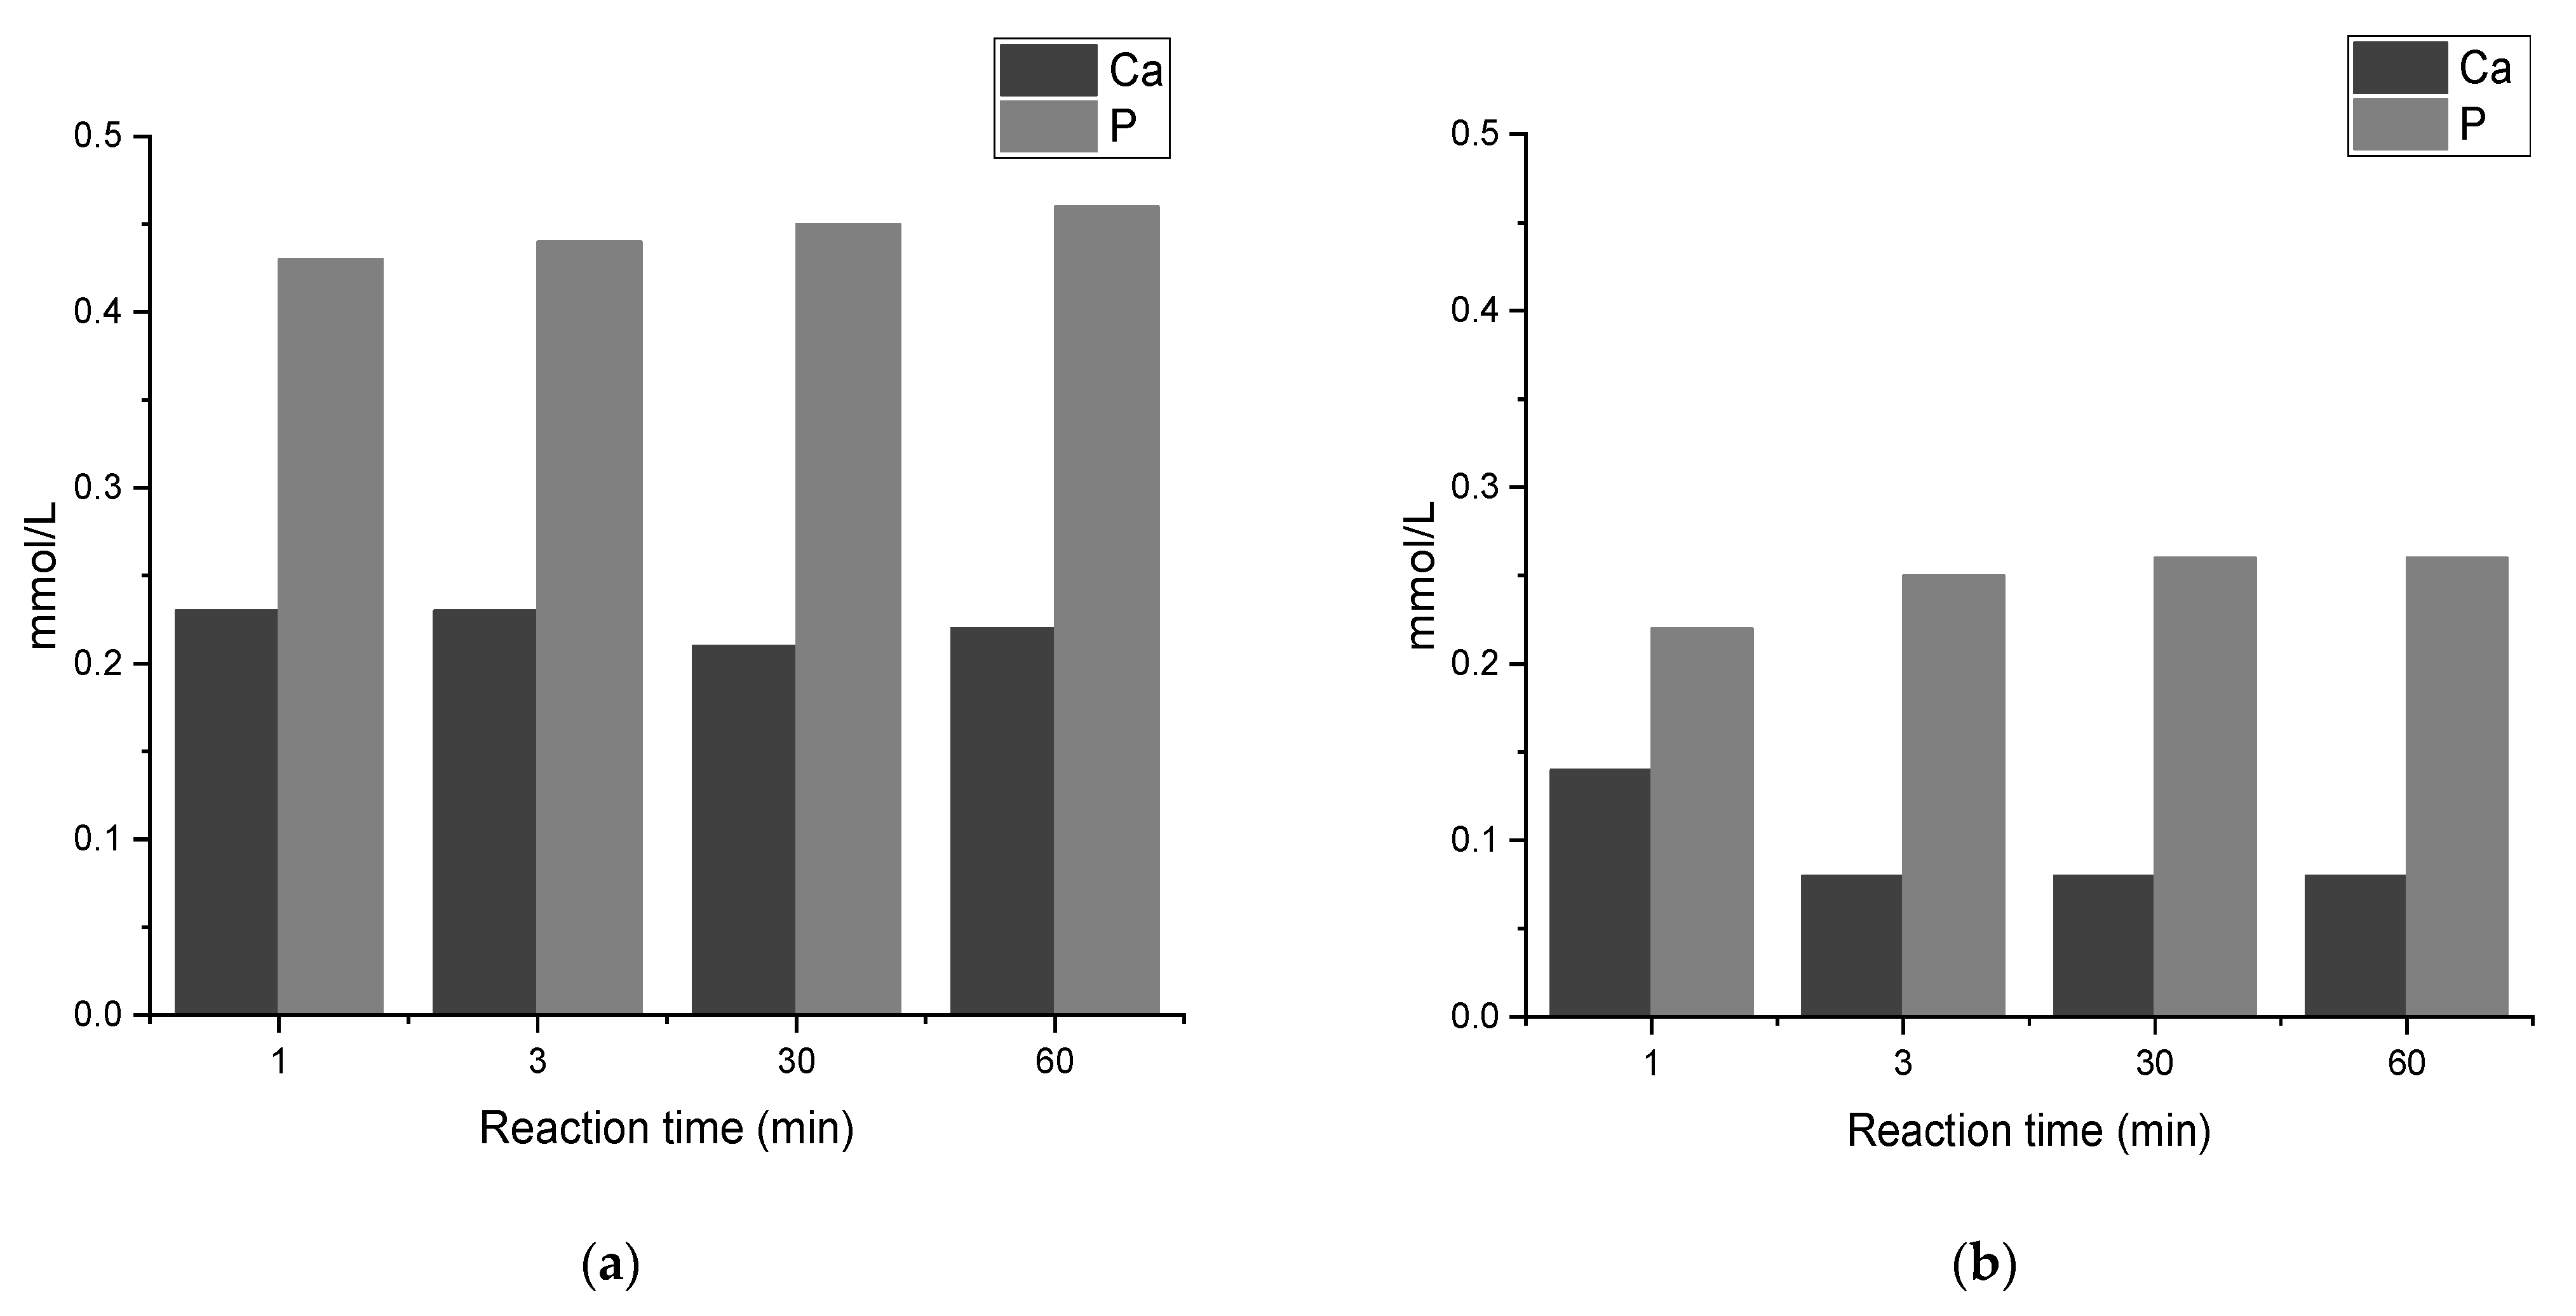
3.5. Ca/P Ratios in Precipitates
4. Discussion
- 1 min: aggregated clusters of three different shapes and sizes are observed as below:
- Loose clusters 1–5 µm, made of spherical particles of 10 nm that are made of smaller particles.
- Dens clusters made of Nano-rods (100 nm × 20 nm) similar to OCP [46].
- Clusters 1–5 µm, made of flake-like morphology (200 × 100 nm)
- 3 min: two types of aggregates are observed as below:
- 30 min: two types of aggregates are observed as below:
- Dens clusters made of Nano-rods (100 nm × 20 nm), similar to OCP [46].
- Petal-like morphology that is made of flake-like particles of (25 µm × 5µm), similar to DCPD.
5. Conclusions
Supplementary Materials
Author Contributions
Funding
Institutional Review Board Statement
Informed Consent Statement
Data Availability Statement
Acknowledgments
Conflicts of Interest
References
- Hulbert, S.; Hench, L.; Forbers, D.; Bowman, L. History of bioceramics. Ceram. Int. 1982, 8, 131–140. [Google Scholar] [CrossRef]
- Hench, L.L. Bioceramics: From Concept to Clinic. J. Am. Ceram. Soc. 1991, 74, 1487–1510. [Google Scholar] [CrossRef]
- Jiwoon, J.; Kim, J.H.; Shim, J.H.; Hwang, N.S.; Heo, C.Y. Bioactive calcium phosphate materials and applications in bone regeneration. Biomater. Res. 2019, 23, 4. [Google Scholar] [CrossRef] [Green Version]
- Dorozhkin, S.V. Amorphous calcium (ortho)phosphates. Acta Biomater. 2010, 6, 4457–4475. [Google Scholar] [CrossRef]
- Ramesh, S.; Tan, C.Y.; Hamdi, M.; Sopyan, I.; Teng, W.D. The influence of Ca/P ratio on the properties of hydroxyapatite bioceramics. In Proceedings of the International Conference on Smart Materials and Nanotechnology in Engineering, Harbin, China, 1–4 July 2007; International Society for Optics and Photonics: Bellingham, WA, USA, 2007; Volume 6423, p. 64233A. [Google Scholar]
- Eanes, E.D. Amorphous Calcium Phosphate: Thermodynamic and Kinetic Considerations. In Calcium Phosphates in Biological and Industrial Systems; Springer: Singapore, 1998; pp. 21–39. [Google Scholar]
- Boskey, A.L.; Posner, A.S. Conversion of amorphous calcium phosphate to microcrystalline hydroxyapatite. A pH-dependent, solution-mediated, solid-solid conversion. J. Phys. Chem. 1973, 77, 2313–2317. [Google Scholar] [CrossRef]
- Meyer, J.L.; Weatherall, C.C. Amorphous to crystalline calcium phosphate phase transformation at elevated pH. J. Colloid Interface Sci. 1982, 89, 257–267. [Google Scholar] [CrossRef]
- Blumenthal, N.C.; Betts, F.; Posner, A.S. Stabilization of amorphous calcium phosphate by Mg and ATP. Calcif. Tissue Res. 1977, 23, 245–250. [Google Scholar] [CrossRef] [PubMed]
- Mekmene, O.; Quillard, S.; Rouillon, T.; Bouler, J.-M.; Piot, M.; Gaucheron, F. Effects of pH and Ca/P molar ratio on the quantity and crystalline structure of calcium phosphates obtained from aqueous solutions. Dairy Sci. Technol. 2009, 89, 301–316. [Google Scholar] [CrossRef] [Green Version]
- Zyman, Z.Z.; Rokhmistrov, D.; Glushko, V.I. Structural and compositional features of amorphous calcium phosphate at the early stage of precipitation. J. Mater. Sci. Mater. Electron. 2010, 21, 123–130. [Google Scholar] [CrossRef]
- Medvecky, L.; Sopcak, T.; Girman, V.; Briancin, J. Amorphous calcium phosphates synthesized by precipitation from calcium D-gluconate solutions. Colloids Surfaces A Physicochem. Eng. Asp. 2013, 417, 191–200. [Google Scholar] [CrossRef]
- Vecstaudza, J.; Locs, J. Novel preparation route of stable amorphous calcium phosphate nanoparticles with high specific surface area. J. Alloys Compd. 2017, 700, 215–222. [Google Scholar] [CrossRef]
- Vecstaudza, J.; Gasik, M.; Locs, J. Amorphous calcium phosphate materials: Formation, structure and thermal behaviour. J. Eur. Ceram. Soc. 2019, 39, 1642–1649. [Google Scholar] [CrossRef]
- Granados-Correa, F.; Bonifacio-Martínez, J.; Serrano-Gómez, J. Synthesis and Characterization of Calcium Phosphate and Its Relation to Cr(VI) Adsorption Properties. Rev. Int. Contam. Ambient. 2010, 26, 129. [Google Scholar]
- Padmanabhan, S.K.; Balakrishnan, A.; Chu, M.-C.; Lee, Y.J.; Kim, T.N.; Cho, S.-J. Sol–gel synthesis and characterization of hydroxyapatite nanorods. Particuology 2009, 7, 466–470. [Google Scholar] [CrossRef]
- Szatkowski, T.; Kołodziejczak-Radzimska, A.; Zdarta, J.; Szwarc-Rzepka, K.; Paukszta, D.; Wysokowski, M.; Ehrlich, H.; Jesionowski, T. Synthesis and characterization of hydroxyapatite/chitosan composites. Physicochem. Probl. Miner. Process. 2015, 51, 575. [Google Scholar] [CrossRef]
- Dorozhkin, S. Green chemical synthesis of calcium phosphate bioceramics. J. Appl. Biomater. Biomech. 2010, 6, 104. [Google Scholar]
- Sinusaite, L.; Grigoraviciute-Puroniene, I.; Popov, A.; Ishikawa, K.; Kareiva, A.; Zarkov, A. Controllable synthesis of tricalcium phosphate (TCP) polymorphs by wet precipitation: Effect of washing procedure. Ceram. Int. 2019, 45, 12423–12428. [Google Scholar] [CrossRef]
- Cheshmehzangi, A.; Dawodu, A. The Review of Sustainable Development Goals (SDGs): People, Perspective and Planning. In Sustainable Urban Development in the Age of Climate Change; Palgrave Macmillan: Singapore, 2019; Volume 133, pp. 133–156. [Google Scholar] [CrossRef]
- Dentin, I. A New Method of Treatment for Dentin Hypersensitivity Precipitation of Calcium Phosphate in Situ. Dent. Mater. J. 1990, 9, 167–172. [Google Scholar]
- Gutiérrez-Arenas, D.A.; Cuca-García, M.; Méndez-Rojas, M.A.; Pro-Martínez, A.; Becerril-Pérez, C.M.; Mendoza-Álvarez, M.E.; Ávila-Ramos, F.; Ramírez-Bribiesca, J.E. Designing Calcium Phosphate Nanoparticles with the Co-Precipitation Technique to Improve Phosphorous Availability in Broiler Chicks. Animals 2021, 11, 2773. [Google Scholar] [CrossRef]
- Arifuzzaman, S.M.; Rohani, S. Experimental Study of Brushite Precipitation. J. Cryst. Growth 2004, 267, 624. [Google Scholar] [CrossRef]
- Lim, H.N.; Kassim, A.; Huang, N.M. Preparation and Characterization of Calcium Phosphate Nanorods Using Reverse Microemulsion and Hydrothermal Processing Routes. Sains Malays. 2010, 39, 267. [Google Scholar]
- Hutchens, S. TRACE: Tennessee Research and Creative Exchange. Synthesis and Initial Characterization of a Calcium-Deficient Hydroxyapatite-Bacterial Cellulose Composite. Master’s Thesis, University of Tennessee, Knoxville, TN, USA, 2004. [Google Scholar]
- Katz, L. X-ray diffraction in crystals, imperfect crystals, and amorphous bodies (Guinier, A.). J. Chem. Educ. 1964, 41, 292. [Google Scholar] [CrossRef] [Green Version]
- Drouet, C. Apatite Formation: Why It May Not Work as Planned, and How to Conclusively Identify Apatite Compounds. BioMed Res. Int. 2013, 2013, 490946. [Google Scholar] [CrossRef] [Green Version]
- Christoffersen, J.; Christoffersen, M.R.; Kibalczyc, W.; Andersen, F.A. A Contribution to the Understanding of the Formation of Calcium Phosphates. J. Cryst. Growth 1989, 94, 767–777. [Google Scholar] [CrossRef]
- Zhang, H.; Yan, Y.; Wang, Y.; Li, S. Morphology and Formation Mechanism of Hydroxyapatite Whiskers from Moderately Acid Solution 111. Mater. Res. 2002, 6, 111. [Google Scholar]
- Ko, H.-S.; Lee, S.; Jho, J. Synthesis and Modification of Hydroxyapatite Nanofiber for Poly(lactic acid) Composites with Enhanced Mechanical Strength and Bioactivity. Nanomaterials 2021, 11, 213. [Google Scholar] [CrossRef]
- Sugiura, Y.; Ishikawa, K. Effect of Calcium and Phosphate on Compositional Conversion from Dicalcium Hydrogen Phosphate Dihydrate Blocks to Octacalcium Phosphate Blocks. Crystals 2018, 8, 222. [Google Scholar] [CrossRef] [Green Version]
- Sugiura, Y.; Makita, Y. Sodium Induces Octacalcium Phosphate Formation and Enhances Its Layer Structure by Affecting the Hydrous Layer Phosphate. Cryst. Growth Des. 2018, 18, 6165–6171. [Google Scholar] [CrossRef]
- Cheng, F.; Cao, Q.; Guan, Y.; Cheng, H.; Wang, X.; Miller, J.D. FTIR analysis of water structure and its influence on the flotation of arcanite (K2SO4) and epsomite (MgSO4·7H2O). Int. J. Miner. Process. 2013, 122, 36–42. [Google Scholar] [CrossRef] [Green Version]
- Hirsch, A.; Azuri, I.; Addadi, L.; Weiner, S.; Yang, K.; Curtarolo, S.; Kronik, L. Infrared Absorption Spectrum of Brushite from First Principles. Chem. Mater. 2014, 26, 2934–2942. [Google Scholar] [CrossRef]
- Coldea, T.E.; Socaciu, C.; Fetea, F.; Ranga, F.; Pop, R.M.; Florea, M. Rapid Quantitative Analysis of Ethanol and Prediction of Methanol Content in Traditional Fruit Brandies from Romania, using FTIR Spectroscopy and Chemometrics. Not. Bot. Horti Agrobot. 2013, 41, 143–149. [Google Scholar] [CrossRef] [Green Version]
- Van Der Post, S.T.; Hsieh, C.-S.; Okuno, M.; Nagata, Y.; Bakker, H.J.; Bonn, M.; Hunger, J. Strong frequency dependence of vibrational relaxation in bulk and surface water reveals sub-picosecond structural heterogeneity. Nat. Commun. 2015, 6, 8384. [Google Scholar] [CrossRef] [Green Version]
- Burikov, S.; Dolenko, T.; Patsaeva, S.; Starokurov, Y.; Yuzhakov, V. Raman and IR spectroscopy research on hydrogen bonding in water-ethanol systems. Mol. Phys. 2010, 108, 2427–2436. [Google Scholar] [CrossRef]
- Xu, J.; Butler, I.S.; Gilson, D.F. FT-Raman and high-pressure infrared spectroscopic studies of dicalcium phosphate dihydrate (CaHPO4·2H2O) and anhydrous dicalcium phosphate (CaHPO4). Spectrochim. Acta Part A Mol. Biomol. Spectrosc. 1999, 55, 2801–2809. [Google Scholar] [CrossRef]
- Li, C.; Ge, X.; Li, G.; Bai, J.; Ding, R. Crystallization of dicalcium phosphate dihydrate with presence of glutamic acid and arginine at 37 °C. Mater. Sci. Eng. C 2014, 41, 283–291. [Google Scholar] [CrossRef]
- Toshima, T.; Hamai, R.; Tafu, M.; Takemura, Y.; Fujita, S.; Chohji, T.; Tanda, S.; Li, S.; Qin, G. Morphology control of brushite prepared by aqueous solution synthesis. J. Asian Ceram. Soc. 2014, 2, 52–56. [Google Scholar] [CrossRef]
- Rubini, K.; Boanini, E.; Bigi, A. Role of Aspartic and Polyaspartic Acid on the Synthesis and Hydrolysis of Brushite. J. Funct. Biomater. 2019, 10, 11. [Google Scholar] [CrossRef] [Green Version]
- Koletzko, B.; Baker, S.; Cleghorn, G.; Neto, U.F.; Gopalan, S.; Hernell, O.; Hock, Q.S.; Jirapinyo, P.; Lonnerdal, B.; Pencharz, P.; et al. Global Standard for the Composition of Infant Formula: Recommendations of an ESPGHAN Coordinated International Expert Group. J. Pediatr. Gastroenterol. Nutr. 2005, 41, 584–599. [Google Scholar] [CrossRef] [Green Version]
- Komlev, V.S.; Fadeeva, I.V.; Fomin, A.S.; Shvorneva, L.I.; Ferro, D.; Barinov, S.M. Synthesis of octacalcium phosphate by precipitation from solution. Dokl. Chem. 2010, 432, 178–182. [Google Scholar] [CrossRef]
- Ivanov, V.K.; Fedorov, P.P.; Baranchikov, A.Y.; Osiko, V.V. Oriented attachment of particles: 100 years of investigations of non-classical crystal growth. Russ. Chem. Rev. 2014, 83, 1204–1222. [Google Scholar] [CrossRef]
- van Santen, R.A. The Ostwald Step Rule. J. Phys. Chem. 1984, 88, 5768–5769. [Google Scholar] [CrossRef]
- Iijima, M. Modification of octacalcium phosphate growth by enamel proteins, fluoride, and substrate materials and influence of morphology on the performance of octacalcium phosphate biomaterials. Octacalcium Phosphate Biomater. 2020, 309, 309–347. [Google Scholar] [CrossRef]
- Toby, B.H. R factors in Rietveld analysis: How good is good enough? Powder Diffr. 2006, 21, 67–70. [Google Scholar] [CrossRef] [Green Version]
- Para, T.A.; Sarkar, S.K. Challenges in Rietveld Refinement and Structure Visualization in Ceramics. Adv. Ceram. Mater. 2021. [Google Scholar] [CrossRef]


| Temperatures | Cleaning | Reaction Time | ||||||
|---|---|---|---|---|---|---|---|---|
| Process No. | RT | 60 °C | W 1 | Not-W 2 | 1 min | 3 min | 30 min | 1 h |
| 1 | √ | √ | √ | √ | √ | √ | ||
| 2 | √ | √ | √ | √ | √ | √ | ||
| 3 | √ | √ | √ | √ | √ | √ | ||
| 4 | √ | √ | √ | √ | √ | √ | ||
| Temperature | pH | |||
|---|---|---|---|---|
| Process | RT | 60 °C | pH sol.1 1 | pH sol.2 2 |
| 1, 2 | √ | 9.00 | 9.40 | |
| 3, 4 | √ | 6.00 | 8.70 | |
Publisher’s Note: MDPI stays neutral with regard to jurisdictional claims in published maps and institutional affiliations. |
© 2022 by the authors. Licensee MDPI, Basel, Switzerland. This article is an open access article distributed under the terms and conditions of the Creative Commons Attribution (CC BY) license (https://creativecommons.org/licenses/by/4.0/).
Share and Cite
Ghajeri, F.; Leifer, K.; Larsson, A.; Engqvist, H.; Xia, W. The Influence of Residuals Combining Temperature and Reaction Time on Calcium Phosphate Transformation in a Precipitation Process. J. Funct. Biomater. 2022, 13, 9. https://doi.org/10.3390/jfb13010009
Ghajeri F, Leifer K, Larsson A, Engqvist H, Xia W. The Influence of Residuals Combining Temperature and Reaction Time on Calcium Phosphate Transformation in a Precipitation Process. Journal of Functional Biomaterials. 2022; 13(1):9. https://doi.org/10.3390/jfb13010009
Chicago/Turabian StyleGhajeri, Farnaz, Klaus Leifer, Anders Larsson, Håkan Engqvist, and Wei Xia. 2022. "The Influence of Residuals Combining Temperature and Reaction Time on Calcium Phosphate Transformation in a Precipitation Process" Journal of Functional Biomaterials 13, no. 1: 9. https://doi.org/10.3390/jfb13010009
APA StyleGhajeri, F., Leifer, K., Larsson, A., Engqvist, H., & Xia, W. (2022). The Influence of Residuals Combining Temperature and Reaction Time on Calcium Phosphate Transformation in a Precipitation Process. Journal of Functional Biomaterials, 13(1), 9. https://doi.org/10.3390/jfb13010009