
Biaxial Flexural Strength and Vickers Hardness of 3D-Printed and Milled 5Y Partially Stabilized Zirconia

 ,
, 
Abstract

1. Introduction
2. Materials and Methods
2.1. Materials
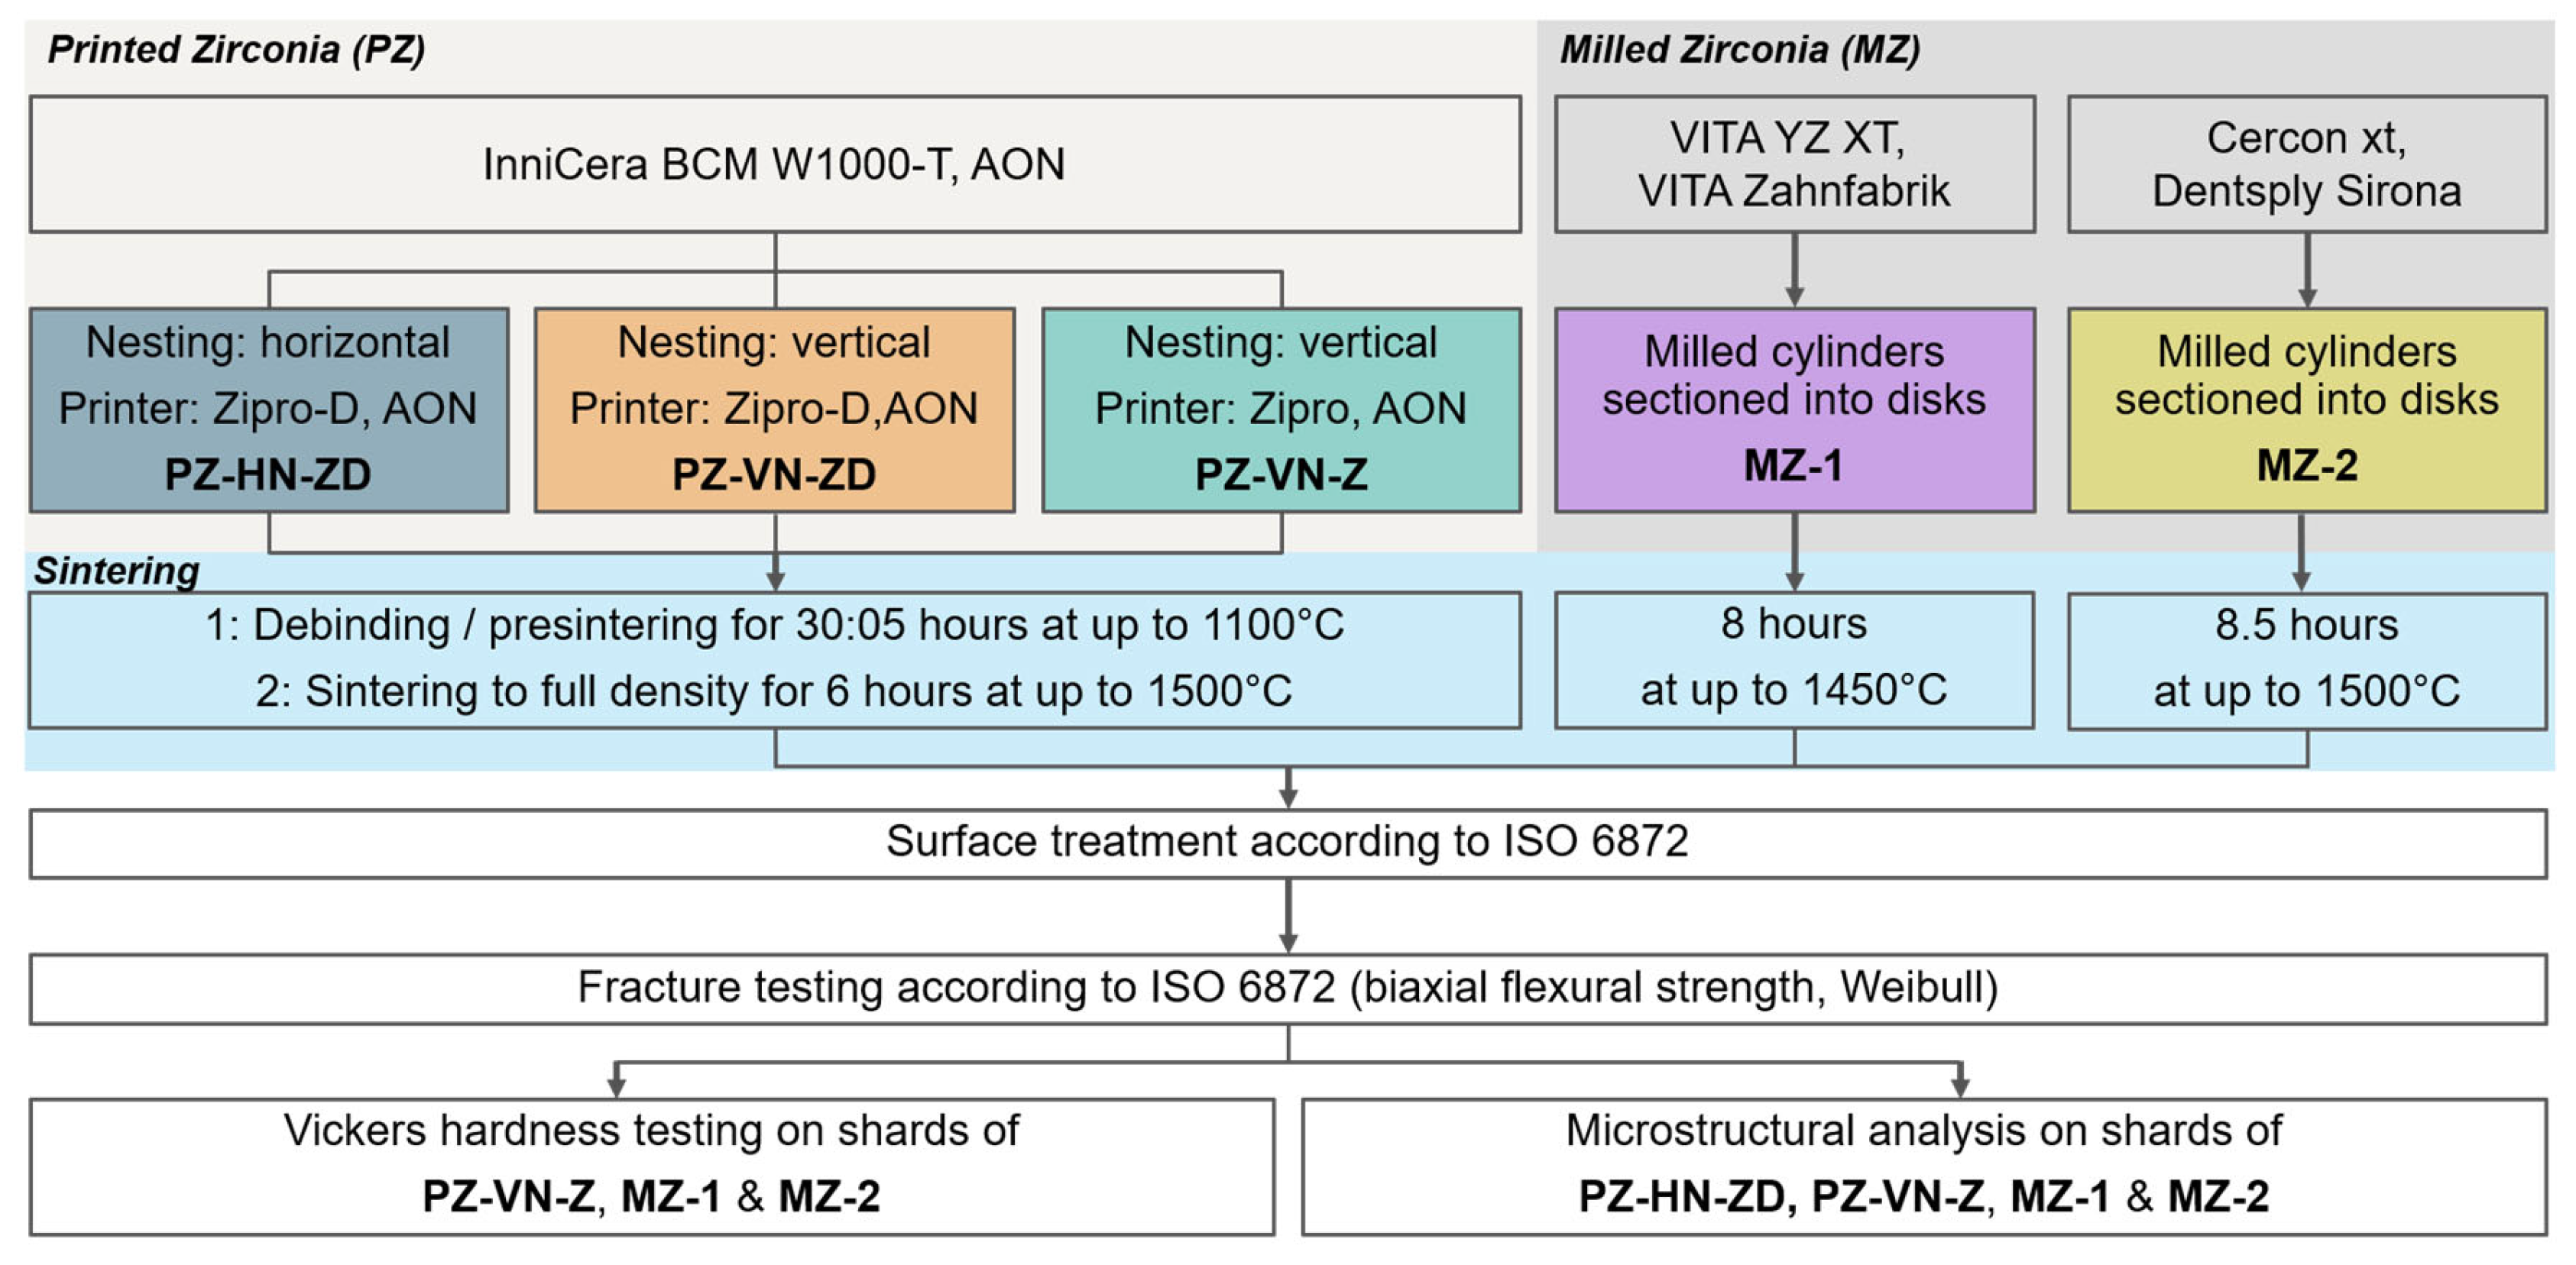
2.1.1. Sampling
- PZ: these samples were fabricated from a novel ceramic slurry, INNI-CERA-T (AON Co. Ltd., Seoul, Republic of Korea), via digital light processing followed by a firing process consisting of debinding and sintering. The three subgroups were as follows:
- a.
- PZ-HN-ZD: Horizontally nested (HN) PZ samples fabricated with the Zipro-D Dental printer (ZD; AON)
- b.
- PZ-VN-ZD: Vertically nested (VN) PZ samples fabricated with the Zipro-D Dental printer
- c.
- PZ-VN-Z: VN PZ samples printed using the Zipro Dental (Z; AON)
- MZ-1: MZ samples fabricated from VITA YZ XT (VITA Zahnfabrik, Bad Säckingen, Germany)
- MZ-2: MZ samples fabricated from Cercon xt (Dentsply Sirona, Bensheim, Germany)

| Material | Component [Weight %] | Flexural Strength [MPa] | |||
|---|---|---|---|---|---|
| ZrO2 | Y2O3 | HfO2 | Al2O3 | ||
| PZ | 88.5 | 8.2 | 2.7 | 0.1 | - |
| MZ-1 | 86–91 | 8–10 | 1–3 | 0–1 | >600 |
| MZ-2 | >86 | 9 | <3 | <2 | 750 |
2.1.2. Sample Size Determination
2.1.3. Sample Fabrication
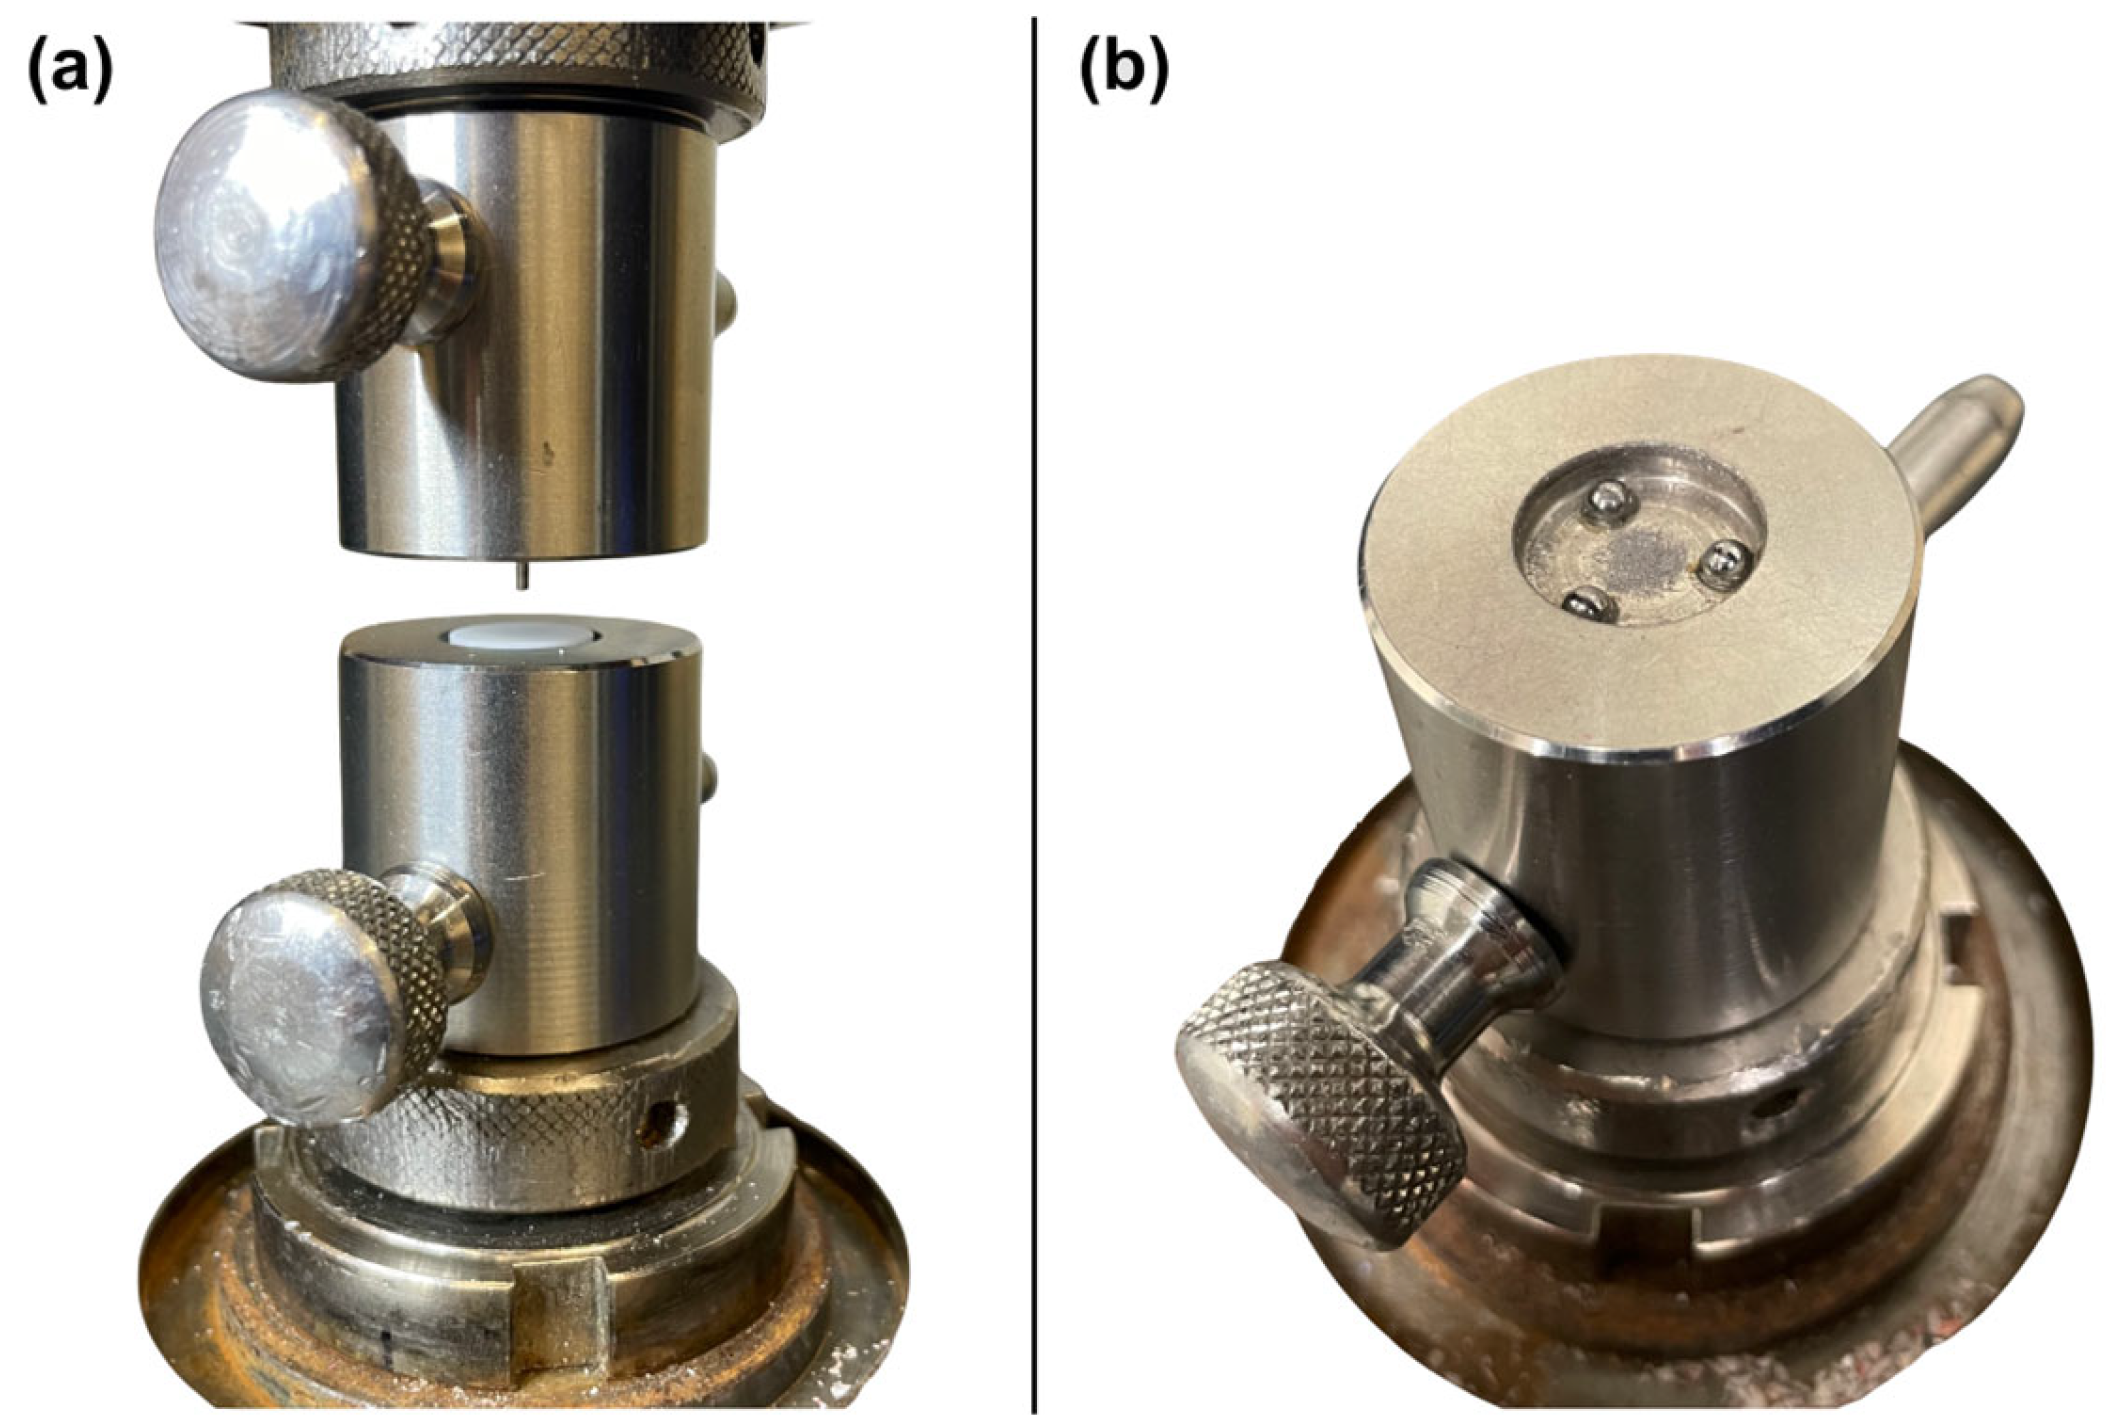
2.2. Biaxial Flexural Strength Tests
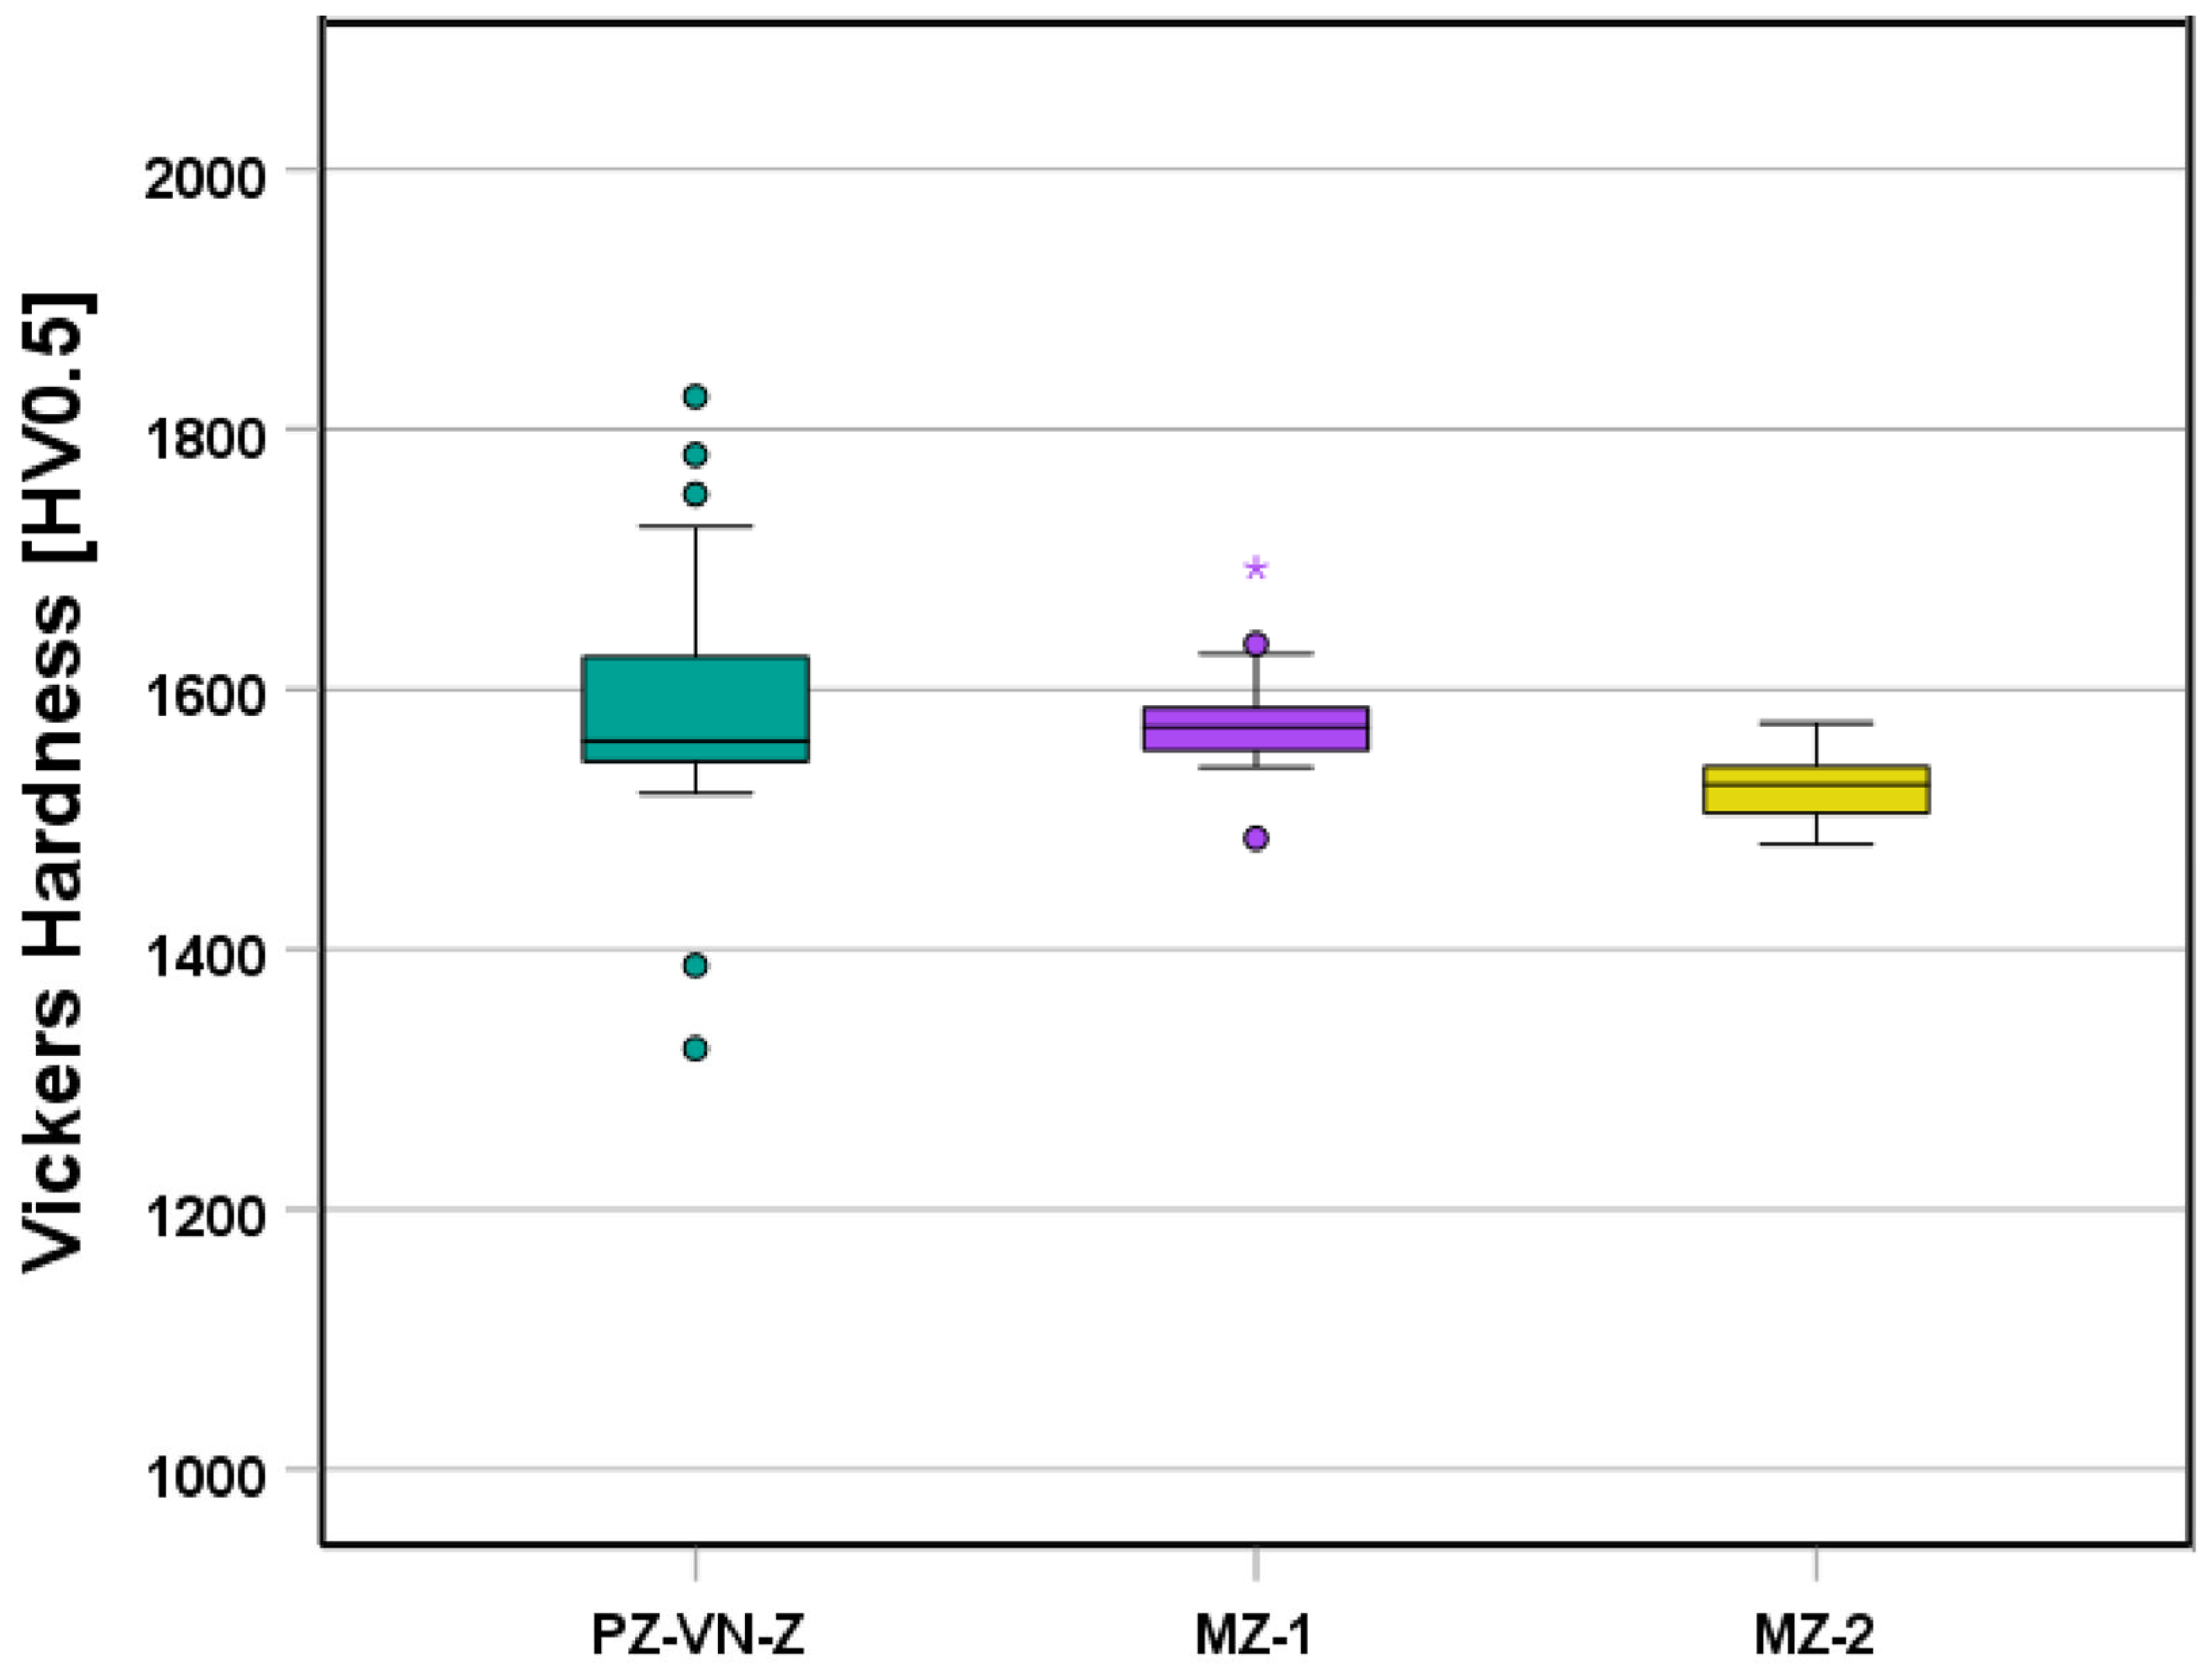
2.3. Vickers Hardness Measurement
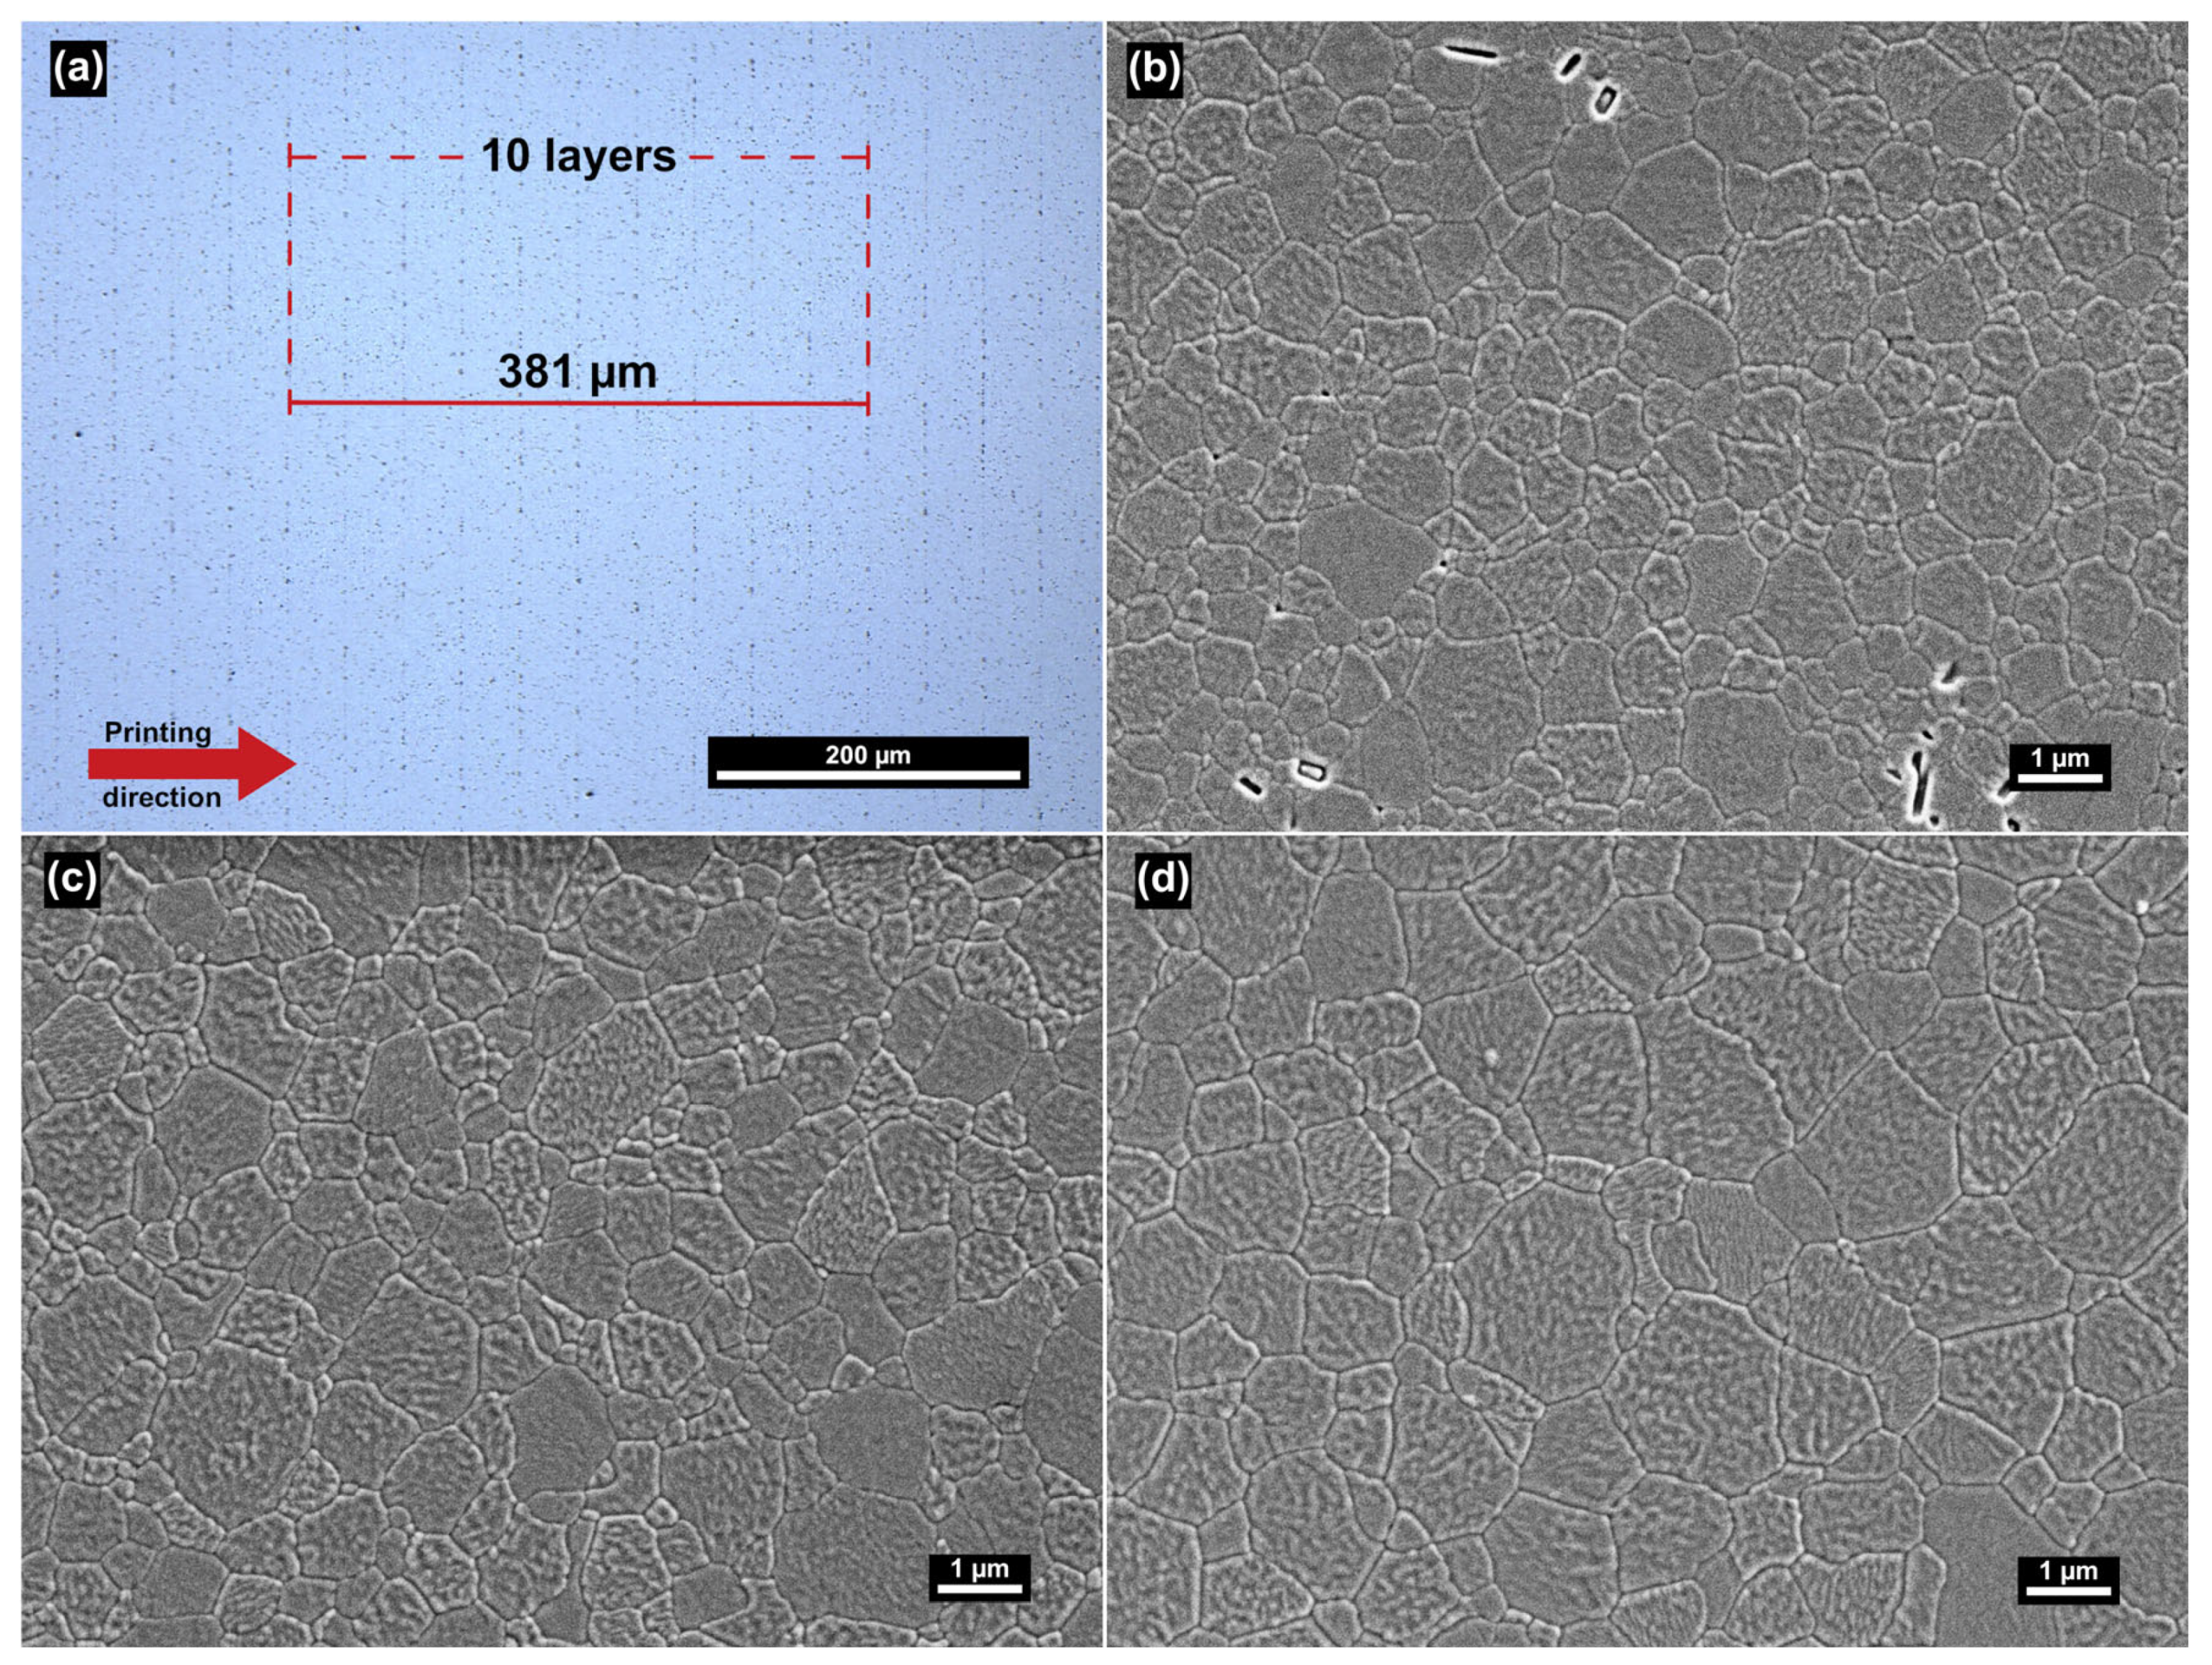
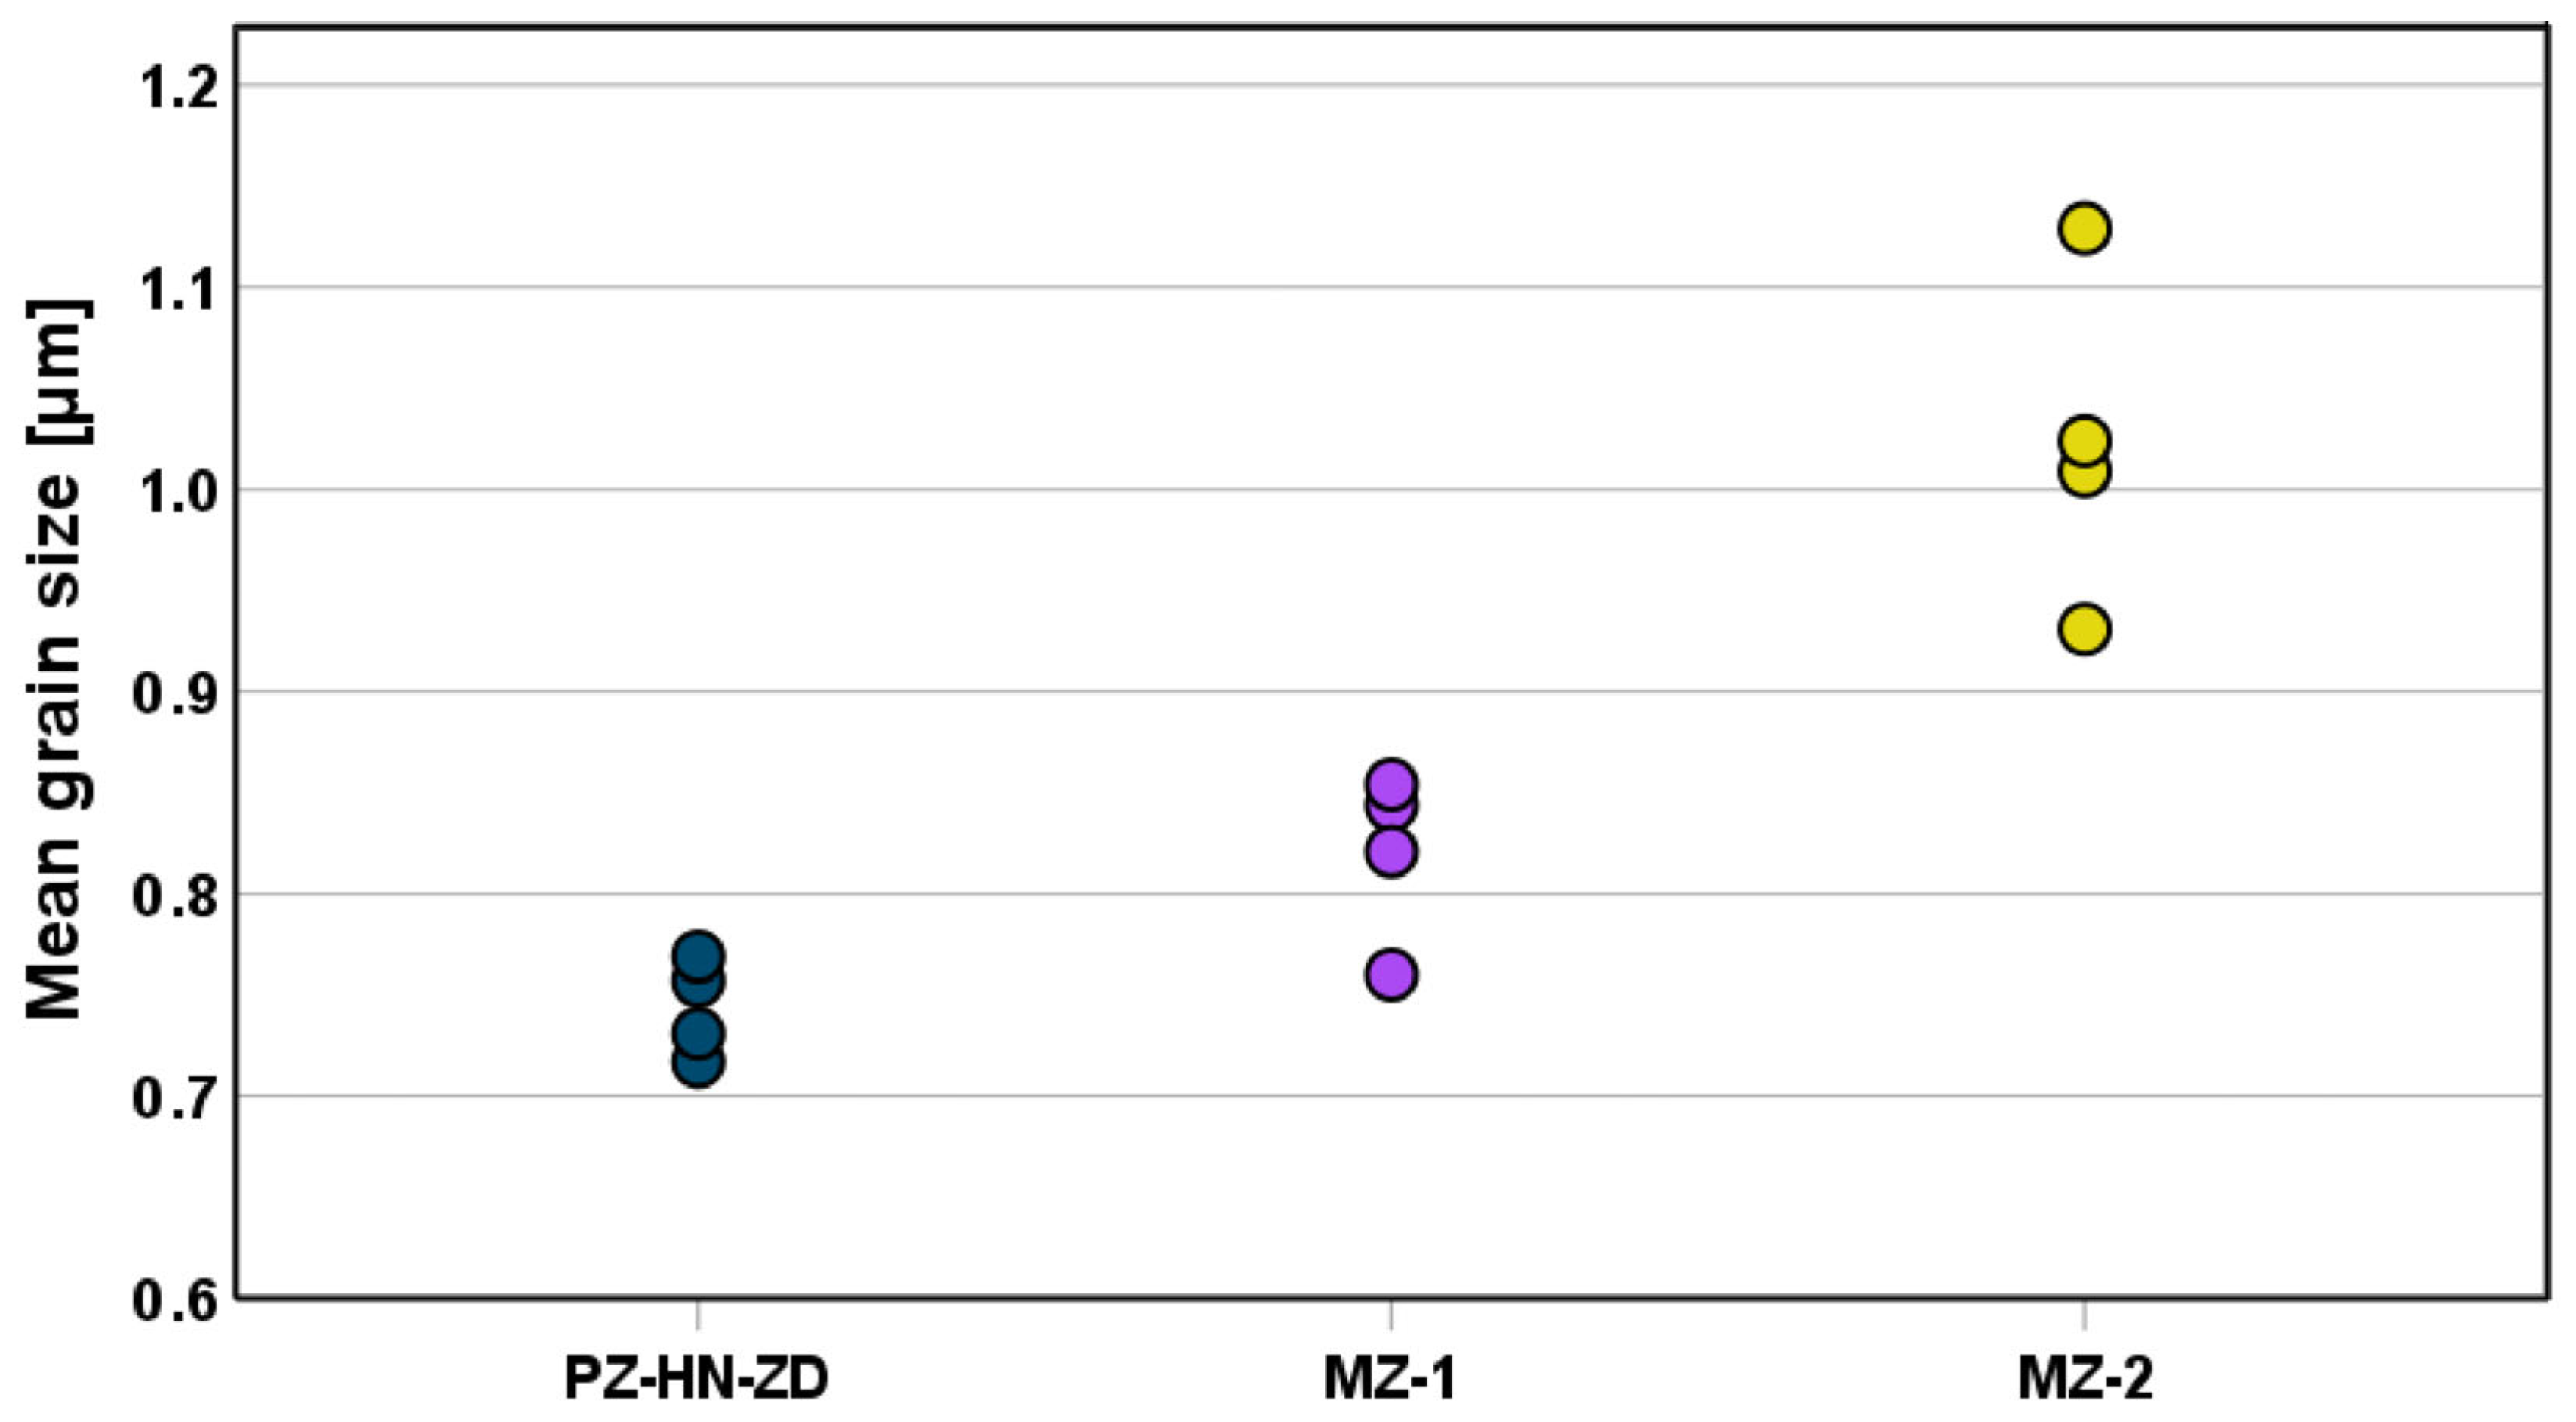
2.4. Imaging and Microstructural Analysis
2.5. Statistical Analysis
3. Results
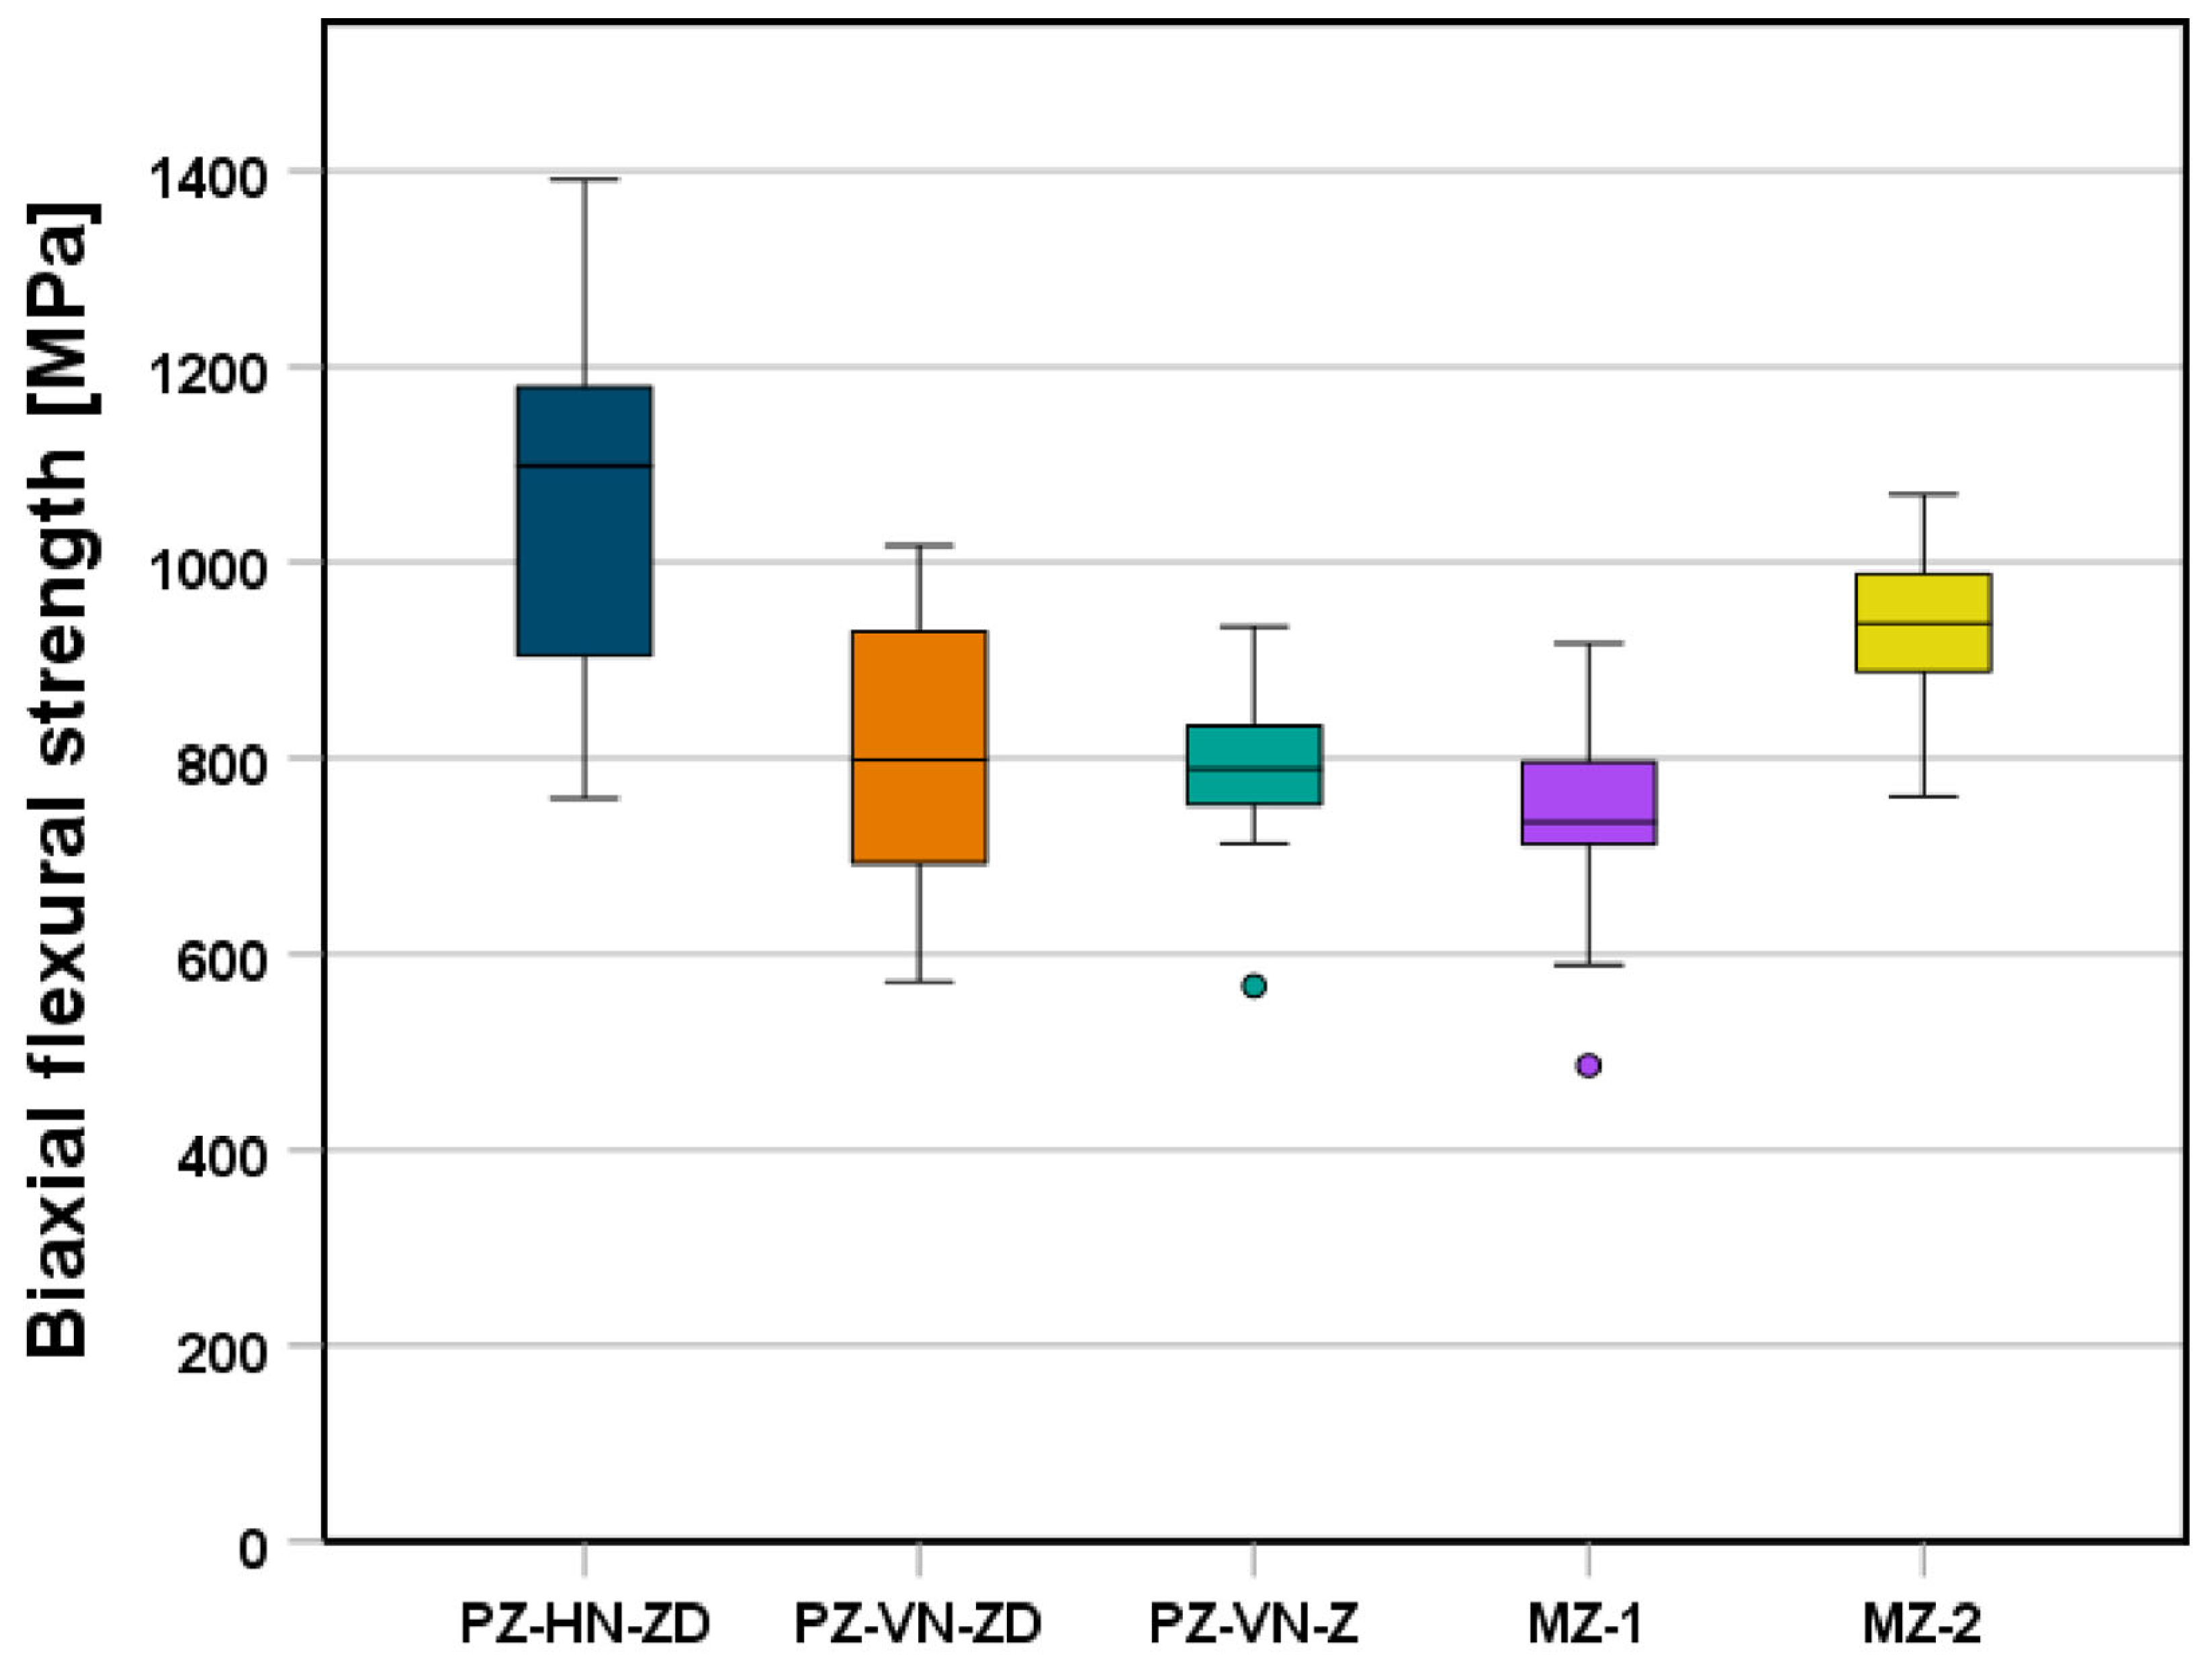
Biaxial Flexural Strength
4. Discussion
5. Conclusions
Author Contributions
Funding
Institutional Review Board Statement
Informed Consent Statement
Data Availability Statement
Acknowledgments
Conflicts of Interest
References
- Zhang, Y.; Lawn, B.R. Novel Zirconia Materials in Dentistry. J. Dent. Res. 2018, 97, 140–147. [Google Scholar] [CrossRef] [PubMed]
- Kongkiatkamon, S.; Rokaya, D.; Kengtanyakich, S.; Peampring, C. Current classification of zirconia in dentistry: An updated review. PeerJ 2023, 11, e15669. [Google Scholar] [CrossRef] [PubMed]
- Sulaiman, T.A.; Suliman, A.A.; Abdulmajeed, A.A.; Zhang, Y. Zirconia restoration types, properties, tooth preparation design, and bonding. A narrative review. J. Esthet. Restor. Dent. 2024, 36, 78–84. [Google Scholar] [CrossRef] [PubMed]
- Adabo, G.L.; Longhini, D.; Baldochi, M.R.; Bergamo, E.T.P.; Bonfante, E.A. Reliability and lifetime of lithium disilicate, 3Y-TZP, and 5Y-TZP zirconia crowns with different occlusal thicknesses. Clin. Oral. Investig. 2023, 27, 3827–3838. [Google Scholar] [CrossRef]
- Deckers, J.; Vleugels, J.; Kruthl, J.P. Additive Manufacturing of Ceramics: A Review. J. Ceram. Sci. Technol. 2014, 5, 245–260. [Google Scholar] [CrossRef]
- Schweiger, J.; Edelhoff, D.; Guth, J.F. 3D Printing in Digital Prosthetic Dentistry: An Overview of Recent Developments in Additive Manufacturing. J. Clin. Med. 2021, 10, 2010. [Google Scholar] [CrossRef]
- OECD. The Next Production Revolution; OECD: Paris, France, 2017. [Google Scholar]
- Rues, S.; Zehender, N.; Zenthofer, A.; Bomicke, W.; Herpel, C.; Ilani, A.; Erber, R.; Roser, C.; Lux, C.J.; Rammelsberg, P.; et al. Fit of anterior restorations made of 3D-printed and milled zirconia: An in-vitro study. J. Dent. 2023, 130, 104415. [Google Scholar] [CrossRef]
- Schweiger, J.; Edelhoff, D.; Schubert, O. 3D printing of ultra-thin veneers made of lithium disilicate using the LCM method in a digital workflow: A feasibility study. J. Esthet. Restor. Dent. 2024, 36, 588–594. [Google Scholar] [CrossRef]
- Bergler, M.; Korostoff, J.; Torrecillas-Martinez, L.; Mante, F.K. Ceramic Printing—Comparative Study of the Flexural Strength of 3D Printed and Milled Zirconia. Int. J. Prosthodont. 2022, 35, 777–783. [Google Scholar] [CrossRef]
- Zenthofer, A.; Schwindling, F.S.; Schmitt, C.; Ilani, A.; Zehender, N.; Rammelsberg, P.; Rues, S. Strength and reliability of zirconia fabricated by additive manufacturing technology. Dent. Mater. 2022, 38, 1565–1574. [Google Scholar] [CrossRef]
- Zenthofer, A.; Ilani, A.; Schmitt, C.; Rammelsberg, P.; Hetzler, S.; Rues, S. Biaxial flexural strength of 3D-printed 3Y-TZP zirconia using a novel ceramic printer. Clin. Oral. Investig. 2024, 28, 145. [Google Scholar] [CrossRef] [PubMed]
- Zenthofer, A.; Fien, D.; Rossipal, J.; Ilani, A.; Schmitt, C.; Hetzler, S.; Rammelsberg, P.; Rues, S. Fracture Resistance of 3D-Printed Occlusal Veneers Made from 3Y-TZP Zirconia. Materials 2024, 17, 2122. [Google Scholar] [CrossRef] [PubMed]
- Zhai, Z.; Qian, C.; Jiao, T.; Sun, J. In vitro fracture and fatigue resistance of monolithic zirconia crowns fabricated by stereolithography. J. Prosthet. Dent. 2023, in press. [Google Scholar] [CrossRef] [PubMed]
- Wang, B.; Arab, A.; Xie, J.; Chen, P. The Influence of Microstructure on the Flexural Properties of 3D Printed Zirconia Part via Digital Light Processing Technology. Materials 2022, 15, 1602. [Google Scholar] [CrossRef]
- Marsico, C.; Oilo, M.; Kutsch, J.; Kauf, M.; Arola, D. Vat Polymerization-Printed Partially Stabilized Zirconia: Mechanical Properties, Reliability and Structural defects. Addit. Manuf. 2020, 36, 101450. [Google Scholar] [CrossRef]
- Cameron, A.B.; Choi, J.J.E.; Ip, A.; Lyons, N.; Yaparathna, N.; Dehaghani, A.E.; Feih, S. Assessment of the trueness of additively manufactured mol3% zirconia crowns at different printing orientations with an industrial and desktop 3D printer compared to subtractive manufacturing. J. Dent. 2024, 144, 104942. [Google Scholar] [CrossRef]
- Faul, F.; Erdfelder, E.; Lang, A.G.; Buchner, A. G*Power 3: A flexible statistical power analysis program for the social, behavioral, and biomedical sciences. Behav. Res. Methods 2007, 39, 175–191. [Google Scholar] [CrossRef]
- ISO 6872:2015; Amd.1:2018; Zahnheilkunde—Keramische Werkstoffe. DIN Deutsches Institut für Normung: Berlin, Germany, 2018.
- ICE 61649:2008; Weibull-Analyse; Deutsche Fassung EN 61649:2008. DIN Deutsches Institut für Normung: Berlin, Germany, 2008.
- Arcila, L.V.C.; Ramos, N.C.; Campos, T.M.B.; Dapieve, K.S.; Valandro, L.F.; de Melo, R.M.; Bottino, M.A. Mechanical behavior and microstructural characterization of different zirconia polycrystals in different thicknesses. J. Adv. Prosthodont. 2021, 13, 385–395. [Google Scholar] [CrossRef]
- Yang, C.C.; Ding, S.J.; Lin, T.H.; Yan, M. Mechanical and optical properties evaluation of rapid sintered dental zirconia. Ceram. Int. 2020, 46, 26668–26674. [Google Scholar] [CrossRef]
- Phatphutthitham, C.; Niyatiwatchanchai, B.; Rujiraprasert, P.; Tagami, J.; Osathanon, T.; Srijunbarl, A.; Singthong, T.; Suriyasangpetch, S.; Nantanapiboon, D. Effect of Grinding and Polishing Protocols on Surface Roughness, Flexural Strength, and Phase Transformation of High-Translucent 5 mol% Yttria-Partially Stabilized Zirconia. Eur. J. Dent. 2024, 17. [Google Scholar] [CrossRef]
- Xu, Y.; Han, J.; Lin, H.; An, L. Comparative study of flexural strength test methods on CAD/CAM Y-TZP dental ceramics. Regen. Biomater. 2015, 2, 239–244. [Google Scholar] [CrossRef] [PubMed]
- Schatz, C.; Strickstrock, M.; Roos, M.; Edelhoff, D.; Eichberger, M.; Zylla, I.M.; Stawarczyk, B. Influence of Specimen Preparation and Test Methods on the Flexural Strength Results of Monolithic Zirconia Materials. Materials 2016, 9, 180. [Google Scholar] [CrossRef] [PubMed]
- Jin, J.; Takahashi, H.; Iwasaki, N. Effect of test method on flexural strength of recent dental ceramics. Dent. Mater. J. 2004, 23, 490–496. [Google Scholar] [CrossRef] [PubMed]
- Spintzyk, S.; Geis-Gerstorfer, J.; Bourauel, C.; Keilig, L.; Lohbauer, U.; Brune, A.; Greuling, A.; Arnold, C.; Rues, S.; Adjiski, R.; et al. Biaxial flexural strength of zirconia: A round robin test with 12 laboratories. Dent. Mater. 2021, 37, 284–295. [Google Scholar] [CrossRef] [PubMed]
- Sen, N.; Isler, S. Microstructural, physical, and optical characterization of high-translucency zirconia ceramics. J. Prosthet. Dent. 2020, 123, 761–768. [Google Scholar] [CrossRef]
- Uasuwan, P.; Juntavee, N.; Juntavee, A. Flexural strength of high yttrium oxide-doped monochrome and multilayered fully stabilized zirconia upon various sintered cooling rates. J. Prosthodont. 2023, 32, e118–e128. [Google Scholar] [CrossRef]
- Cho, M.H.; Seol, H.J. Effect of High-Speed Sintering on the Optical Properties, Microstructure, and Phase Distribution of Multilayered Zirconia Stabilized with 5 mol% Yttria. Materials 2023, 16, 5570. [Google Scholar] [CrossRef]
- Yousry, M.A.; Hammad, I.A.; El Halawani, M.T.; Aboushelib, M.N. Effect of sintering time on microstructure and optical properties of yttria-partially stabilized monolithic zirconia. Dent. Mater. 2023, 39, 1169–1179. [Google Scholar] [CrossRef]
- Liebermann, A.; Schultheis, A.; Faber, F.; Rammelsberg, P.; Rues, S.; Schwindling, F.S. Impact of post printing cleaning methods on geometry, transmission, roughness parameters, and flexural strength of 3D-printed zirconia. Dent. Mater. 2023, 39, 625–633. [Google Scholar] [CrossRef]
- Mirt, T.; Kocjan, A.; Hofer, A.K.; Schwentenwein, M.; Ivekovic, A.; Bermejo, R.; Jevnikar, P. Effect of airborne particle abrasion and regeneration firing on the strength of 3D-printed 3Y and 5Y zirconia ceramics. Dent. Mater. 2024, 40, 111–117. [Google Scholar] [CrossRef]
- Hergeroder, C.; Wille, S.; Kern, M. Comparison of Testing Designs for Flexural Strength of 3Y-TZP and 5Y-PSZ Considering Different Surface Treatment. Materials 2022, 15, 3915. [Google Scholar] [CrossRef] [PubMed]
- Kim, J.W.; Covel, N.S.; Guess, P.C.; Rekow, E.D.; Zhang, Y. Concerns of hydrothermal degradation in CAD/CAM zirconia. J. Dent. Res. 2010, 89, 91–95. [Google Scholar] [CrossRef] [PubMed]
- Kim, H.T.; Han, J.S.; Yang, J.H.; Lee, J.B.; Kim, S.H. The effect of low temperature aging on the mechanical property & phase stability of Y-TZP ceramics. J. Adv. Prosthodont. 2009, 1, 113–117. [Google Scholar] [CrossRef] [PubMed]
- Chevalier, J.; Cales, B.; Drouin, J.M. Low-temperature aging of Y-TZP ceramics. J. Am. Ceram. Soc. 1999, 82, 2150–2154. [Google Scholar] [CrossRef]
- Zhai, Z.; Sun, J. Research on the low-temperature degradation of dental zirconia ceramics fabricated by stereolithography. J. Prosthet. Dent. 2023, 130, 629–638. [Google Scholar] [CrossRef]
- Miura, S.; Shinya, A.; Ishida, Y.; Fujita, T.; Vallittu, P.; Lassila, L.; Fujisawa, M. The effect of low-temperature degradation and building directions on the mechanical properties of additive-manufactured zirconia. Dent. Mater. J. 2023, 42, 800–805. [Google Scholar] [CrossRef]
- Roser, C.J.; Erber, R.; Rammelsberg, P.; Lux, C.J.; Kurt, A.; Rues, S.; Schwindling, F.S.; Herpel, C. Osteoblast behaviour on zirconia fabricated by additive and subtractive technology. Ceram. Int. 2023, 49, 8793–8800. [Google Scholar] [CrossRef]
- Su, G.Y.; Zhang, Y.S.; Jin, C.Y.; Zhang, Q.Y.; Lu, J.R.; Liu, Z.Q.; Wang, Q.; Zhang, X.; Ma, J. 3D printed zirconia used as dental materials: A critical review. J. Biol. Eng. 2023, 17, 78. [Google Scholar] [CrossRef]
| Material | Nesting Orientation | Printer | n [-] | Flexural Strength [MPa] | Weibull Parameters | Vickers Hardness [HV0.5] | |||
|---|---|---|---|---|---|---|---|---|---|
| Mean Value | SD | σ0 [MPa] | m [-] | Mean Value | SD | ||||
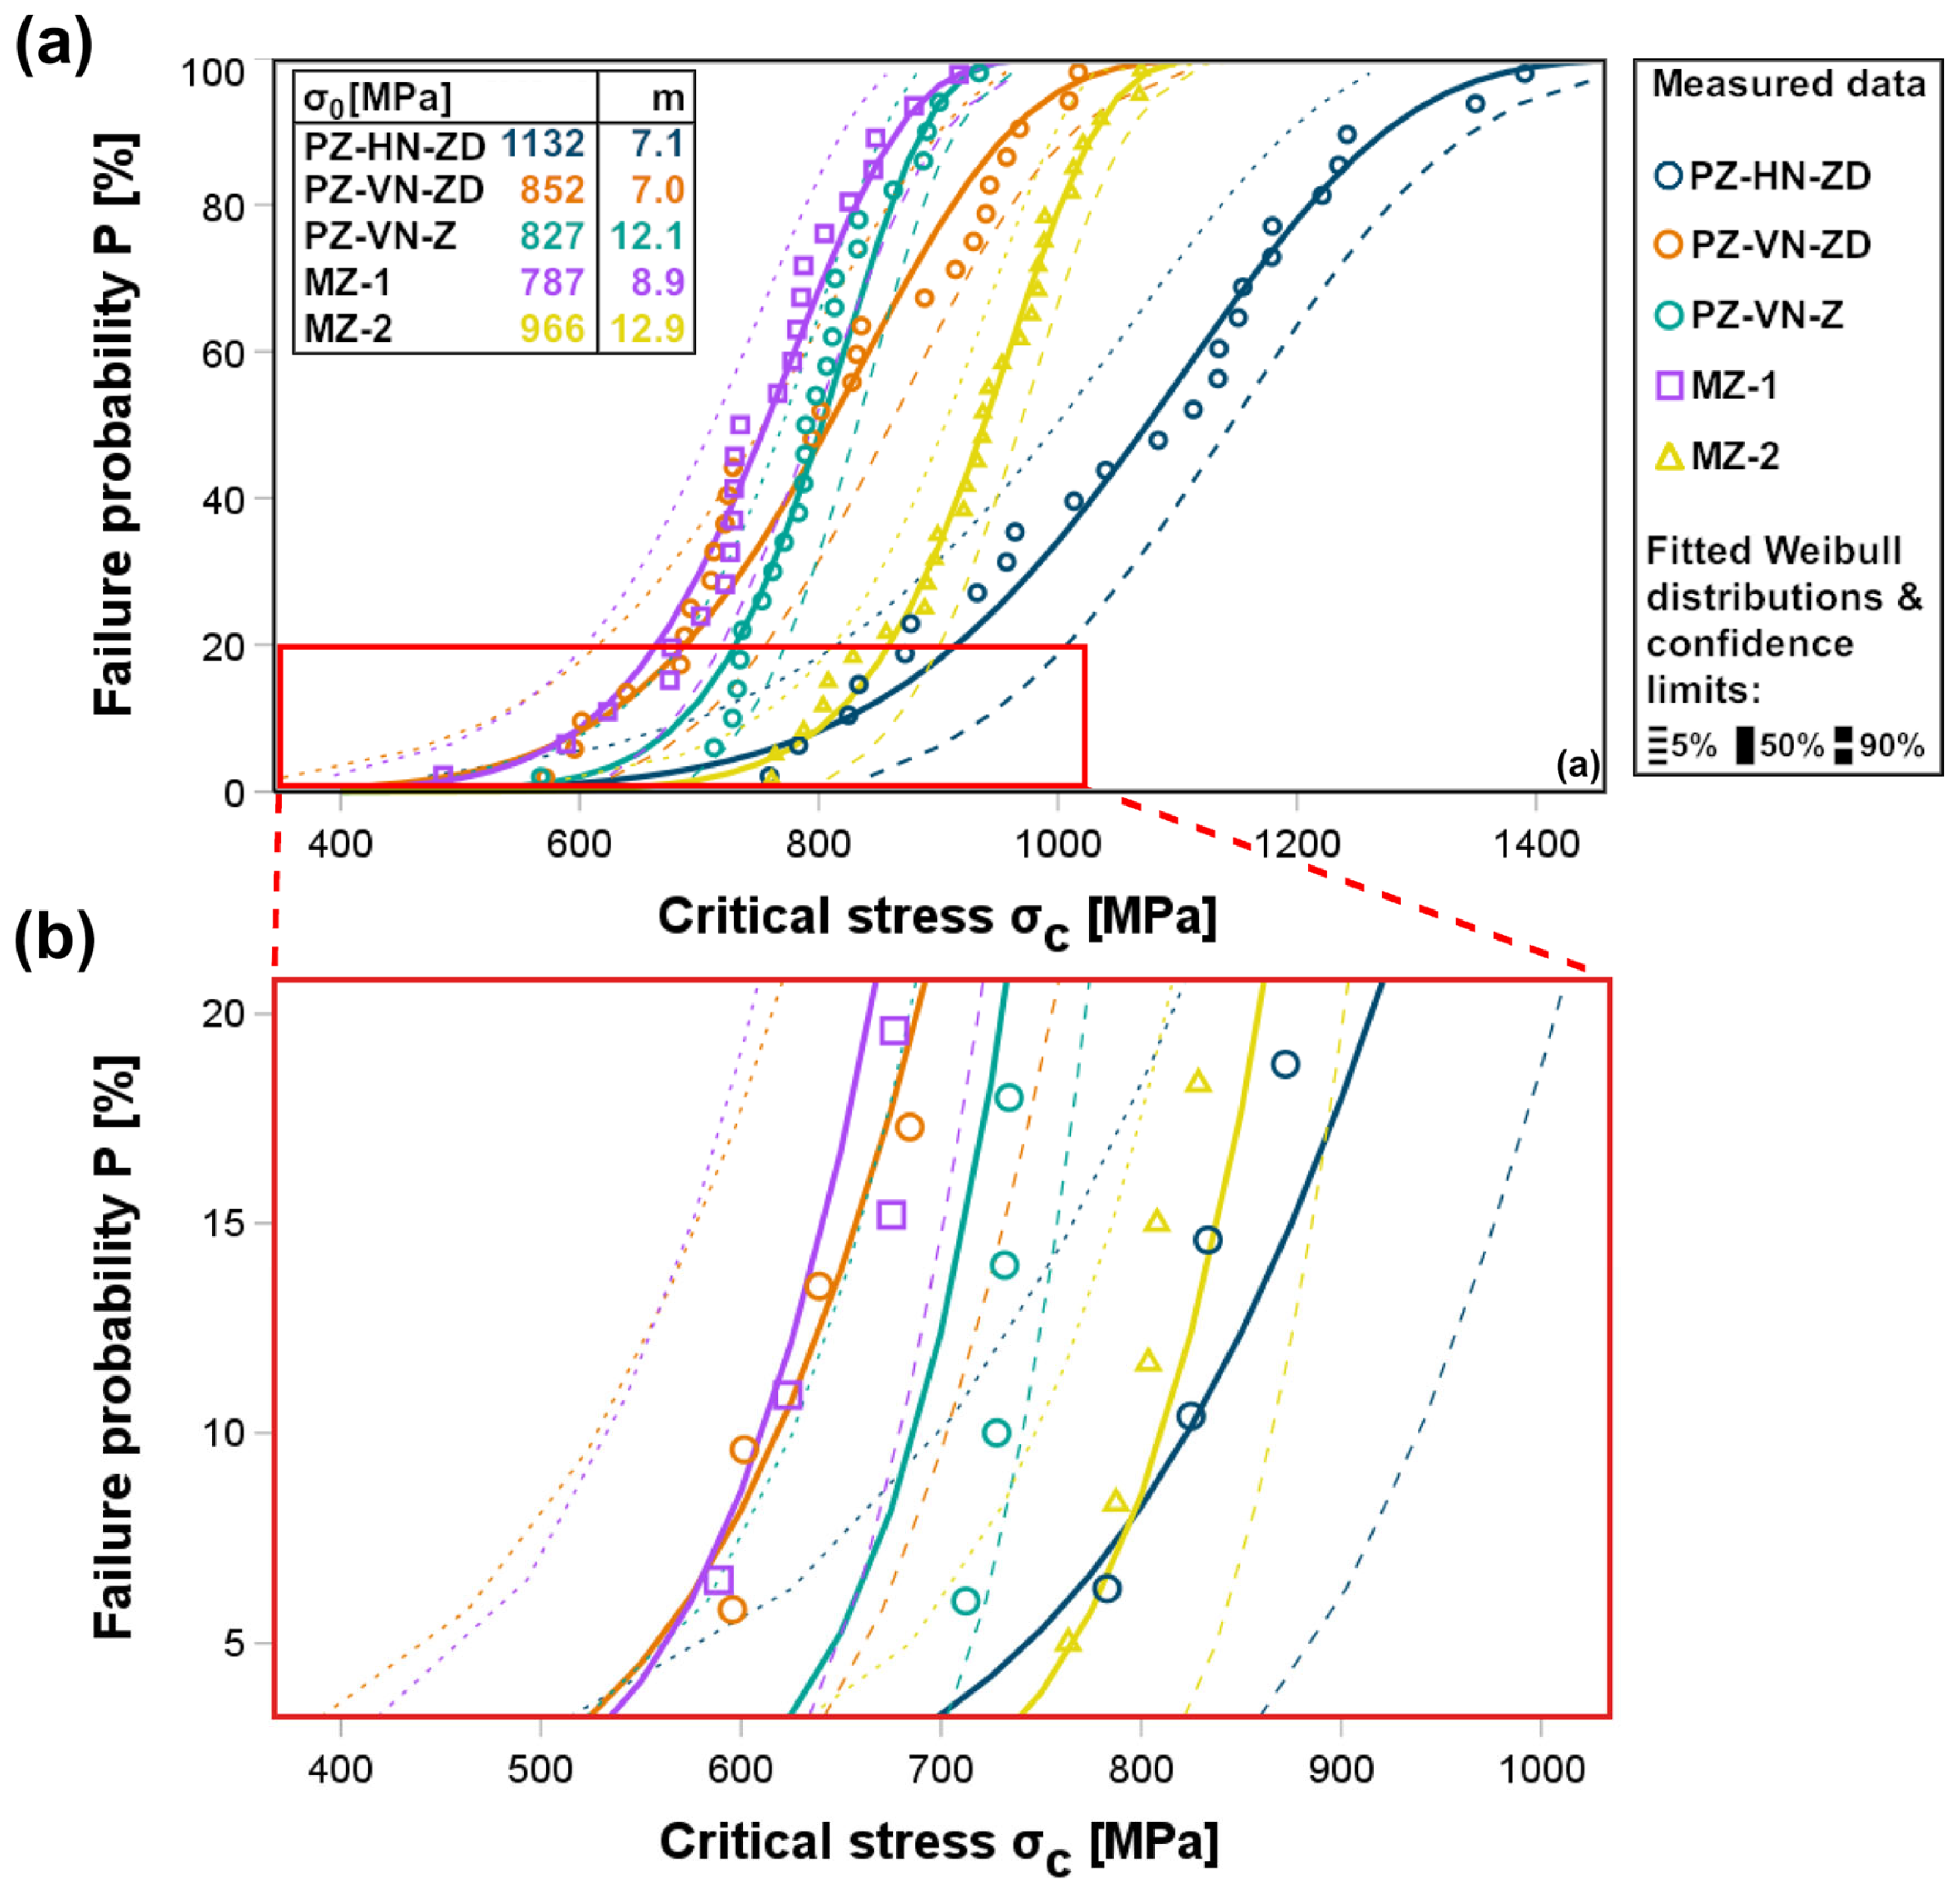
| PZ | HN | ZD | 24 | 1059 A | 178 | 1132 | 7.1 | - | - |
| VN | ZD | 26 | 797 B | 135 | 852 | 7.0 | - | - | |
| VN | Z | 25 | 793 B | 75 | 827 | 12.1 | 1590 A | 24 | |
| MZ-1 | - | - | 23 | 745 B | 96 | 787 | 8.9 | 1577 A | 9 |
| MZ-2 | - | - | 30 | 928 C | 87 | 966 | 12.9 | 1524 B | 4 |
Disclaimer/Publisher’s Note: The statements, opinions and data contained in all publications are solely those of the individual author(s) and contributor(s) and not of MDPI and/or the editor(s). MDPI and/or the editor(s) disclaim responsibility for any injury to people or property resulting from any ideas, methods, instructions or products referred to in the content. |
© 2025 by the authors. Licensee MDPI, Basel, Switzerland. This article is an open access article distributed under the terms and conditions of the Creative Commons Attribution (CC BY) license (https://creativecommons.org/licenses/by/4.0/).
Share and Cite
Hetzler, S.; Hinzen, C.; Rues, S.; Schmitt, C.; Rammelsberg, P.; Zenthöfer, A. Biaxial Flexural Strength and Vickers Hardness of 3D-Printed and Milled 5Y Partially Stabilized Zirconia. J. Funct. Biomater. 2025, 16, 36. https://doi.org/10.3390/jfb16010036
Hetzler S, Hinzen C, Rues S, Schmitt C, Rammelsberg P, Zenthöfer A. Biaxial Flexural Strength and Vickers Hardness of 3D-Printed and Milled 5Y Partially Stabilized Zirconia. Journal of Functional Biomaterials. 2025; 16(1):36. https://doi.org/10.3390/jfb16010036
Chicago/Turabian StyleHetzler, Sebastian, Carina Hinzen, Stefan Rues, Clemens Schmitt, Peter Rammelsberg, and Andreas Zenthöfer. 2025. "Biaxial Flexural Strength and Vickers Hardness of 3D-Printed and Milled 5Y Partially Stabilized Zirconia" Journal of Functional Biomaterials 16, no. 1: 36. https://doi.org/10.3390/jfb16010036
APA StyleHetzler, S., Hinzen, C., Rues, S., Schmitt, C., Rammelsberg, P., & Zenthöfer, A. (2025). Biaxial Flexural Strength and Vickers Hardness of 3D-Printed and Milled 5Y Partially Stabilized Zirconia. Journal of Functional Biomaterials, 16(1), 36. https://doi.org/10.3390/jfb16010036