Article

Aerobic Oil-Phase Cyclic Magnetic Adsorption to Synthesize 1D Fe2O3@TiO2 Nanotube Composites for Enhanced Visible-Light Photocatalytic Degradation

1
National Engineering Research Center of Industry Crystallization Technology, School of Chemical Engineering and Technology, Tianjin University, Tianjin 300072, China
2
Co-Innovation Center of Chemical Science and Engineering, Tianjin 300072, China
3
Department of Chemistry, School of Science, Tianjin Chengjian University, Tianjin 300384, China
*
Authors to whom correspondence should be addressed.
Nanomaterials 2020, 10(7), 1345; https://doi.org/10.3390/nano10071345
Submission received: 24 June 2020 / Revised: 7 July 2020 / Accepted: 8 July 2020 / Published: 9 July 2020
(This article belongs to the Special Issue Nanomaterials and Nanotechnology in Wastewater Treatment)

Abstract

:
In this work, Fe2O3@TiO2 nanostructures with staggered band alignment were newly designed by an aerobic oil-phase cyclic magnetic adsorption method. XRD and TEM analyses were performed to verify the uniform deposition of Fe2O3 nanoparticles on the nanotube inner walls of TiO2. The steady-state degradation experiments exhibited that 1FeTi possessed the most superior performance, which might be ascribable to the satisfying dark adsorption capacity, efficient photocatalytic activity, ease of magnetic separation, and economic efficiency. These results indicated that the deposition of Fe2O3 into TiO2 nanotubes significantly enhanced the activity of Fe2O3, which was mainly ascribed to the Fe2O3-induced formation of staggered iron oxides@TiO2 band alignment and thus efficient separation of h+ and e. Furthermore, the PL intensity and lifetime of the decay curve were considered as key criterions for the activity’s evaluation. Finally, the leaching tests and regeneration experiments were also performed, which illustrated the inhibited photodissolution compared with TiO2/Fe3O4 and stable cycling ability, enabling 1FeTi to be a promising magnetic material for photocatalytic water remediation.

Graphical Abstract

1. Introduction

In recent years, water pollution has become an international environmental problem that constricts the development of human health, economy and sustainability [1,2]. To solve this problem, various efficient technologies have been developed and employed to purify wastewater, such as photocatalysis, adsorption, chemical precipitation, and membrane filtration [3,4,5,6]. Among them, photocatalysis has been regarded as a promising approach due to its convenient operation, effective remediation and low environmental impacts [7,8]. Among the well-studied photocatalysts, nano iron oxides including α-Fe2O3, γ-Fe2O3 and Fe3O4 have received extensive investigations and increasing attentions in the field of photocatalytic decontamination, benefiting from low cost, nontoxicity, large surface area, and especially strong absorption in the visible light region [9,10]. Moreover, the favorable magnetism of iron oxides makes the recovery of catalysts more convenient and economical via applying an external magnetic field for cyclic utilization after wastewater treatment [11].
However, the major drawbacks of iron oxides including low charge carriers’ mobility and rapid photogenerated electron–hole recombination rate restrict its practical applications in photocatalysis [12]. Consequently, various strategies were developed to enhance its photocatalytic properties, such as controlling diverse morphologies (e.g., nanoparticles, nanocubes and nanodiscs) [13], doping metal or non-metal ions such as Ca and I [14,15], and coupling with other semiconductors to generate satisfactory photocatalytic heterostructures. Among them, the coupling strategy with other semiconductors has been receiving extensive attentions since these heterostructures can efficiently suppress recombination rates and promote transportation rates of photo-generated charge carriers. For instance, the heterogeneous photocatalysts including α-Fe2O3@AgCO3 [16], γ-Fe2O3@Mn3O4 [17] and Fe3O4@TiO2 [18] all displayed significantly increased photocatalytic performance compared with pure iron oxides.
Among the various semiconductors combined with iron oxides, TiO2 has been extensively investigated for their stable, nontoxic and economical properties [19,20]. Particularly, abundant attentions have been given to 1D TiO2 nanotubes (abbreviated as TNT in this article) due to their unique 1D nanotube architectures accompanied with superior charge transport property and large internal surface to disperse doped iron oxides nanoparticles [21,22,23]. Especially, the constructed heterostructures of TiO2 and iron oxides could further enhance the separation of charge carriers in this heterostructure. Recently, the majority of the researches on FexOy@TNT nanocomposites focused on Fe3O4@TNT composites [24,25]. Unfortunately, the narrow bandgap of Fe3O4 brought serious photodissolution of Fe3O4, which would deactivate the composites and induce the decrease of photocatalytic performance [25]. As a result, iron oxide species with larger bandgaps such as Fe2O3 (bandgap ~2.3 eV) rather than Fe3O4 with narrow bandgap (0.1 eV), are more beneficial for the separation of photo-induced charge carriers in the heterojunctions [26,27]. On the other hand, Fe2O3 possesses higher chemical stability than Fe3O4 at room temperature, which can be oxidized in the presence of oxygen. From this point of view, it is reasonable to believe that introducing Fe2O3 nanoparticles into TiO2 nanotubes would significantly enhance the separation of charge carriers in Fe2O3@TiO2 heterojunctions. Furthermore, the excellent magnetic property of Fe2O3 would make them easier to be recycled and regenerated in the photocatalytic decontamination research, which is considered as a sustainable material for future applications [11]. Although Fe2O3@TNT composites have bright prospects and potential applications in photocatalytic water remediation, efficient methods to synthesize TiO2 nanotubes with uniform Fe2O3 nanoparticles deposition still need to be developed since the agglomeration of Fe2O3 nanoparticles would act as the recombination center and accelerate the destruction of excitons. The extensively used manner to prepare this heterostructure is the dipping method, which is limited by the low-dispersion loading and severe agglomeration under high deposition [28,29]. In our previous work, an anaerobic oil-phase cyclic magnetic adsorption (OCMA) method was developed to uniformly deposit Fe3O4 nanoparticles into TNT, which would provide inspiration to inhibit the agglomeration of Fe2O3 nanoparticles in this work. Especially, although the carbon species was introduced into the designed Fe3O4@TiO2 composites to inhibit the migration of e- towards Fe3O4, 13.5% (in 3 h) of Fe3O4 in the prepared Fe3O4@C@TiO2 composites were still photo-dissolved, which might induce poor recycling performance [27]. As a result, the wide-bandgap Fe2O3 nanoparticles, instead of narrow-bandgap Fe3O4, were designed for fabricating Fe2O3@TiO2 composites with enhanced photocatalytic performance and inhibited photo dissolution. Especially, the designed Fe2O3@TiO2 heterostructures avoid the incorporation of carbon materials, which might have unassessed toxicity to the environment. Nevertheless, there was little work on the synthesis method and photocatalytic investigation of TiO2 nanotubes with uniform deposition of Fe2O3 nanoparticles.
In this work, uniform 1D magnetic Fe2O3@TNT composites with excellent dispersive Fe2O3 deposition were newly synthesized through a new aerobic OCMA method. This new synthesizing method is more convenient and economical compared with other reported methods. Moreover, the photocatalytic performance of these nanocomposites containing different amounts of Fe2O3 under visible light irradiation were evaluated and discussed. The results indicated that there was an optimum amount of Fe2O3 deposition, which could be well explained by the physicochemical properties including Fe2O3 dispersion, PL intensity and charge carriers’ lifetime. Finally, the photo dissolution of the obtained composites was further examined by the leaching experiments and the results indicated superior repression of photo dissolution and stable regeneration of Fe2O3@TiO2 compared with Fe3O4@TiO2 and Fe3O4@C@TiO2.

2. Materials and Methods

2.1. Materials and Reagents

Titanium foil (10 × 25 mm2, 0.1 mm thickness, ≥99.5%) was purchased from Beijing Qianshuo Non-ferrous Metal Co., Ltd. (Beijing, China). FeCl3·6H2O (≥99 wt%), FeSO4·7H2O (≥99 wt%) and NH4F (≥99.5 wt%) were supplied by Aladdin Co., Ltd. (Tianjin, China). n-hexane (C6H14), ethanol (C2H5OH), ethylene glycol ((CH2OH)2), oleic acid (C18H34O2), Rhodamine B (RhB), and ammonia water (NH3·H2O, 25 wt%) were provided by Guangfu Co., Ltd. (Tianjin, China). All reagents were analytical grade and used as received without further purification.

2.2. Synthesis of TiO2 Nanotubes

Electrochemical anodization was applied to synthesize self-organized porous TNT [30]. Prior to anodization, the Ti foils were ultrasonically treated in n-hexane, followed with dipping in ethanol and deionized water respectively, and then dried in a nitrogen stream. Then, the Ti foils were anodized under constant potential (60 V) for 4 h in a two-electrode system where Ti served as the working electrode and platinum (Pt) foil served as the counter electrode. The electrolyte was an ethylene glycol solution containing NH4F (0.135 M) and H2O (2% in volume). After anodization, the as-anodized samples were ultrasonically cleaned in ethanol for 5 min to remove surface debris and then stored in hexane for further deposition.

2.3. Synthesis of Fe3O4@oleic Acid

Fe3O4@oleic acid nanoparticles were prepared by chemical co-precipitation method [31]. The procedure was as follows: FeCl3·6H2O (140 mmol) and FeSO4·7H2O (70 mmol) were dissolved into 100 mL deionized water and then the solution was heated to 80 °C in 20 min with vigorous stirring. Then, 3 mL oleic acid and 15 mL ammonia water were added rapidly into this solution. After stirring for 1 h, the black magnetic gel was cooled to 25 °C and separated by magnetic decantation. The precipitated particles were washed several times by ethanol to remove the excess oleic acid, followed by drying in vacuum oven at 60 °C for 12 h.

2.4. Synthesis of 1D Fe2O3@TiO2 Nanotube Composites

Fe2O3@TiO2 nanotube composites were first synthesized via an aerobic OCMA method [27]. Firstly, certain amounts of Fe3O4@oleic acid were ultrasonically dispersed in hexane and this suspension was filtered to remove the undispersed particles thoroughly and prepare a homogeneous solution of 1 g/L Fe3O4@oleic acid (The preparation of 1 g/L Fe3O4@oleic acid solution: Firstly, certain amounts (marked as M1) of Fe3O4@oleic acid were ultrasonically dispersed in hexane. Then, this suspension was filtered to remove the undispersed particles thoroughly. The mass of these undispersed particles can be determined and marked as M2. Therefore, the real amounts of Fe3O4@oleic acid dissolved in hexane can be calculated by M 1 M 2 . After adding hexane to a certain volume, the concentration of “Fe3O4@oleic acid” in the homogeneous solution can be confirmed). Then, different volumes of the homogeneous solution (0.5 mL, 1 mL, 2 mL) were added onto the anodized TNT arrays under the effect of an external magnetic field beneath the TNT arrays, as shown in Scheme 1. It should be noticed that magnetic force played a vital role in loading Fe3O4@oleic acid nanoparticles into TiO2 nanotubes and the volatilization of hexane also made a contribution. Finally, these 0.5, 1, and 2 mL suspension-loaded TNT arrays were annealed at 450 °C for 2 h in air atmosphere to obtain Fe2O3@TNT composites with high crystallinity, which were recorded as 0.5FeTi, 1FeTi and 2FeTi, respectively. In addition, Fe3O4@oleic acid was also annealed at the same conditions to prepare pure Fe2O3 nanoparticles for comparative experiments.

2.5. Photocatalytic Experiments

For assessments of the photocatalytic activity of the samples, Rhodamine B (RhB) solutions in concentration of 10 mg/L were first prepared. Then, 70 mg as-prepared catalysts (Fe2O3, 0.5FeTi, 1FeTi and 2FeTi) were suspended into 70 mL RhB solutions, respectively. After dark adsorption for 2 h and reaching equilibrium, the mixed solutions were illuminated for 6 h under visible light (λ ≥ 400 nm) using a 300 W Xenon lamp (light intensity of 90 mW·cm−2 at distance of 15 cm from the light source). During the photocatalytic experiments, 3 mL samples of the mixed solutions were taken out and centrifuged at a given time interval. Finally, the photocatalytic activity was analyzed by UV−vis absorption measurement of the characteristic peak of RhB at 554 nm. For each sample, all photocatalytic experiments were carried out for irradiation duration of 6 h at 20 °C and were repeated three times.

2.6. Characterizations

The obtained samples were characterized by an XRD diffractometer (Rigaku, D/max 2500, Cu Kα radiation, λ = 1.5418 Å, Tokyo, Japan) within the scanning angle range of 15°–60° at rate of 8° min−1. The morphology was studied by scanning electron microscopy (SEM, Nanosem 430, FEI, Eindhoven, The Netherlands) and high-resolution transmission electron microscopy (HRTEM, Tecnai G20&F20, FEI, Eindhoven, The Netherlands). UV-Vis measurements were performed on a Hitachi U4100 UV Spectrometer and Fluorescence spectra were measured with FLS980 Series of Fluorescence Spectrometers (excited at λ = 420 nm). X-ray photoelectron spectroscopy (XPS, ESCALAB 250XI, Thermo, MA, USA) with monochromatic Al Kα (1486.6 eV) X-ray source was employed to analyze elemental contents and the chemical states of these composites. All the binding energies were calibrated by contaminant carbon at 284.8 eV. BET surface areas, BJH pore volume and average pore size were determined by N2 adsorption–desorption isotherms, which was measured by SSA-7000 (BJ Builder, Beijing, China). FTIR spectra were recorded on Bruker Alpha spectrometer from 4000 to 400 cm−1 (Regensburg, Germany). The magnetic properties were measured by vibrating sample magnetometer (VSM, MPMS SQUID XL, Quantum Design, Santiago, MN, USA) in the field from −20,000 to 20,000 Oe. High-resolution mass spectra (HR-MS) were measured by a mass spectrometer (Bruker, solanX 70 FT-MS, Regensburg, Germany) in electrospray ionization (ESI) mode.

3. Results and Discussion

3.1. Structural and Elemental Characterizations

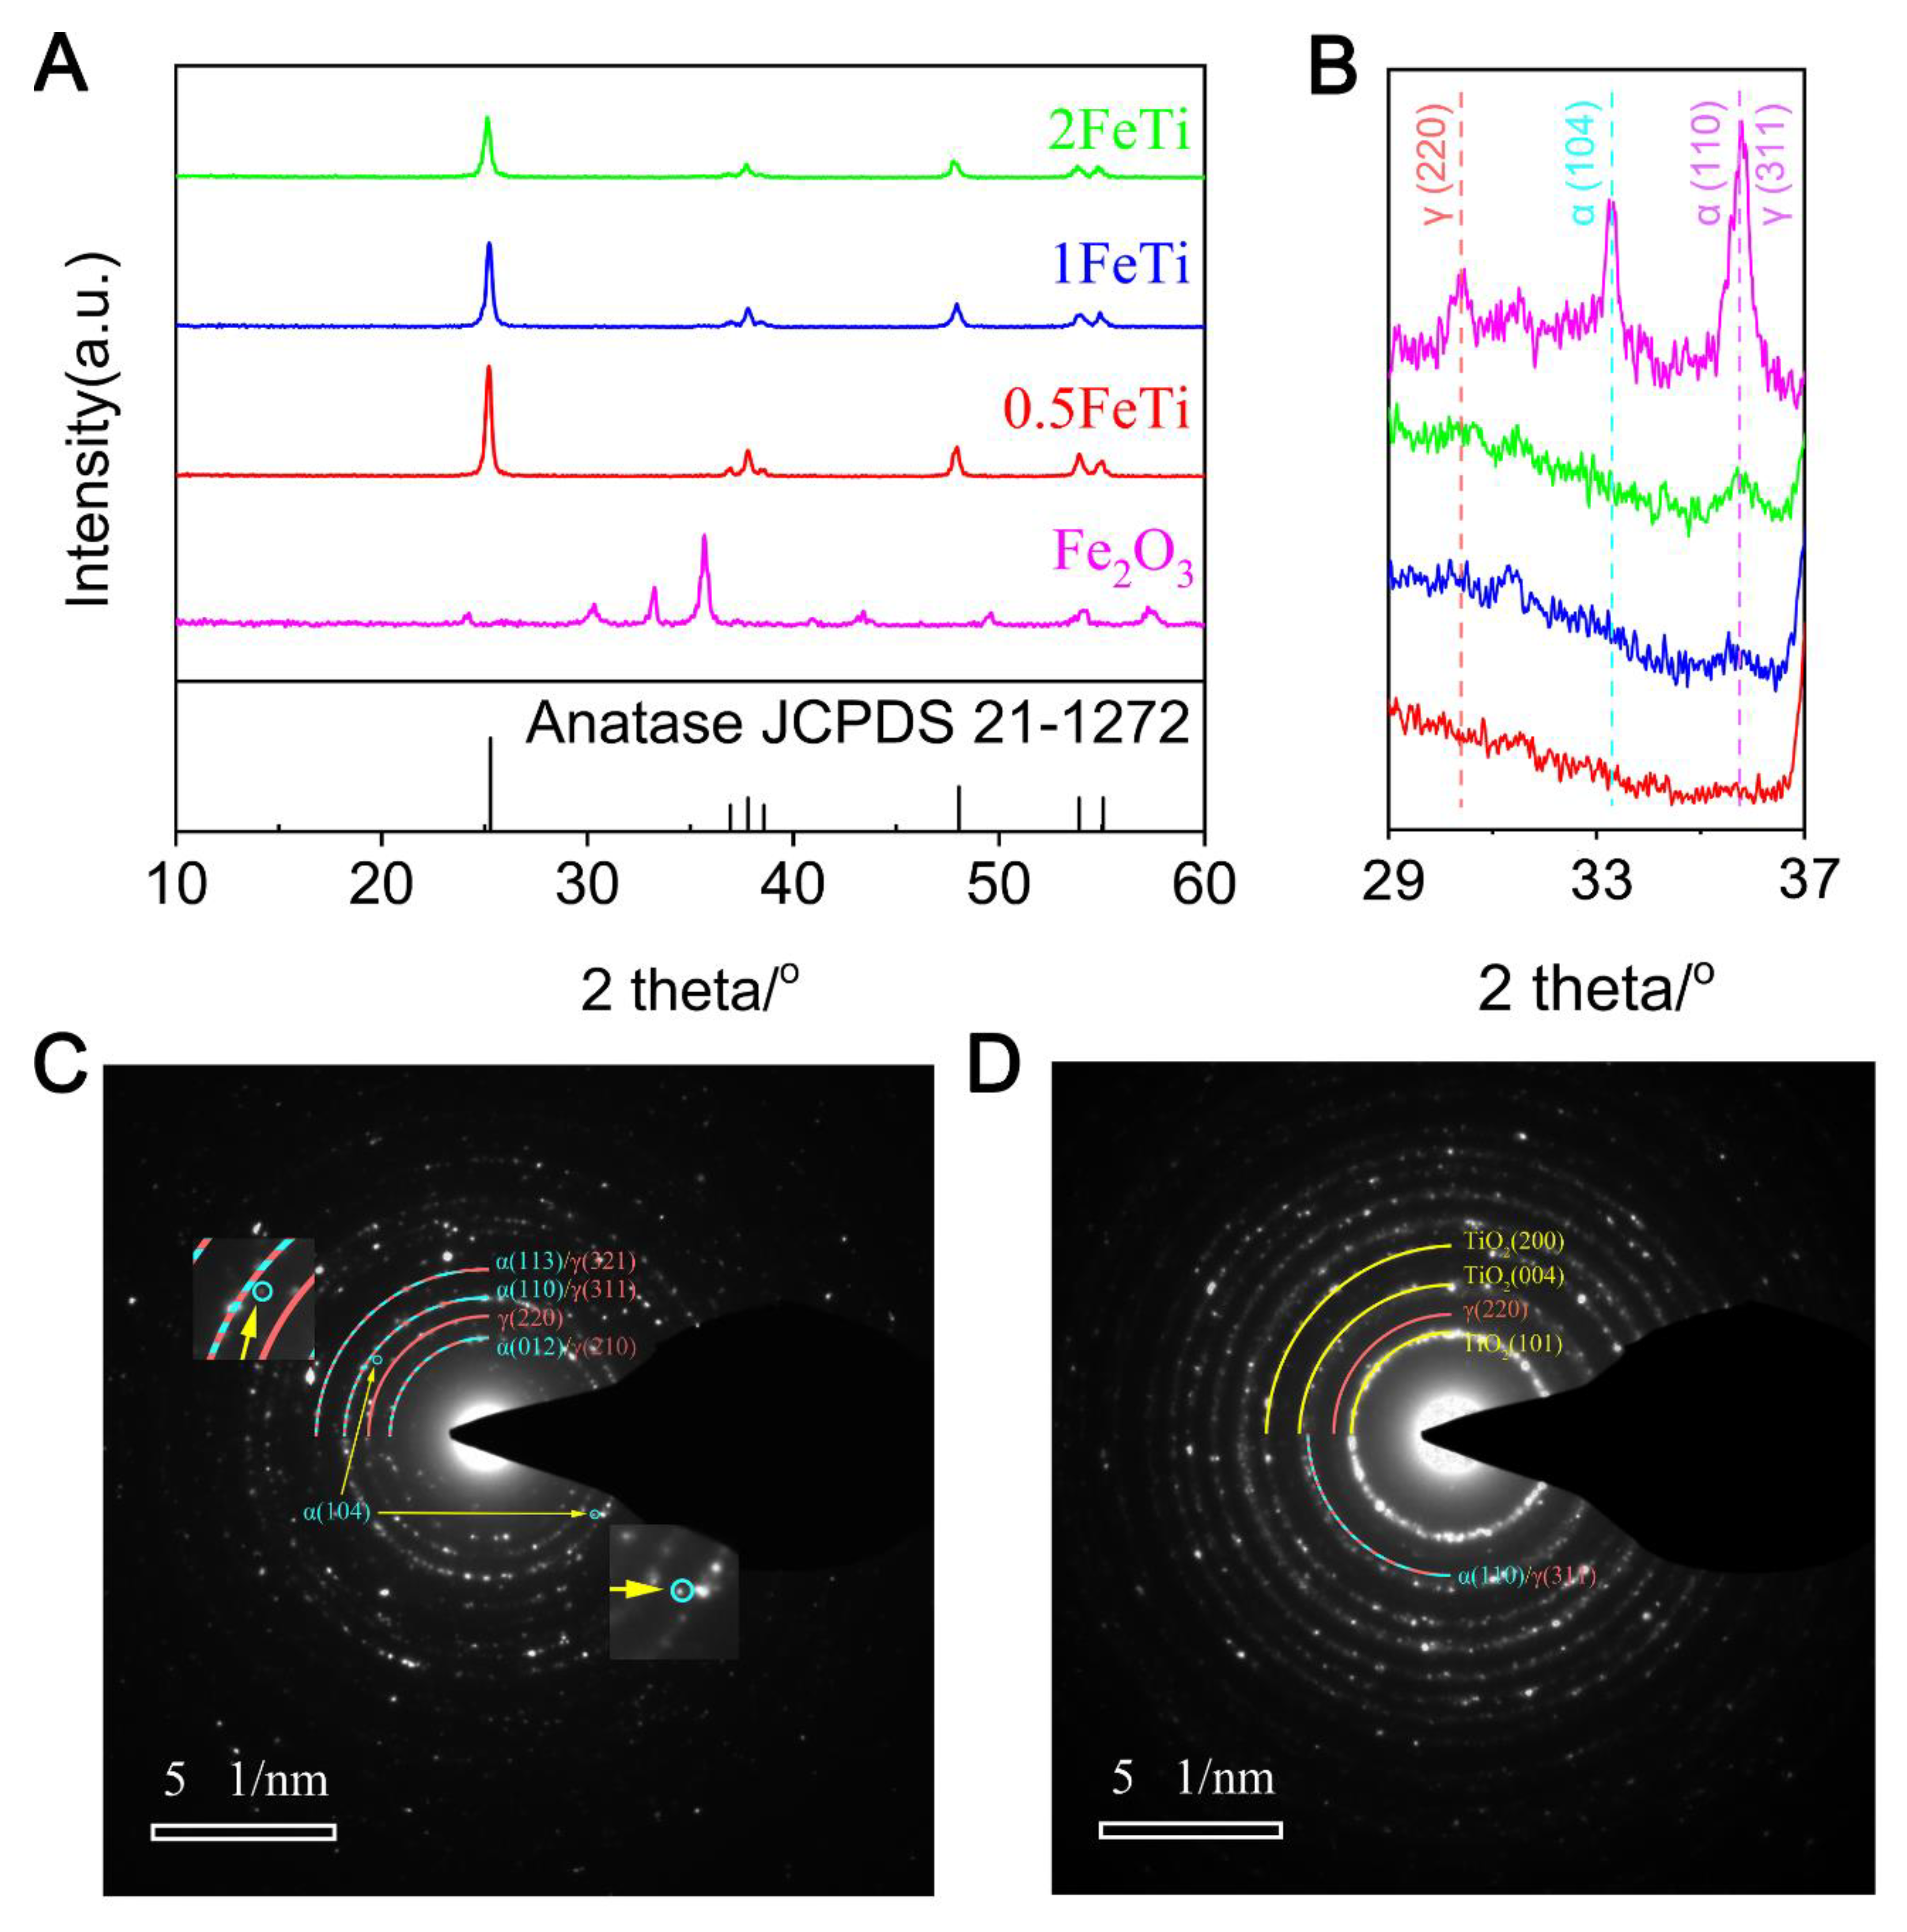
The crystal structures of these as-synthesized samples were determined by XRD analysis, as shown in Figure 1A. It can be found that the XRD patterns of as-prepared pure Fe2O3 contain diffraction peaks of both α-Fe2O3 at 33.2° (104) and γ-Fe2O3 at 30.2° (220), which indicates the coexistence of α-Fe2O3 and γ-Fe2O3 [32,33]. After the formation of a heterojunction, a series of new peaks, which can be well indexed to anatase TiO2 (JCPDS 21-1272), appear in the 1D Fe2O3@TNT composites. Since the peaks related to iron species were hardly to be observed due to the small amount of deposited Fe2O3 in Figure 1A, the narrow-range XRD spectra with higher resolution were further performed to examine the iron oxide species. As shown in Figure 1B, the characteristic peak intensity at 35.6° increases with the rising contents of Fe2O3 in 0.5FeTi, 1FeTi and 2FeTi, which further confirms the successful deposition of iron oxides. Furthermore, 2FeTi and Fe2O3 samples were further selected and analyzed by selective area electron diffraction (SAED) to ensure the existence of Fe2O3 (Figure 1C,D). As shown in Figure 1C, the SAED pattern of Fe2O3 with characteristic rings at 3.023 Å, 2.736 Å and 2.565 Å (from inside to outside) is in good agreement with the d-spacing of γ-Fe2O3 (d220 = 2.953 Å), α-Fe2O3 (d104 = 2.700 Å) and γ-Fe2O3 (d311 = 2.518 Å) [34]. For the SAED pattern of 2FeTi composite in Figure 1D, the diffractive rings of Fe2O3 are weak but still in agreement with corresponding crystal planes of Fe2O3, which might be due to the low and uniform dispersion of Fe2O3. Especially, it should be mentioned that the SAED patterns of 1FeTi and 0.5FeTi are also examined while the weak signals of Fe2O3 hinder their further characterization by this method. Nevertheless, the coexistence of α-Fe2O3 and γ-Fe2O3 in these composites is reasonable considering that all the samples are annealed at the same condition.
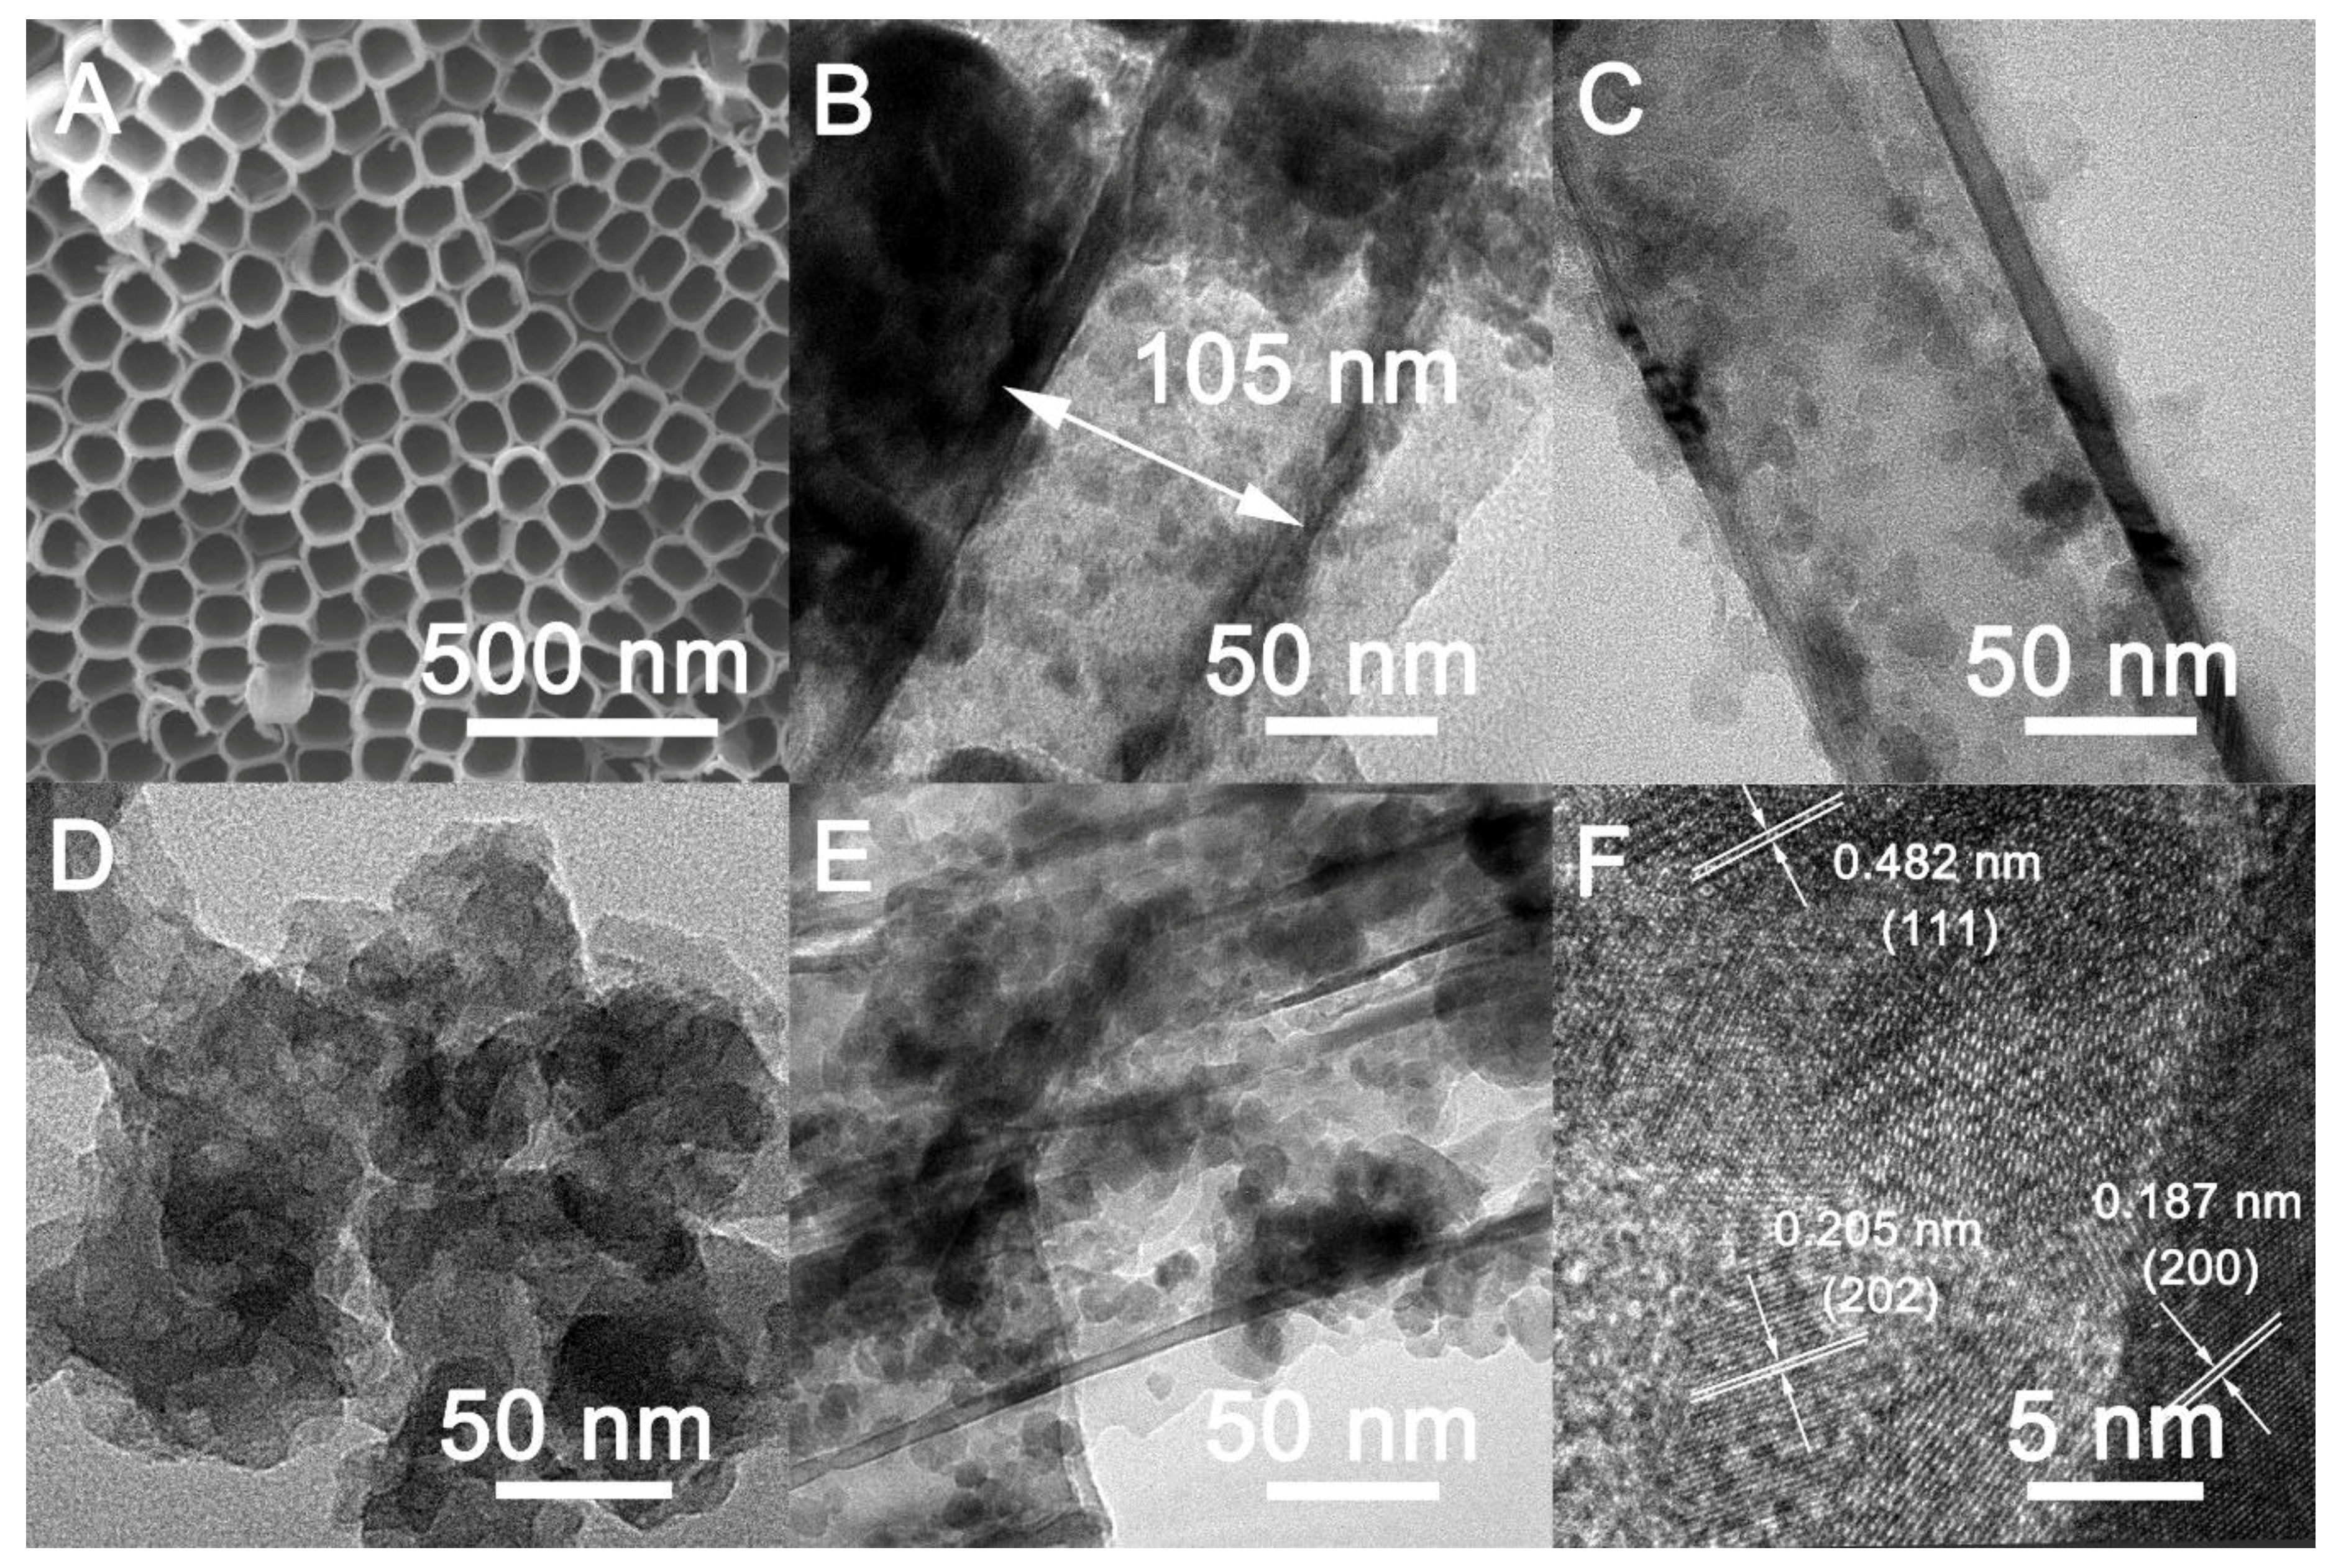
To further confirm the inner structures of the prepared samples, SEM, TEM and HRTEM analyses were employed and the results are shown in Figure 2. SEM image of anodized TiO2 nanotubes in Figure 2A reveals that the nanotubes are highly ordered with a uniformed outer diameter distribution of ~108 nm. After doping with Fe2O3, the well dispersed black iron oxides nanoparticles on the inner walls of TNT can be clearly observed in the HRTEM image of 0.5FeTi, as presented in Figure 2B. The nanotubes with diameter of 105 nm also meet well with the SEM image in Figure 2A. With the increasing deposition, it is observed that the number of black Fe2O3 nanoparticles on the inner walls increases, as shown in Figure 2B,C,E. Furthermore, the Fe2O3 nanoparticles in 1FeTi (Figure 2C) and 2FeTi (Figure 2E) have similar inner structures with 0.5FeTi (Figure 2B) and are also well dispersed on TNT inner walls, indicating the successful deposition of Fe2O3 into TNT. Then, the crystalline forms of the synthesized composites were further examined by the HRTEM image of 1FeTi in Figure 2F. The lattice fringes with interplanar spacings of 0.187 nm, 0.205 nm and 0.482 nm are well ascribed to the (200) plane of TiO2, (202) plane of α-Fe2O3 and (111) plane of γ-Fe2O3, respectively, which is consistent with the observations from XRD. Finally, pure Fe2O3 nanoparticles were also examined by TEM (Figure 2D) and the aggregation of Fe2O3 particles is quite obvious, indicating the uniform dispersion could be easily achieved after doping into TiO2 nanotubes.
After the determination of crystalline forms and inner structures of the synthesized composites, XPS analysis was carried out to further characterize the doping contents and surface chemical states of the obtained products, and the results are displayed in Figure 3. Figure 3A is the full-range spectra of the synthesized Fe2O3@TNT nanocomposites and the presence of C, Ti, O, Fe elements could be ascertained according to the peaks of C 1s, Ti 2p, O 1s, and Fe 2p. Specifically, the characteristic peak of C 1s situated at ~284.8 eV is attributed to the contaminant carbon, which is used for the calibration of the XPS spectra [35]. The Ti 2p1/2 and 2p3/2 peaks are observed at 464.1 and 458.0 eV respectively, which is in agreement with the typical anatase TiO2 [36]. The O 1s spectrum centered at 529.0 eV is ascribed to the metal oxides including Fe2O3 and TiO2. The Fe 2p spectra at 710.2 and 724.1 eV are the characteristic peaks of Fe2O3 and they were selected to analyze the chemical states of the doped Fe2O3 [37], as shown in Figure 3B–D. The Fe 2p spectra exhibit two contributions of 2p1/2 and 2p3/2 located at 723.9 and 710.4 eV, which can be assigned to Fe(III) oxidation state [37]. The additional peaks at 729.6 and 716.4 eV are ascribable to the satellite peaks of Fe(III) oxidation state. Especially, the peak intensity of Fe 2p increases with the growth of the Fe2O3 content, which is well consistent with the XRD results in Figure 1.
In order to identify the elemental molar ratios of the samples, careful calculation based on Figure 3A was performed after subtracting the peak of contaminant carbon, and the results are listed in Table 1. The O/Ti ratios in 0.5FeTi, 1FeTi and 2FeTi are 2.02, 2.17 and 2.31 respectively, which are close to theoretical values (2). Especially, the O/Ti ratios increase with the rising depositions, which further confirms the successful loading of Fe2O3 on the inner walls of TNT. It should be mentioned that the calculated Fe content at low deposition (0.5FeTi) was smaller than the theoretical value, which might be due to the fairly slight and highly dispersed Fe2O3 nanoparticles on the surface of TiO2 nanotubes. Except for the XPS detection, FTIR analysis was further carried out to characterize the chemical groups of the synthesized composites, which further confirms the successful deposition of Fe2O3 (shown in Figure S1).
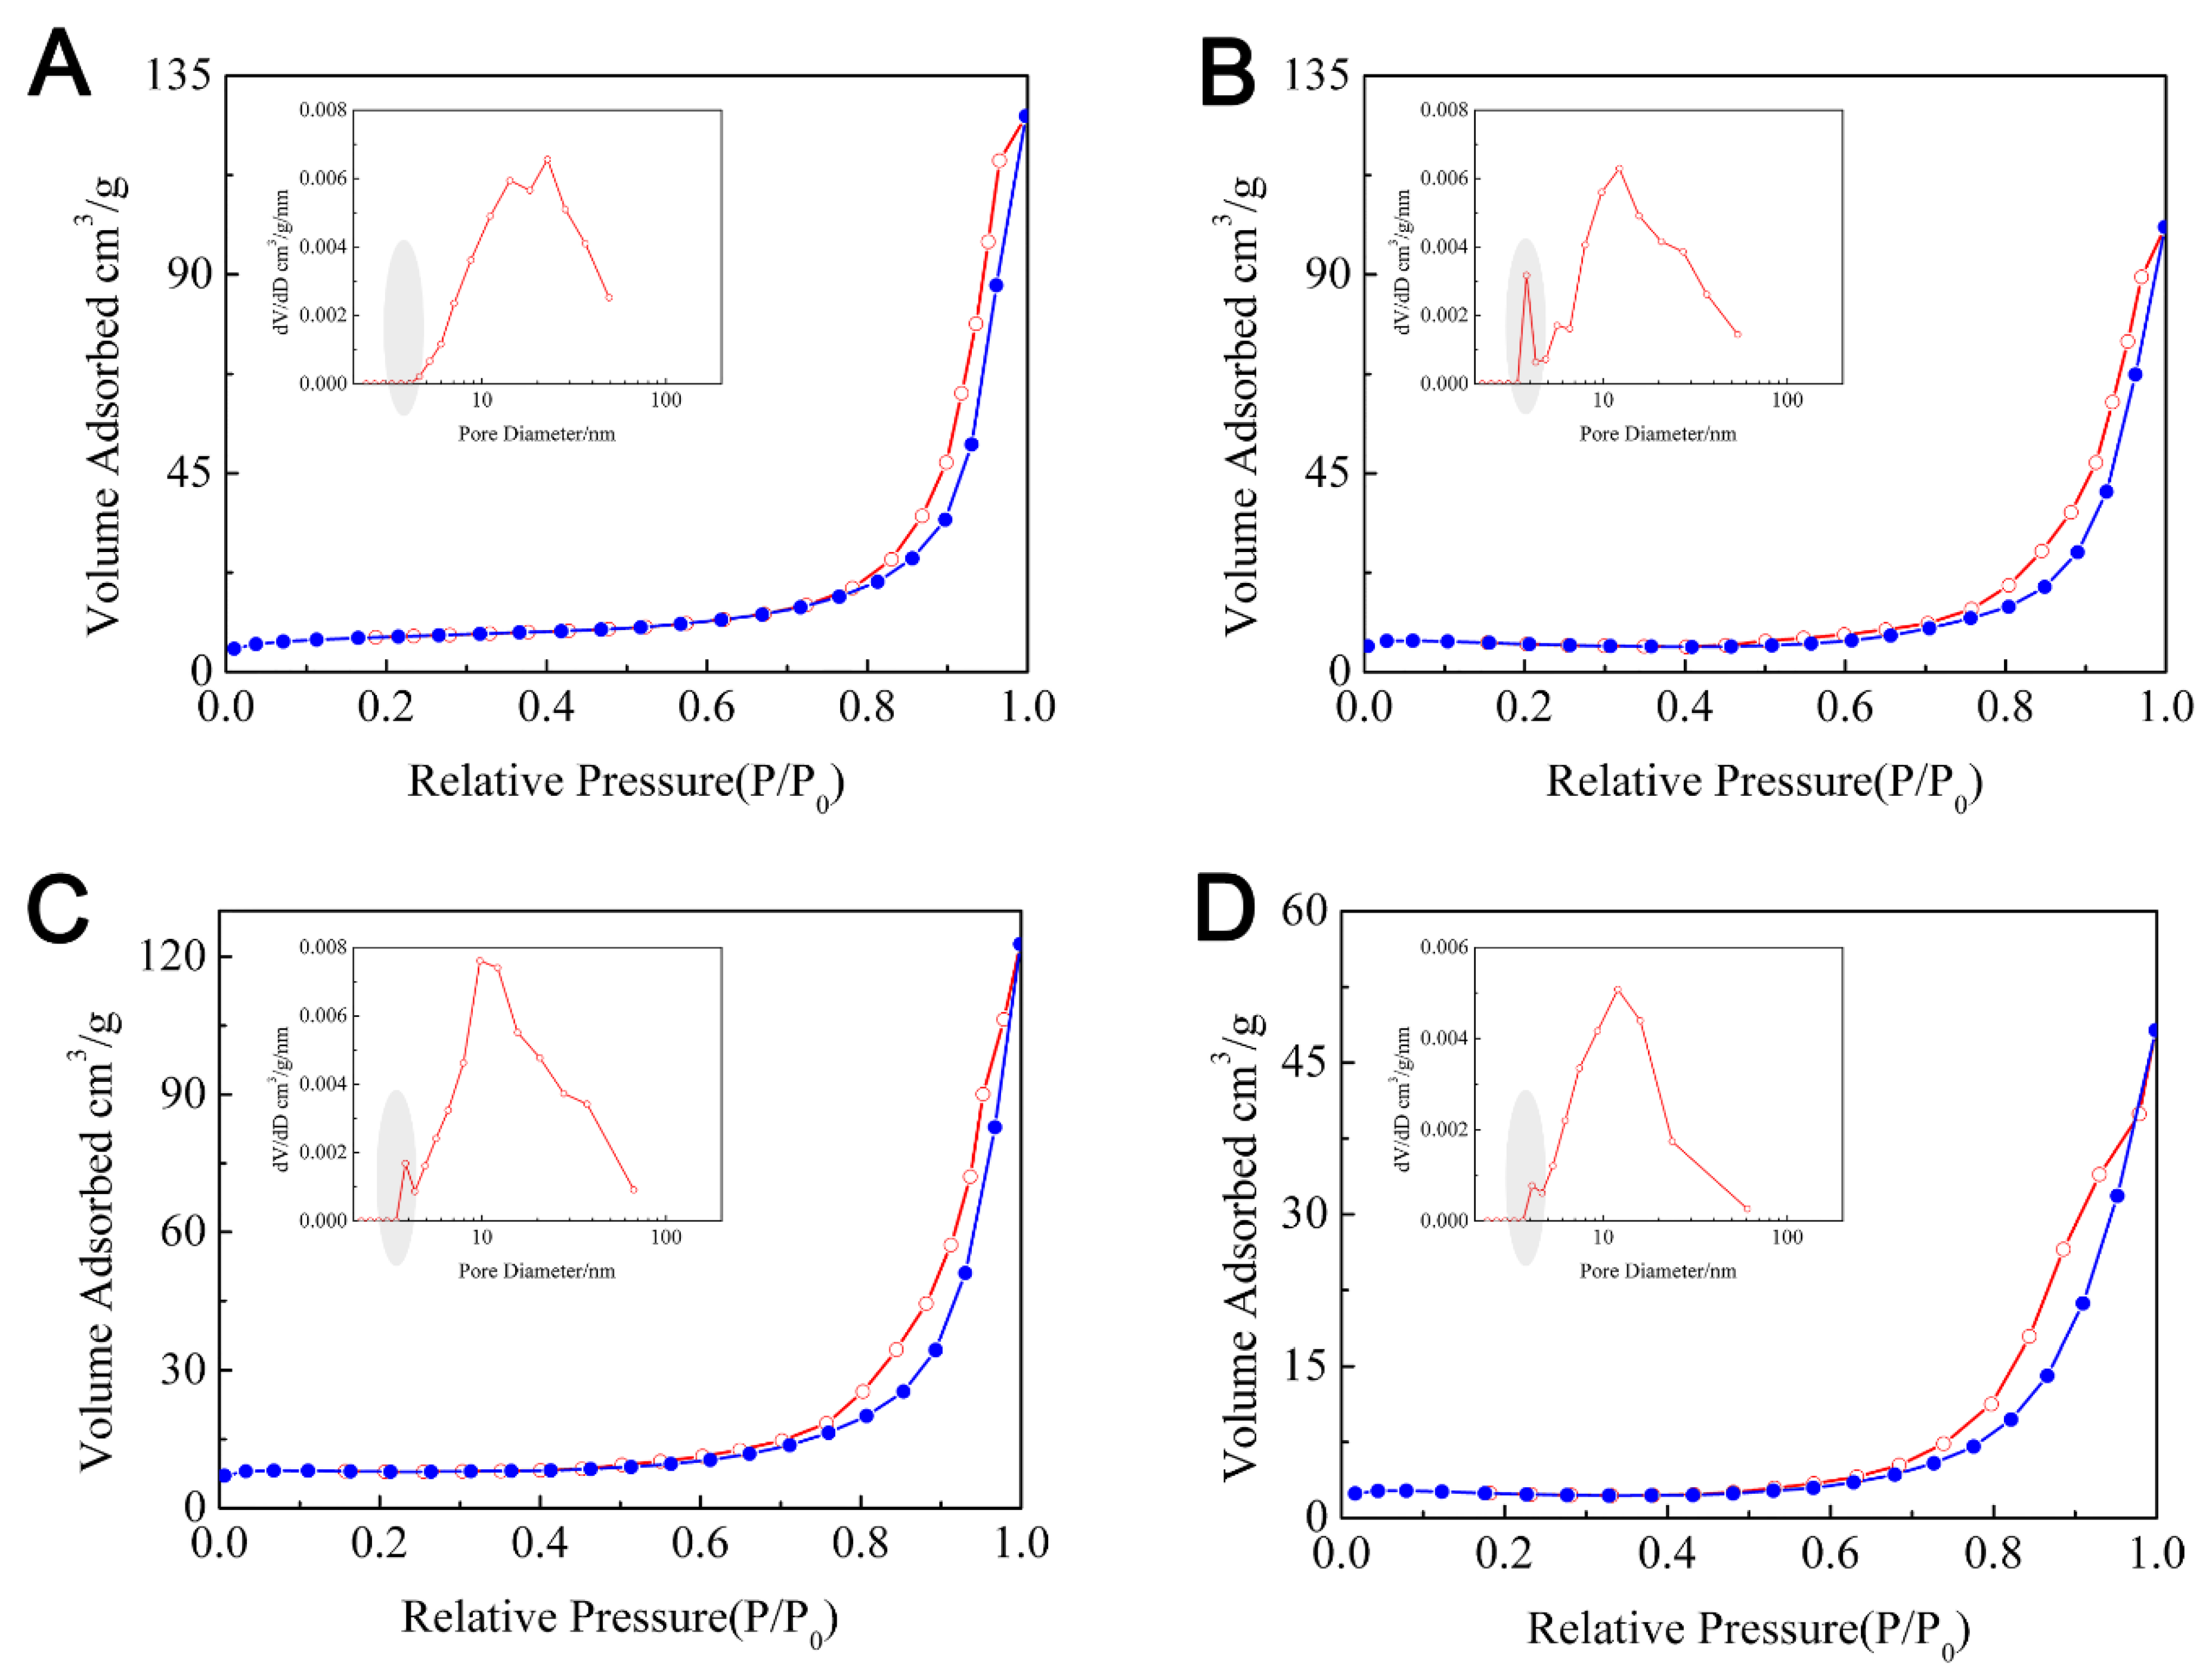
To further determine the inner structures of the synthesized nanocomposites, nitrogen adsorption/desorption isotherms analyses were utilized to examine the surface area and the pore information, and the results are presented in Figure 4 and Figure S2. The specific surface areas and pore sizes as well as volumes were calculated according to BET and BJH methods and the results are displayed in Table 2. Figure 4 shows that all the samples exhibit typical type IV isotherms with H3 hysteresis loop, suggesting the mesoporous structure of all the synthesized materials according to the IUPAC classification [38]. As shown in Table 2, the BET specific surface areas of these composites (0.5FeTi, 1FeTi, 2FeTi) increase significantly compared to bare Fe2O3. Considering the less BET-specific surface area of TNT (17.53 m2/g) than the composites, the enlargement of surface area is mainly ascribable to the uniformly doped Fe2O3 particles on TNT inner walls, which could not only enlarge the dispersibility of the iron oxides but also increase the contact area with the organic pollutants and thus enhanced photocatalytic performance. On the other hand, the BJH desorption branch pore sizes and volumes were selected to analyze the inner structures of the synthesized materials, as shown in Table 2. It can be observed that the pore sizes and volumes decrease with the increment of iron oxides, which also verifies the successful deposition of Fe2O3 in TiO2 nanotubes. The large pore size and pore volume of 0.5FeTi reveal that the Fe2O3 nanoparticles are highly dispersed on the inner walls of TiO2 nanotubes. With the increment of deposition, the pore sizes of 1FeTi and 2FeTi decrease sharply and fall into a range near pure Fe2O3, which is probably associated with the smaller inner structures between Fe2O3 nanoparticles, characterized at about 4 nm (as shown in the inset figure of Figure 4). Furthermore, it could be observed from the pore volume results of 1FeTi and 2FeTi that this value does not significantly decrease with the pore size, which further indicates more abundant pores in 1FeTi and 2FeTi and verifies the deduction mentioned above. Finally, it is observed that the peak area associated with Fe2O3 (marked by shadow ellipse in Figure 4) increases following this order: 1FeTi > 2FeTi > Fe2O3 > 0.5FeTi, which indicates the best deposition and dispersion of Fe2O3 nanoparticles in 1FeTi.

3.2. Photo-Chemical and Bandgap Characterizations

After the determination of the inner structures and chemical contents, the photo-chemical properties and bandgap information of the synthesized 1D nanocomposites were investigated through UV-Vis and PL spectra, as presented in Figure 5 and Figure 6.
Figure 5 shows the UV–vis absorption spectra of Fe2O3@TNT samples with variable Fe content and pure Fe2O3. The tangent lines at different wavelength range were used to determine the gap information of the synthesized materials. Fe2O3 possessed excellent absorption in both UV region and visible region. The tangent line of Fe2O3 in the wavelength from 240 nm to 255 nm correlated well with the bandgap of 2.33 eV, which is consistent with the reported value for Fe2O3 [26]. Besides the bandgap of Fe2O3 observed in Figure 5A, one more weak peak is observed in Figure 5C and the absorption bandgap energy can be extended to 0.79 eV, which is correlated with the midgap of Fe2O3. As for Fe2O3@TNT composites, the first peak that appeared in Figure 5A is mainly related to the doped iron oxides and it can be seen that the absorption bandgap energy improves slightly with increasing Fe content. Additionally, similar results are found in the third peak shown in Figure 5C. Furthermore, a new peak appeared in the range from 354 nm to 380 nm after the generation of Fe2O3@TNT heterojunction in Figure 5B, which is probably due to the migration of photogenerated charge carriers between TiO2 and Fe2O3. After the correlation, it was found that the derived bandgap energy in Figure 5B decreases significantly with increasing loading of iron oxides.
Generally, single bandgap derived by UV-Vis spectrum cannot determine the band position, and further characterizations such as ultraviolet photoelectron spectroscopy (UPS) or Mott-Schottky measurement should be utilized to determine the position of valence band or conduction band [14,39]. Nevertheless, as the gaps derived in Figure 5B were regarded as the results of electron migration between Fe2O3 and TiO2, the relative positions of their individual gaps could be obtained. Thus, based on the extrapolation of UV–vis spectra in Figure 5, the band structures of these four catalysts were derived and are schematically shown in Scheme 2. It is interesting to note that the band alignment of these heterostructures are staggered form, which is not in accordance with the native included alignment of FexOy@TiO2 [40]. Such band alignments might be attributed to the coexistence α-Fe2O3 and γ-Fe2O3, resulting in the formation of staggered band alignment of α-Fe2O3/γ-Fe2O3 heterojunction. Finally, it should be mentioned that the staggered band form between Fe2O3 and TiO2 would significantly hinder the recombination of charge carriers and thus enhance the photocatalytic performance [41].
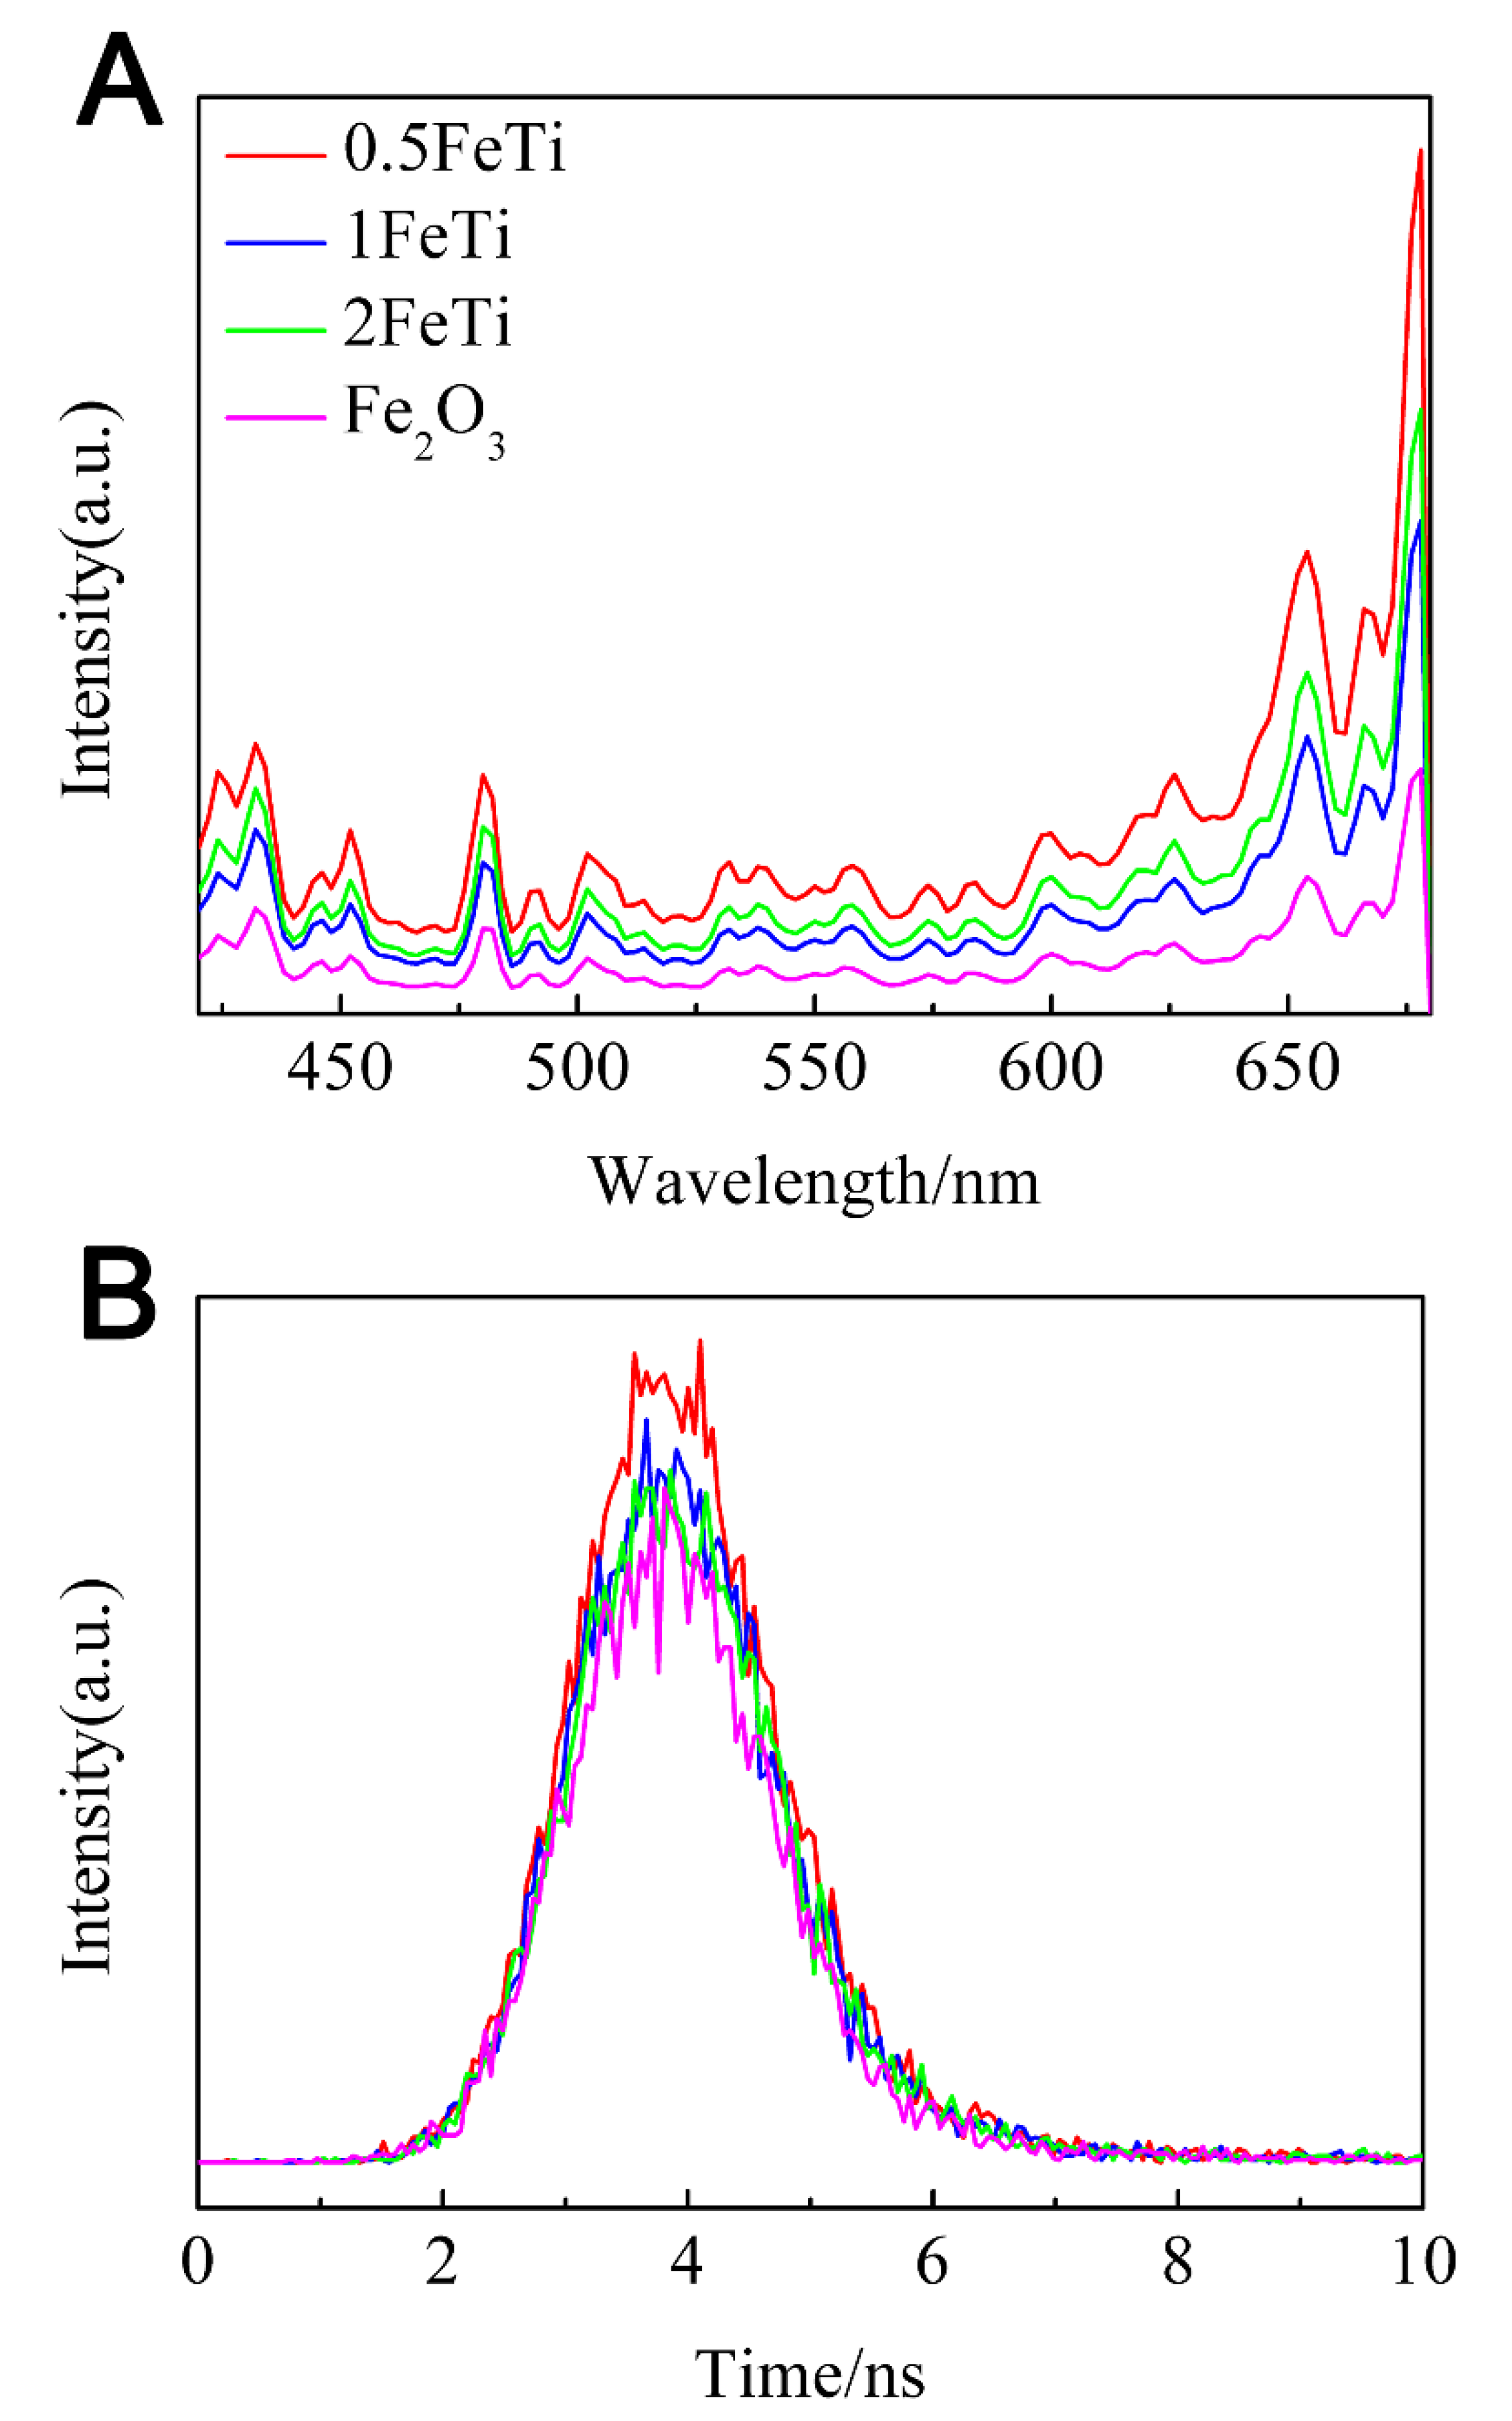
Figure 6 shows the PL spectra and decay curves of the synthesized materials. PL spectra were traditionally applied to detect the photo-chemical properties of the synthesized materials and it was considered that higher PL intensity indicated more electron-hole pairs generated in the heterostructures containing iron oxides [42]. Figure 6A clearly shows that the PL spectra of Fe2O3 nanoparticles is lower than that of three Fe2O3@TNT composites, implying that combining Fe2O3 with TiO2 nanotubes could effectively promote the generation of charge carriers. Except for the fluorescence intensity, the luminescence efficiency should also be considered by analyzing fluorescence lifetime. It can be observed in Figure 6B that the intensity of the decay curves fast diminishes after reaching the top of peak instead of a slow tailing trend, which might be due to the high charge carriers recombination rate of Fe2O3. Then, the fluorescence lifetimes of 0.5FeTi, 1FeTi, 2FeTi, and Fe2O3 were determined from the decay curves and fitted by a single exponential term. According to the corresponding equation (as shown in Figure S3), the lifetimes of 2FeTi, 1FeTi, 0.5FeTi, and Fe2O3 were calculated to be 0.6844 ns, 0.6759 ns, 0.6475 ns, and 0.6306 ns, respectively, indicating that the lifetimes also increase with the increment of Fe2O3 deposition. Additionally, these results also reveal the superb migration and effective separation of electrons and holes between Fe2O3 and TiO2, which is also shown in Scheme 2. Under the consideration of both charge carriers’ generation and their lifetimes, 2FeTi has the highest fluorescence intensity and fluorescence lifetime, which indicates that 2FeTi might have the best photocatalytic activity, followed by 1FeTi or 0.5FeTi and lastly bare Fe2O3.

3.3. Magnetic Characterizations

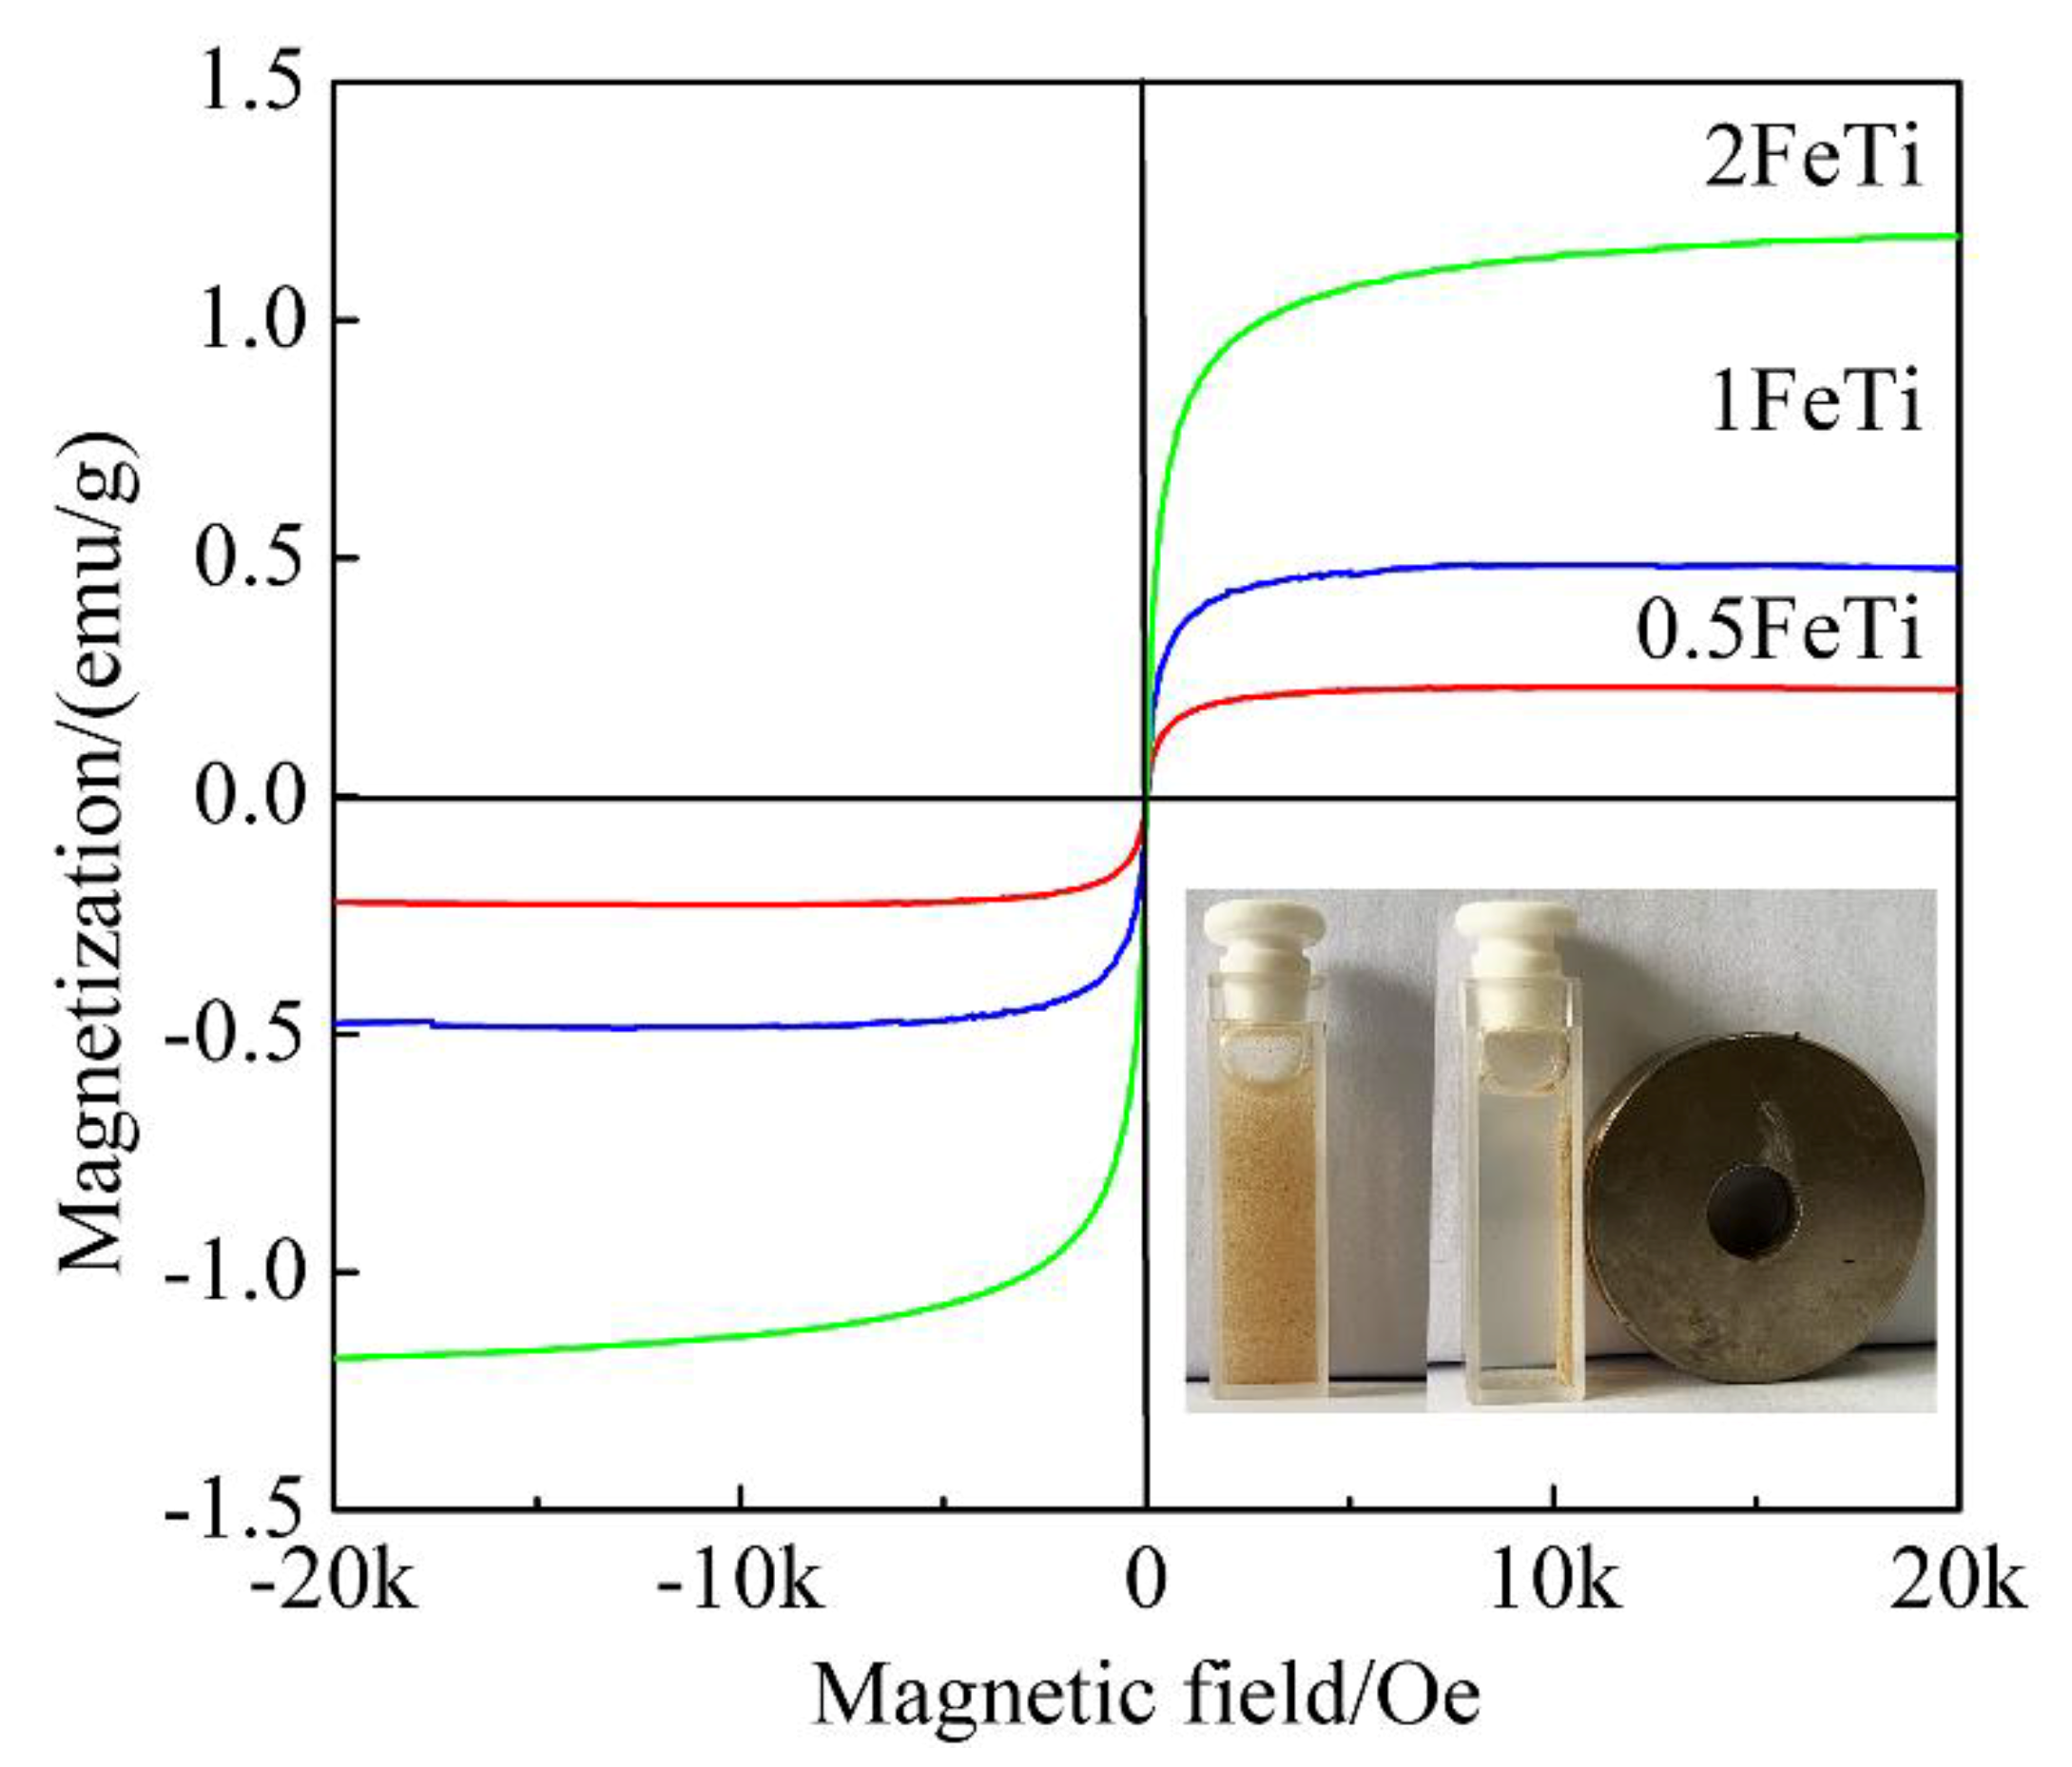
Finally, the magnetic property of as-obtained products was evaluated by using a vibrating sample magnetometer, which is of great importance for practical applications. Figure 7 exhibits the magnetization curves measured at 300 K, and the insert graph shows the magnetic separation result of 1FeTi by using a magnet. The suspension containing well-dispersed particles of 1FeTi turned into clear solution without residues left in only several seconds via a magnet, which implies that the synthesized 1D Fe2O3@TNT composites possess good magnetic separation ability. In addition, the magnetization curves passing through the origin with the magnetic saturation (Ms) values of 0.23, 0.48 and 1.18 emu/g for 0.5FeTi, 1FeTi and 2FeTi indicated that they all possessed superparamagnetic behaviors. Accordingly, the molar contents of Fe2O3@TNT composites were estimated to be 1.06%, 2.23% and 5.54% for 0.5FeTi, 1FeTi and 2FeTi respectively, which is calculated by comparing the Ms values of the synthesized composites and pure Fe2O3 (the Ms value was 27.48 emu/g, shown in Figure S3). The results derived from Ms values are a little higher than the contents derived from the XPS spectra, which is ascribed to more excellent magnetism originating from the mini “magnet” formed along the nanotubes after the magnetic Fe2O3 nanoparticles are confined in the nanotubes. On the other hand, XPS technique is a surface-sensitive technique that excites electrons from the top surface of 1–12 nm thick, which might also be a reason for lower contents.

3.4. Photocatalytic Activity

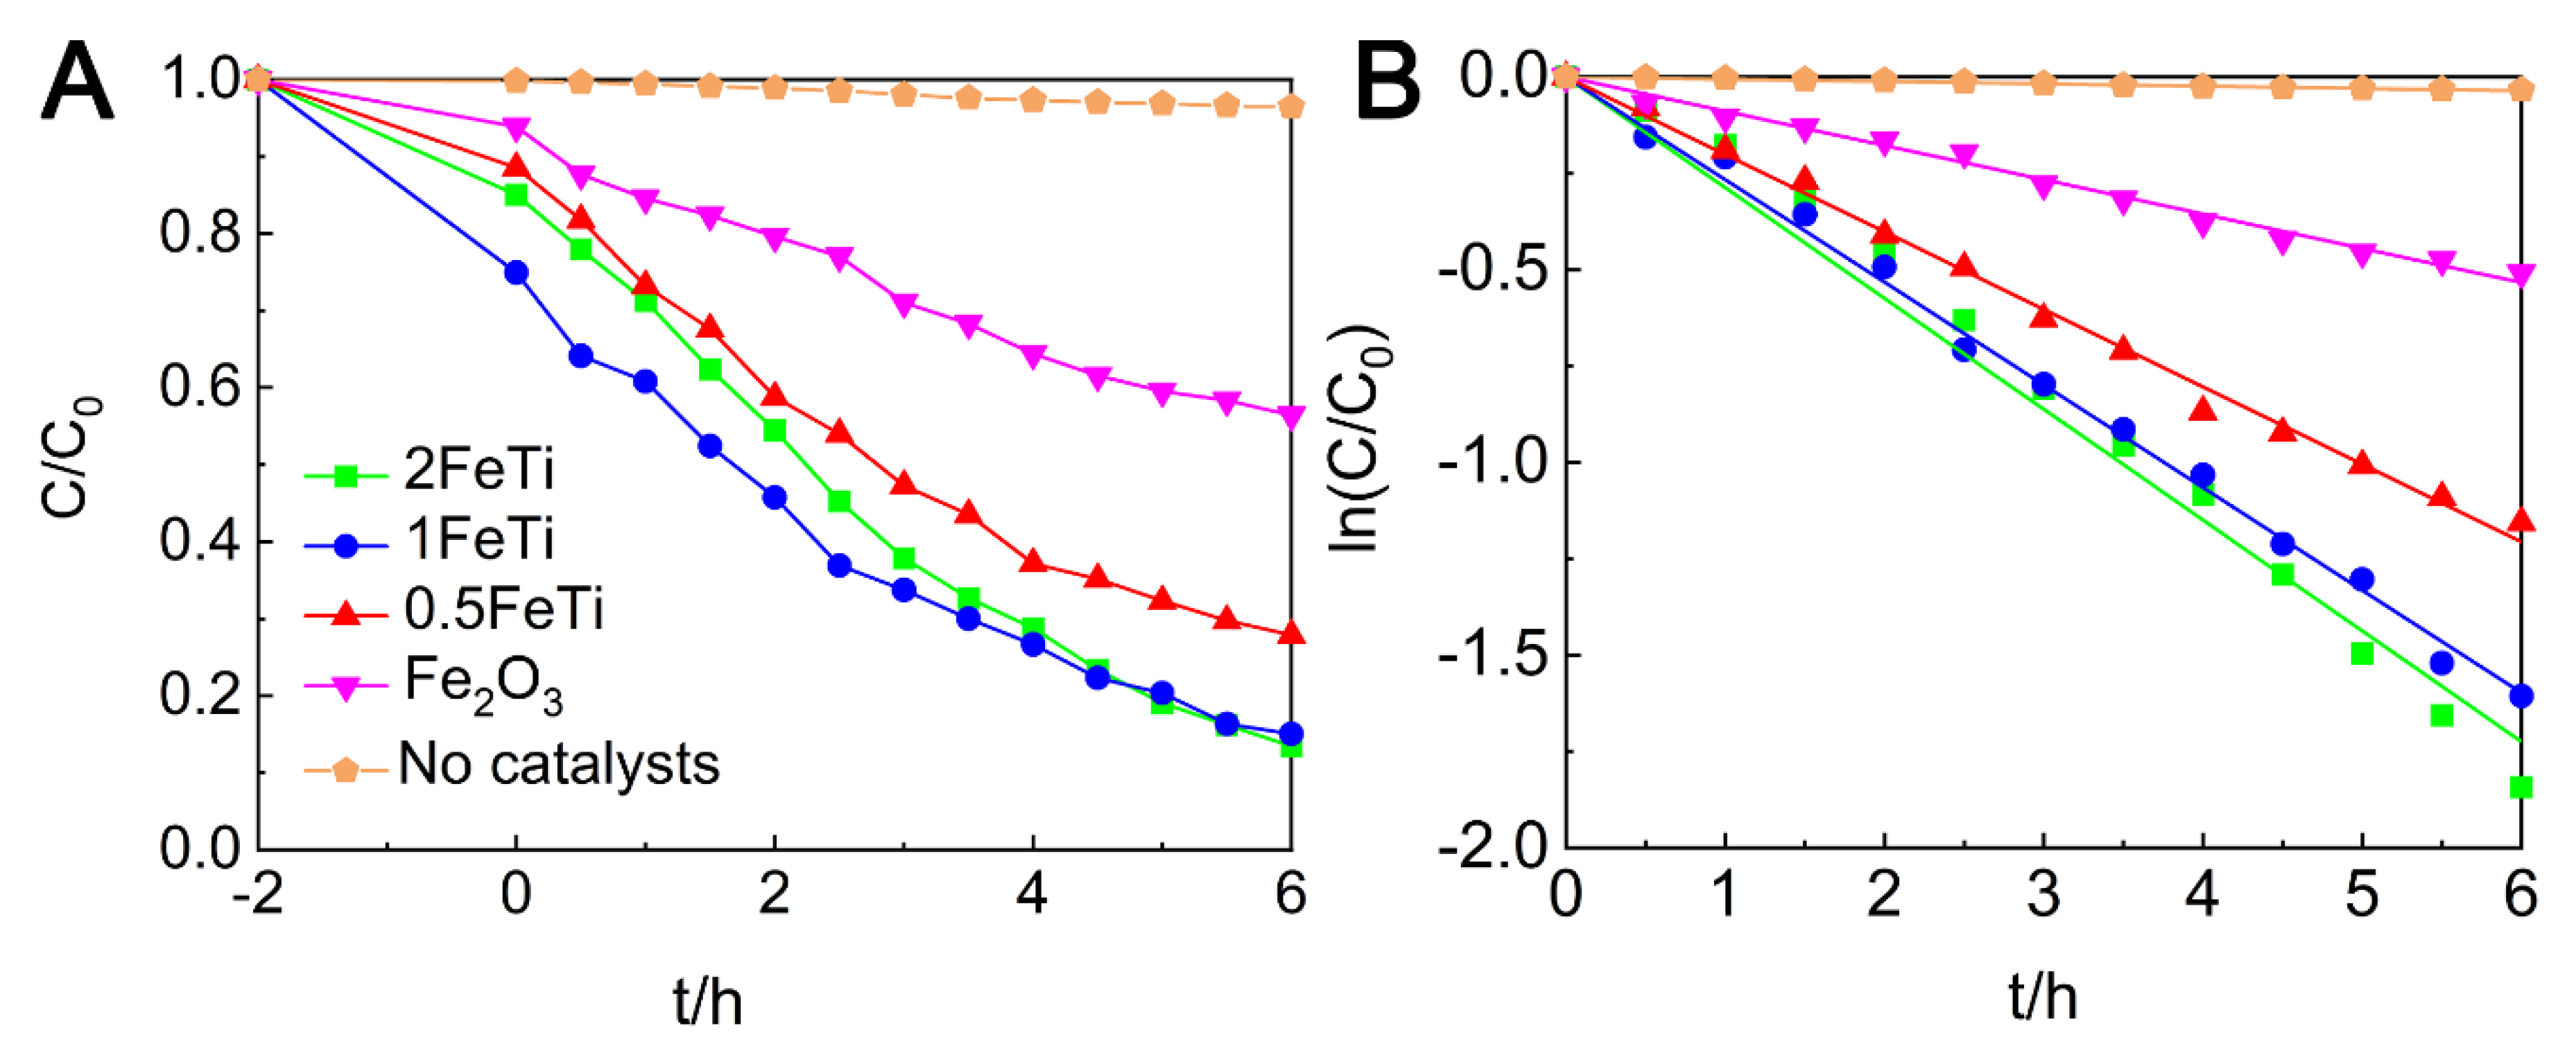
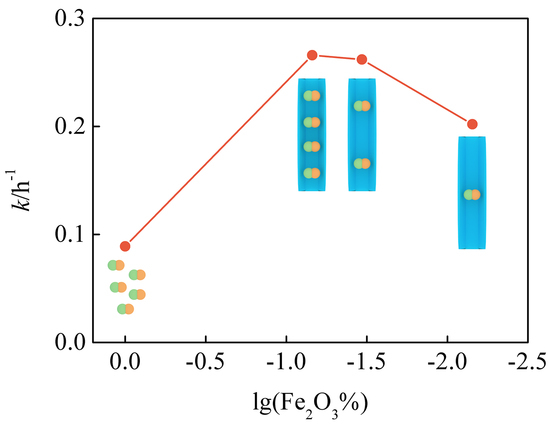
The photocatalytic activities of as-synthesized composites under visible light were assessed by the degradation experiments of RhB (10 mg/L) using Xe light irradiation (300 W, λ ≥ 400 nm). The variation of the concentration with the time of irradiation is plotted in Figure 8. During dark equilibrium period, these Fe2O3@TNT composites possess more efficient adsorption capacity for RhB compared with pure Fe2O3 and TNT (Figure S5), which is mainly ascribed to the homogeneous dispersity of Fe2O3 on TNT, as illustrated in Figure 2 and Figure 4. Especially, it is observed that 1FeTi shows the optimal adsorption property, which might have resulted from the most dispersive Fe2O3 inner structures in 1FeTi (Figure 4). After the visible-light irradiation, Fe2O3@TNT composites show remarkably enhanced photocatalytic activity compared to pure Fe2O3, which is attributed to the efficient separation of charge carriers after doping onto TiO2 nanotubes. Briefly, Fe2O3 would act as the electron trappers in the composites which would enhance separation of excitons and thus the photocatalytic performance. In addition, the performances of 1FeTi and 2FeTi are almost the same and much better than 0.5FeTi, which might be due to the more abundant electron trappers accompanied with the moderate increment of Fe2O3 deposition. Hence, 1FeTi and 2FeTi are considered as the candidates with the most potential for organics degradation. However, 1FeTi consumes less iron oxides and thus was more cost-effective. Above all, 1FeTi is considered to be a better Fe2O3@TNT composite under the consideration of dark adsorption capacity, photocatalytic activity and economic efficiency. Finally, the rate constant ka is fitted according to the pseudo-first order reaction kinetics (Equation (1)), and the results are displayed in Table 3. The order of the rate constants is in good agreement with the curves in Figure 8B. Interestingly, it is observed that the trend of rate constant is coincident with the deduction of the PL results, which implies that fluorescence intensity and fluorescence lifetime could describe the photocatalytic property of Fe2O3 and its composites effectively. Finally, the comparison of this study with other similar Fe2O3-based materials reported in other literatures is given in Table 4. As seen in Table 4, the photodegradation activity of 1FeTi is significantly improved, which further demonstrates that 1FeTi could be a promising material for photocatalytic wastewater remediation.
ln C 0 / C = k t      
where C0 and C are the original concentration of RhB and the corresponding concentration at the reaction time (t), respectively, and k is the pseudo-first degradation rate constant.

3.5. Intermediate Products and Degradation Pathway of RhB

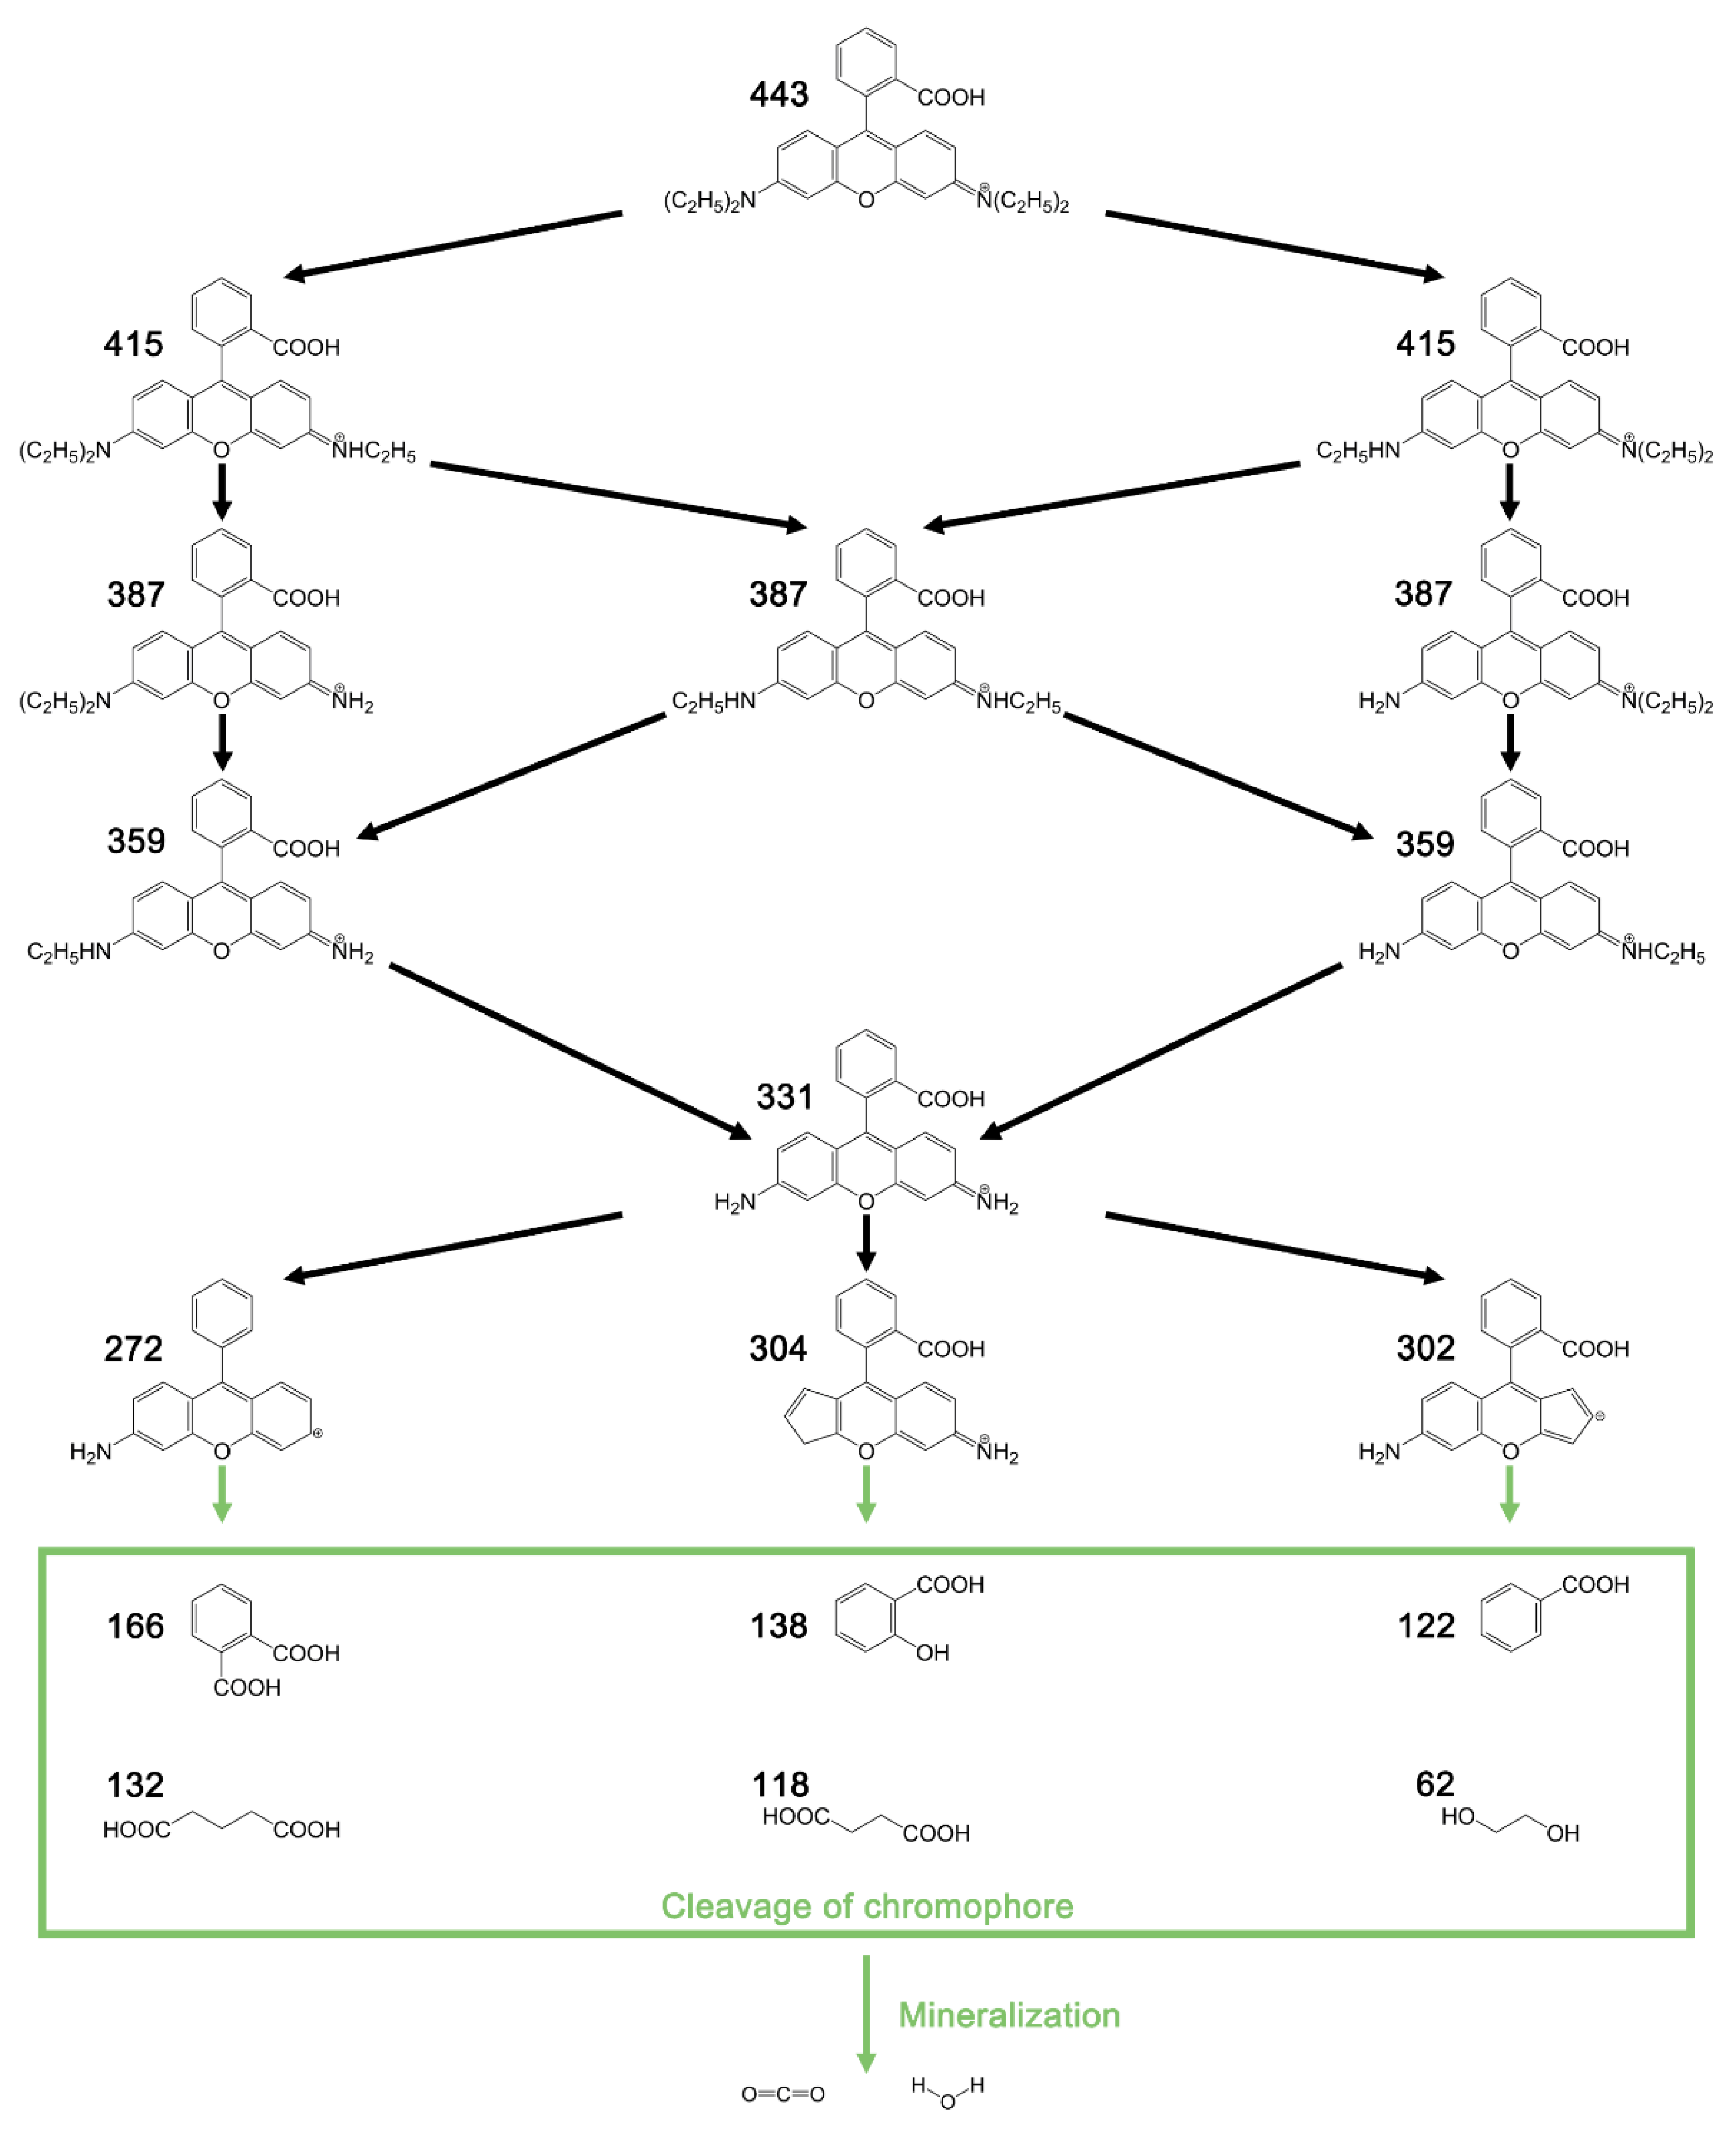
Although it has been claimed that 84.96% of the RhB could be degraded by 1FeTi in 6 h in Section 3.4, the specific mineralization efficiency has not been determined. Consequently, the intermediate products during photocatalysis of RhB over 1FeTi for 0–6 h were identified by HR-MS. As shown in Figure S6, the HR-MS spectra of RhB solution (t = 0 h) shifted from m/z = 443 (characterized as RhB) to m/z = 415, 387, 359, 331, 304, 302, and 272 after photo illumination, which might be ascribable to the N-de-ethylating process under the effects of photogenerated radicals [49,50]. Then, the N-de-ethylated intermediates would react with functional radicals to produce opening-ring intermediates (e.g., phthalic acid), which could be further mineralized to CO2 and H2O [49,50]. Based on these deductions, the degradation pathway of RhB was proposed and is displayed in Scheme 3. Finally, it should be mentioned that the intensity of MS spectrum at t = 6 h is much weaker than that at t = 0 h, indicating the almost total mineralization of RhB in the wastewater.

3.6. Recyclable Performance

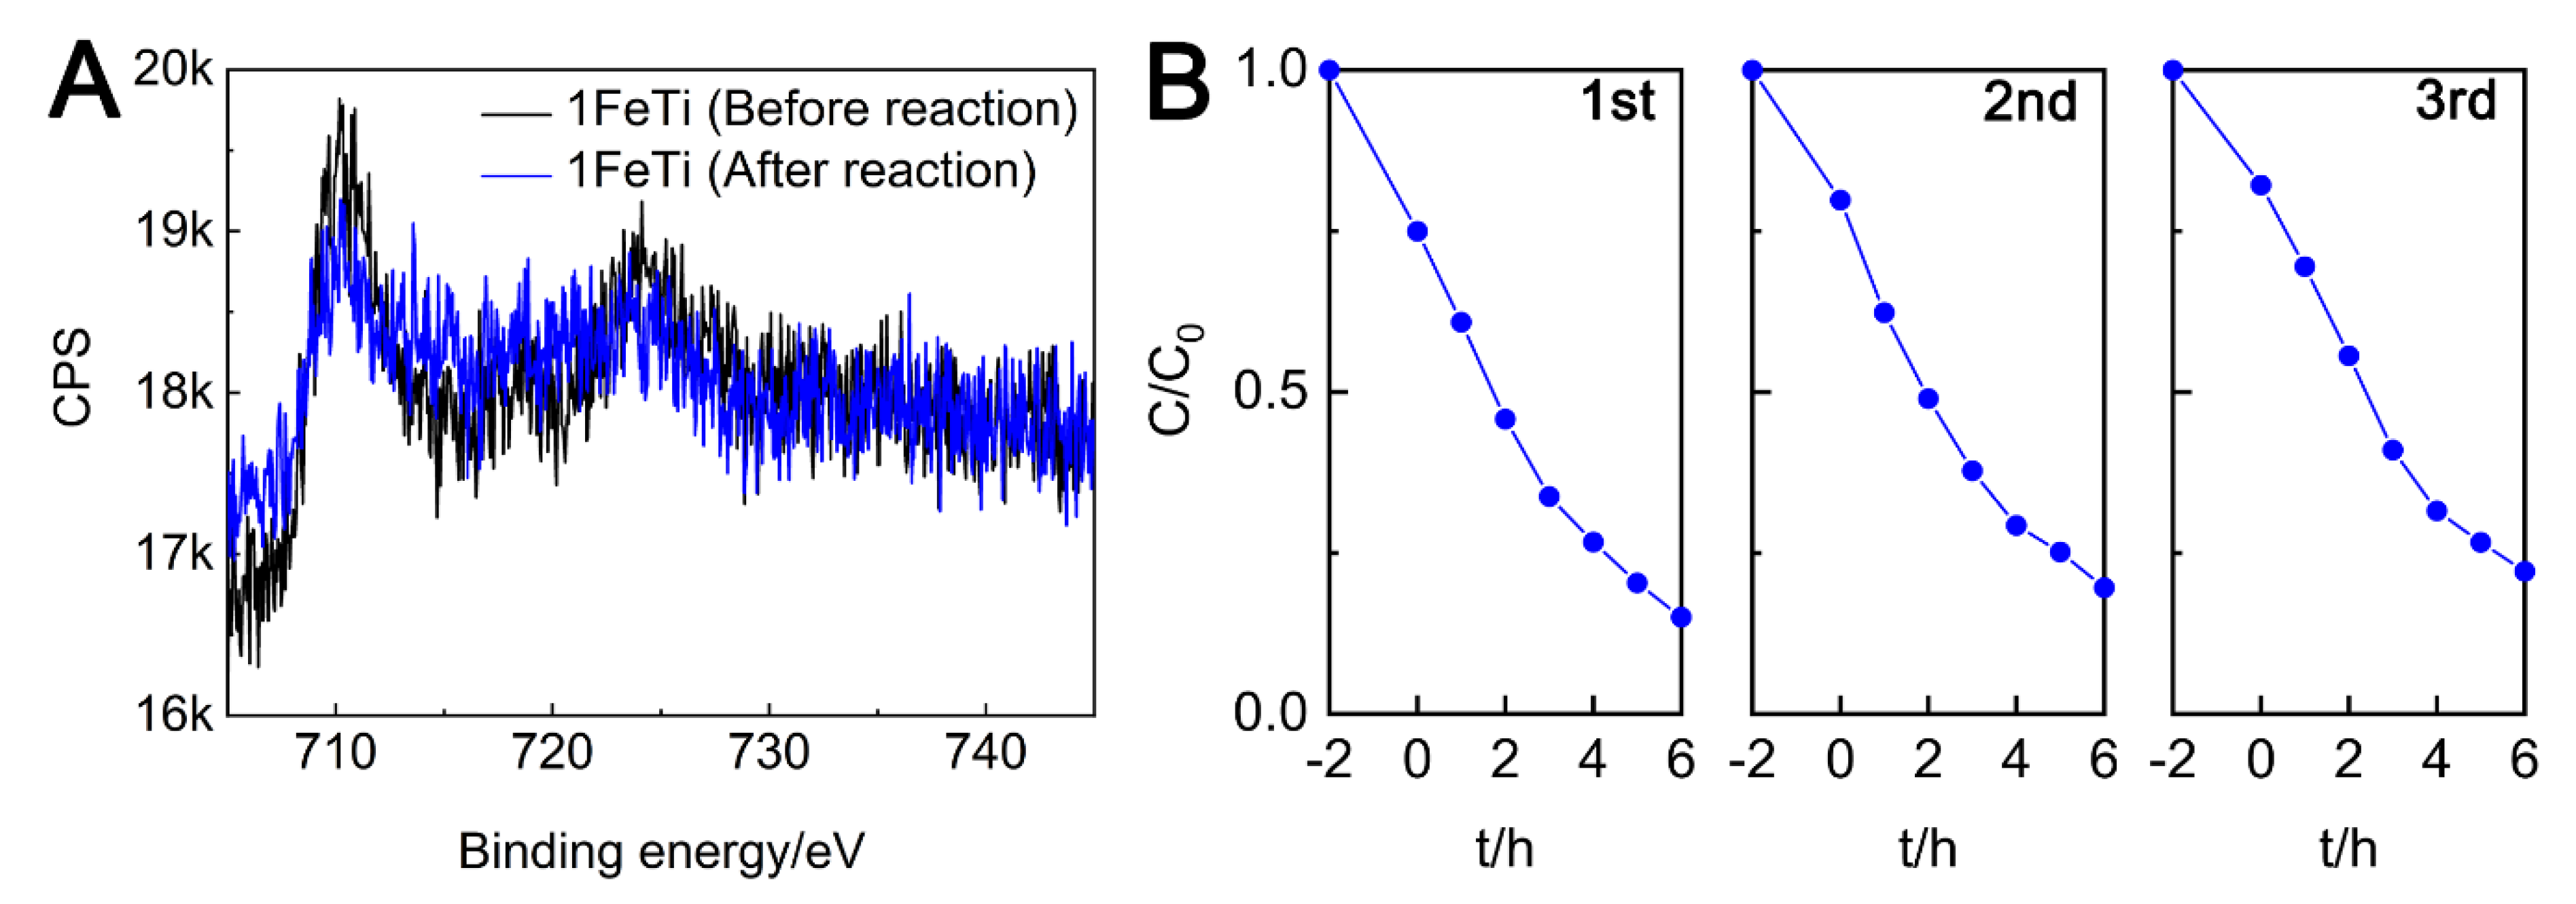
Before the regeneration experiments, the leaching test should be probed to examine the loss of supported Fe2O3 particles and to ensure the maintenance of superior photocatalytic performance [27]. As a result, 1FeTi after photocatalysis was sampled and tested by XPS, and the results are displayed in Figure S7 and Figure 9A. It could be observed from the Fe 2p spectra in Figure 9A that peak shape and intensity is almost unchanged after photocatalysis, indicating the effective inhibition of photo dissolution of the doped Fe2O3 [25]. Furthermore, the dissolution amount was determined to be 13.4% in 6 h according to Table 1 and Figure S7, which is much less than 17.5% in 0.5 h for the Fe3O4@TiO2 and 13.5% in 3 h for Fe3O4@C@TiO2 heterostructures [25,27], verifying the hypothesis that the photo dissolution could be significantly hindered by incorporating wide-gap Fe2O3 instead of narrow-gap Fe3O4.
Considering the good stability of 1FeTi during photocatalysis, the regeneration experiments were performed. As shown in Figure 9B, the recyclable performance is almost stable in three cycles, and the slight reduction might be due to the moderate dissolution of Fe2O3 from the composite. Generally, 1FeTi exhibits superior repression for photo dissolution and stable regeneration, which could be considered as a promising photocatalytic medium for water remediation.

4. Conclusions

In this work, 1D Fe2O3@TiO2 nanotube composites were first successfully synthesized by an aerobic OCMA method. The structural and photo-chemical properties of the prepared Fe2O3 and Fe2O3@TNT composites were characterized via XRD, XPS, FTIR, HRTEM, BET, UV-Vis, and PL spectra. Based on the XRD results, both α-Fe2O3 and γ-Fe2O3 were found to exist in pure Fe2O3. The successful deposition of Fe2O3 was further confirmed by XPS and FTIR spectra. In addition, HRTEM was also applied to evaluate the dispersity of the Fe2O3 nanoparticles, and the results indicated that the nanoparticles were well dispersed on the TNT inner walls, resulting in efficient separation of charge carriers and homogeneous dispersion of Fe2O3 nanoparticles, which was further verified by the PL and BET analysis. According to the UV–vis spectra, the band structures of these catalysts were derived and it was found that the band alignments of these heterostructures were staggered, which might have resulted from the coexistence of α-Fe2O3 and γ-Fe2O3. Benefiting from the superior structural and photo-chemical properties, the composites exhibited much higher photocatalytic degradation efficiency towards RhB than pure Fe2O3 under visible-light irradiation. The photocatalytic results were in good agreement with PL results, which revealed the photoactivity tendency of the heterojunctions could be well predicted through fluorescence intensity and fluorescence lifetime. Furthermore, the introduction of Fe2O3 in Fe2O3@TNT nanostructures made them easy to be separated and recovered in a magnetic field, which further confirmed that the synthesized Fe2O3@TNT composites are efficient and cost-effective materials. Finally, the photo dissolution phenomenon of 1FeTi was examined and the low leaching amount as well as stable recycling performance illustrated the promising prospects of 1FeTi for water remediation and rational design of Fe2O3 into TiO2 instead of Fe3O4.

Supplementary Materials

The following are available online at https://www.mdpi.com/2079-4991/10/7/1345/s1, Figure S1: N2 adsorption-desorption isotherms, Figure S2: Decay curve fitting procedures for the synthesized samples; Figure S3: Magnetization curve of Fe2O3.

Author Contributions

Conceptualization, X.H. and J.B.; methodology, Q.T. and R.W.; formal analysis, Q.T., J.B. and C.X.; data curation, Q.T. and Y.Z.; resources, H.H. and J.W.; writing-original draft preparation, Q.T.; writing-review and editing, J.B., L.Y. and H.H.; supervision, H.H. and L.Y. All authors have read and agreed to the published version of the manuscript.

Funding

This research was financially supported by National Key Research and Development Program of China (No. 2016YFB0600504).

Acknowledgments

The authors would like to thank National Engineering Research Center of Industrial Crystallization Technology at Tianjin University for the technical support.

Conflicts of Interest

The authors declare no conflict of interest.

References

  1. Rasool, K.; Pandey, R.P.; Rasheed, P.A.; Buczek, S.; Gogotsi, Y.; Mahmoud, K.A. Water treatment and environmental remediation applications of two- dimensional metal carbides (MXenes). Mater. Today 2019, 30, 80–102. [Google Scholar] [CrossRef]
  2. Shannon, M.A.; Bohn, P.W.; Elimelech, M.; Georgiadis, J.G.; Marĩas, B.J.; Mayes, A.M. Science and technology for water purification in the coming decades. Nature 2008, 452, 301–310. [Google Scholar] [CrossRef]
  3. Ouyang, J.; Wang, Y.; Li, T.; Zhou, L.; Liu, Z. Immobilization of carboxyl-modified multiwalled carbon nanotubes in chitosan-based composite membranes for U (VI) sorption. J. Radioanal. Nucl. Chem. 2018, 317, 1419–1428. [Google Scholar] [CrossRef]
  4. Li, G.; Wang, Y.; Bi, J.; Huang, X.; Mao, Y.; Luo, L. Partial Oxidation Strategy to Synthesize WS2/WO3 Heterostructure with Enhanced Adsorption Performance for Organic Dyes: Synthesis, Modelling, and Mechanism. Nanomaterials 2020, 10, 278. [Google Scholar] [CrossRef] [PubMed] [Green Version]
  5. Huang, X.; Yang, J.; Wang, J.; Bi, J.; Xie, C. Design and synthesis of core e shell Fe3O4@PTMT composite magnetic microspheres for adsorption of heavy metals from high salinity wastewater. Chemosphere 2018, 206, 513–521. [Google Scholar] [CrossRef]
  6. Bi, J.; Huang, X.; Wang, J.; Tao, Q.; Lu, H.; Luo, L.; Li, G.; Hao, H. Self-assembly of immobilized titanate films with different layers for heavy metal ions removal from wastewater: Synthesis, modeling and mechanism. Chem. Eng. J. 2020, 380, 122564. [Google Scholar] [CrossRef]
  7. Yang, B.; Bi, W.; Wan, Y.; Li, X.; Huang, M.; Yuan, R.; Ju, H.; Chu, W.; Wu, X.; He, L.; et al. Surface etching induced ultrathin sandwich structure realizing enhanced photocatalytic activity. Sci. China Chem. 2018, 61, 1572–1580. [Google Scholar] [CrossRef]
  8. Xu, Q.; Zhang, L.; Yu, J.; Wageh, S.; Al-Ghamdi, A.A.; Jaroniec, M. Direct Z-scheme photocatalysts: Principles, synthesis, and applications. Mater. Today 2018, 21, 1042–1063. [Google Scholar] [CrossRef]
  9. Hitam, C.N.C.; Jalil, A.A. A review on exploration of Fe2O3 photocatalyst towards degradation of dyes and organic contaminants. J. Environ. Manag. 2020, 258, 110050. [Google Scholar] [CrossRef]
  10. Wang, J.; Bai, Z. Fe-based catalysts for heterogeneous catalytic ozonation of emerging contaminants in water and wastewater. Chem. Eng. J. 2017, 312, 79–98. [Google Scholar] [CrossRef]
  11. Wu, W.; Jiang, C.; Roy, V.A.L. Recent progress in magnetic iron oxide-semiconductor composite nanomaterials as promising photocatalysts. Nanoscale 2015, 7, 38–58. [Google Scholar] [CrossRef] [Green Version]
  12. Chen, C.; Duan, F.; Zhao, S.; Wang, W.; Yang, F.; Nuansing, W.; Zhang, B.; Qin, Y.; Knez, M. Porous Fe2O3 nanotubes with α-γ phase junction for enhanced charge separation and photocatalytic property produced by molecular layer deposition. Appl. Catal. B Environ. 2019, 248, 218–225. [Google Scholar] [CrossRef]
  13. Kusior, A.; Michalec, K.; Jelen, P.; Radecka, M. Shaped Fe2O3 nanoparticles—Synthesis and enhanced photocatalytic degradation towards RhB. Appl. Surf. Sci. 2019, 476, 342–352. [Google Scholar] [CrossRef]
  14. Demirci, S.; Yurddaskal, M.; Dikici, T.; Sarıoğlu, C. Fabrication and characterization of novel iodine doped hollow and mesoporous hematite (Fe2O3) particles derived from sol-gel method and their photocatalytic performances. J. Hazard. Mater. 2018, 345, 27–37. [Google Scholar] [CrossRef] [PubMed]
  15. Guo, S.; Wang, H.; Yang, W.; Fida, H.; You, L.; Zhou, K. Scalable synthesis of Ca-doped α-Fe2O3 with abundant oxygen vacancies for enhanced degradation of organic pollutants through peroxymonosulfate activation. Appl. Catal. B Environ. 2020, 262, 118250. [Google Scholar] [CrossRef]
  16. Guo, R.; Qi, X.; Zhang, X.; Zhang, H.; Cheng, X. Synthesis of Ag2CO3/α-Fe2O3 heterojunction and it high visible light driven photocatalytic activity for elimination of organic pollutants. Sep. Purif. Technol. 2019, 211, 504–513. [Google Scholar] [CrossRef]
  17. Ma, Q.; Zhang, X.; Guo, R.; Zhang, H.; Cheng, Q.; Xie, M.; Cheng, X. Persulfate activation by magnetic γ-Fe2O3/Mn3O4 nanocomposites for degradation of organic pollutants. Sep. Purif. Technol. 2019, 210, 335–342. [Google Scholar] [CrossRef]
  18. Beketova, D.; Motola, M.; Sopha, H.; Michalicka, J.; Cicmancova, V.; Dvorak, F.; Hromadko, L.; Frumarova, B.; Stoica, M.; Macak, J.M. One-Step Decoration of TiO2 Nanotubes with Fe3O4 Nanoparticles: Synthesis and Photocatalytic and Magnetic Properties. ACS Appl. Nano Mater. 2020, 3, 1553–1563. [Google Scholar] [CrossRef]
  19. Peng, Y.; Li, M.; Zhang, S.; Nie, G.; Qi, M.; Pan, B. Improved performance and prolonged lifetime of titania-based materials: Sequential use as adsorbent and photocatalyst. Sci. China Chem. 2015, 58, 1211–1219. [Google Scholar] [CrossRef]
  20. Meng, A.; Zhang, L.; Cheng, B.; Yu, J. Dual Cocatalysts in TiO2 Photocatalysis. Adv. Mater. 2019, 31, 1–31. [Google Scholar] [CrossRef]
  21. Lee, K.; Mazare, A.; Schmuki, P. One-dimensional titanium dioxide nanomaterials: Nanotubes. Chem. Rev. 2014, 114, 9385–9454. [Google Scholar] [CrossRef] [PubMed] [Green Version]
  22. Wang, M.; Sun, L.; Lin, Z.; Cai, J.; Xie, K.; Lin, C. P-n Heterojunction photoelectrodes composed of Cu2O-loaded TiO2 nanotube arrays with enhanced photoelectrochemical and photoelectrocatalytic activities. Energy Environ. Sci. 2013, 6, 1211–1220. [Google Scholar] [CrossRef]
  23. Feng, J.X.; Xu, H.; Dong, Y.T.; Lu, X.F.; Tong, Y.X.; Li, G.R. Efficient Hydrogen Evolution Electrocatalysis Using Cobalt Nanotubes Decorated with Titanium Dioxide Nanodots. Angew. Chem. Int. Ed. 2017, 56, 2960–2964. [Google Scholar] [CrossRef] [PubMed]
  24. Challagulla, S.; Nagarjuna, R.; Ganesan, R.; Roy, S. Acrylate-based Polymerizable Sol-Gel Synthesis of Magnetically Recoverable TiO2 Supported Fe3O4 for Cr(VI) Photoreduction in Aerobic Atmosphere. ACS Sustain. Chem. Eng. 2016, 4, 974–982. [Google Scholar] [CrossRef]
  25. Li, Z.J.; Huang, Z.W.; Guo, W.L.; Wang, L.; Zheng, L.R.; Chai, Z.F.; Shi, W.Q. Enhanced Photocatalytic Removal of Uranium(VI) from Aqueous Solution by Magnetic TiO2/Fe3O4 and Its Graphene Composite. Environ. Sci. Technol. 2017, 51, 5666–5674. [Google Scholar] [CrossRef]
  26. Ong, W.J.; Tan, L.L.; Ng, Y.H.; Yong, S.T.; Chai, S.P. Graphitic Carbon Nitride (g-C3N4)-Based Photocatalysts for Artificial Photosynthesis and Environmental Remediation: Are We a Step Closer to Achieving Sustainability? Chem. Rev. 2016, 116, 7159–7329. [Google Scholar] [CrossRef]
  27. Bi, J.; Huang, X.; Wang, J.; Wang, T.; Wu, H.; Yang, J.; Lu, H.; Hao, H. Oil-phase cyclic magnetic adsorption to synthesize Fe3O4@C@TiO2-nanotube composites for simultaneous removal of Pb(II) and Rhodamine B. Chem. Eng. J. 2019, 366, 50–61. [Google Scholar] [CrossRef]
  28. Chen, H.; Li, T.; Zhang, L.; Wang, R.; Jiang, F.; Chen, J. Pb(II) adsorption on magnetic γ-Fe2O3/titanate nanotubes composite. J. Environ. Chem. Eng. 2015, 3, 2022–2030. [Google Scholar] [CrossRef]
  29. Zhao, L.; Cao, Q.; Wang, A.; Duan, J.; Zhou, W.; Sang, Y.; Liu, H. Iron oxide embedded titania nanowires—An active and stable electrocatalyst for oxygen evolution in acidic media. Nano Energy 2018, 45, 118–126. [Google Scholar] [CrossRef]
  30. Roy, P.; Berger, S.; Schmuki, P. TiO2 nanotubes: Synthesis and applications. Angew. Chem. Int. Ed. 2011, 50, 2904–2939. [Google Scholar] [CrossRef]
  31. Yang, K.; Peng, H.; Wen, Y.; Li, N. Re-examination of characteristic FTIR spectrum of secondary layer in bilayer oleic acid-coated Fe3O4 nanoparticles. Appl. Surf. Sci. 2010, 256, 3093–3097. [Google Scholar] [CrossRef]
  32. Jang, J.T.; Lee, J.; Seon, J.; Ju, E.; Kim, M.; Kim, Y.I.L.; Kim, M.G.; Takemura, Y.; Arbab, A.S.; Kang, K.W.; et al. Giant Magnetic Heat Induction of Magnesium-Doped γ-Fe2O3 Superparamagnetic Nanoparticles for Completely Killing Tumors. Adv. Mater. 2018, 30, 1–8. [Google Scholar] [CrossRef]
  33. Liu, S.; Zheng, L.; Yu, P.; Han, S.; Fang, X. Novel Composites of α-Fe2O3 Tetrakaidecahedron and Graphene Oxide as an Effective Photoelectrode with Enhanced Photocurrent Performances. Adv. Funct. Mater. 2016, 26, 3331–3339. [Google Scholar] [CrossRef]
  34. Wu, H.; Wu, G.; Wang, L. Peculiar porous α-Fe2O3, γ-Fe2O3 and Fe3O4 nanospheres: Facile synthesis and electromagnetic properties. Powder Technol. 2015, 269, 443–451. [Google Scholar] [CrossRef]
  35. Ling, M.; Blackman, C.S. Gas-phase synthesis of hybrid nanostructured materials. Nanoscale 2018, 10, 22981–22989. [Google Scholar] [CrossRef] [PubMed] [Green Version]
  36. Shen, G.; Zhang, R.; Pan, L.; Hou, F.; Zhao, Y.; Shen, Z.; Mi, W.; Shi, C.; Wang, Q.; Zhang, X.; et al. Regulating the Spin State of Fe III by Atomically Anchoring on Ultrathin Titanium Dioxide for Efficient Oxygen Evolution Electrocatalysis Angewandte. Angew. Chem. Int. Ed. 2020, 59, 2313–2317. [Google Scholar] [CrossRef]
  37. Xie, J.; Jin, R.; Li, A.; Bi, Y.; Ruan, Q.; Deng, Y.; Zhang, Y.; Yao, S.; Sankar, G.; Ma, D.; et al. Highly selective oxidation of methane to methanol at ambient conditions by titanium dioxide-supported iron species. Nat. Catal. 2018, 1, 889–896. [Google Scholar] [CrossRef]
  38. Mou, H.; Song, C.; Zhou, Y.; Zhang, B.; Wang, D. Design and synthesis of porous Ag/ZnO nanosheets assemblies as super photocatalysts for enhanced visible-light degradation of 4-nitrophenol and hydrogen evolution. Appl. Catal. B Environ. 2018, 221, 565–573. [Google Scholar] [CrossRef]
  39. Guo, T.; Wang, K.; Zhang, G.; Wu, X. A novel α-Fe2O3@g-C3N4 catalyst: Synthesis derived from Fe-based MOF and its superior photo-Fenton performance. Appl. Surf. Sci. 2019, 469, 331–339. [Google Scholar] [CrossRef]
  40. Puthirath Balan, A.; Radhakrishnan, S.; Woellner, C.F.; Sinha, S.K.; Deng, L.; Reyes, C.D.L.; Rao, B.M.; Paulose, M.; Neupane, R.; Apte, A.; et al. Exfoliation of a non-van der Waals material from iron ore hematite. Nat. Nanotechnol. 2018, 13, 602–609. [Google Scholar] [CrossRef] [PubMed]
  41. Chen, Y.; Jiang, D.; Li, L.; Li, Z.; Li, Q.; Shi, R. Enhanced photoelectrochemical activity of α-Fe2O3/TiO2 nanoheterojunction by controlling hydrodynamic conditions. Nanotechnology 2020, 31, 174002. [Google Scholar] [CrossRef] [PubMed]
  42. Charanpahari, A.; Umare, S.S.; Gokhale, S.P.; Sudarsan, V.; Sreedhar, B.; Sasikala, R. Enhanced photocatalytic activity of multi-doped TiO2 for the degradation of methyl orange. Appl. Catal. A Gen. 2012, 443–444, 96–102. [Google Scholar] [CrossRef]
  43. Liang, H.; Liu, K.; Ni, Y. Synthesis of mesoporous α-Fe2O3 via sol-gel methods using cellulose nano-crystals (CNC) as template and its photo-catalytic properties. Mater. Lett. 2015, 159, 218–220. [Google Scholar] [CrossRef]
  44. Lei, R.; Ni, H.; Chen, R.; Zhang, B.; Zhan, W.; Li, Y. Growth of Fe2O3/SnO2 nanobelt arrays on iron foil for efficient photocatalytic degradation of methylene blue. Chem. Phys. Lett. 2017, 673, 1–6. [Google Scholar] [CrossRef]
  45. Wei, Z.; Wei, X.; Wang, S.; He, D. Preparation and visible-light photocatalytic activity of α-Fe2O3/γ-Fe2O3 magnetic heterophase photocatalyst. Mater. Lett. 2014, 118, 107–110. [Google Scholar] [CrossRef]
  46. Tyrpekl, V.; Vejpravová, J.P.; Roca, A.G.; Murafa, N.; Szatmary, L.; Nižňanský, D. Magnetically separable photocatalytic composite γ-Fe2O3@TiO2 synthesized by heterogeneous precipitation. Appl. Surf. Sci. 2011, 257, 4844–4848. [Google Scholar] [CrossRef]
  47. Costa, G.S.; Costa, M.J.S.; Oliveira, H.G.; Lima, L.C.B.; Luz, G.E.; Cavalcante, L.S.; Santos, R.S. Effect of the applied potential condition on the photocatalytic properties of Fe2O3/WO3 heterojunction films. J. Inorg. Organomet. Polym. Mater. 2020. [Google Scholar] [CrossRef]
  48. Park, Y.; Kim, H.; Lee, G.; Pawar, R.C.; Lee, J.; Lee, C.S. Photocatalytic evaluation of self-assembled porous network structure of ferric oxide film fabricated by dry deposition process. Mater. Chem. Phys. 2016, 181, 241–247. [Google Scholar] [CrossRef]
  49. He, Z.; Sun, C.; Yang, S.; Ding, Y.; He, H.; Wang, Z. Photocatalytic degradation of rhodamine B by Bi2WO6 with electron accepting agent under microwave irradiation: Mechanism and pathway. J. Hazard. Mater. 2009, 162, 1477–1486. [Google Scholar] [CrossRef]
  50. Natarajan, T.S. Enhanced photocatalytic activity of bismuth-doped TiO2 nanotubes under direct sunlight irradiation for degradation of Rhodamine B dye. J. Nanoparticle Res. 2013, 15, 1669–1671. [Google Scholar] [CrossRef]
Scheme 1. The preparation process of Fe2O3@TNT composites.
Nanomaterials 10 01345 sch001
Figure 1. XRD full-range spectra (A) and narrow-range spectra (B) of Fe2O3 (magenta), 0.5FeTi (red), 1FeTi (blue) and 2FeTi (green); SAED images of Fe2O3 (C) and 2FeTi (D).
Nanomaterials 10 01345 g001
Figure 2. SEM and HRTEM morphologies for the samples. (A) SEM image of anodized TNT; (B) HRTEM image of 0.5FeTi; (C) HRTEM image of 1FeTi; (D) HRTEM image of Fe2O3; (E) HRTEM image of 2FeTi; (F) HRTEM image of 1FeTi.
Nanomaterials 10 01345 g002
Figure 3. XPS spectra of the as-synthesized composites. (A) Full survey of samples; (B) Fe 2p region of 0.5FeTi; (C) Fe 2p region of 1FeTi; (D) Fe 2p region of 2FeTi.
Nanomaterials 10 01345 g003
Figure 4. Nitrogen adsorption–desorption isotherms and the corresponding pore size distribution curves for 0.5FeTi (A), 1FeTi (B), 2FeTi (C), and Fe2O3 (D).
Nanomaterials 10 01345 g004
Figure 5. UV−vis absorption spectra and the bandgap correlations for 0.5FeTi, 1FeTi, 2FeTi, and Fe2O3 in the range of (A) 240–255 nm; (B) 354–380 nm; (C) 590–720 nm.
Nanomaterials 10 01345 g005
Scheme 2. Staggered band alignments in as-prepared composites (A) 0.5FeTi; (B) 1FeTi; (C) 2FeTi.
Nanomaterials 10 01345 sch002
Figure 6. (A) PL spectra of 0.5FeTi, 1FeTi, 2FeTi, and Fe2O3; (B) Decay curves of 0.5FeTi, 1FeTi, 2FeTi, and Fe2O3 (excited at λ = 420 nm).
Nanomaterials 10 01345 g006
Figure 7. Magnetization curves of 0.5FeTi, 1FeTi and 2FeTi. (The inset is the magnetic separation process of 1FeTi in solution using a magnet).
Nanomaterials 10 01345 g007
Figure 8. Photodegradation of RhB by Fe2O3 and Fe2O3@TNT composites under visible light irradiation: (A) Degradation rate curves; (B) Pseudo-first correlation of kinetic constants.
Nanomaterials 10 01345 g008
Scheme 3. Plausible mineralization pathways for RhB by using 1FeTi.
Nanomaterials 10 01345 sch003
Figure 9. Recyclable performance of 1FeTi under visible light irradiation: (A) XPS Fe 2p spectra of 1FeTi before and after photodegradation; (B) Photodegradation performance of 1FeTi in the RhB solutions within three cycles.
Nanomaterials 10 01345 g009
Table 1. Molar content of carbon-subtracted peak area in Figure 3A.
SampleTi 2p/%O 1s/%Fe 2p/%
0.5FeTi32.9766.570.47
1FeTi30.9067.022.09
2FeTi29.0466.944.02
Table 2. BET surface area and BJH pore results of the as-prepared catalysts.
SampleSBET/(m2·g1)Adsorption BranchDesorption Branch
Pore Size/nmPore Volume/cm3·g1Pore Size/nmPore Volume/cm3·g1
0.5FeTi28.4624.770.19522.720.186
1FeTi29.3623.310.16012.230.148
2FeTi28.2924.420.1929.760.174
Fe2O310.9613.770.07911.990.069
Table 3. Photodegradation parameters of the synthesized catalysts.
Sample0.5FeTi1FeTi2FeTiFe2O3
Degradation Efficiency (%)72.1184.9686.5343.55
k/h−10.20100.26630.28750.0890
R20.99850.99870.99360.9972
Table 4. Comparison of the photocatalytic performances of Fe2O3-based materials.
MaterialsLight SourceTime (h)Photodegradation
Amount (%)
Ref.
α-Fe2O3Visible light338% MB[43]
Fe2O3/SnO2UV light470% MB[44]
α-Fe2O3/γ-Fe2O3Visible light1290% RhB[45]
γ-Fe2O3@TiO2UV light5~18% 4-chlophenol[46]
Fe2O3@WO3Polychromatic light318% RhB[47]
Fe2O3Visible light6~70% RhB[48]
2FeTiVisible light686.53% RhBThis work