
A Study on Machine Learning Methods’ Application for Dye Adsorption Prediction onto Agricultural Waste Activated Carbon

 ,
,  ,
,  , ,
, ,
Abstract
:1. Introduction
2. Materials and Methods
2.1. Data Collection
2.2. Data Pre-Processing (Pre-Processing) and Model Estimators
2.3. Models Built with Decision Tree, Gradient Boosting, and Random Forest Methods
2.4. Statistical Evaluations
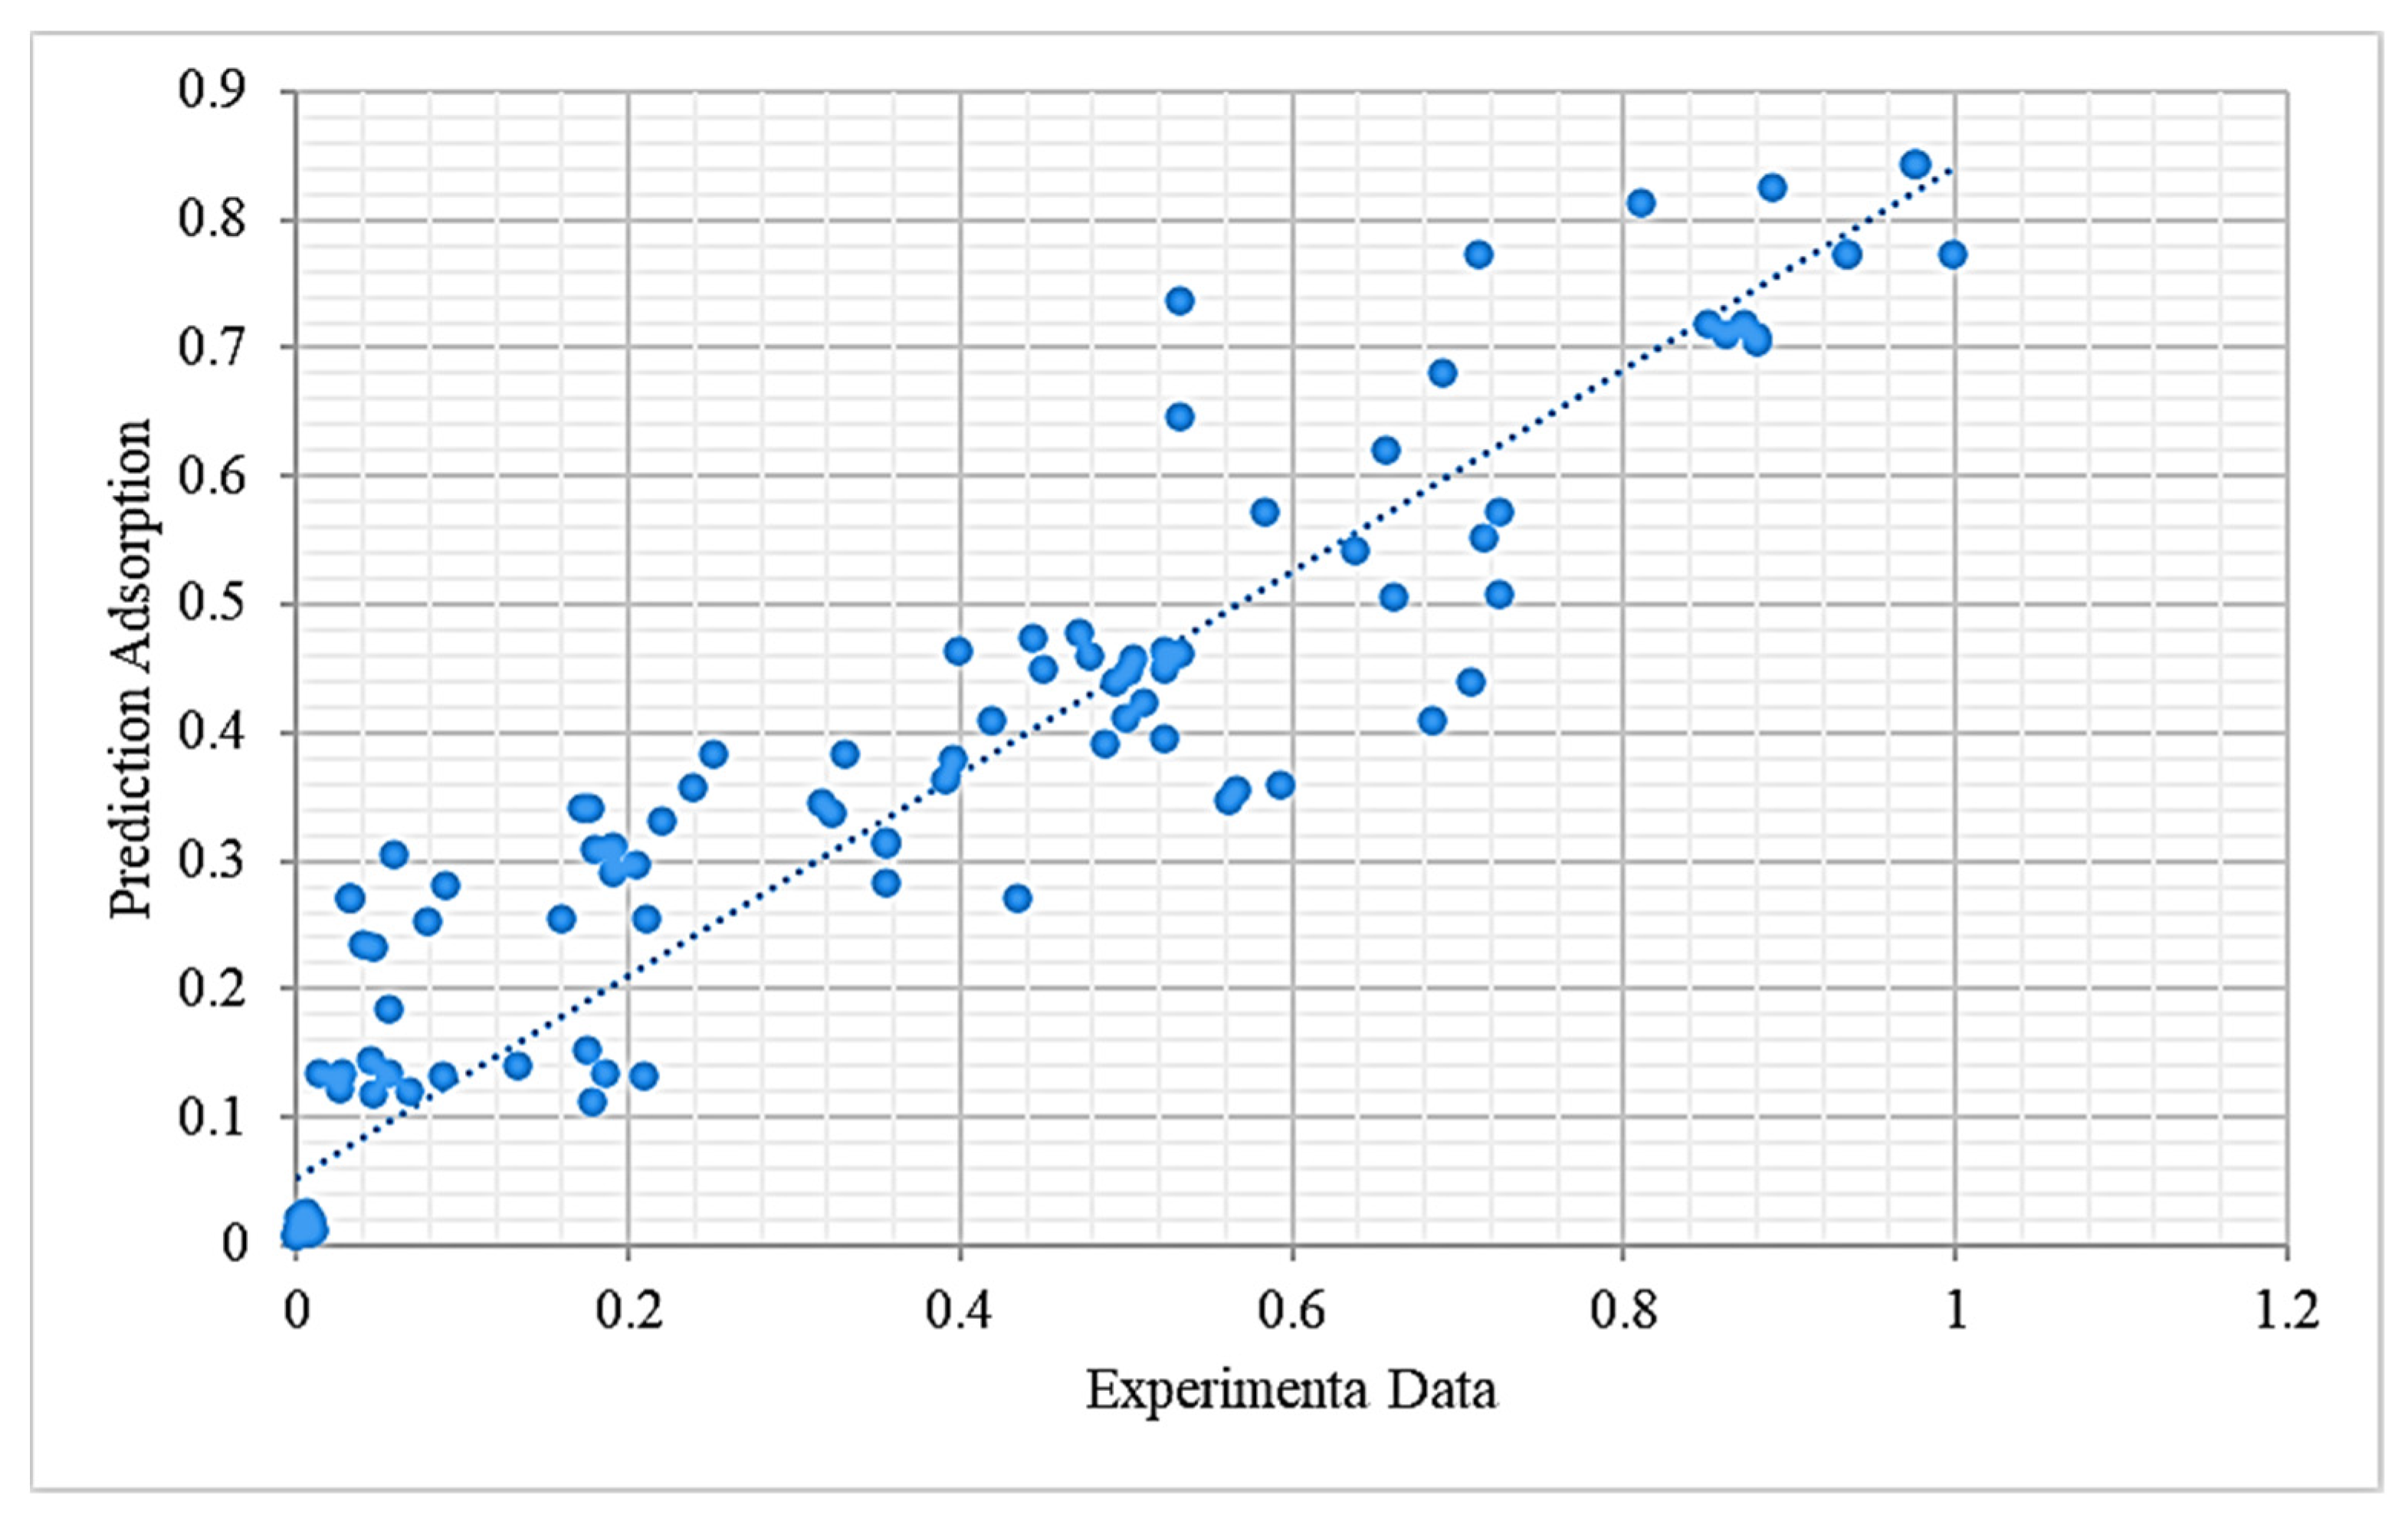
3. Results and Discussion
Comparison of the Models
4. Conclusions
5. Future Perspectives
- The dye adsorption capability using other ML models such as the group method of data handling (GMDH).
- The application of machine learning models on dye adsorption using raw bio-waste.
- Specific study on the capability of ML models on the adsorption of pollutants like BOD and COD.
Supplementary Materials
Author Contributions
Funding
Informed Consent Statement
Conflicts of Interest
References
- Kausar, A.; Iqbal, M.; Javed, A.; Aftab, K.; Nazli, Z.; Nawaz, H.; Nouren, S. Dyes adsorption using clay and modified clay: A review. J. Mol. Liq. 2018, 256, 395–407. [Google Scholar] [CrossRef]
- Hunger, K. Industrial Dyes: Chemistry, Properties, Applications; Wiley-Vch: Frankfurt, Germany, 2007; ISBN 3-527-30426-6. [Google Scholar]
- Regti, A.; Laamari, M.R.; Stiriba, S.-E.; El Haddad, M. Use of response factorial design for process optimization of basic dye adsorption onto activated carbon derived from Persea species. Microchem. J. 2017, 130, 129–136. [Google Scholar] [CrossRef]
- Abdolali, A.; Guo, W.S.; Ngo, H.H.; Chen, S.S.; Nguyen, N.C.; Tung, K.L. Typical lignocellulosic wastes and by-products for biosorption process in water and wastewater treatment: A critical review. Bioresour. Technol. 2014, 160, 57–66. [Google Scholar] [CrossRef]
- Asfaram, A.; Ghaedi, M.; Agarwal, S.; Tyagi, I.; Gupta, V.K. Removal of basic dye Auramine-O by ZnS: Cu nanoparticles loaded on activated carbon: Optimization of parameters using response surface methodology with central composite design. RSC Adv. 2015, 5, 18438–18450. [Google Scholar] [CrossRef]
- Lellis, B.; Fávaro-Polonio, C.Z.; Pamphile, J.A.; Polonio, J.C. Effects of textile dyes on health and the environment and bioremediation potential of living organisms. Biotechnol. Res. Innov. 2019, 3, 275–290. [Google Scholar] [CrossRef]
- León, O.; Muñoz-Bonilla, A.; Soto, D.; Pérez, D.; Rangel, M.; Colina, M.; Fernández-García, M. Removal of anionic and cationic dyes with bioadsorbent oxidized chitosans. Carbohydr. Polym. 2018, 194, 375–383. [Google Scholar] [CrossRef]
- Qi, X.; Wei, W.; Li, J.; Zuo, G.; Pan, X.; Su, T.; Zhang, J.; Dong, W. Salecan-based pH-sensitive hydrogels for insulin delivery. Mol. Pharm. 2017, 14, 431–440. [Google Scholar] [CrossRef]
- Moosavi, S.; Lai, C.W.; Gan, S.; Zamiri, G.; Akbarzadeh Pivehzhani, O.; Johan, M.R. Application of efficient magnetic particles and activated carbon for dye removal from wastewater. ACS Omega 2020, 5, 20684–20697. [Google Scholar] [CrossRef] [PubMed]
- Moosavi, S.; Lai, C.W.; Akbarzadeh, O.; Johan, M.R. Recycled Activated Carbon-Based Materials for the Removal of Organic Pollutants from Wastewater. Waste Recycl. Technol. Nanomater. Manuf. 2021, 513–539. [Google Scholar]
- Moosavi, S.; Li, R.Y.M.; Lai, C.W.; Yusof, Y.; Gan, S.; Akbarzadeh, O.; Chowhury, Z.Z.; Yue, X.G.; Johan, M.R. Methylene blue dye photocatalytic degradation over synthesised fe3 o4 /ac/tio2 nano-catalyst: Degradation and reusability studies. Nanomaterials 2020, 10, 2360. [Google Scholar] [CrossRef]
- Moosavi, S.; Gan, S.; Zakaria, S. Functionalized cellulose beads with activated carbon Fe3O4/CoFe 2O4 for cationic dye removal. Cellul. Chem. Technol. 2019, 53, 815–825. [Google Scholar] [CrossRef]
- Zhang, B.; Ma, Z.; Yang, F.; Liu, Y.; Guo, M. Adsorption properties of ion recognition rice straw lignin on PdCl42−: Equilibrium, kinetics and mechanism. Colloids Surf. A Physicochem. Eng. Asp. 2017, 514, 260–268. [Google Scholar] [CrossRef]
- Al-Saadi, A.A.; Saleh, T.A.; Gupta, V.K. Spectroscopic and computational evaluation of cadmium adsorption using activated carbon produced from rubber tires. J. Mol. Liq. 2013, 188, 136–142. [Google Scholar] [CrossRef]
- Wong, S.; Yac’cob, N.A.N.; Ngadi, N.; Hassan, O.; Inuwa, I.M. From pollutant to solution of wastewater pollution: Synthesis of activated carbon from textile sludge for dye adsorption. Chin. J. Chem. Eng. 2018, 26, 870–878. [Google Scholar] [CrossRef]
- Gao, Y.; Xu, S.; Yue, Q.; Wu, Y.; Gao, B. Chemical preparation of crab shell-based activated carbon with superior adsorption performance for dye removal from wastewater. J. Taiwan Inst. Chem. Eng. 2016, 61, 327–335. [Google Scholar] [CrossRef]
- Aravind, M.; Amalanathan, M. Structural, morphological, and optical properties of country egg shell derived activated carbon for dye removal. Mater. Today Proc. 2021, 43, 1491–1495. [Google Scholar] [CrossRef]
- Milenković, D.D.; Bojić, A.L.; Veljković, V.B. Ultrasound-assisted adsorption of 4-dodecylbenzene sulfonate from aqueous solutions by corn cob activated carbon. Ultrason. Sonochem. 2013, 20, 955–962. [Google Scholar] [CrossRef] [PubMed]
- Ajmal, M.; Rao, R.A.K.; Khan, M.A. Adsorption of copper from aqueous solution on Brassica cumpestris (mustard oil cake). J. Hazard. Mater. 2005, 122, 177–183. [Google Scholar] [CrossRef]
- Chen, S.; Qin, C.; Wang, T.; Chen, F.; Li, X.; Hou, H.; Zhou, M. Study on the adsorption of dyestuffs with different properties by sludge-rice husk biochar: Adsorption capacity, isotherm, kinetic, thermodynamics and mechanism. J. Mol. Liq. 2019, 285, 62–74. [Google Scholar] [CrossRef]
- Fideles, R.A.; Ferreira, G.M.D.; Teodoro, F.S.; Adarme, O.F.H.; da Silva, L.H.M.; Gil, L.F.; Gurgel, L.V.A. Trimellitated sugarcane bagasse: A versatile adsorbent for removal of cationic dyes from aqueous solution. Part I: Batch adsorption in a monocomponent system. J. Colloid Interface Sci. 2018, 515, 172–188. [Google Scholar] [CrossRef]
- Gupta, K.; Gupta, D.; Khatri, O.P. Graphene-like porous carbon nanostructure from Bengal gram bean husk and its application for fast and efficient adsorption of organic dyes. Appl. Surf. Sci. 2019, 476, 647–657. [Google Scholar] [CrossRef]
- Suganya, S.; Saravanan, A.; Ravikumar, C. Computation of adsorption parameters for the removal of dye from wastewater by microwave assisted sawdust: Theoretical and experimental analysis. Environ. Toxicol. Pharmacol. 2017, 50, 45–57. [Google Scholar]
- Pholosi, A.; Naidoo, E.B.; Ofomaja, A.E. Batch and continuous flow studies of Cr (VI) adsorption from synthetic and real wastewater by magnetic pine cone composite. Chem. Eng. Res. Des. 2020, 153, 806–818. [Google Scholar] [CrossRef]
- Archin, S.; Sharifi, S.H.; Asadpour, G. Optimization and modeling of simultaneous ultrasound-assisted adsorption of binary dyes using activated carbon from tobacco residues: Response surface methodology. J. Clean. Prod. 2019, 239, 118136. [Google Scholar] [CrossRef]
- Xiao, W.; Garba, Z.N.; Sun, S.; Lawan, I.; Wang, L.; Lin, M.; Yuan, Z. Preparation and evaluation of an effective activated carbon from white sugar for the adsorption of rhodamine B dye. J. Clean. Prod. 2020, 253, 119989. [Google Scholar] [CrossRef]
- Ghaedi, M.; Ghaedi, A.M.; Negintaji, E.; Ansari, A.; Vafaei, A.; Rajabi, M. Random forest model for removal of bromophenol blue using activated carbon obtained from Astragalus bisulcatus tree. J. Ind. Eng. Chem. 2014, 20, 1793–1803. [Google Scholar] [CrossRef]
- Jain, S.N.; Tamboli, S.R.; Sutar, D.S.; Jadhav, S.R.; Marathe, J.V.; Shaikh, A.A.; Prajapati, A.A. Batch and continuous studies for adsorption of anionic dye onto waste tea residue: Kinetic, equilibrium, breakthrough and reusability studies. J. Clean. Prod. 2020, 252, 119778. [Google Scholar] [CrossRef]
- Li, L.; Wu, M.; Song, C.; Liu, L.; Gong, W.; Ding, Y.; Yao, J. Efficient removal of cationic dyes via activated carbon with ultrahigh specific surface derived from vinasse wastes. Bioresour. Technol. 2021, 322, 124540. [Google Scholar] [CrossRef]
- Alshabib, M.; Oluwadamilare, M.A.; Tanimu, A.; Abdulazeez, I.; Alhooshani, K.; Ganiyu, S.A. Experimental and DFT investigation of ceria-nanocomposite decorated AC derived from groundnut shell for efficient removal of methylene-blue from wastewater effluent. Appl. Surf. Sci. 2021, 536, 147749. [Google Scholar] [CrossRef]
- Mullainathan, S.; Spiess, J. Machine learning: An applied econometric approach. J. Econ. Perspect. 2017, 31, 87–106. [Google Scholar] [CrossRef] [Green Version]
- Zhu, X.; Wang, X.; Ok, Y.S. The application of machine learning methods for prediction of metal sorption onto biochars. J. Hazard. Mater. 2019, 378, 120727. [Google Scholar] [CrossRef] [PubMed]
- Lu, P.; Lin, H.; Yu, W.; Chern, J. Chemical regeneration of activated carbon used for dye adsorption. J. Taiwan Inst. Chem. Eng. 2011, 42, 305–311. [Google Scholar] [CrossRef]
- Shokry, H.; Elkady, M.; Hamad, H. Nano activated carbon from industrial mine coal as adsorbents for removal of dye from simulated textile wastewater: Operational parameters and mechanism study. J. Mater. Res. Technol. 2019, 8, 4477–4488. [Google Scholar] [CrossRef]
- Mei, S.; Gu, J.; Ma, T.; Li, X.; Hu, Y.; Li, W.; Zhang, J.; Han, Y. N-doped activated carbon from used dyeing wastewater adsorbent as a metal-free catalyst for acetylene hydrochlorination. Chem. Eng. J. 2019, 371, 118–129. [Google Scholar] [CrossRef]
- Ravenni, G.; Cafaggi, G.; Sárossy, Z.; Nielsen, K.T.R.; Ahrenfeldt, J.; Henriksen, U.B. Waste chars from wood gasification and wastewater sludge pyrolysis compared to commercial activated carbon for the removal of cationic and anionic dyes from aqueous solution. Bioresour. Technol. Rep. 2020, 10, 100421. [Google Scholar] [CrossRef]
- Rani, K.M.; Palanisamy, P.N.; Gayathri, S.; Tamilselvi, S. Adsorptive removal of basic violet dye from aqueous solution by activated carbon prepared from tea dust material. Int. J. Innov. Res. Sci. Eng. Technol. 2015, 4, 6845–6853. [Google Scholar]
- Mudyawabikwa, B.; Mungondori, H.H.; Tichagwa, L.; Katwire, D.M. Methylene blue removal using a low-cost activated carbon adsorbent from tobacco stems: Kinetic and equilibrium studies. Water Sci. Technol. 2017, 75, 2390–2402. [Google Scholar] [CrossRef] [Green Version]
- Wang, H.; Li, Z.; Yahyaoui, S.; Hanafy, H.; Seliem, M.K.; Bonilla-Petriciolet, A.; Dotto, G.L.; Sellaoui, L.; Li, Q. Effective adsorption of dyes on an activated carbon prepared from carboxymethyl cellulose: Experiments, characterization and advanced modelling. Chem. Eng. J. 2021, 417, 128116. [Google Scholar] [CrossRef]
- Safavian, S.R.; Landgrebe, D. A survey of decision tree classifier methodology. IEEE Trans. Syst. Man. Cybern. 1991, 21, 660–674. [Google Scholar] [CrossRef] [Green Version]
- Yu, Z.; Haghighat, F.; Fung, B.C.M.; Yoshino, H. A decision tree method for building energy demand modeling. Energy Build. 2010, 42, 1637–1646. [Google Scholar] [CrossRef] [Green Version]
- Jiang, W.; Xing, X.; Li, S.; Zhang, X.; Wang, W. Synthesis, characterization and machine learning based performance prediction of straw activated carbon. J. Clean. Prod. 2019, 212, 1210–1223. [Google Scholar] [CrossRef]
- Mui, E.L.K.; Cheung, W.H.; McKay, G. Tyre char preparation from waste tyre rubber for dye removal from effluents. J. Hazard. Mater. 2010, 175, 151–158. [Google Scholar] [CrossRef]
- Gao, L.-Y.; Deng, J.-H.; Huang, G.-F.; Li, K.; Cai, K.-Z.; Liu, Y.; Huang, F. Relative distribution of Cd2+ adsorption mechanisms on biochars derived from rice straw and sewage sludge. Bioresour. Technol. 2019, 272, 114–122. [Google Scholar] [CrossRef]
- Reyhanitabar, A.; Frahadi, E.; Ramezanzadeh, H.; Oustan, S. Effect of Pyrolysis Temperature and Feedstock Sources on Physicochemical Characteristics of Biochar. J. Agric. Sci. Technol. 2020, 22, 547–561. [Google Scholar]
- Ahmad, H.; Nurunnabi, M.; Rahman, M.M.; Kumar, K.; Tauer, K.; Minami, H.; Gafur, M.A. Magnetically doped multi stimuli-responsive hydrogel microspheres with IPN structure and application in dye removal. Colloids Surf. A Physicochem. Eng. Asp. 2014, 459, 39–47. [Google Scholar] [CrossRef]
- Zhu, X.; Wan, Z.; Tsang, D.C.W.; He, M.; Hou, D.; Su, Z.; Shang, J. Machine learning for the selection of carbon-based materials for tetracycline and sulfamethoxazole adsorption. Chem. Eng. J. 2021, 406, 126782. [Google Scholar] [CrossRef]
- Zhou, N.; Chen, H.; Xi, J.; Yao, D.; Zhou, Z.; Tian, Y.; Lu, X. Biochars with excellent Pb (II) adsorption property produced from fresh and dehydrated banana peels via hydrothermal carbonization. Bioresour. Technol. 2017, 232, 204–210. [Google Scholar] [CrossRef]
- Wang, H.; Chu, Y.; Fang, C.; Huang, F.; Song, Y.; Xue, X. Sorption of tetracycline on biochar derived from rice straw under different temperatures. PLoS ONE 2017, 12, e0182776. [Google Scholar] [CrossRef] [PubMed]
- He, J.; Dai, J.; Zhang, T.; Sun, J.; Xie, A.; Tian, S.; Yan, Y.; Huo, P. Preparation of highly porous carbon from sustainable α-cellulose for superior removal performance of tetracycline and sulfamethazine from water. RSC Adv. 2016, 6, 28023–28033. [Google Scholar] [CrossRef]
- Selmi, T.; Sanchez-Sanchez, A.; Gadonneix, P.; Jagiello, J.; Seffen, M.; Sammouda, H.; Celzard, A.; Fierro, V. Tetracycline removal with activated carbons produced by hydrothermal carbonisation of Agave americana fibres and mimosa tannin. Ind. Crops Prod. 2018, 115, 146–157. [Google Scholar] [CrossRef]
- Gonzalez-Serrano, E.; Cordero, T.; Rodriguez-Mirasol, J.; Cotoruelo, L.; Rodriguez, J.J. Removal of water pollutants with activated carbons prepared from H3PO4 activation of lignin from kraft black liquors. Water Res. 2004, 38, 3043–3050. [Google Scholar] [CrossRef] [PubMed]
- Arampatzidou, A.C.; Deliyanni, E.A. Comparison of activation media and pyrolysis temperature for activated carbons development by pyrolysis of potato peels for effective adsorption of endocrine disruptor bisphenol-A. J. Colloid Interface Sci. 2016, 466, 101–112. [Google Scholar] [CrossRef] [PubMed]
- Ahmad, M.W.; Mourshed, M.; Rezgui, Y. Trees vs Neurons: Comparison between random forest and ANN for high-resolution prediction of building energy consumption. Energy Build. 2017, 147, 77–89. [Google Scholar] [CrossRef]

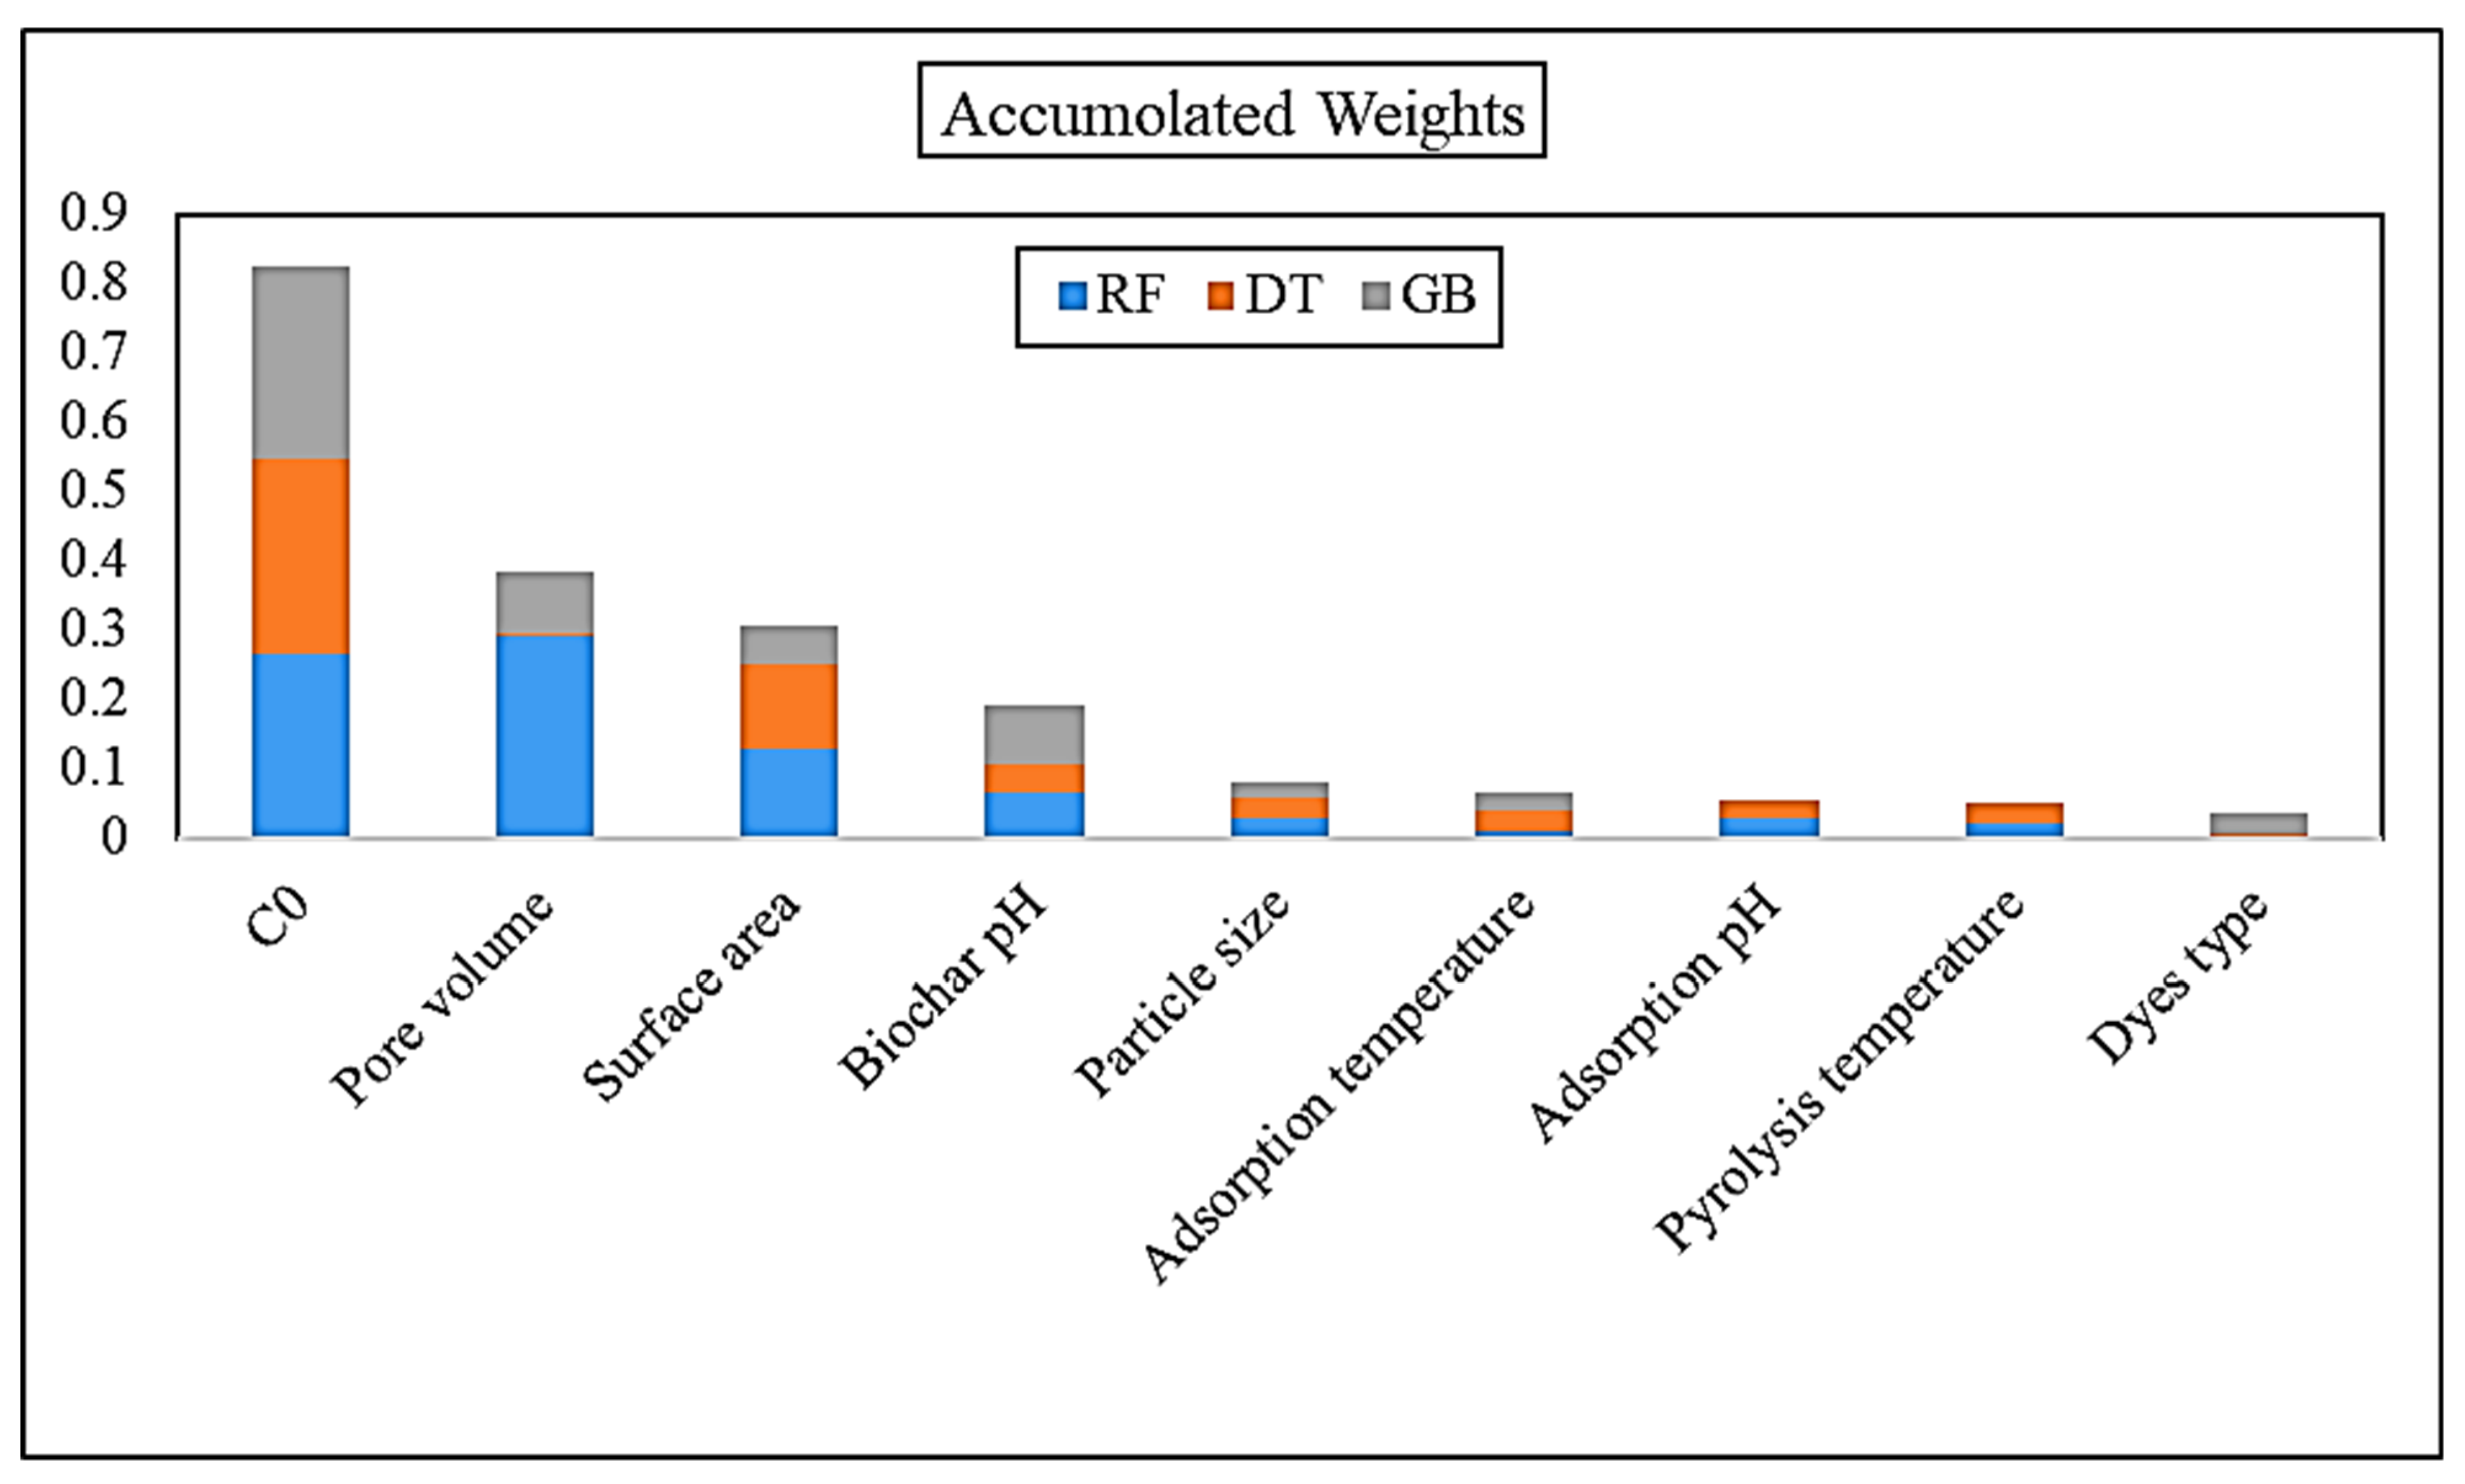
| DT | RF | GB | |||
|---|---|---|---|---|---|
| Attribute | Weight | Attribute | Weight | Attribute | Weight |
| C0 | 0.281 | Pore volume | 0.291 | C0 | 0.279 |
| Surface area | 0.122 | C0 | 0.267 | Pore volume | 0.086 |
| Agro-waste pH | 0.042 | Surface area | 0.131 | Agro-waste pH | 0.082 |
| Pyrolysis temperature | 0.03 | Agro-waste pH | 0.067 | Surface area | 0.055 |
| Particle size | 0.029 | Adsorption pH | 0.031 | Dye type | 0.032 |
| Adsorption temperature | 0.027 | Particle size | 0.029 | Adsorption temperature | 0.026 |
| Adsorption pH | 0.025 | Pyrolysis temperature | 0.022 | Particle size | 0.025 |
| Pore volume | 0.007 | Adsorption temperature | 0.013 | Pyrolysis temperature | 0 |
| Dye type | 0.004 | Dye type | 0.002 | Adsorption pH | 0 |
| Attribute | RF | DT | GB |
|---|---|---|---|
| C0 | 0.267 | 0.281 | 0.279 |
| Pore volume | 0.291 | 0.007 | 0.086 |
| Surface area | 0.131 | 0.122 | 0.055 |
| Biochar pH | 0.067 | 0.042 | 0.082 |
| Particle size | 0.029 | 0.029 | 0.025 |
| Train | Test | |||||
|---|---|---|---|---|---|---|
| Index | R2 | RMSE | Absolute Error | R2 | RMSE | Absolute Error |
| RF | 0.92 | 0.116 | 0.076 | 0.84 | 0.127 | 0.098 |
| G.B | 0.84 | 0.162 | 0.076 | 0.76 | 0.081 | 0.100 |
| D.T | 0.83 | 0.178 | 0.098 | 0.71 | 0.130 | 0.167 |
| Train | Test | |||||
|---|---|---|---|---|---|---|
| Index | R2 | RMSE | Absolute Error | R2 | RMSE | Absolute Error |
| RF | 0.90 | 0.148 | 0.092 | 0.81 | 0.150 | 0.098 |
| G.B. | 0.83 | 0.164 | 0.100 | 0.72 | 0.169 | 0.124 |
| D.T | 0.82 | 0.178 | 0.105 | 0.72 | 0.188 | 0.114 |
| Attributes | Adsorption Efficiency | Biochar pH | C0 | Particle Size | Pore Volume | Surface Area |
|---|---|---|---|---|---|---|
| Adsorption efficiency | 1 | −0.558 | 0.739 | 0.084 | 0.666 | 0.690 |
| Biochar pH | −0.558 | 1 | −0.424 | 0.102 | −0.5401 | −0.252 |
| C0 | 0.739 | −0.424 | 1 | 0.095 | 0.546 | 0.664 |
| Particle size | 0.084 | 0.102 | 0.095 | 1 | 0.154 | 0.277 |
| Pore volume | 0.666 | −0.540 | 0.546 | 0.154 | 1 | 0.669 |
| Surface area | 0.690 | −0.252 | 0.664 | 0.277 | 0.669 | 1 |
| Attribute | RF |
|---|---|
| C0 | 0.347 |
| Pore volume | 0.287 |
| Surface area | 0.131 |
| Agro-waste pH | 0.056 |
| Particle size | 0.033 |
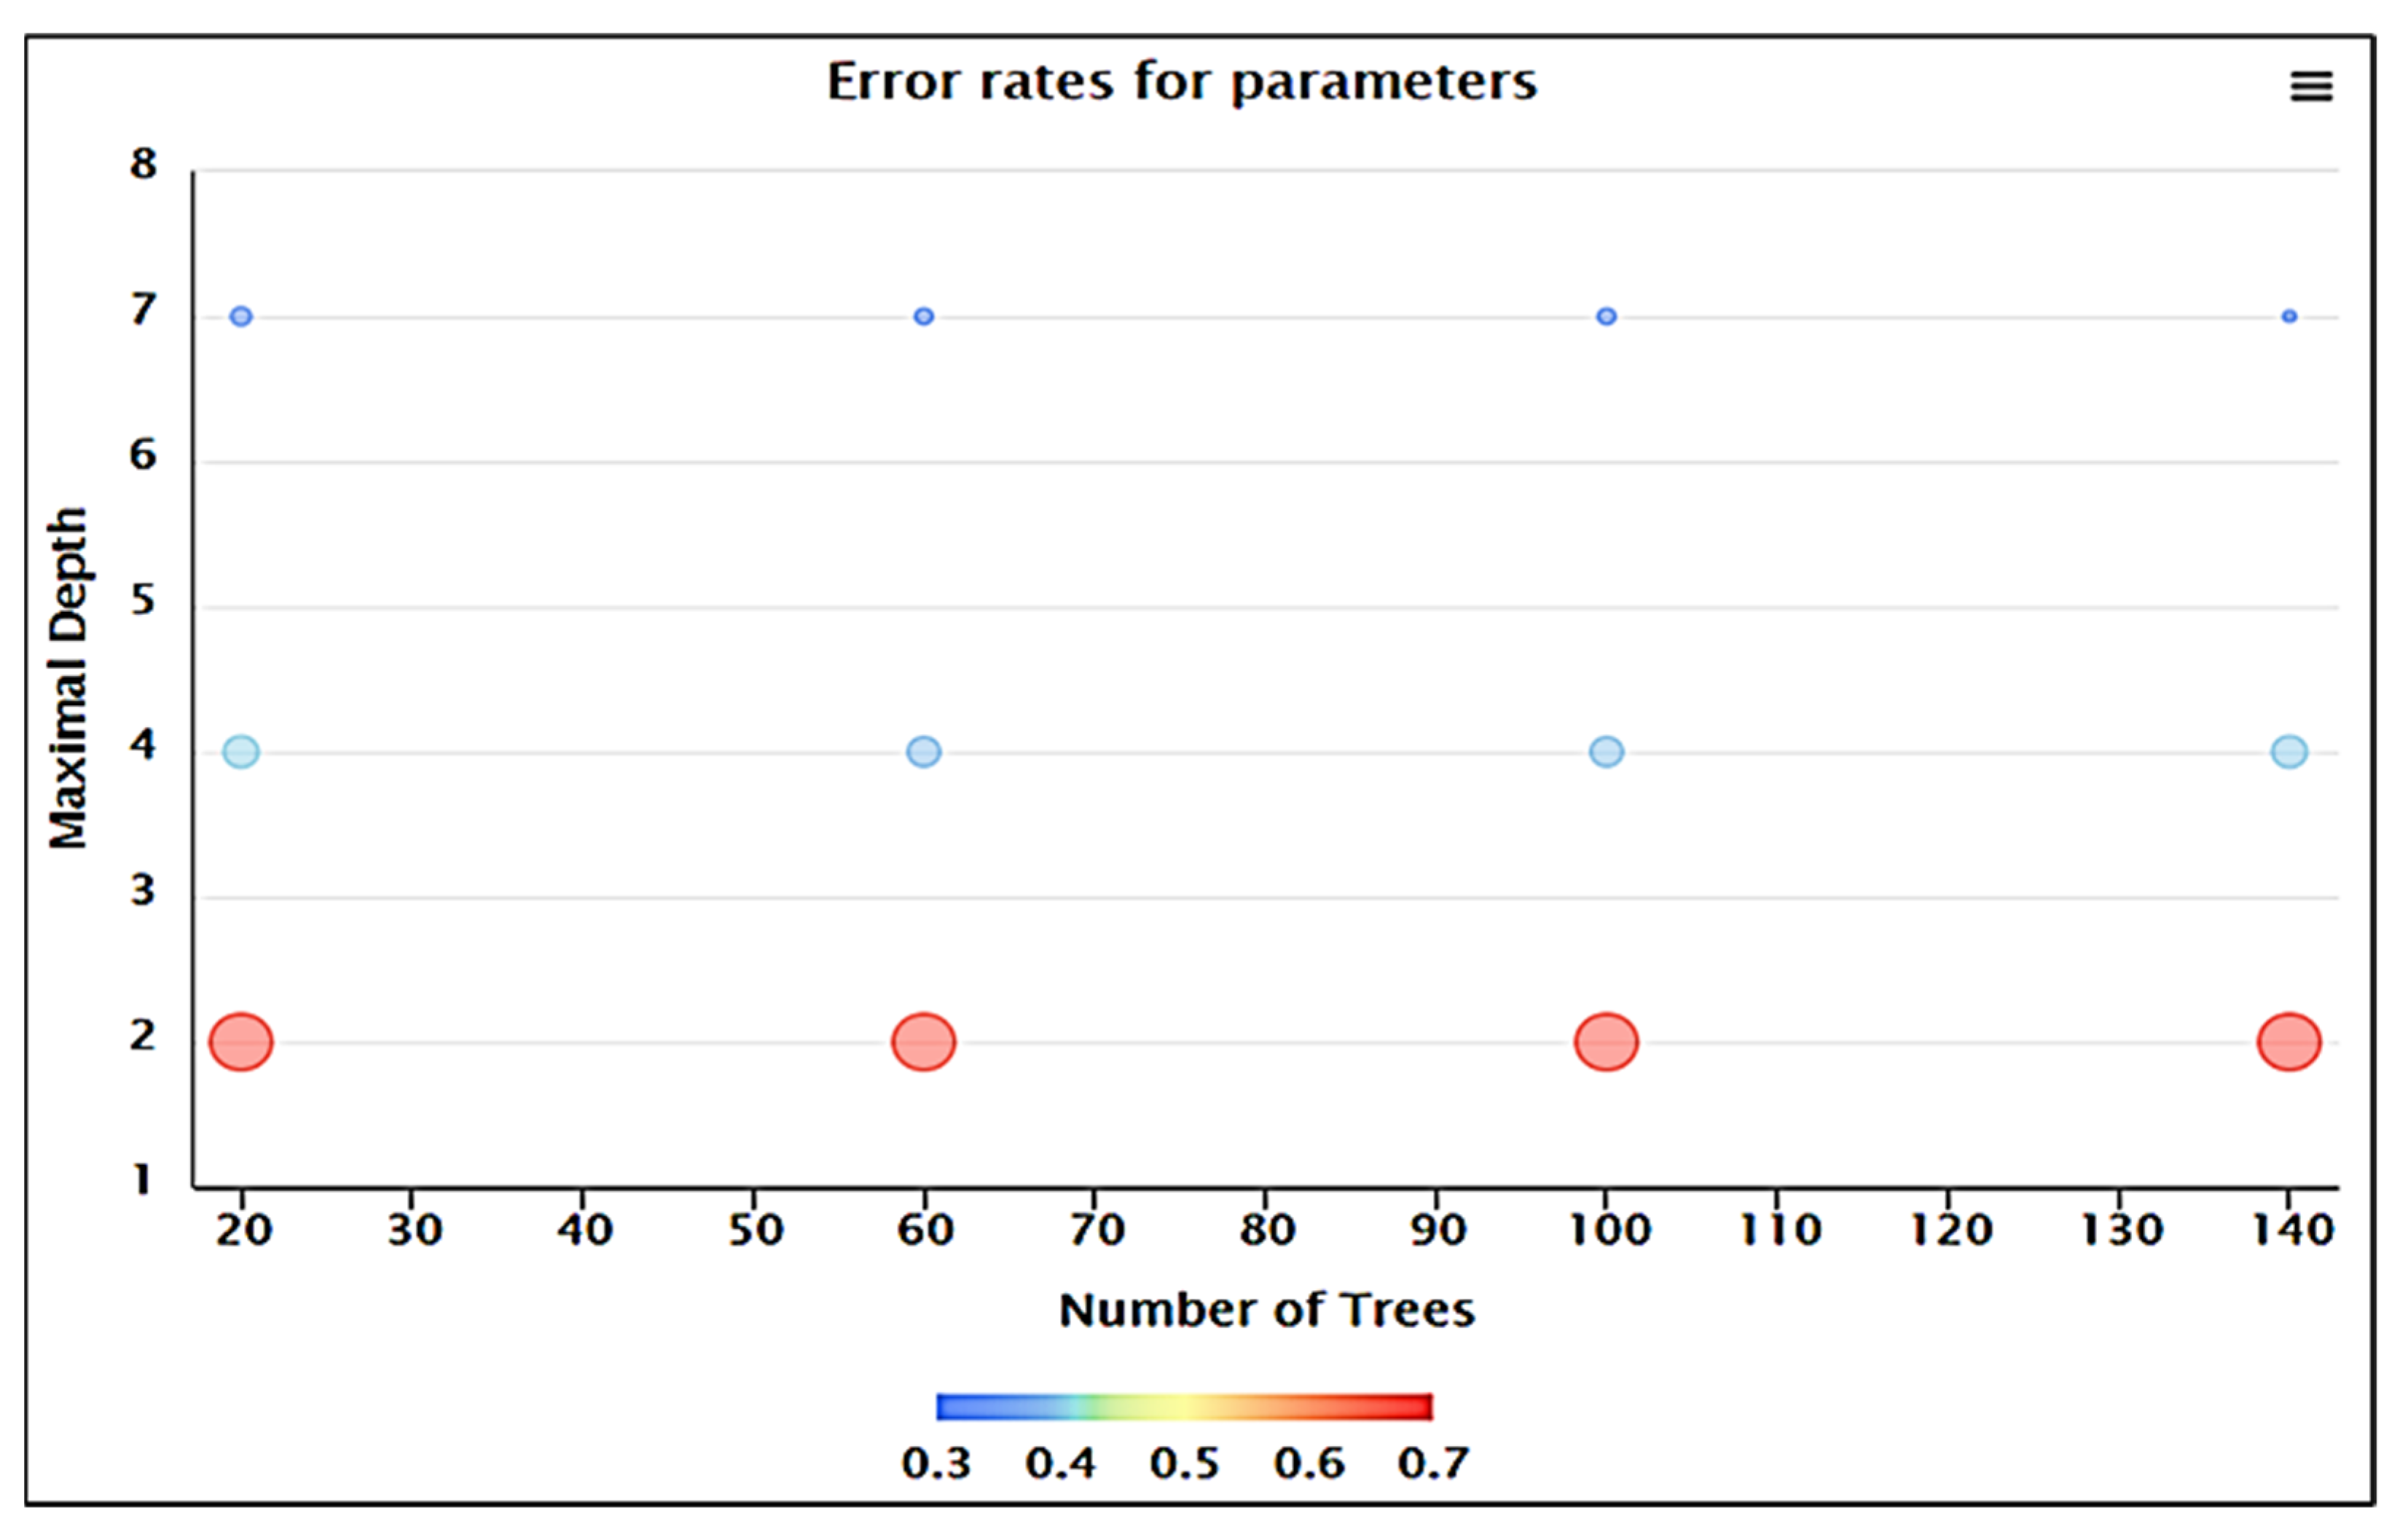
| No. | Number of Trees | Maximal Depth | Error Rate |
|---|---|---|---|
| 1 | 20.0 | 2.0 | 0.672 |
| 2 | 60.0 | 2.0 | 0.671 |
| 3 | 100.0 | 2.0 | 0.673 |
| 4 | 140.0 | 2.0 | 0.679 |
| 5 | 20.0 | 4.0 | 0.405 |
| 6 | 60.0 | 4.0 | 0.392 |
| 7 | 100.0 | 4.0 | 0.398 |
| 8 | 140.0 | 4.0 | 0.402 |
| 9 | 20.0 | 7.0 | 0.351 |
| 10 | 60.0 | 7.0 | 0.348 |
| 11 | 100.0 | 7.0 | 0.350 |
| 12 | 140.0 | 7.0 | 0.347 |
| Attribute | Optimum Values (Normalized) | Optimum Values (Actual Value) | Maximum Adsorption | Maximum Adsorption (Actual Value) |
|---|---|---|---|---|
| C0 (mg/L) | 0.357 | 355 | 0.81 | |
| Pore volume (cm3/g) | 0.889 | 1.027 | ||
| Surface area (m2/g) | 0.863 | 2106 | 1813 | |
| Agro-waste pH | 0.272 | 2.53 | ||
| Particle size (mm) | 0.112 | 0.013 |
Publisher’s Note: MDPI stays neutral with regard to jurisdictional claims in published maps and institutional affiliations. |
© 2021 by the authors. Licensee MDPI, Basel, Switzerland. This article is an open access article distributed under the terms and conditions of the Creative Commons Attribution (CC BY) license (https://creativecommons.org/licenses/by/4.0/).
Share and Cite
Moosavi, S.; Manta, O.; El-Badry, Y.A.; Hussein, E.E.; El-Bahy, Z.M.; Mohd Fawzi, N.f.B.; Urbonavičius, J.; Moosavi, S.M.H. A Study on Machine Learning Methods’ Application for Dye Adsorption Prediction onto Agricultural Waste Activated Carbon. Nanomaterials 2021, 11, 2734. https://doi.org/10.3390/nano11102734
Moosavi S, Manta O, El-Badry YA, Hussein EE, El-Bahy ZM, Mohd Fawzi NfB, Urbonavičius J, Moosavi SMH. A Study on Machine Learning Methods’ Application for Dye Adsorption Prediction onto Agricultural Waste Activated Carbon. Nanomaterials. 2021; 11(10):2734. https://doi.org/10.3390/nano11102734
Chicago/Turabian StyleMoosavi, Seyedehmaryam, Otilia Manta, Yaser A. El-Badry, Enas E. Hussein, Zeinhom M. El-Bahy, Noor fariza Binti Mohd Fawzi, Jaunius Urbonavičius, and Seyed Mohammad Hossein Moosavi. 2021. "A Study on Machine Learning Methods’ Application for Dye Adsorption Prediction onto Agricultural Waste Activated Carbon" Nanomaterials 11, no. 10: 2734. https://doi.org/10.3390/nano11102734