
Biomass Nanoporous Carbon-Supported Pd Catalysts for Partial Hydrogenation of Biodiesel: Effects of Surface Chemistry on Pd Particle Size and Catalytic Performance


Abstract
:1. Introduction
2. Materials and Methods
2.1. Materials
2.2. Preparation of CTF-Derived NPC Materials
2.3. The Preparation of Pd/NPC Catalysts
2.4. Characterizations
2.5. Partial Hydrogenation of Poly-FAME
3. Results and Discussion
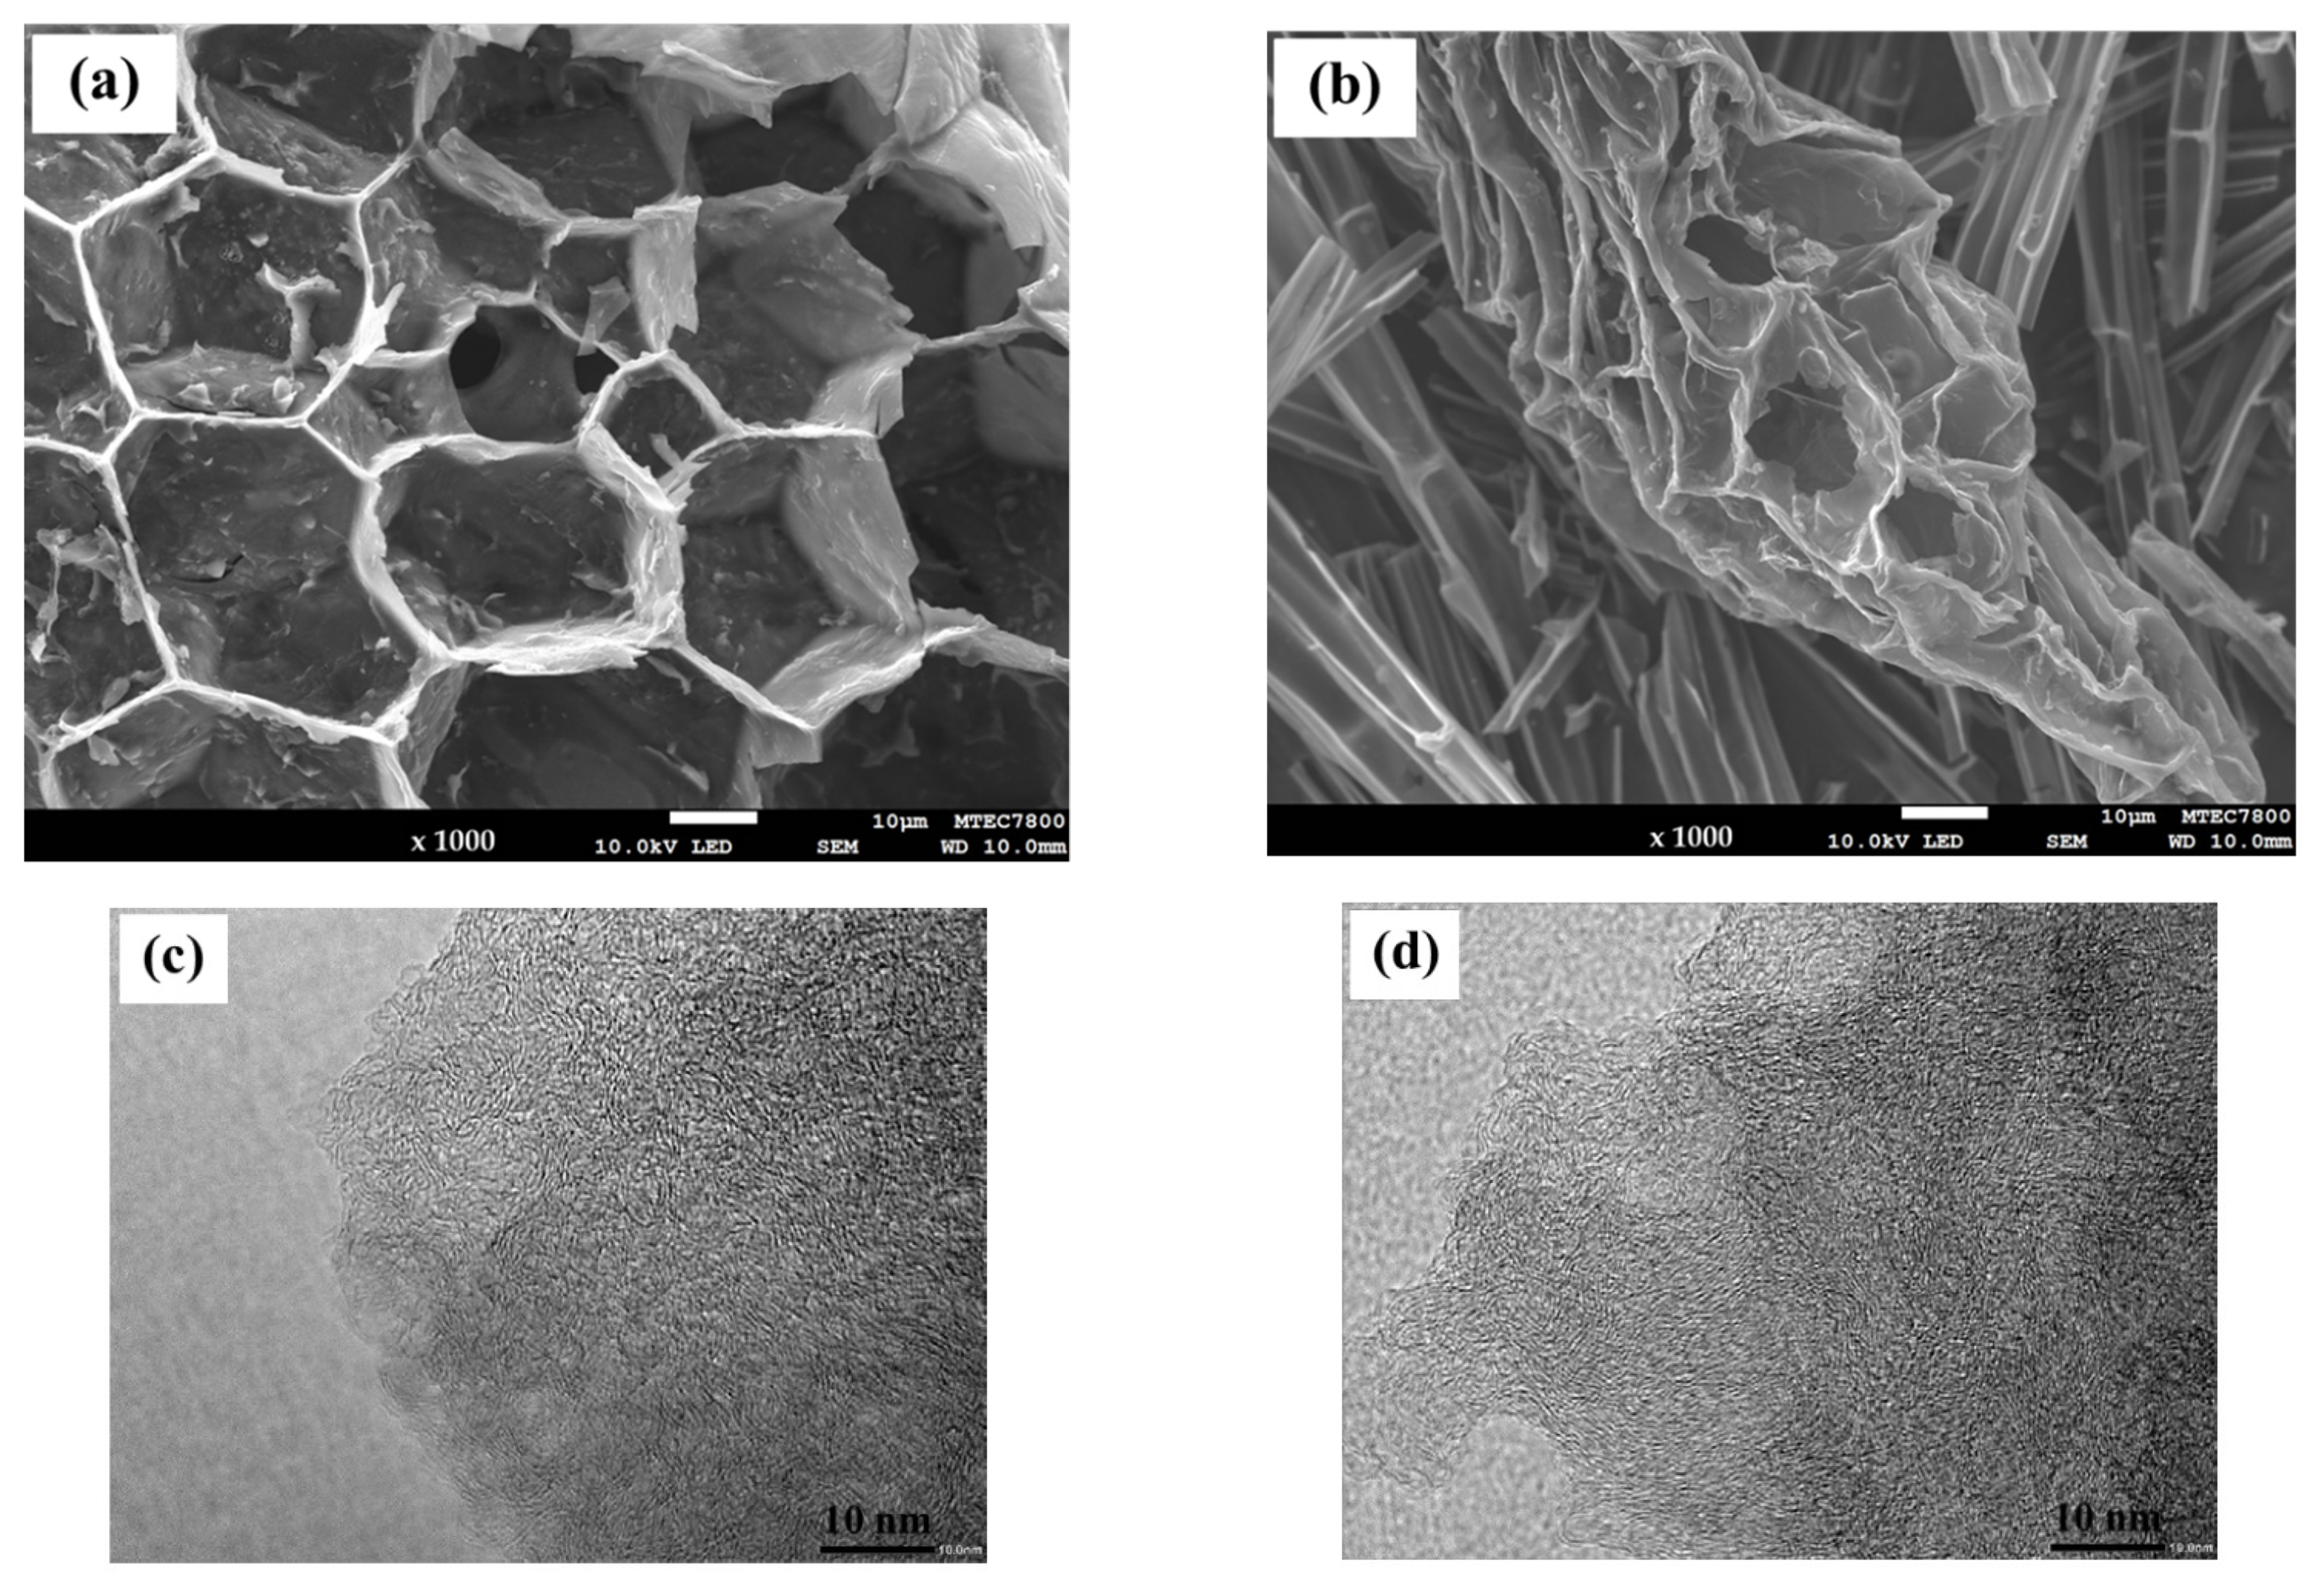
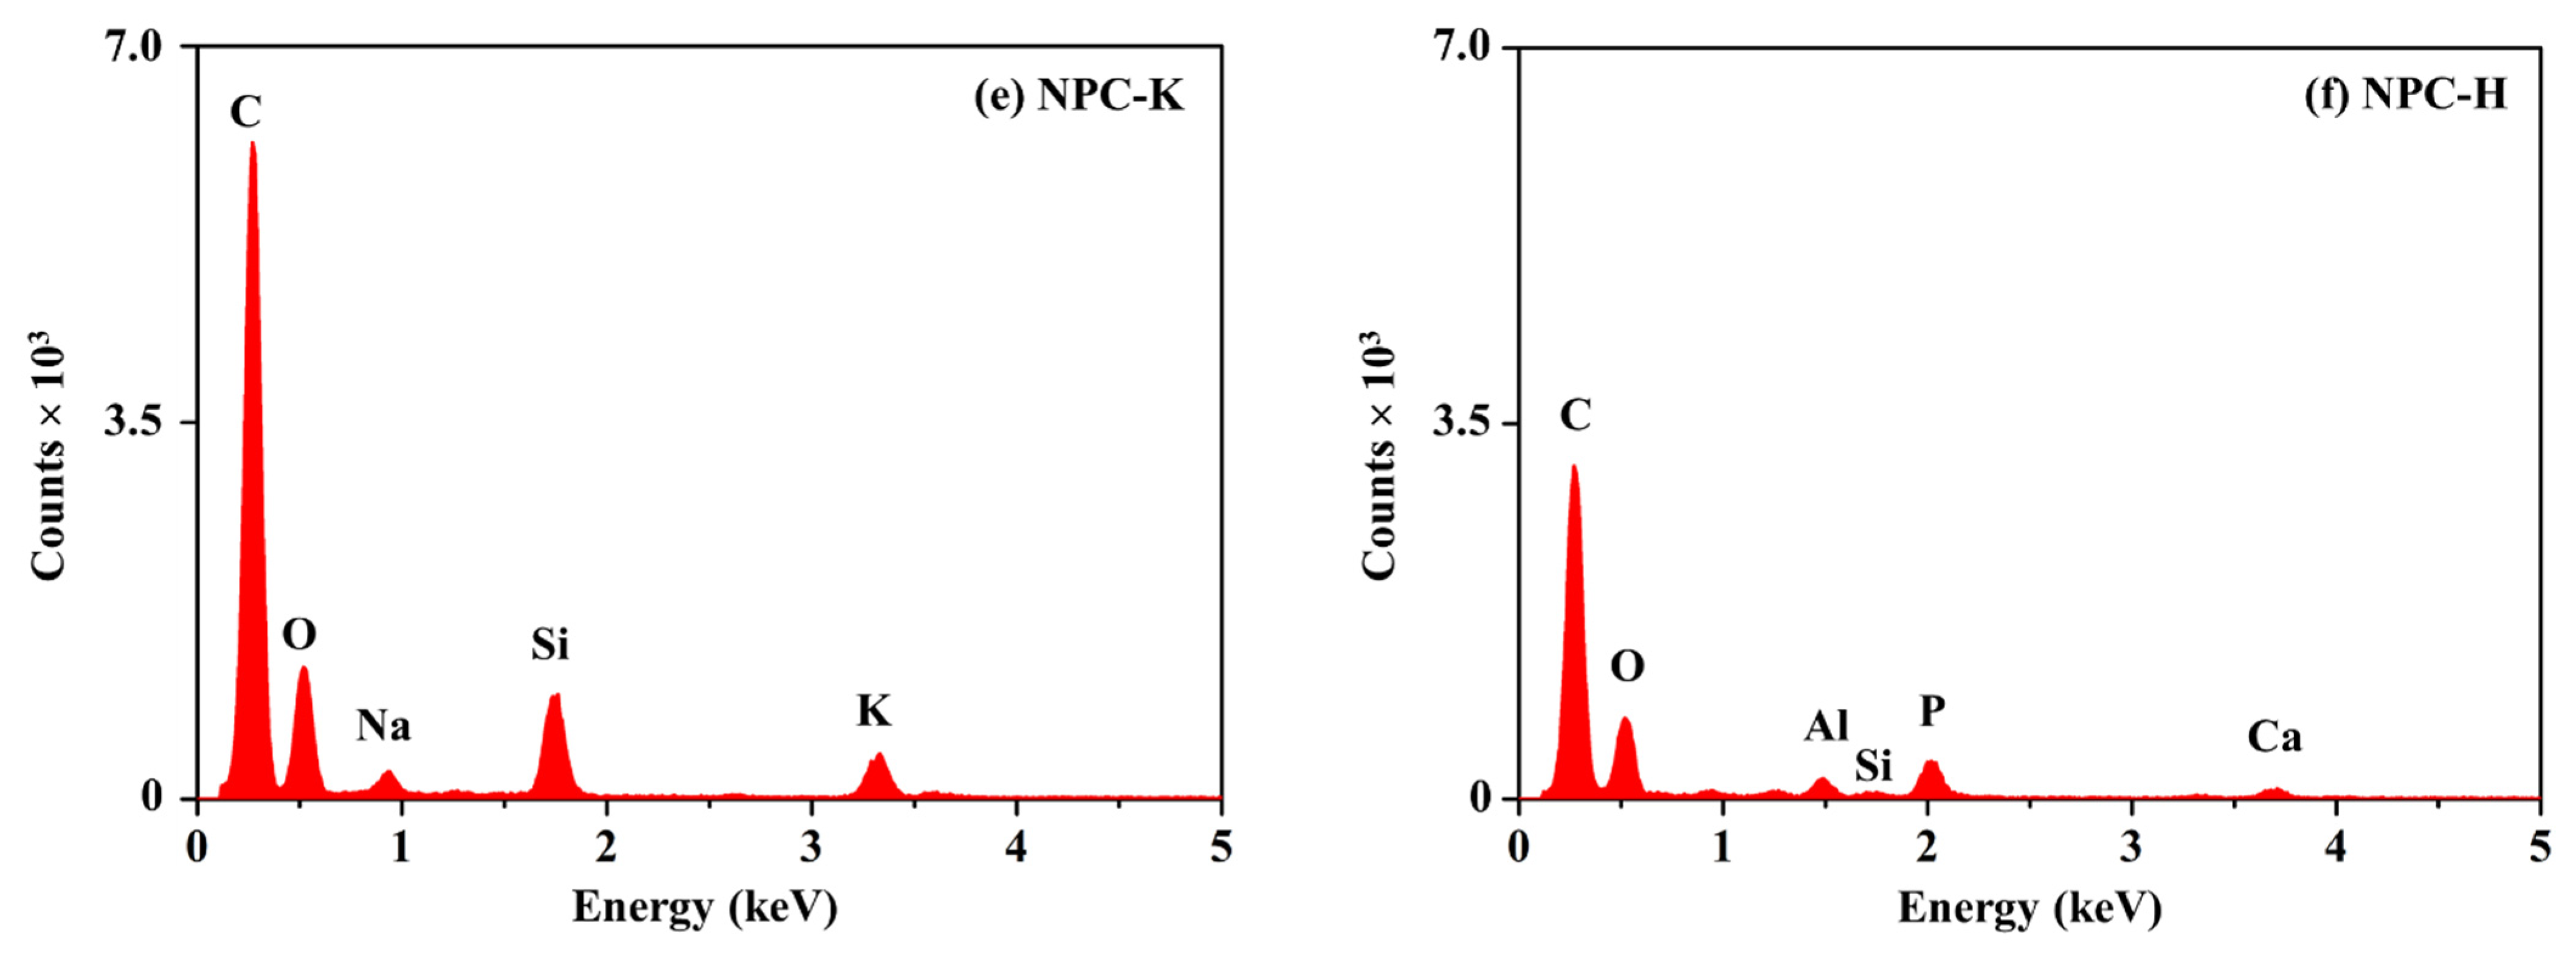
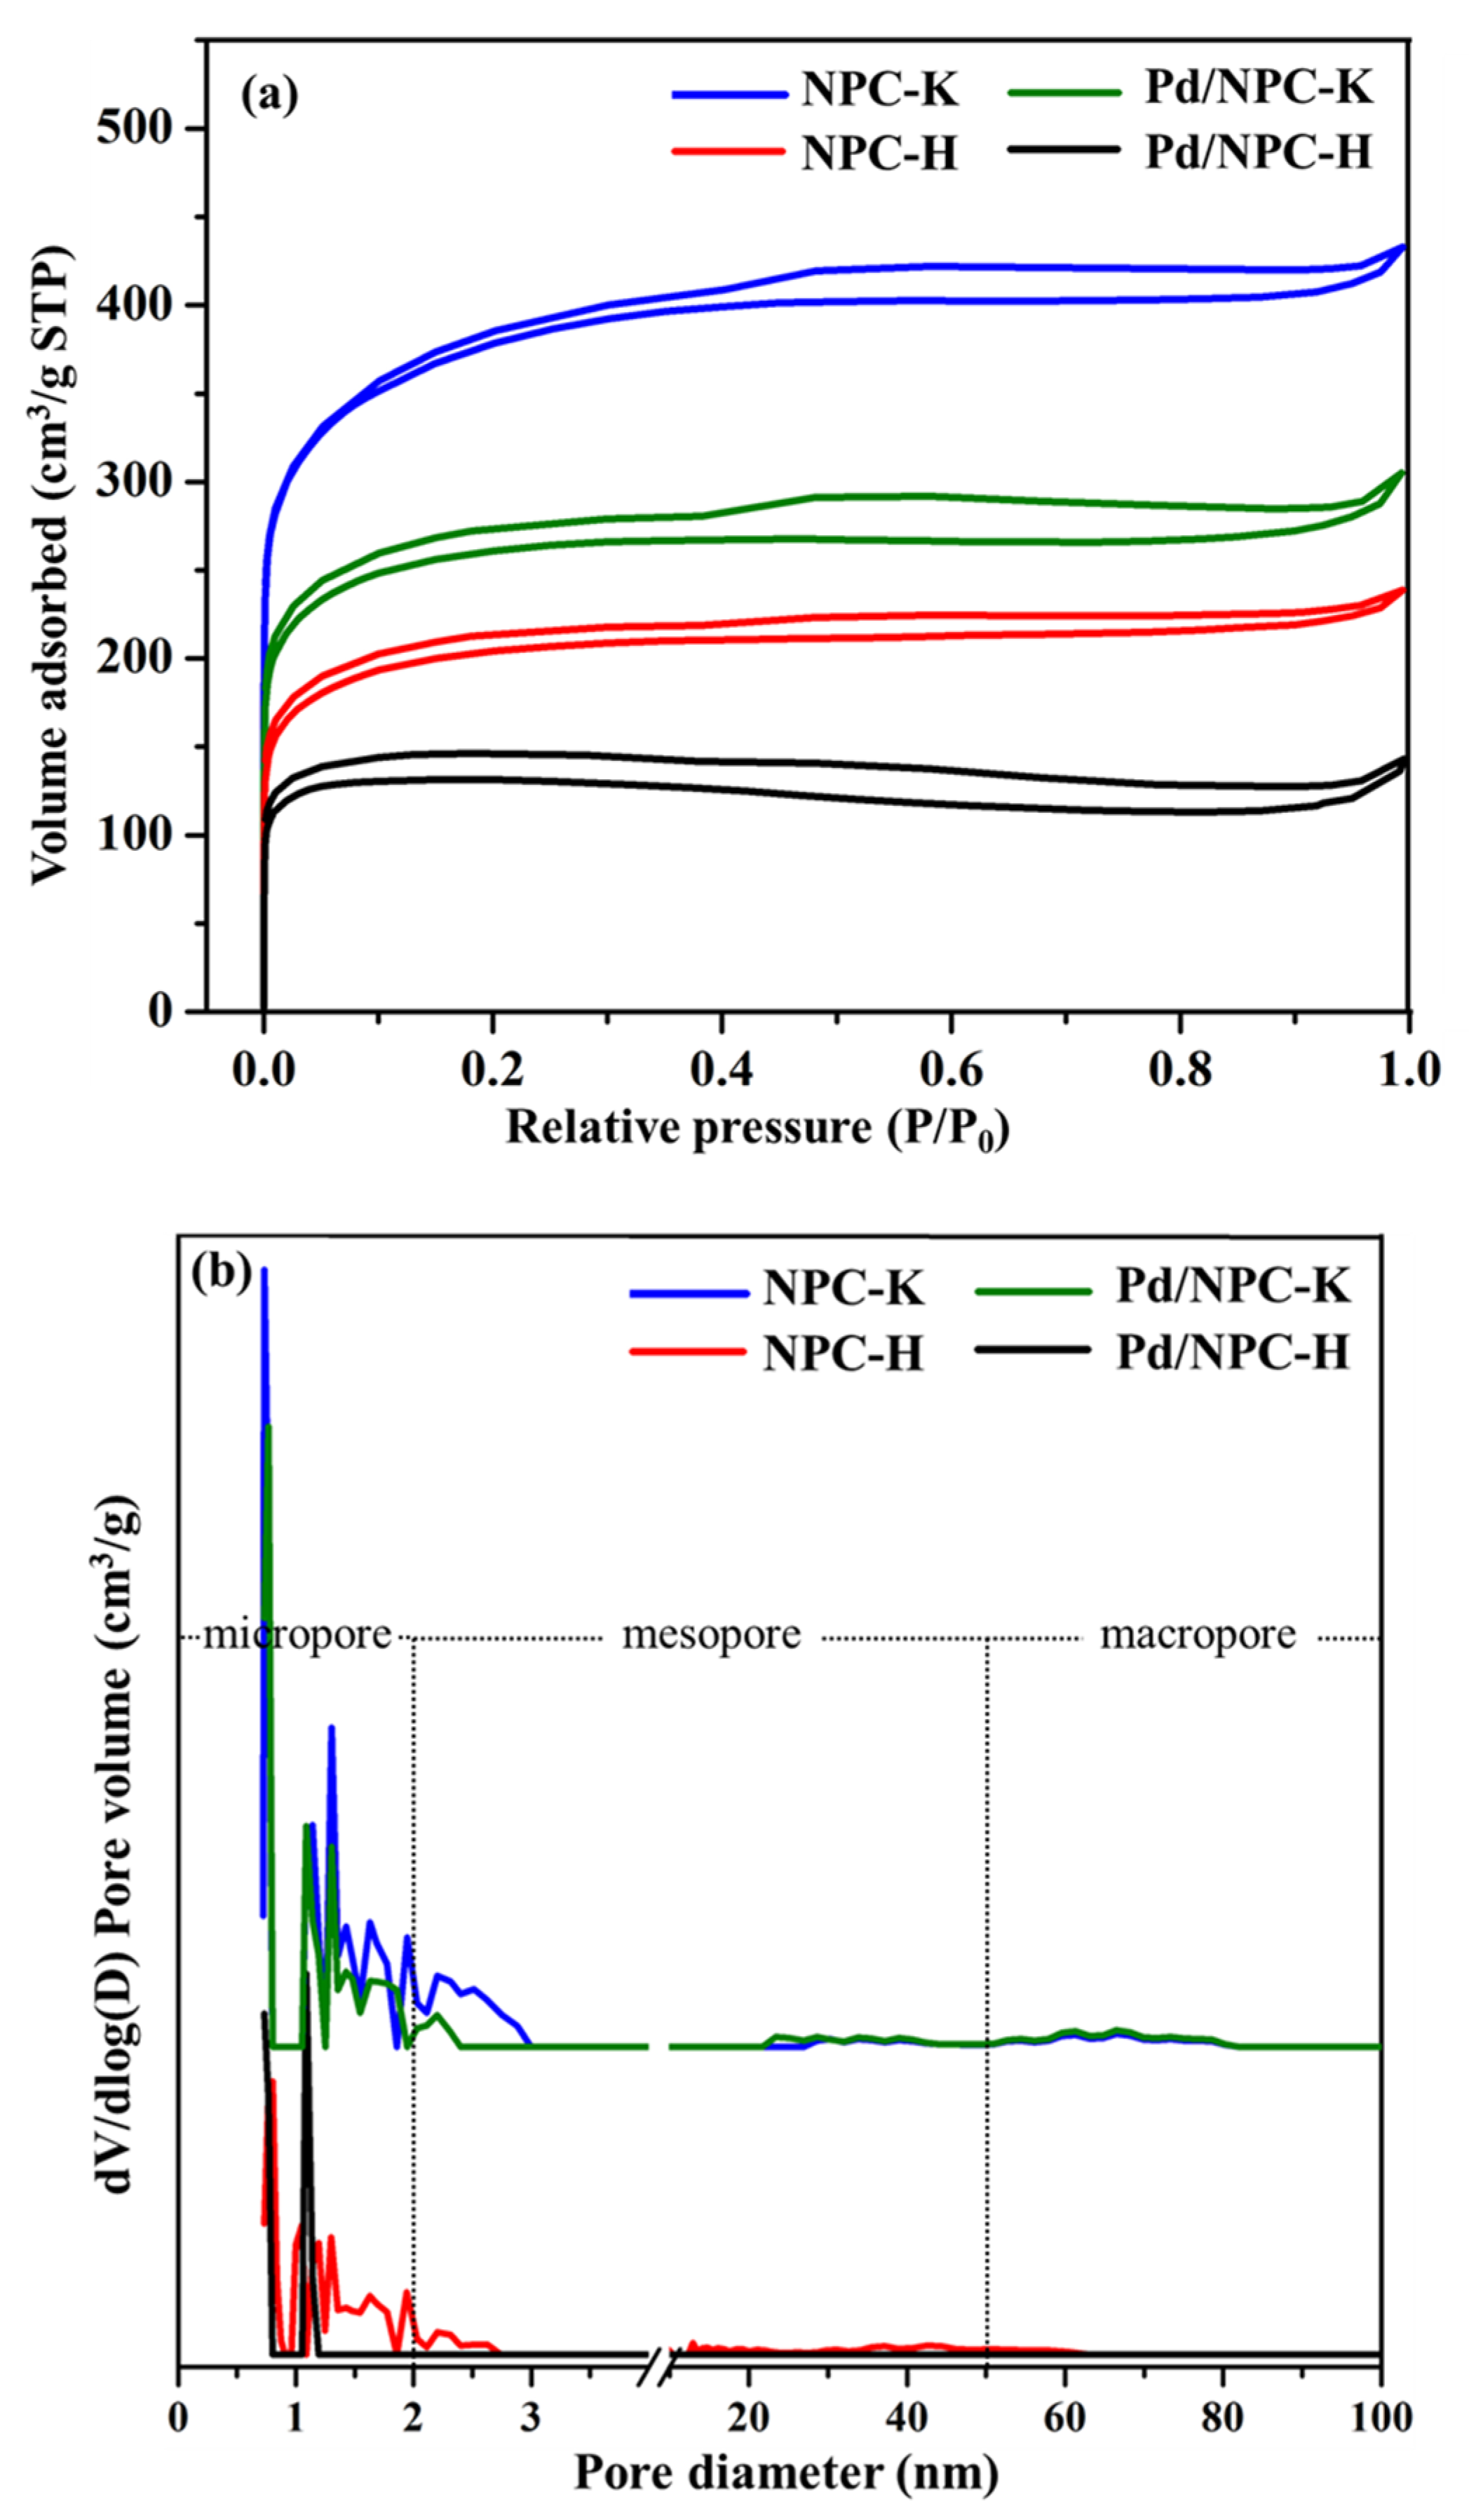
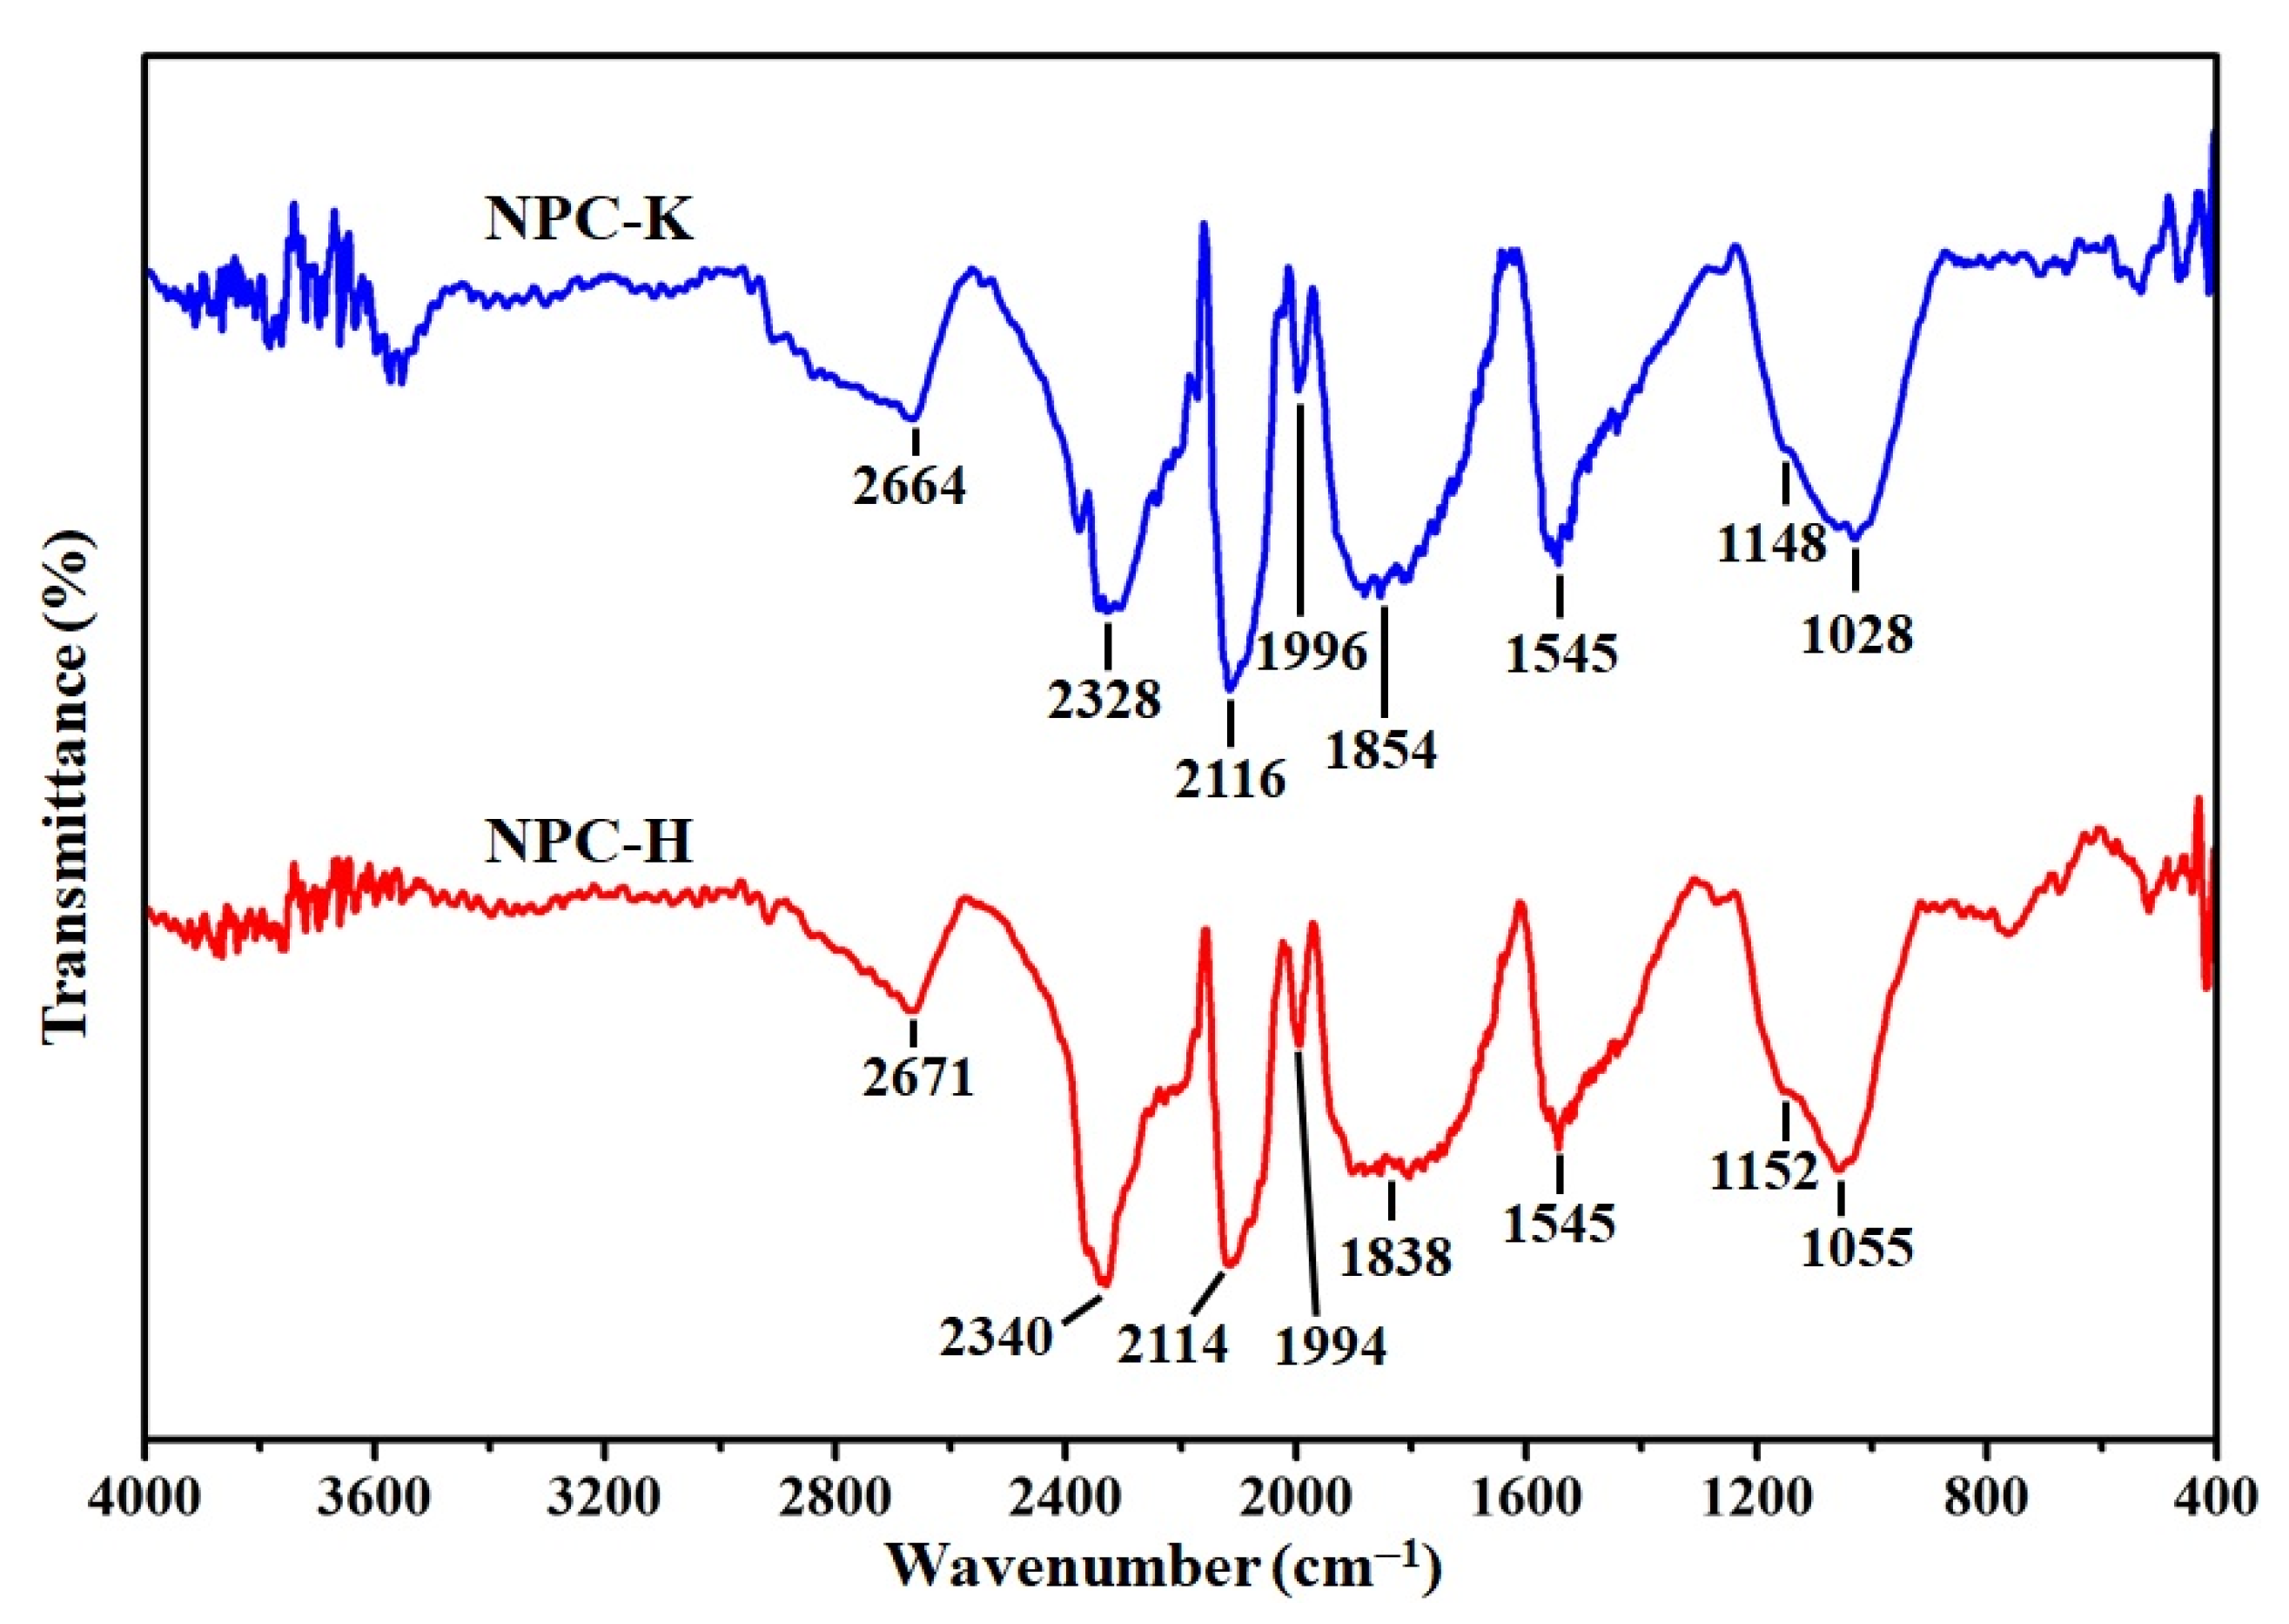
3.1. Characteristics of the CTF-Derived NPC Materials
3.2. Properties of Pd/NPC Catalyst
3.3. Partial Hydrogenation of Poly-FAME

| Pd/NPC-K 1 | Pd/NPC-H 1 | 2% Pd/CA 2 | 2% Pd/AC 3 | ||
|---|---|---|---|---|---|
| Particle size (nm) | 11 | 7 | 10 | 17 | |
| Initial rate (mmol gpd−1 s−1) 4 | 279 | 645 | - | - | |
| C18:1 selectivity (%) | 82 | 84 | - | - | |
| Reaction time (min) | 100 | 45 | 90 | 90 | |
| FAME composition (wt%) | palm-BDF | H-FAME | |||
| C18:3 | 0.1 | 0 | 0 | - | 0 |
| C18:2 | 8.5 | 0.9 | 0.9 | - | 0.3 |
| total C18:1 | 36.2 | 39.9 | 41.7 | - | 31.6 |
| cis-C18:1 | 36.1 | 30.6 | 30.1 | - | 14.3 |
| trans-C18:1 | 0.1 | 9.3 | 11.6 | - | 17.4 |
| C18:0 | 4.8 | 8.9 | 7.9 | - | - |
| Poly-FAME | 8.6 | 0.9 | 0.9 | 0 | 0.3 |
| Mono-FAME | 36.2 | 39.9 | 41.7 | 4.7 | 31.6 |
| Sat-FAME | 52.6 | 58.8 | 57.6 | 95.7 | 66.0 |
| Biodiesel properties | |||||
| Oxidation stability (h) | 13 | 65 | 65 | 41 | 33 |
| Cloud point (°C) | 14 | 17 | 16 | 26 | 23 |
4. Conclusions
Supplementary Materials
Author Contributions
Funding
Data Availability Statement
Acknowledgments
Conflicts of Interest
References
- Auer, E.; Freund, A.; Pietsch, J.; Tacke, T. Carbons as Supports for Industrial Precious Metal Catalysts. Appl. Catal. Gen. 1998, 173, 259–271. [Google Scholar] [CrossRef]
- Rodríguez-reinoso, F. The Role of Carbon Materials in Heterogeneous Catalysis. Carbon 1998, 36, 159–175. [Google Scholar] [CrossRef]
- Harada, T.; Ikeda, S.; Miyazaki, M.; Sakata, T.; Mori, H.; Matsumura, M. A Simple Method for Preparing Highly Active Palladium Catalysts Loaded on Various Carbon Supports for Liquid-Phase Oxidation and Hydrogenation Reactions. J. Mol. Catal. Chem. 2007, 268, 59–64. [Google Scholar] [CrossRef]
- Dantas Ramos, A.L.; Alves, P.d.S.; Aranda, D.A.G.; Schmal, M. Characterization of Carbon Supported Palladium Catalysts: Inference of Electronic and Particle Size Effects Using Reaction Probes. Appl. Catal. Gen. 2004, 277, 71–81. [Google Scholar] [CrossRef]
- Numwong, N.; Thachuangtumle, N.; Luengnaruemitchai, A. Partial Hydrogenation of Palm Oil-Derived Biodiesel Over Pd/C Catalysts. Int. J. Adv. Sci. Eng. Technol. 2016, 4, 195–200. [Google Scholar]
- Amorim, C.; Keane, M.A. Palladium Supported on Structured and Nonstructured Carbon: A Consideration of Pd Particle Size and the Nature of Reactive Hydrogen. J. Colloid Interface Sci. 2008, 322, 196–208. [Google Scholar] [CrossRef]
- Cabiac, A.; Cacciaguerra, T.; Trens, P.; Durand, R.; Delahay, G.; Medevielle, A.; Plée, D.; Coq, B. Influence of Textural Properties of Activated Carbons on Pd/Carbon Catalysts Synthesis for Cinnamaldehyde Hydrogenation. Appl. Catal. Gen. 2008, 340, 229–235. [Google Scholar] [CrossRef]
- Han, W.; Zhang, G.; Lu, G.; Tang, Z. Influence of Pore Structures of a Carbon Support on the Surface Textures of a CO Oxidation Catalyst. RSC Adv. 2015, 5, 59666–59676. [Google Scholar] [CrossRef]
- Dias, J.M.; Alvim-Ferraz, M.C.M.; Almeida, M.F.; Rivera-Utrilla, J.; Sánchez-Polo, M. Waste Materials for Activated Carbon Preparation and Its Use in Aqueous-Phase Treatment: A Review. J. Environ. Manag. 2007, 85, 833–846. [Google Scholar] [CrossRef]
- González-García, P. Activated Carbon from Lignocellulosics Precursors: A Review of the Synthesis Methods, Characterization Techniques and Applications. Renew. Sustain. Energy Rev. 2018, 82, 1393–1414. [Google Scholar] [CrossRef]
- Yahya, M.A.; Al-Qodah, Z.; Ngah, C.W.Z. Agricultural Bio-Waste Materials as Potential Sustainable Precursors Used for Activated Carbon Production: A Review. Renew. Sustain. Energy Rev. 2015, 46, 218–235. [Google Scholar] [CrossRef]
- Titirici, M.-M.; Funke, A.; Kruse, A. Chapter 12—Hydrothermal Carbonization of Biomass. In Recent Advances in Thermo-Chemical Conversion of Biomass; Pandey, A., Bhaskar, T., Stöcker, M., Sukumaran, R.K., Eds.; Elsevier: Boston, MA, USA, 2015; pp. 325–352. ISBN 978-0-444-63289-0. [Google Scholar]
- Mu’azu, N.D.; Jarrah, N.; Zubair, M.; Alagha, O. Removal of Phenolic Compounds from Water Using Sewage Sludge-Based Activated Carbon Adsorption: A Review. Int. J. Environ. Res. Public Health 2017, 14, 1094. [Google Scholar] [CrossRef] [PubMed] [Green Version]
- Heidarinejad, Z.; Dehghani, M.H.; Heidari, M.; Javedan, G.; Ali, I.; Sillanpää, M. Methods for Preparation and Activation of Activated Carbon: A Review. Environ. Chem. Lett. 2020, 18, 393–415. [Google Scholar] [CrossRef]
- Molina-Sabio, M.; Rodríguez-Reinoso, F. Role of Chemical Activation in the Development of Carbon Porosity. In Proceedings of the Third International TRI/Princeton Workshop Characterization of Porous Materials: From Angstroms to Millimeters, Princeton, NJ, USA, 23–25 June 2003; Volume 241, pp. 15–25. [Google Scholar]
- Radkevich, V.Z.; Senko, T.L.; Wilson, K.; Grishenko, L.M.; Zaderko, A.N.; Diyuk, V.Y. The Influence of Surface Functionalization of Activated Carbon on Palladium Dispersion and Catalytic Activity in Hydrogen Oxidation. Appl. Catal. Gen. 2008, 335, 241–251. [Google Scholar] [CrossRef]
- Din, M.I.; Ashraf, S.; Intisar, A. Comparative Study of Different Activation Treatments for the Preparation of Activated Carbon: A Mini-Review. Sci. Prog. 2017, 100, 299–312. [Google Scholar] [CrossRef] [PubMed]
- Arami-Niya, A.; Daud, W.M.A.W.; Mjalli, F.S. Comparative Study of the Textural Characteristics of Oil Palm Shell Activated Carbon Produced by Chemical and Physical Activation for Methane Adsorption. Chem. Eng. Res. Des. 2011, 89, 657–664. [Google Scholar] [CrossRef]
- Dechabun, S.; Udomsap, P.; Chollacoop, N.; Eiad-Ua, A. Influence of Physical Mixing Ratio on Pore Development in Highly Porous Carbon Prepared From Nipa Palm Husk Using Hydrothermal Carbonization with Chemical Activation. IOP Conf. Ser. Mater. Sci. Eng. 2020, 893, 12002. [Google Scholar] [CrossRef]
- Longprang, T.; Jaruwat, D.; Udomsap, P.; Chollacoop, N.; Eiad-ua, A. Influence of Acid Additive on Nanoporous Carbon Materials via HTC for Catalyst Support. In Proceedings of the 6th Thailand International Nanotechnology Conference, NanoThailand, Pathum Thani, Thailand, 12–14 December 2018; Volume 23, pp. 762–766. [Google Scholar]
- Numwong, N.; Luengnaruemitchai, A.; Chollacoop, N.; Yoshimura, Y. Effect of Support Acidic Properties on Sulfur Tolerance of Pd Catalysts for Partial Hydrogenation of Rapeseed Oil-Derived FAME. J. Am. Oil Chem. Soc. 2012, 89, 2117–2120. [Google Scholar] [CrossRef]
- Thunyaratchatanon, C.; Luengnaruemitchai, A.; Chollacoop, N.; Chen, S.-Y.; Yoshimura, Y. Catalytic Hydrogenation of Soybean Oil-Derived Fatty Acid Methyl Esters over Pd Supported on Zr-SBA-15 with Various Zr Loading Levels for Enhanced Oxidative Stability. Fuel Process. Technol. 2018, 179, 422–435. [Google Scholar] [CrossRef]
- Udomsap, P.; Eiad-Ua, A.; Chen, S.-Y.; Mochizuki, T.; Chollacoop, N.; Yoshimura, Y.; Nishi, M.; Tateno, H.; Takagi, H. Effect of Pd Precursor Salts on the Chemical State, Particle Size, and Performance of Activated Carbon-Supported Pd Catalysts for the Selective Hydrogenation of Palm Biodiesel. Int. J. Mol. Sci. 2021, 22, 1256. [Google Scholar] [CrossRef]
- Knothe, G. Dependence of Biodiesel Fuel Properties on the Structure of Fatty Acid Alkyl Esters. Biodiesel Process. Prod. 2005, 86, 1059–1070. [Google Scholar] [CrossRef]
- Numwong, N.; Luengnaruemitchai, A.; Chollacoop, N.; Yoshimura, Y. Effect of SiO2 Pore Size on Partial Hydrogenation of Rapeseed Oil-Derived FAMEs. Appl. Catal. Gen. 2012, 441–442, 72–78. [Google Scholar] [CrossRef]
- Chen, S.-Y.; Attanatho, L.; Chang, A.; Laosombut, T.; Nishi, M.; Mochizuki, T.; Takagi, H.; Yang, C.-M.; Abe, Y.; Toba, M.; et al. Profiling and Catalytic Upgrading of Commercial Palm Oil-Derived Biodiesel Fuels for High-Blend Fuels. Catal. Today 2019, 332, 122–131. [Google Scholar] [CrossRef]
- Park, J.; Regalbuto, J.R. A Simple, Accurate Determination of Oxide PZC and the Strong Buffering Effect of Oxide Surfaces at Incipient Wetness. J. Colloid Interface Sci. 1995, 175, 239–252. [Google Scholar] [CrossRef]
- Rangabhashiyam, S.; Balasubramanian, P. The Potential of Lignocellulosic Biomass Precursors for Biochar Production: Performance, Mechanism and Wastewater Application—A Review. Ind. Crops Prod. 2019, 128, 405–423. [Google Scholar]
- Figueiredo, J.L.; Pereira, M.F.R.; Freitas, M.M.A.; Órfão, J.J.M. Modification of the Surface Chemistry of Activated Carbons. Carbon 1999, 37, 1379–1389. [Google Scholar] [CrossRef]
- Angin, D. Production and Characterization of Activated Carbon from Sour Cherry Stones by Zinc Chloride. Fuel 2014, 115, 804–811. [Google Scholar] [CrossRef]
- Fierro, V.; Torné-Fernández, V.; Celzard, A. Kraft Lignin as a Precursor for Microporous Activated Carbons Prepared by Impregnation with Ortho-Phosphoric Acid: Synthesis and Textural Characterisation. Microporous Mesoporous Mater. 2006, 92, 243–250. [Google Scholar] [CrossRef]
- Mistar, E.M.; Alfatah, T.; Supardan, M.D. Synthesis and Characterization of Activated Carbon from Bambusa Vulgaris Striata Using Two-Step KOH Activation. J. Mater. Res. Technol. 2020, 9, 6278–6286. [Google Scholar] [CrossRef]
- Kan, Y.; Yue, Q.; Li, D.; Wu, Y.; Gao, B. Preparation and Characterization of Activated Carbons from Waste Tea by H3PO4 Activation in Different Atmospheres for Oxytetracycline Removal. J. Taiwan Inst. Chem. Eng. 2017, 71, 494–500. [Google Scholar] [CrossRef]
- Manoj, B.; Kunjomana, A.G. Study of Stacking Structure of Amorphous Carbon by X-Ray Diffraction Technique. Int. J. Electrochem. Sci. 2012, 7, 3127–3134. [Google Scholar]
- Hadoun, H.; Sadaoui, Z.; Souami, N.; Sahel, D.; Toumert, I. Characterization of Mesoporous Carbon Prepared from Date Stems by H3PO4 Chemical Activation. Appl. Surf. Sci. 2013, 280, 1–7. [Google Scholar] [CrossRef]
- Prahas, D.; Kartika, Y.; Indraswati, N.; Ismadji, S. Activated Carbon from Jackfruit Peel Waste by H3PO4 Chemical Activation: Pore Structure and Surface Chemistry Characterization. Chem. Eng. J. 2008, 140, 32–42. [Google Scholar] [CrossRef]
- Lu, L.; Sahajwalla, V.; Kong, C.; Harris, D. Quantitative X-Ray Diffraction Analysis and Its Application to Various Coals. Carbon 2001, 39, 1821–1833. [Google Scholar] [CrossRef]
- Ghosh, A.; da Silva Santos, A.M.; Cunha, J.R.; Dasgupta, A.; Fujisawa, K.; Ferreira, O.P.; Lobo, A.O.; Terrones, M.; Terrones, H.; Viana, B.C. CO2 Sensing by In-Situ Raman Spectroscopy Using Activated Carbon Generated from Mesocarp of Babassu Coconut. Vib. Spectrosc. 2018, 98, 111–118. [Google Scholar] [CrossRef]
- Puech, P.; Kandara, M.; Paredes, G.; Moulin, L.; Weiss-Hortala, E.; Kundu, A.; Ratel-Ramond, N.; Plewa, J.-M.; Pellenq, R.; Monthioux, M. Analyzing the Raman Spectra of Graphenic Carbon Materials from Kerogens to Nanotubes: What Type of Information Can Be Extracted from Defect Bands? C 2019, 5, 69. [Google Scholar] [CrossRef] [Green Version]
- Tuinstra, F.; Koenig, J.L. Raman Spectrum of Graphite. J. Chem. Phys. 1970, 53, 1126–1130. [Google Scholar] [CrossRef] [Green Version]
- Sing, K.S. Reporting Physisorption Data for Gas/Solid Systems with Special Reference to the Determination of Surface Area and Porosity (Recommendations 1984). Pure Appl. Chem. 1985, 57, 603–619. [Google Scholar] [CrossRef]
- Silvestre-Albero, A.M.; Juárez-Galán, J.M.; Silvestre-Albero, J.; Rodríguez-Reinoso, F. Low-Pressure Hysteresis in Adsorption: An Artifact? J. Phys. Chem. C 2012, 116, 16652–16655. [Google Scholar] [CrossRef]
- CHAPTER 1 Carbon (Nano)materials for Catalysis. In Nanostructured Carbon Materials for Catalysis; The Royal Society of Chemistry: Cambridge, UK, 2015; pp. 1–45. ISBN 978-1-84973-909-2.
- Dandekar, A.; Baker, R.T.K.; Vannice, M.A. Characterization of Activated Carbon, Graphitized Carbon Fibers and Synthetic Diamond Powder Using TPD and DRIFTS. Carbon 1998, 36, 1821–1831. [Google Scholar] [CrossRef]
- Pradhan, B.K.; Sandle, N.K. Effect of Different Oxidizing Agent Treatments on the Surface Properties of Activated Carbons. Carbon 1999, 37, 1323–1332. [Google Scholar] [CrossRef]
- Terzyk, A.P. The Influence of Activated Carbon Surface Chemical Composition on the Adsorption of Acetaminophen (Paracetamol) in Vitro: Part II. TG, FTIR, and XPS Analysis of Carbons and the Temperature Dependence of Adsorption Kinetics at the Neutral PH. Colloids Surf. Physicochem. Eng. Asp. 2001, 177, 23–45. [Google Scholar] [CrossRef]
- Patnukao, P.; Pavasant, P. Activated Carbon from Eucalyptus Camaldulensis Dehn Bark Using Phosphoric Acid Activation. Bioresour. Technol. 2008, 99, 8540–8543. [Google Scholar] [CrossRef]
- Estrade-Szwarckopf, H. XPS Photoemission in Carbonaceous Materials: A “Defect” Peak beside the Graphitic Asymmetric Peak. Carbon 2004, 42, 1713–1721. [Google Scholar] [CrossRef]
- Puziy, A.M.; Poddubnaya, O.I.; Socha, R.P.; Gurgul, J.; Wisniewski, M. XPS and NMR Studies of Phosphoric Acid Activated Carbons. Carbon 2008, 46, 2113–2123. [Google Scholar] [CrossRef]
- Moulder, J.F.; Chastain, J. Handbook of X-ray Photoelectron Spectroscopy: A Reference Book of Standard Spectra for Identification and Interpretation of XPS Data; Physical Electronics Division; Perkin-Elmer Corporation: Eden Prairie, MA, USA, 1992; ISBN 978-0-9627026-2-4. [Google Scholar]
- Li, Y.; Zhang, X.; Yang, R.; Li, G.; Hu, C. The Role of H3PO4 in the Preparation of Activated Carbon from NaOH-Treated Rice Husk Residue. RSC Adv. 2015, 5, 32626–32636. [Google Scholar] [CrossRef]
- Lopez-Ramon, M.V.; Stoeckli, F.; Moreno-Castilla, C.; Carrasco-Marin, F. On the Characterization of Acidic and Basic Surface Sites on Carbons by Various Techniques. Carbon 1999, 37, 1215–1221. [Google Scholar] [CrossRef]
- Fraga, M.A.; Jordão, E.; Mendes, M.J.; Freitas, M.M.A.; Faria, J.L.; Figueiredo, J.L. Properties of Carbon-Supported Platinum Catalysts: Role of Carbon Surface Sites. J. Catal. 2002, 209, 355–364. [Google Scholar] [CrossRef]
- Thunyaratchatanon, C.; Luengnaruemitchai, A.; Chollacoop, N.; Yoshimura, Y. Catalytic Upgrading of Soybean Oil Methyl Esters by Partial Hydrogenation Using Pd Catalysts. Fuel 2016, 163, 8–16. [Google Scholar] [CrossRef]
- Na Rungsi, A.; Luengnaruemitchai, A.; Wongkasemjit, S.; Chollacoop, N.; Chen, S.-Y.; Yoshimura, Y. Influence of Silica Sources on Structural Property and Activity of Pd-Supported on Mesoporous MCM-41 Synthesized with an Aid of Microwave Heating for Partial Hydrogenation of Soybean Methyl Esters. Appl. Catal. Gen. 2018, 563, 80–90. [Google Scholar] [CrossRef]
- Na Rungsi, A.; Luengnaruemitchai, A.; Chollacoop, N.; Chen, S.-Y.; Mochizuki, T.; Takagi, H.; Yoshimura, Y. Preparation of MCM-41-Supported Pd–Pt Catalysts with Enhanced Activity and Sulfur Resistance for Partial Hydrogenation of Soybean Oil-Derived Biodiesel Fuel. Appl. Catal. Gen. 2020, 590, 117351. [Google Scholar] [CrossRef]
- Chen, Y.-C.; Lin, D.-Y.; Chen, B.-H. Metasilicate-Based Catalyst Prepared from Natural Diatomaceous Earth for Biodiesel Production. Renew. Energy 2019, 138, 1042–1050. [Google Scholar] [CrossRef]
- Hongmanorom, P.; Luengnaruemitchai, A.; Chollacoop, N.; Yoshimura, Y. Effect of the Pd/MCM-41 Pore Size on the Catalytic Activity and Cis–Trans Selectivity for Partial Hydrogenation of Canola Biodiesel. Energy Fuels 2017, 31, 8202–8209. [Google Scholar] [CrossRef]
- Pullen, J.; Saeed, K. An Overview of Biodiesel Oxidation Stability. Renew. Sustain. Energy Rev. 2012, 16, 5924–5950. [Google Scholar] [CrossRef]
- Chen, S.-Y.; Attanatho, L.; Mochizuki, T.; Abe, Y.; Toba, M.; Yoshimura, Y.; Kumpidet, C.; Somwonhsa, P.; Lao-ubol, S. Upgrading of Palm Biodiesel Fuel over Supported Palladium Catalysts. Catal. Acad. Res. Ind. Appl. 2016, 19, 1166–1173. [Google Scholar] [CrossRef]
- Chen, S.-Y.; Attanatho, L.; Mochizuki, T.; Zheng, Q.; Toba, M.; Yoshimura, Y.; Somwongsa, P.; Lao-Ubol, S. Influences of the Support Property and Pd Loading on Activity of Mesoporous Silica-Supported Pd Catalysts in Partial Hydrogenation of Palm Biodiesel Fuel. Adv. Porous Mater. 2016, 4, 230–237. [Google Scholar] [CrossRef]
- Thunyaratchatanon, C.; Luengnaruemitchai, A.; Jitjamnong, J.; Chollacoop, N.; Chen, S.-Y.; Yoshimura, Y. Influence of Alkaline and Alkaline Earth Metal Promoters on the Catalytic Performance of Pd–M/SiO2 (M = Na, Ca, or Ba) Catalysts in the Partial Hydrogenation of Soybean Oil-Derived Biodiesel for Oxidative Stability Improvement. Energy Fuels 2018, 32, 9744–9755. [Google Scholar] [CrossRef]
- Numwong, N.; Prabnasak, P.; Prayoonpunratn, P.; Triphatthanaphong, P.; Thunyaratchatanon, C.; Mochizuki, T.; Chen, S.-Y.; Luengnaruemitchai, A.; Sooknoi, T. Effect of Pd Particle Size on Activity and Cis-Trans Selectivity in Partial Hydrogenation of Soybean Oil-Derived FAMEs over Pd/SiO2 Catalysts. Fuel Process. Technol. 2020, 203, 106393. [Google Scholar] [CrossRef]
- Numwong, N.; Luengnaruemitchai, A.; Chollacoop, N.; Yoshimura, Y. Partial Hydrogenation of Polyunsaturated Fatty Acid Methyl Esters over Pd/Activated Carbon: Effect of Type of Reactor. Chem. Eng. J. 2012, 210, 173–181. [Google Scholar] [CrossRef]
- Chen, S.-Y.; Chang, A.; Rungsi, A.N.; Attanatho, L.; Chang, C.-L.; Pan, J.-H.; Suemanotham, A.; Mochizuki, T.; Takagi, H.; Yang, C.-M.; et al. Superficial Pd Nanoparticles Supported on Carbonaceous SBA-15 as Efficient Hydrotreating Catalyst for Upgrading Biodiesel Fuel. Appl. Catal. Gen. 2020, 602, 117707. [Google Scholar] [CrossRef]
- Department of Energy Business, Thailand Ministry of Energy. Specification of Fatty Acid Methyl Ester (B100). 2009. Available online: https://www.dede.go.th/ewt_dl_link.php?nid=373&filename=Biodiesel (accessed on 13 July 2009).
- Department of Energy Business, Thailand Ministry of Energy. Specification of Alternative Diesel (B7). 2014. Available online: https://www.dede.go.th/ewt_dl_link.php?nid=49989&filename=Biodiesel (accessed on 2 May 2014).
- Department of Alternative Energy Development and Efficiency, Thailand Ministry of Energy. Alternative Energy Development Plan (AEDP2018). Available online: http://www.eppo.go.th/images/POLICY/ENG/AEDP2015ENG.pdf (accessed on 1 September 2015).
- Serrano, M.; Oliveros, R.; Sánchez, M.; Moraschini, A.; Martínez, M.; Aracil, J. Influence of Blending Vegetable Oil Methyl Esters on Biodiesel Fuel Properties: Oxidative Stability and Cold Flow Properties. Energy 2014, 65, 109–115. [Google Scholar] [CrossRef]
- Nainwal, S.; Sharma, N.; Sharma, A.S.; Jain, S.; Jain, S. Cold Flow Properties Improvement of Jatropha Curcas Biodiesel and Waste Cooking Oil Biodiesel Using Winterization and Blending. Energy 2015, 89, 702–707. [Google Scholar] [CrossRef]


| Sample | Proximate Analysis (wt%) | Elemental Analysis 1 (wt%) | |||||||
|---|---|---|---|---|---|---|---|---|---|
| Moisture | Volatiles | Cfixed | Ash | C | H | N | S | O 2 | |
| Raw CTF | 7.53 | 75.5 | 12.1 | 4.87 | 54.2 | 6.56 | 1.88 | 0.24 | 32.3 |
| Hydrochar | 5.72 | 58.5 | 29.5 | 6.25 | 63.4 | 5.25 | 1.75 | 0.20 | 23.2 |
| NPC-K | 4.42 | 20.5 | 73.0 | 2.12 | 79.7 | 2.50 | 1.72 | ND 3 | 14.0 |
| NPC-H | 3.65 | 24.7 | 69.2 | 2.45 | 72.2 | 2.26 | 1.63 | ND | 21.5 |
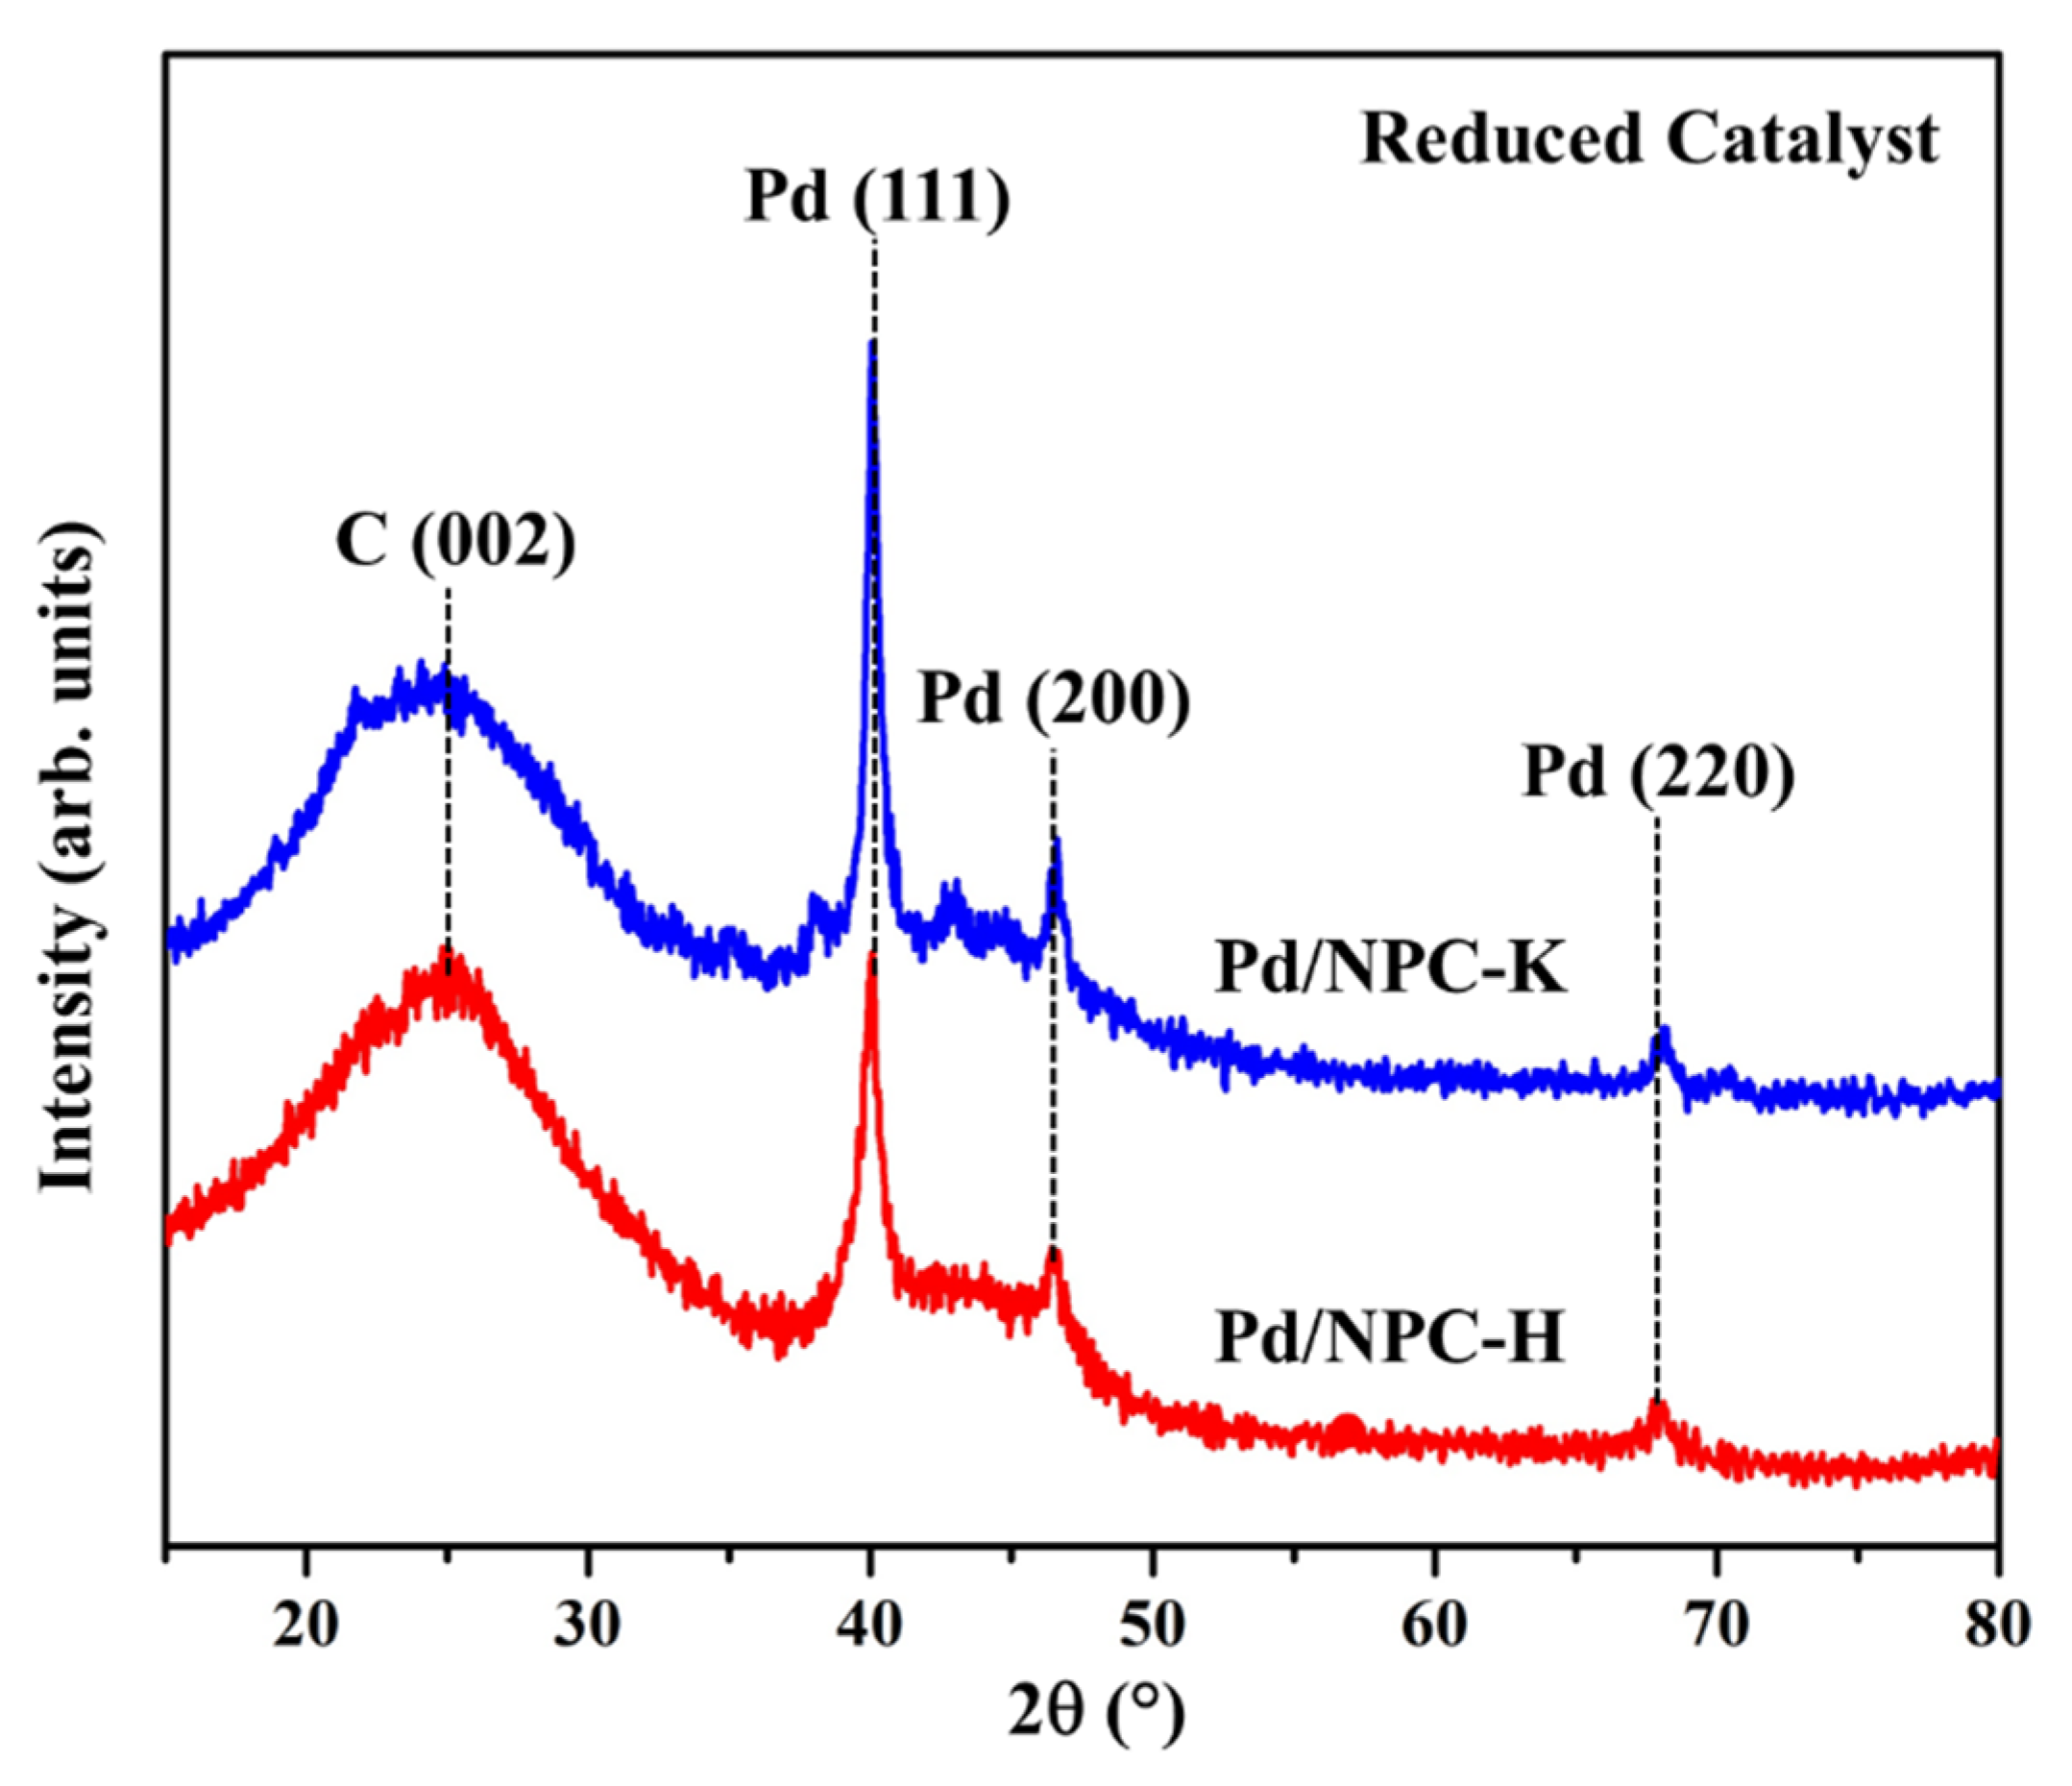
| Sample | d002 (nm) | Lc (nm) | La 1 (nm) | Rp (ID/IG) 2 | La (4.4/R) 3 (nm) |
|---|---|---|---|---|---|
| NPC-K | 0.37 | 0.58 | 2.87 | 1.02 | 4.31 |
| NPC-H | 0.37 | 0.62 | 3.15 | 1.02 | 4.31 |
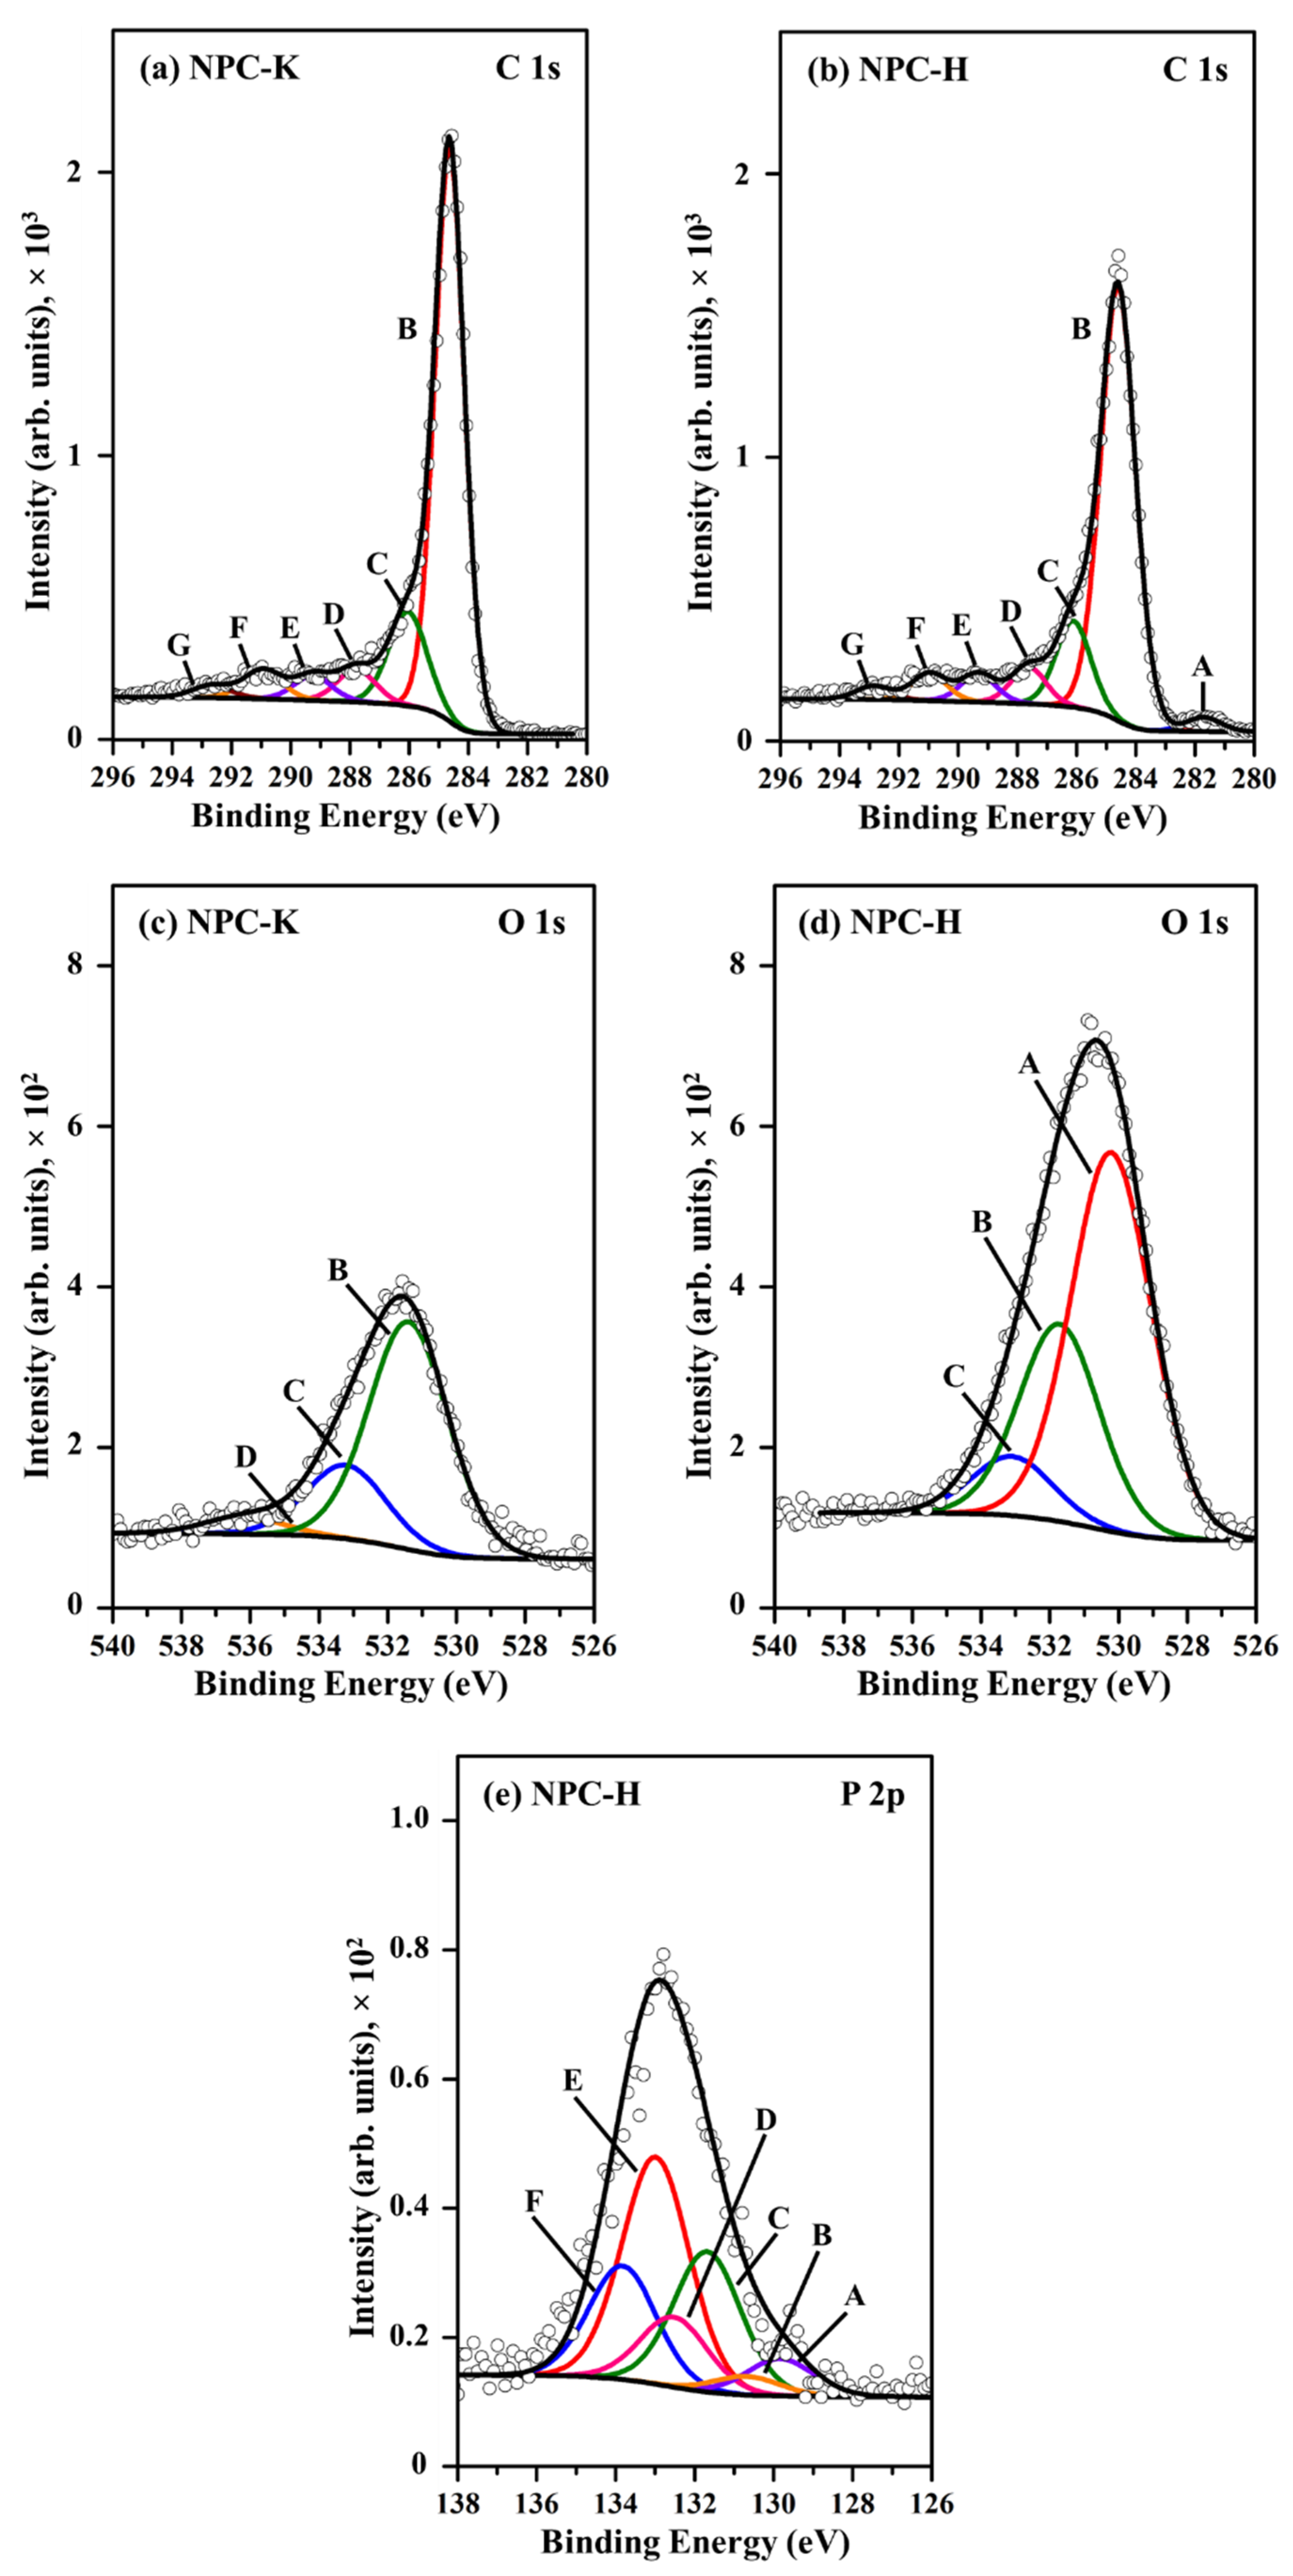
| Region | Peak | NPC-K | NPC-H | Assignment | ||
|---|---|---|---|---|---|---|
| BE (eV) | wt% | BE (eV) | wt% | |||
| C 1s | A | - | - | 281.7 | 1.75 | Carbide |
| B | 284.6 | 62.9 | 284.6 | 53.0 | Graphitic carbon | |
| C | 286.1 | 13.3 | 286.1 | 10.5 | C–O– in phenol and alcohol | |
| D | 287.8 | 4.64 | 287.6 | 4.48 | C–O– in ether, C-O-P | |
| E | 289.3 | 3.50 | 289.3 | 3.46 | O–C=O in carboxyl or ester | |
| F | 291.0 | 4.04 | 291.0 | 3.37 | C=O/C=C in carbonate, occluded CO | |
| G | 292.7 | 1.75 | 292.9 | 1.66 | π–π* transition due to conjugation | |
| O 1s | A | - | - | 530.2 | 11.3 | OH− anion |
| B | 531.4 | 7.04 | 531.7 | 5.87 | C=O in carbonate, P=O | |
| C | 533.2 | 2.28 | 533.1 | 1.77 | C–O– in aromatic rings, phenols and ethers, C–O–P | |
| D | 536.2 | 0.53 | - | - | Chemisorbed water | |
| P 2p | A (2p3/2) | - | - | 129.8 | 0.17 | P |
| B (2p1/2) | - | - | 130.7 | 0.09 | P | |
| C (2p3/2) | - | - | 131.7 | 0.66 | C–P bonding | |
| D (2p1/2) | - | - | 132.5 | 0.33 | C–P bonding | |
| E (2p3/2) | - | - | 133.0 | 1.07 | Phosphates and pyrophosphates | |
| F (2p1/2) | - | - | 133.8 | 0.53 | Metaphosphates | |
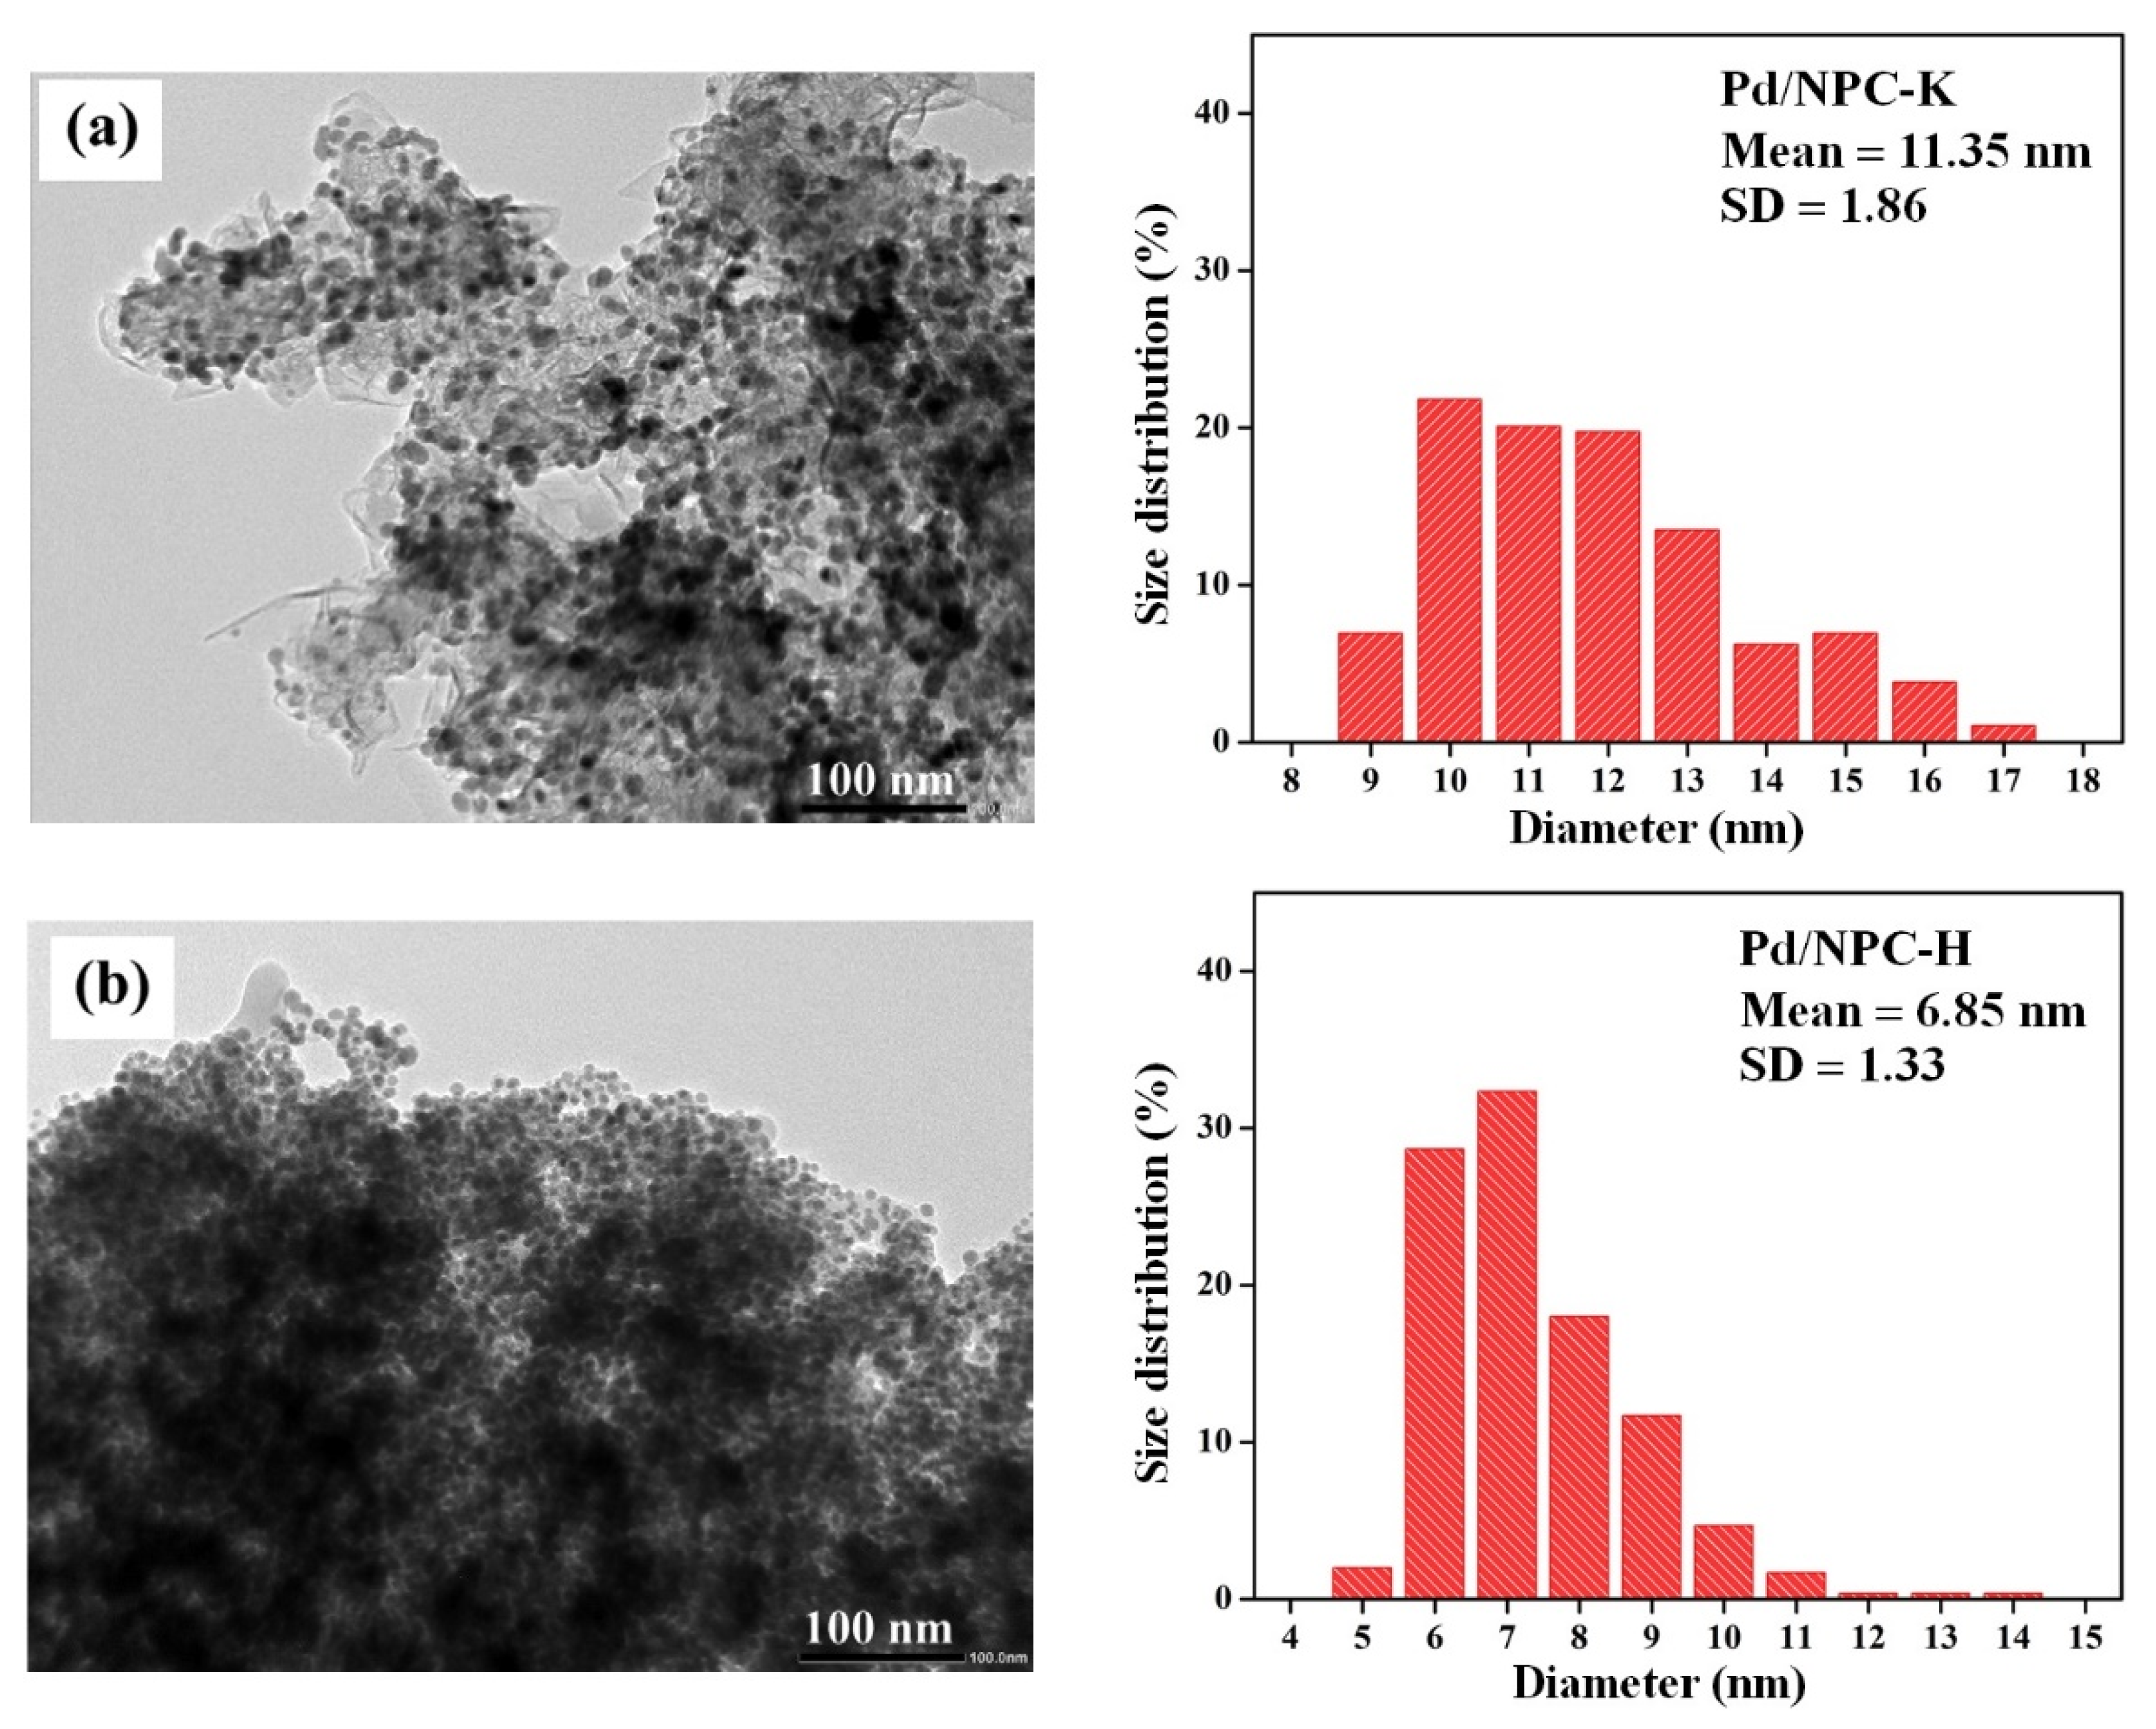
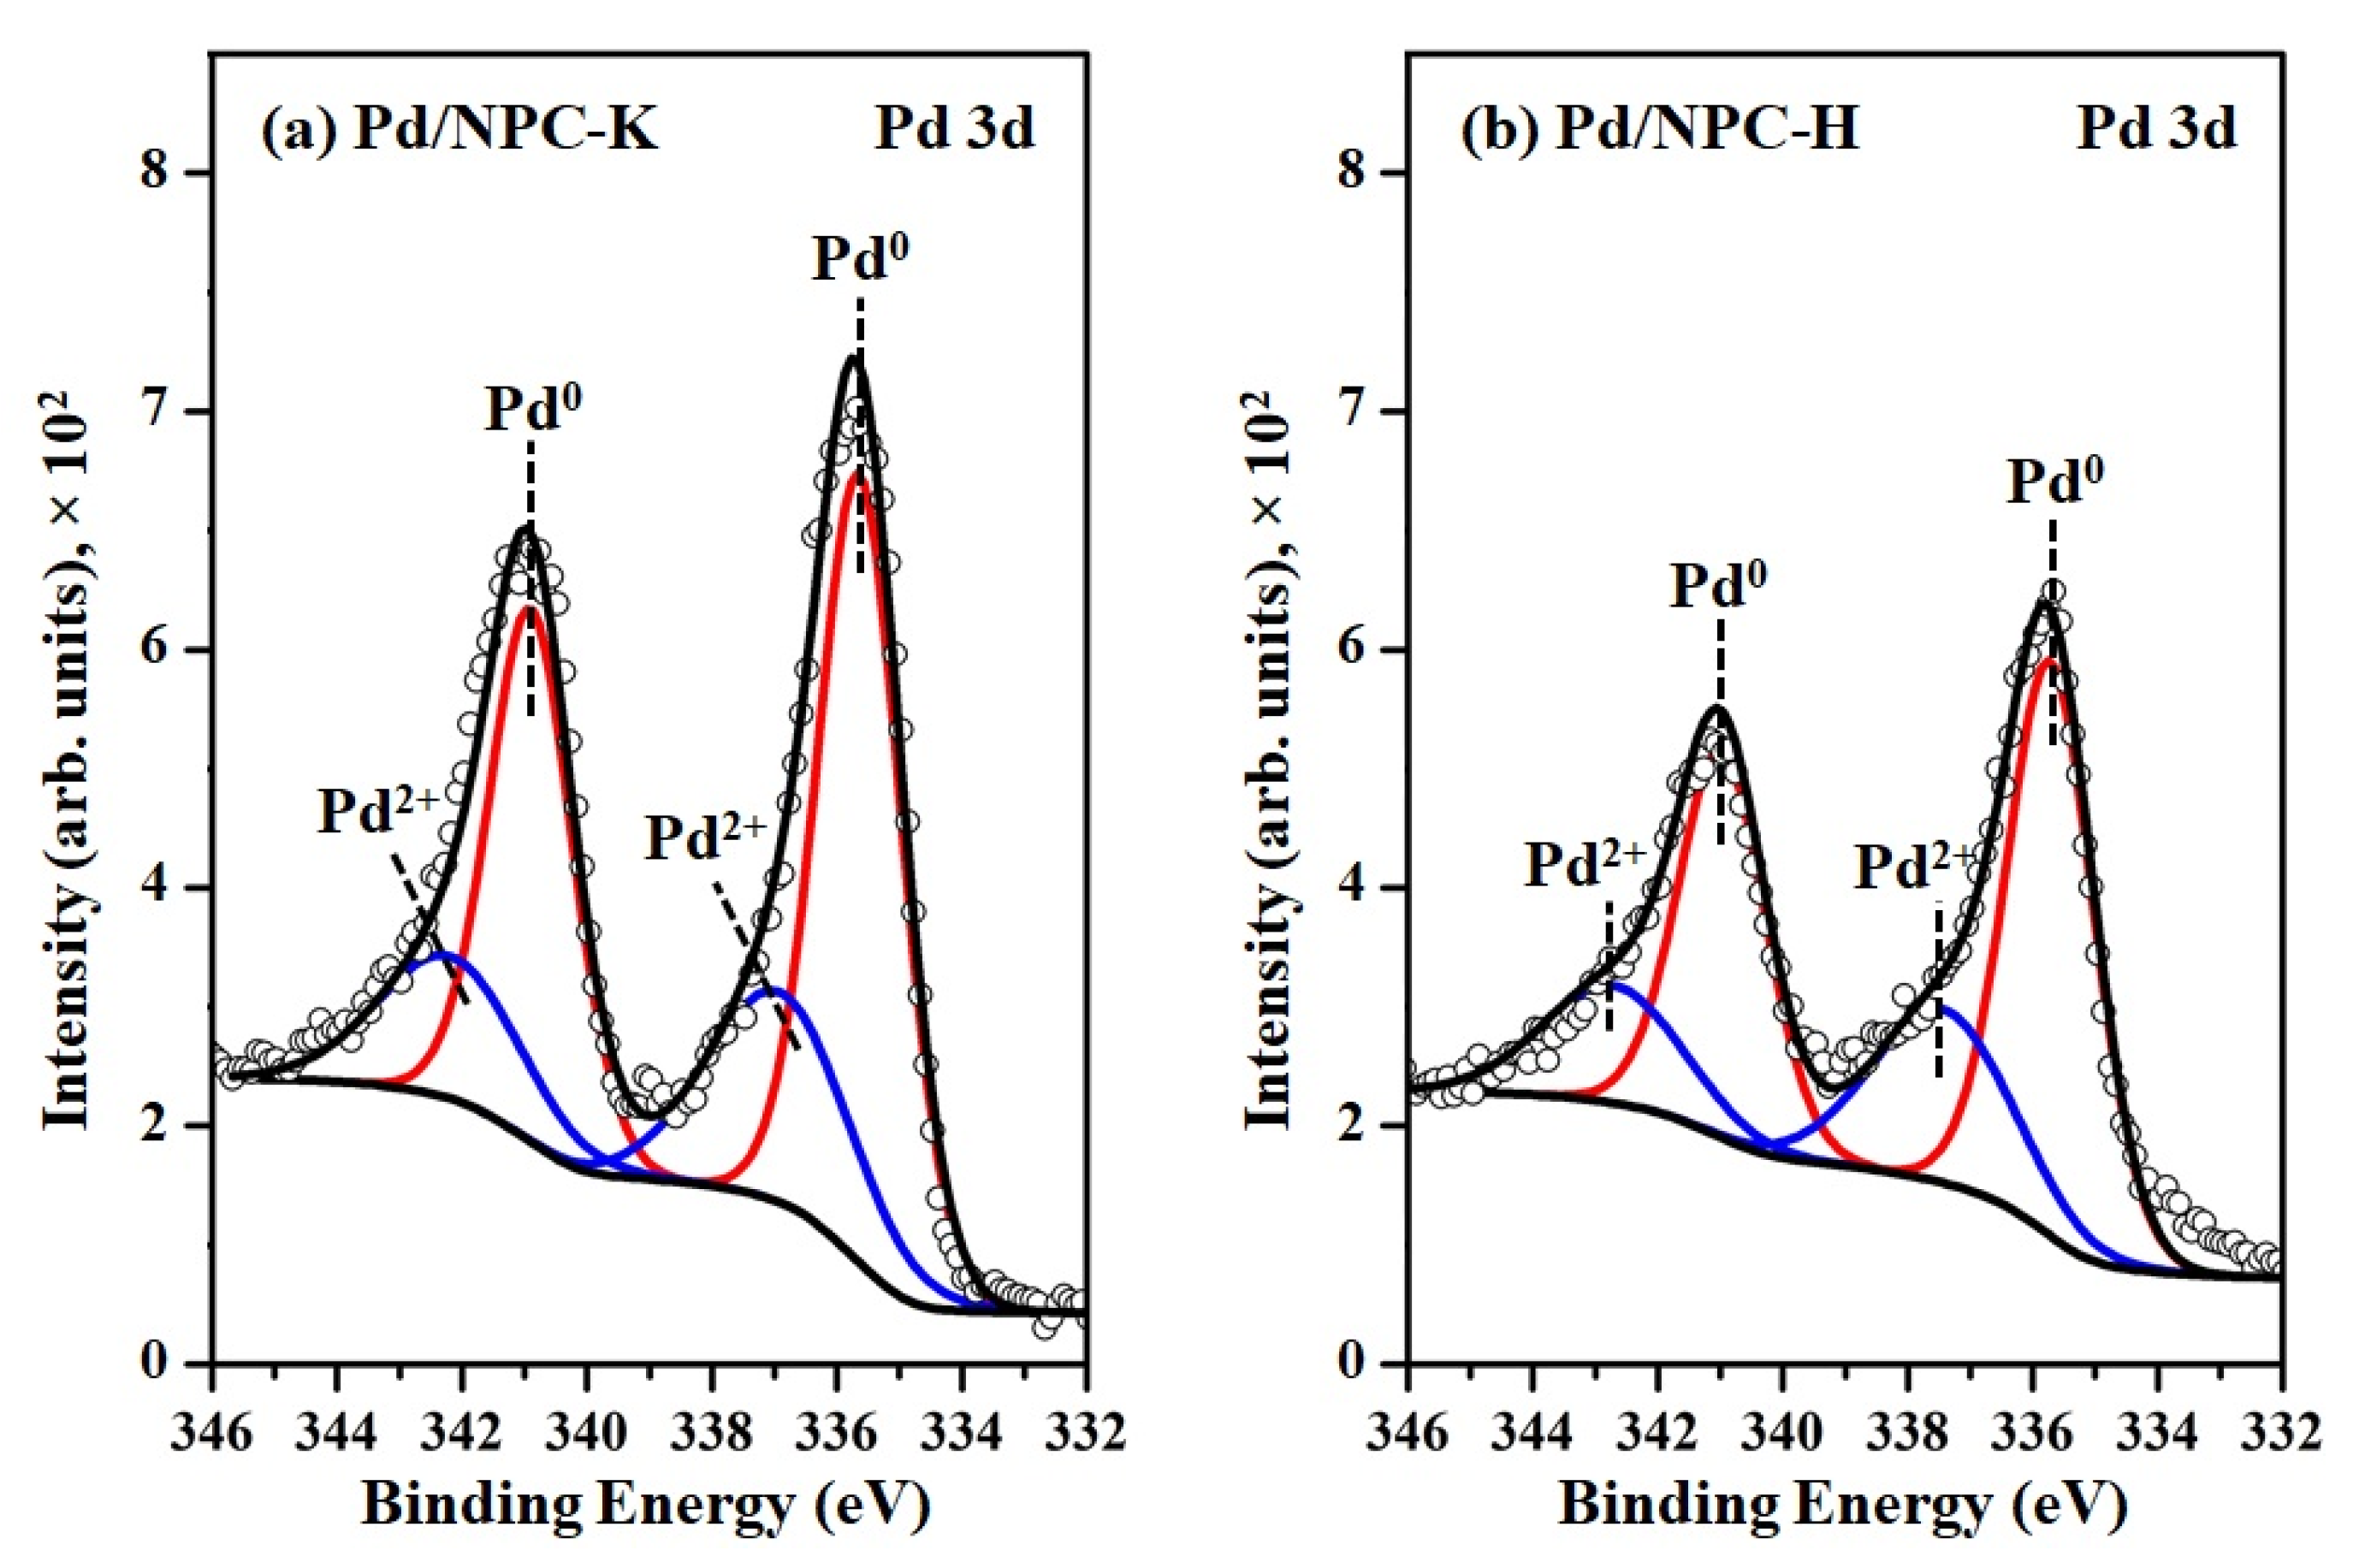
| Sample | PZC | Acidity 1 (mmol g−1) | Pd Loading 2 (wt%) | Pd Particle Size (nm) | Pd0/Pd2+ Ratio 3 | SBET (m2 g−1) | Dp (nm) | Vtotal (cm3 g−1) | Vmicro (cm3 g−1) | Vmeso (cm3 g−1) | |
|---|---|---|---|---|---|---|---|---|---|---|---|
| XRD | TEM | ||||||||||
| NPC-K | 4.8 | 0.17 | - | - | - | - | 1378 | 0.73 | 0.67 | 0.51 | 0.16 |
| NPC-H | 2.6 | 0.84 | - | - | - | - | 758 | 0.80 | 0.37 | 0.29 | 0.08 |
| Pd/NPC-K | - | 0.32 | 4.84 | 11.2 | 11.4 ± 1.9 | 2.2 | 979 | 0.64 | 0.43 | 0.37 | 0.05 |
| Pd/NPC-H | - | 1.93 | 4.92 | 6.82 | 6.9 ± 1.3 | 2.1 | 535 | 0.73 | 0.19 | 0.17 | 0.00 |
Publisher’s Note: MDPI stays neutral with regard to jurisdictional claims in published maps and institutional affiliations. |
© 2021 by the authors. Licensee MDPI, Basel, Switzerland. This article is an open access article distributed under the terms and conditions of the Creative Commons Attribution (CC BY) license (https://creativecommons.org/licenses/by/4.0/).
Share and Cite
Udomsap, P.; Meesiri, S.; Chollacoop, N.; Eiad-Ua, A. Biomass Nanoporous Carbon-Supported Pd Catalysts for Partial Hydrogenation of Biodiesel: Effects of Surface Chemistry on Pd Particle Size and Catalytic Performance. Nanomaterials 2021, 11, 1431. https://doi.org/10.3390/nano11061431
Udomsap P, Meesiri S, Chollacoop N, Eiad-Ua A. Biomass Nanoporous Carbon-Supported Pd Catalysts for Partial Hydrogenation of Biodiesel: Effects of Surface Chemistry on Pd Particle Size and Catalytic Performance. Nanomaterials. 2021; 11(6):1431. https://doi.org/10.3390/nano11061431
Chicago/Turabian StyleUdomsap, Parncheewa, Sirasit Meesiri, Nuwong Chollacoop, and Apiluck Eiad-Ua. 2021. "Biomass Nanoporous Carbon-Supported Pd Catalysts for Partial Hydrogenation of Biodiesel: Effects of Surface Chemistry on Pd Particle Size and Catalytic Performance" Nanomaterials 11, no. 6: 1431. https://doi.org/10.3390/nano11061431