
Ultra-Low Percolation Threshold Induced by Thermal Treatments in Co-Continuous Blend-Based PP/PS/MWCNTs Nanocomposites


Abstract
:1. Introduction
2. Materials and Methods
2.1. Materials
2.2. Processing
2.2.1. Extrusion
2.2.2. Thermal Treatments
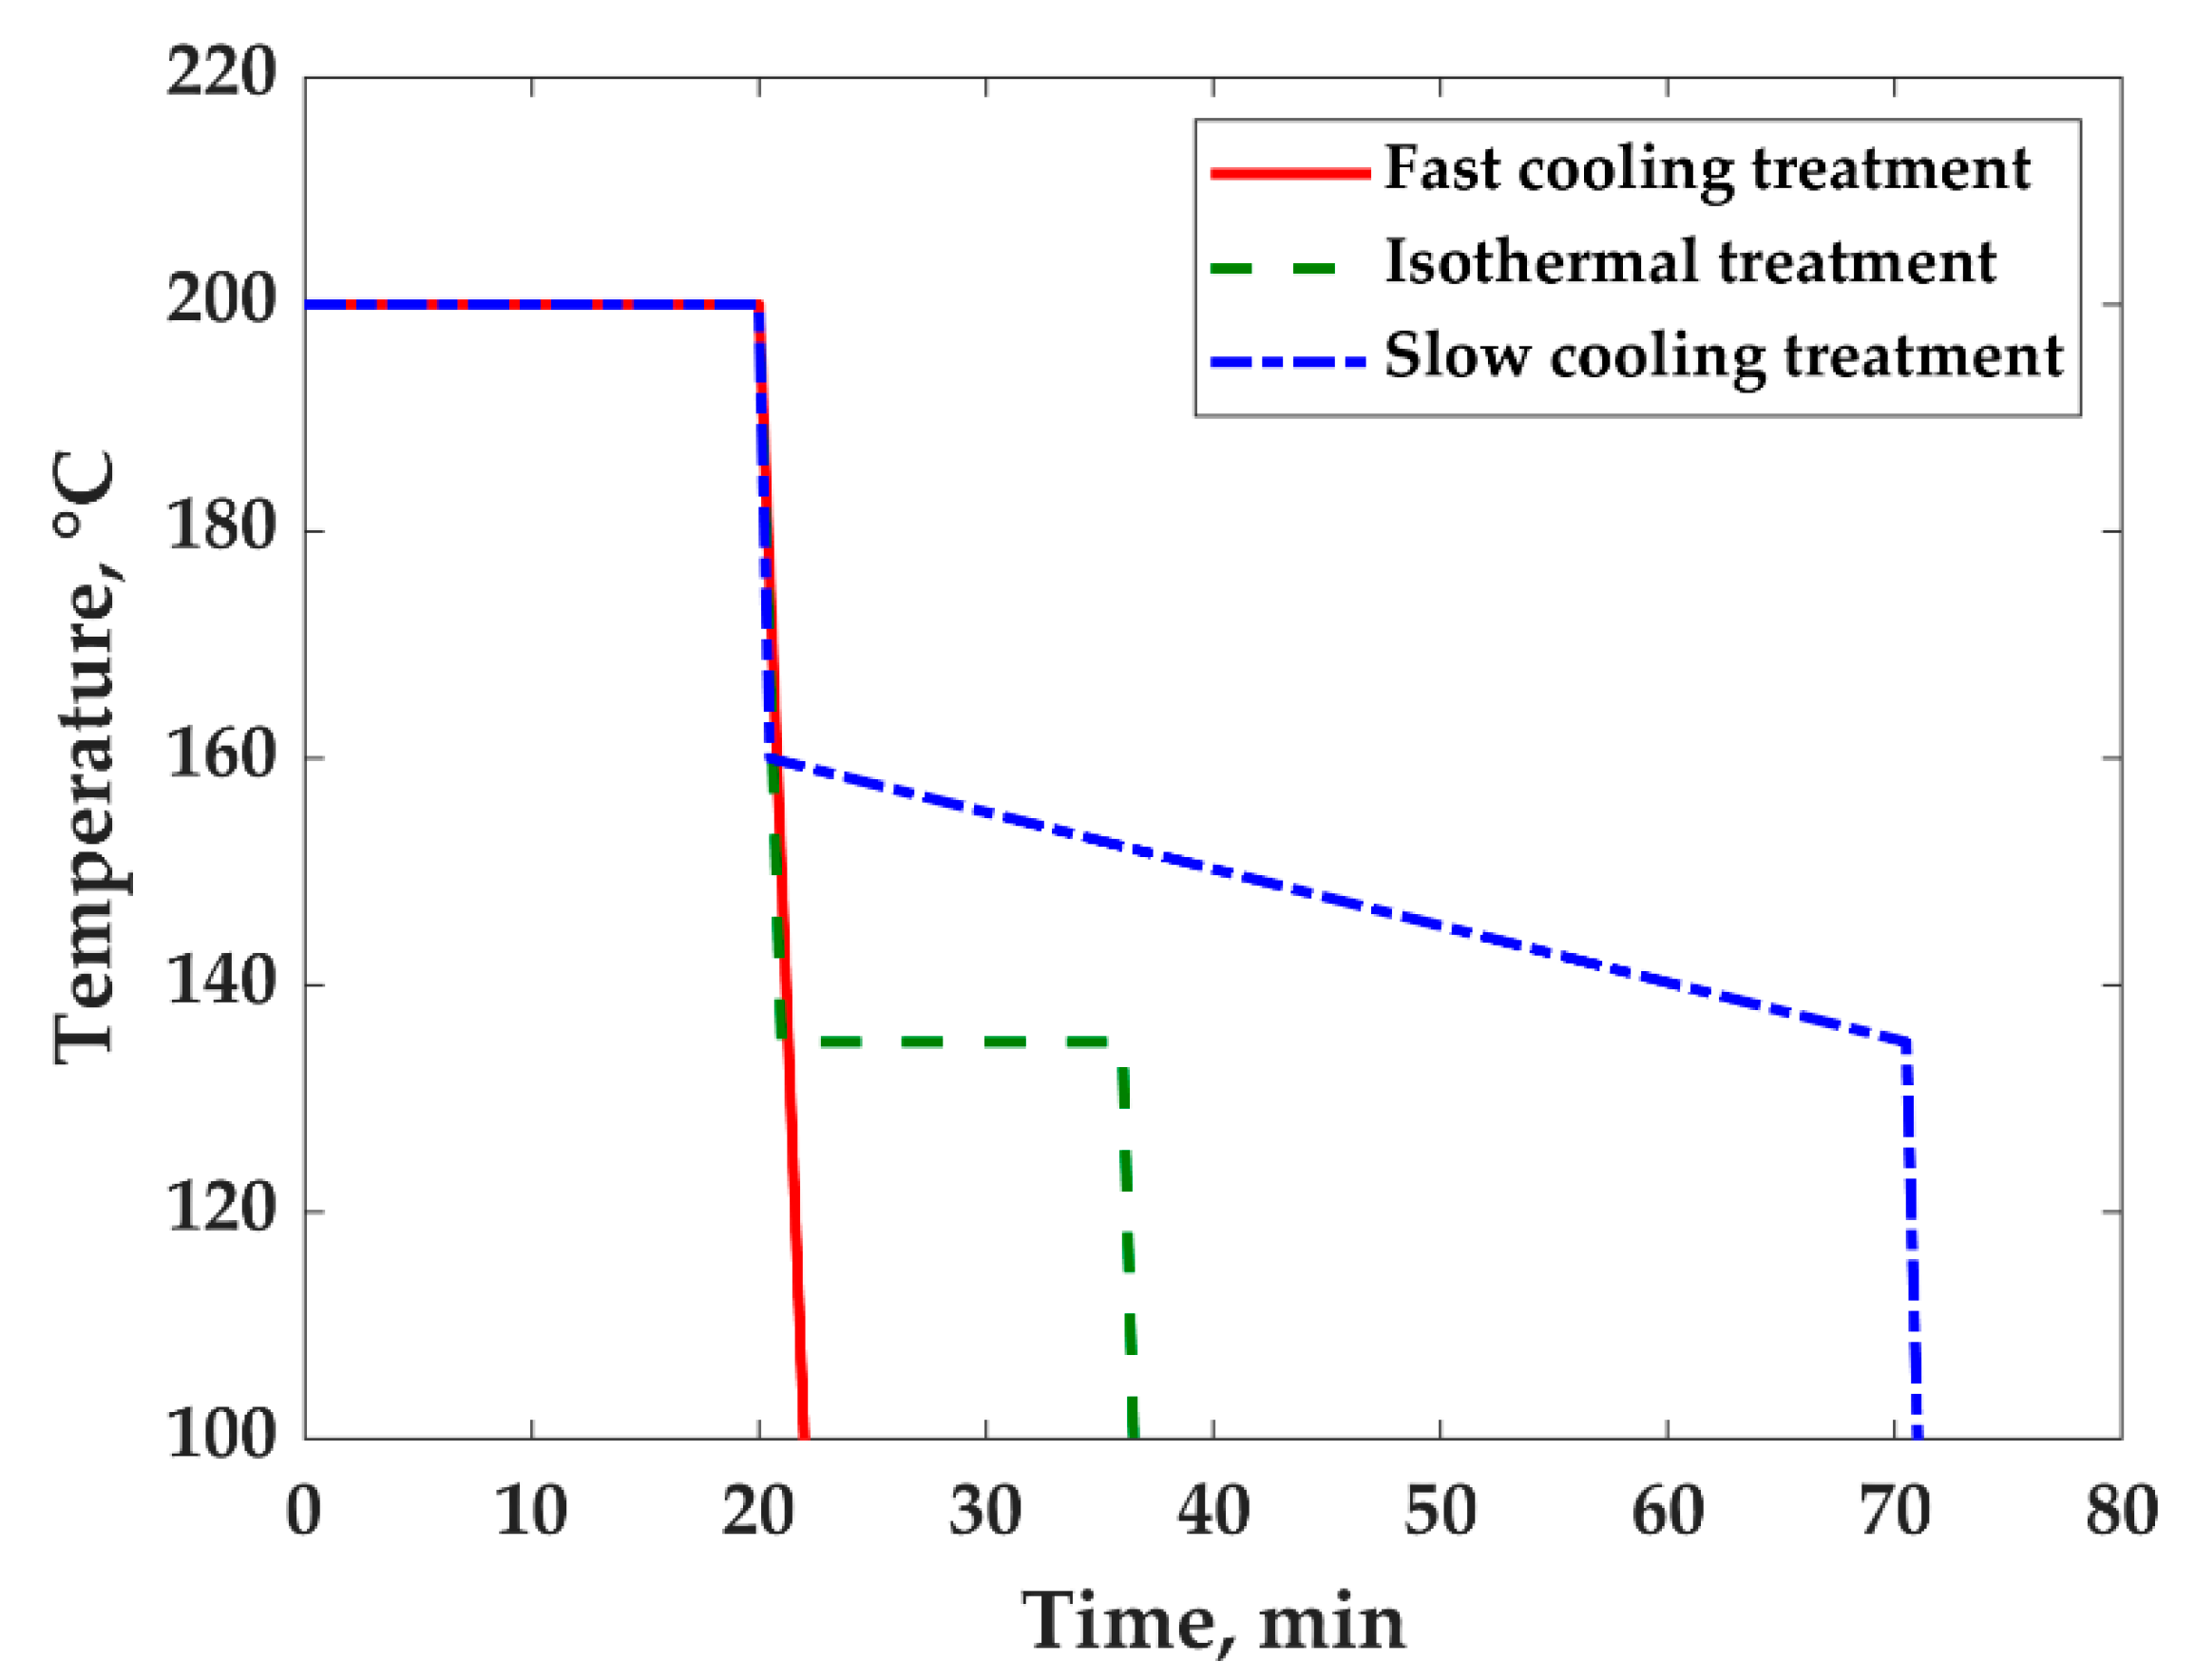
- For the fast-cooling treatment, the third step was fast cooling to room temperature, which was performed at a rate of 50 °C/min under a pressure of 10 MPa. The whole treatment, all three steps, took 22 min (Figure 1);
- For the slow-cooling treatment, the third step was fast cooling to 160 °C and a slow cooling from 160 to 135°C at a rate of 0.5 °C/min, followed by fast cooling from 135 °C to room temperature under a pressure of 10 MPa. The whole treatment took 1 h 10 min (Figure 1). The starting temperature of the treatment (160 °C) was chosen to prevent the so-called annealing effect [11,14,29,30,31,49] which could involve the coarsening of blend morphology. The temperature of 135 °C at the end of the treatment corresponds to the highest onset temperature of crystallization, evaluated by the DSC analysis.
- For the isothermal treatment, the third step was fast cooling to 135 °C which was maintained for 15 min. Then, the sample was fast cooled to room temperature under a pressure of 10 MPa. The whole treatment took 36 min (Figure 1).
2.3. Characterization
2.3.1. Crystallization Studies
- Non-Isothermal Crystallization
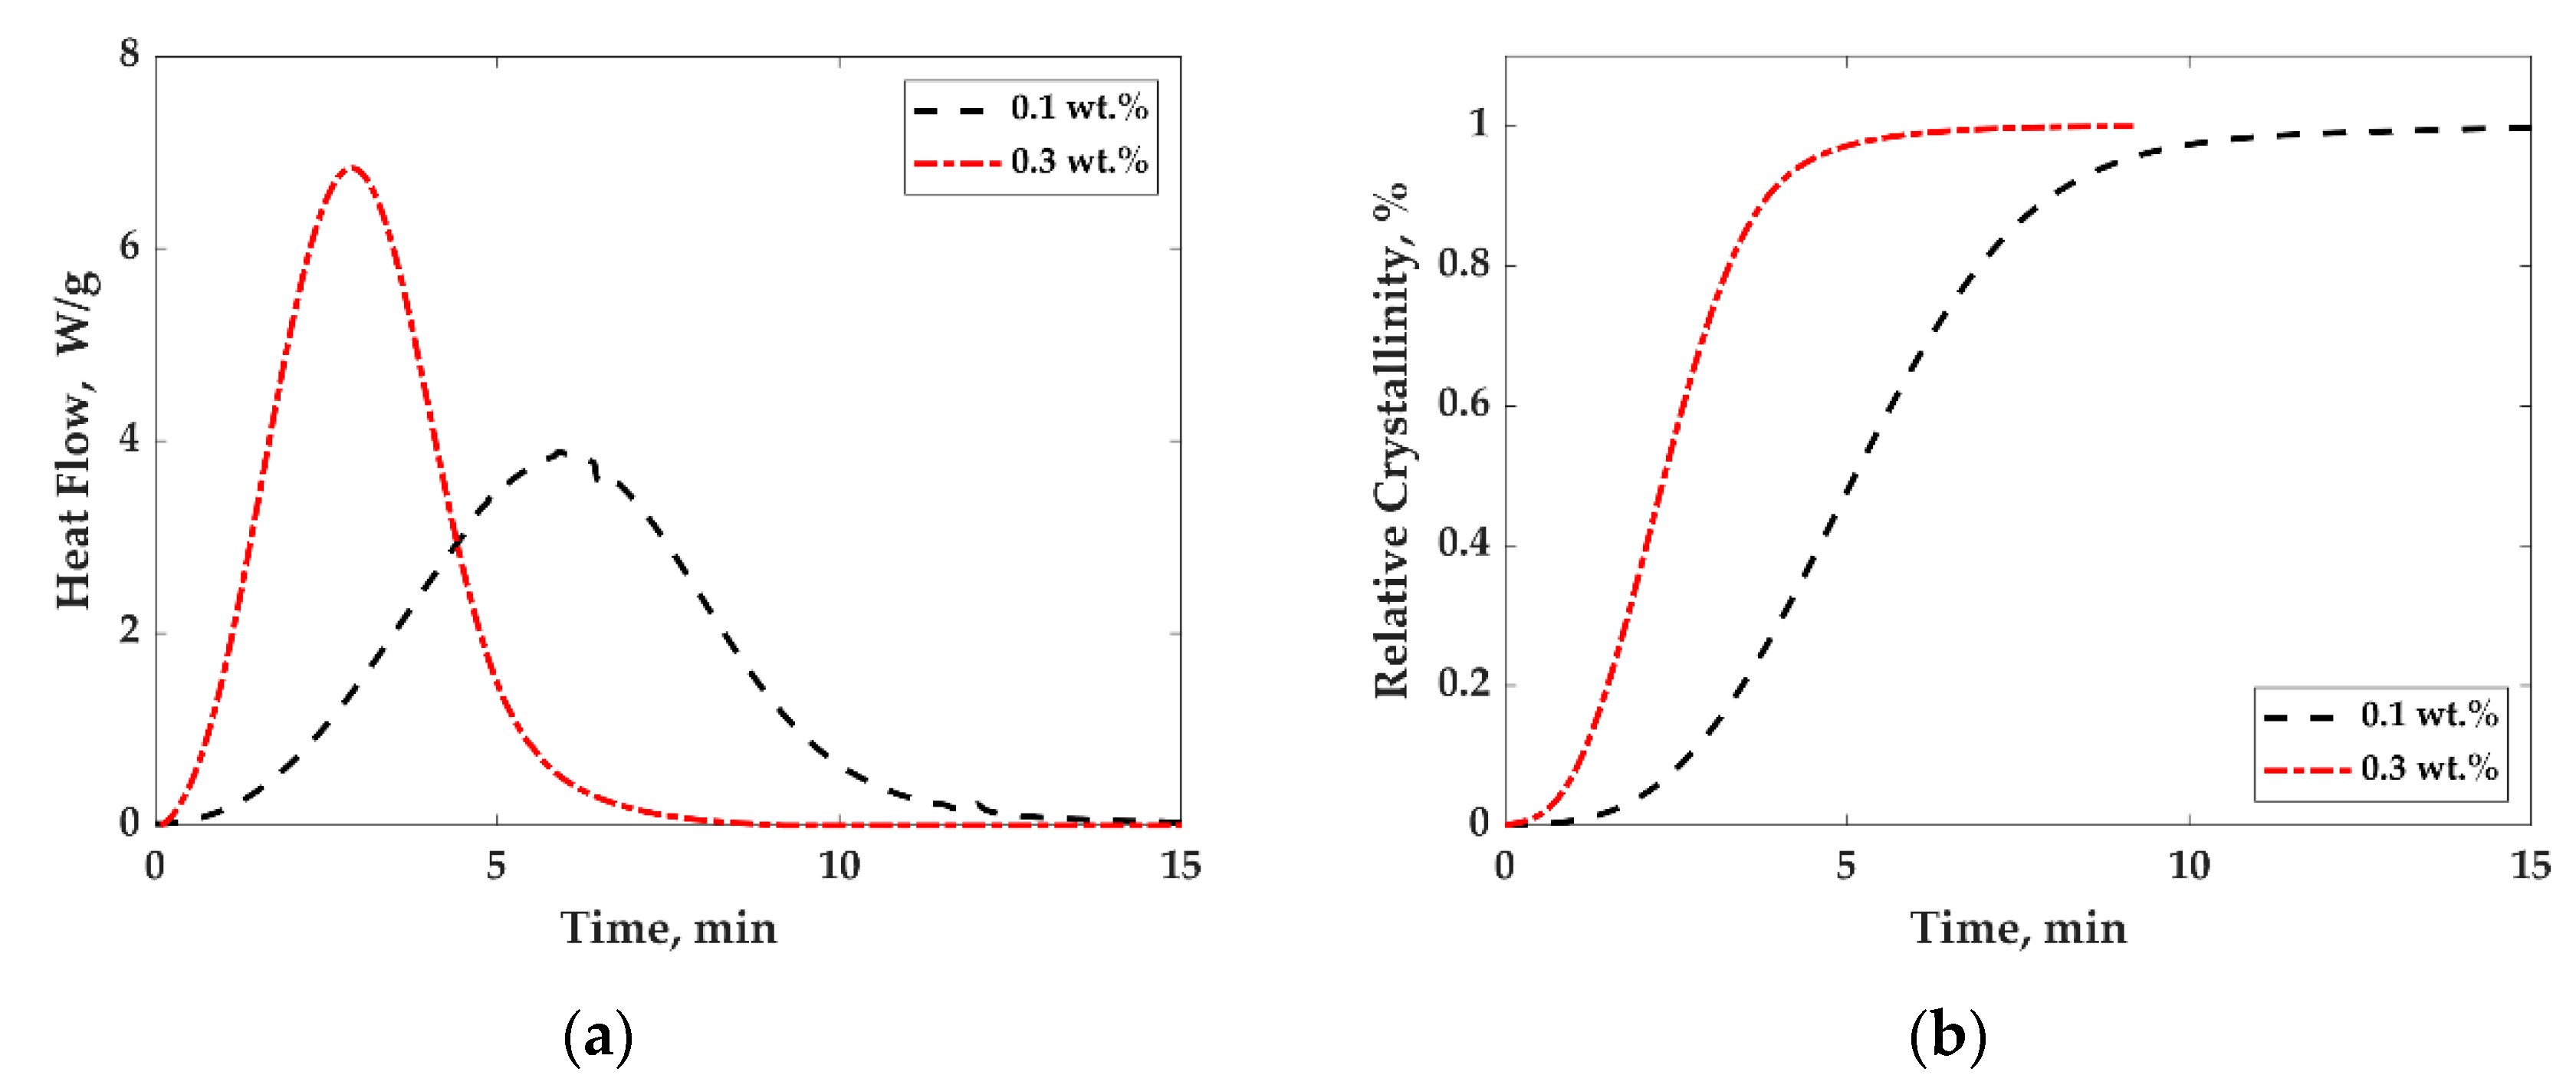
- Isothermal Crystallization
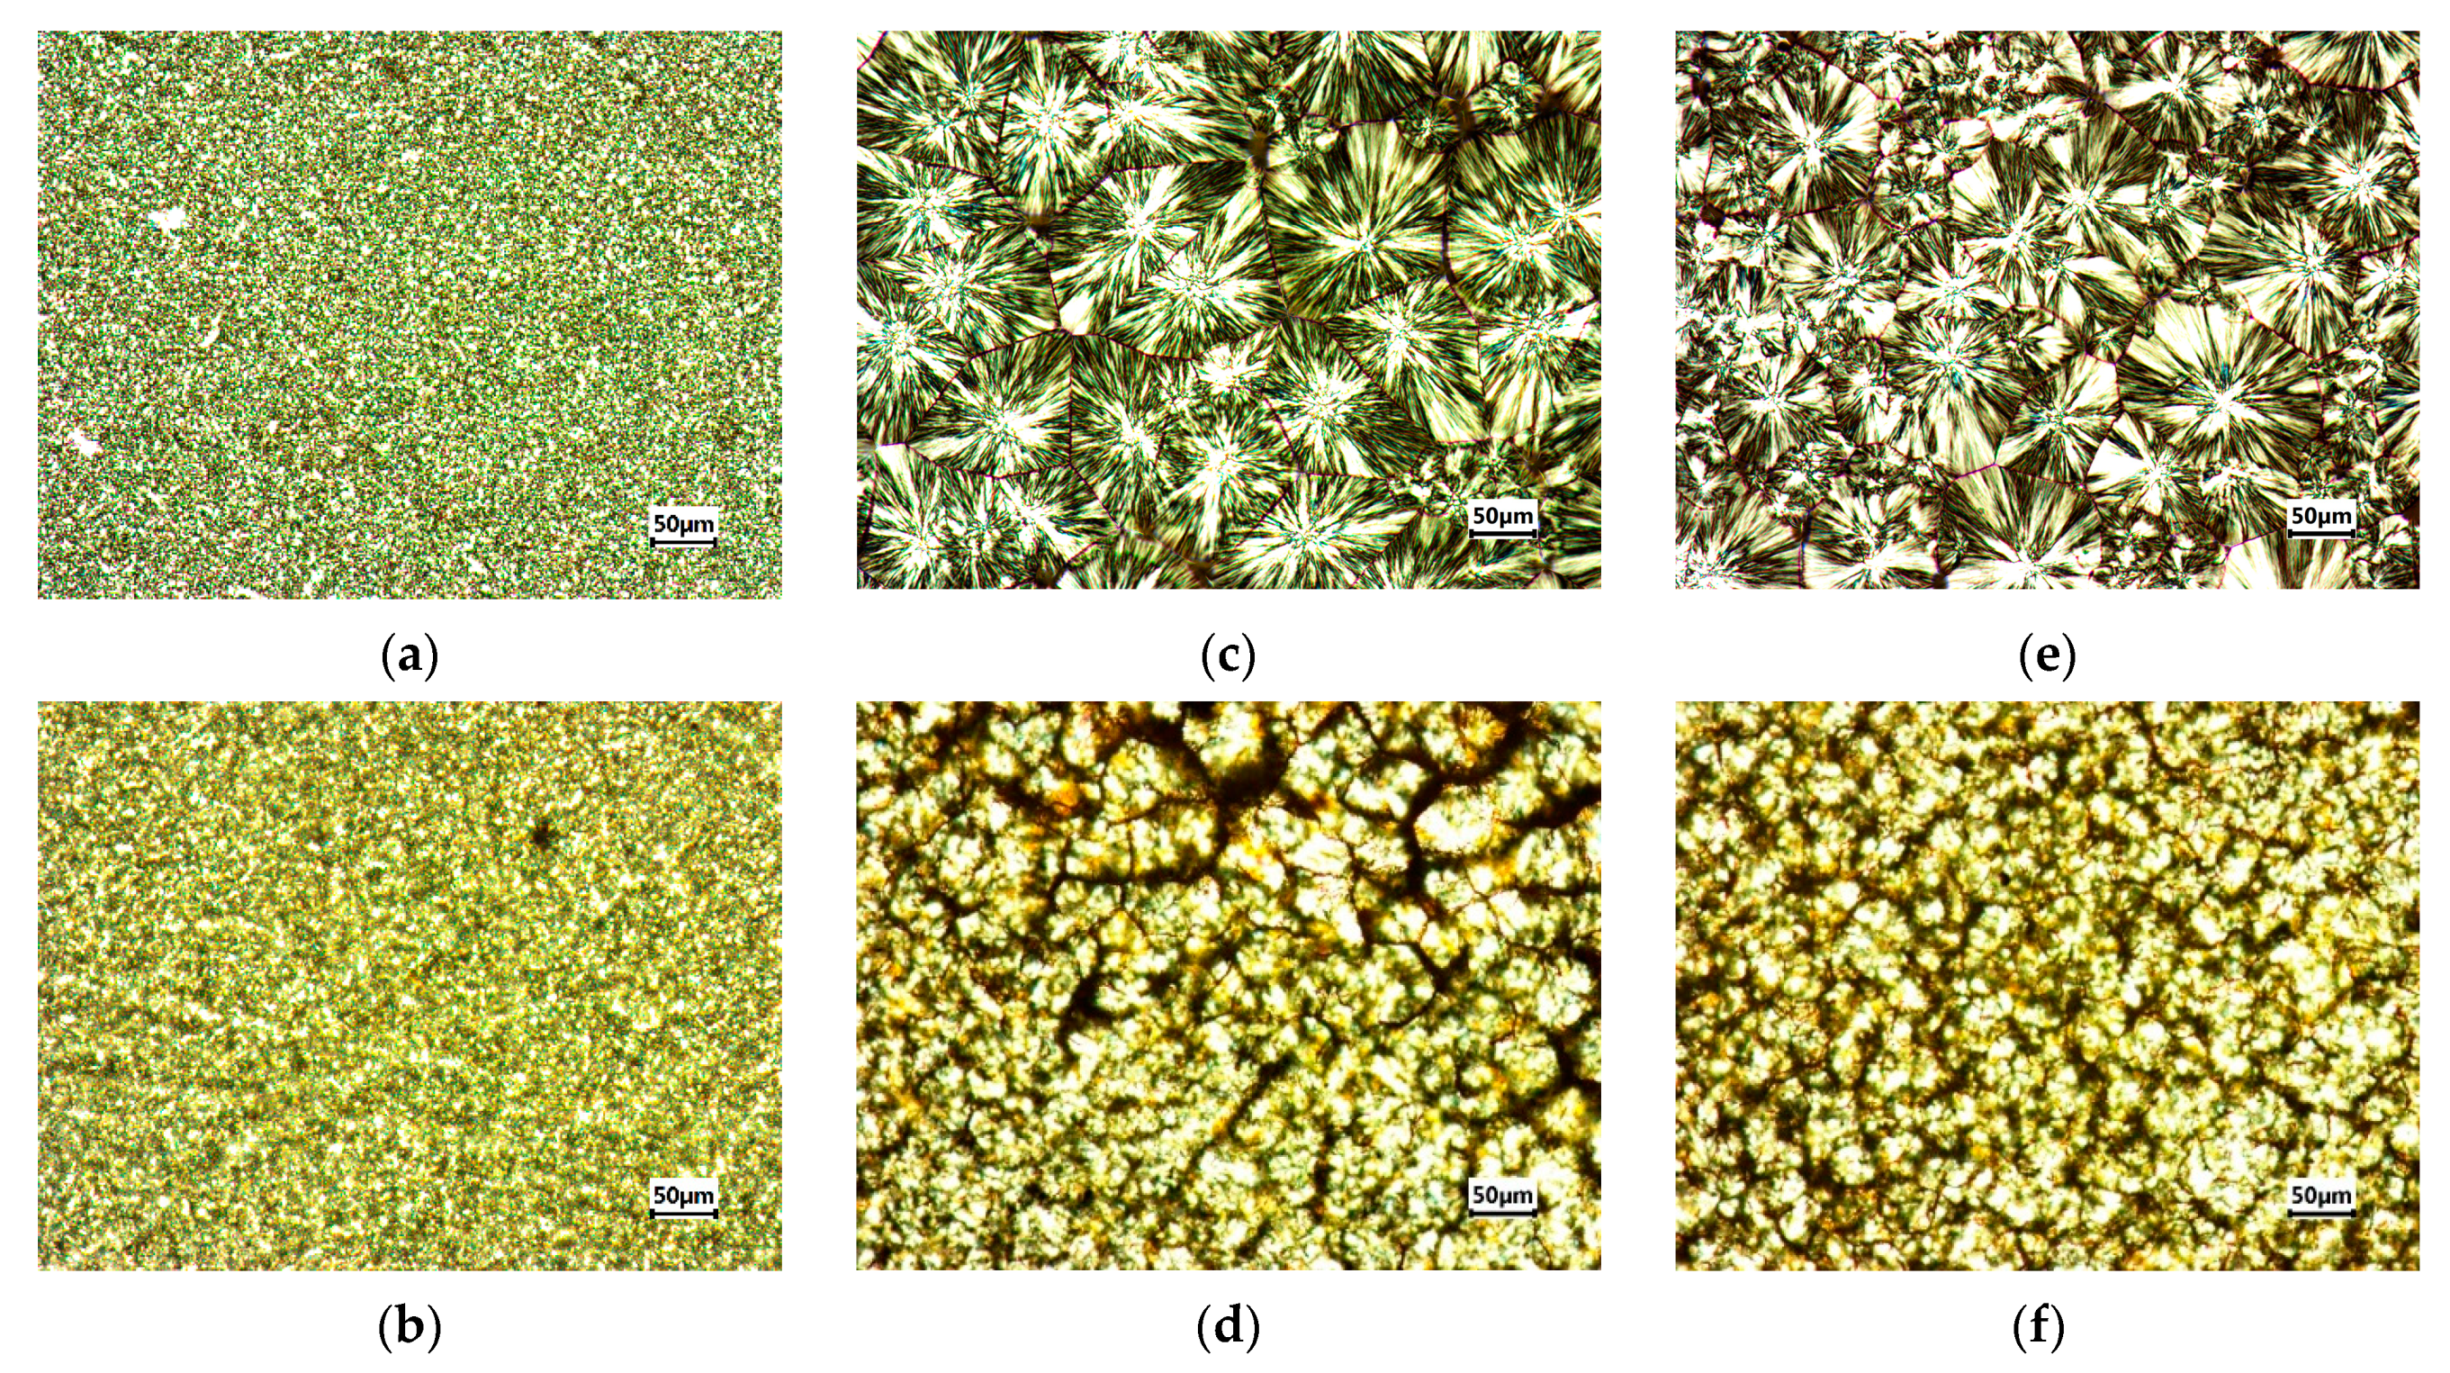
2.3.2. Polarized Optical Microscopy
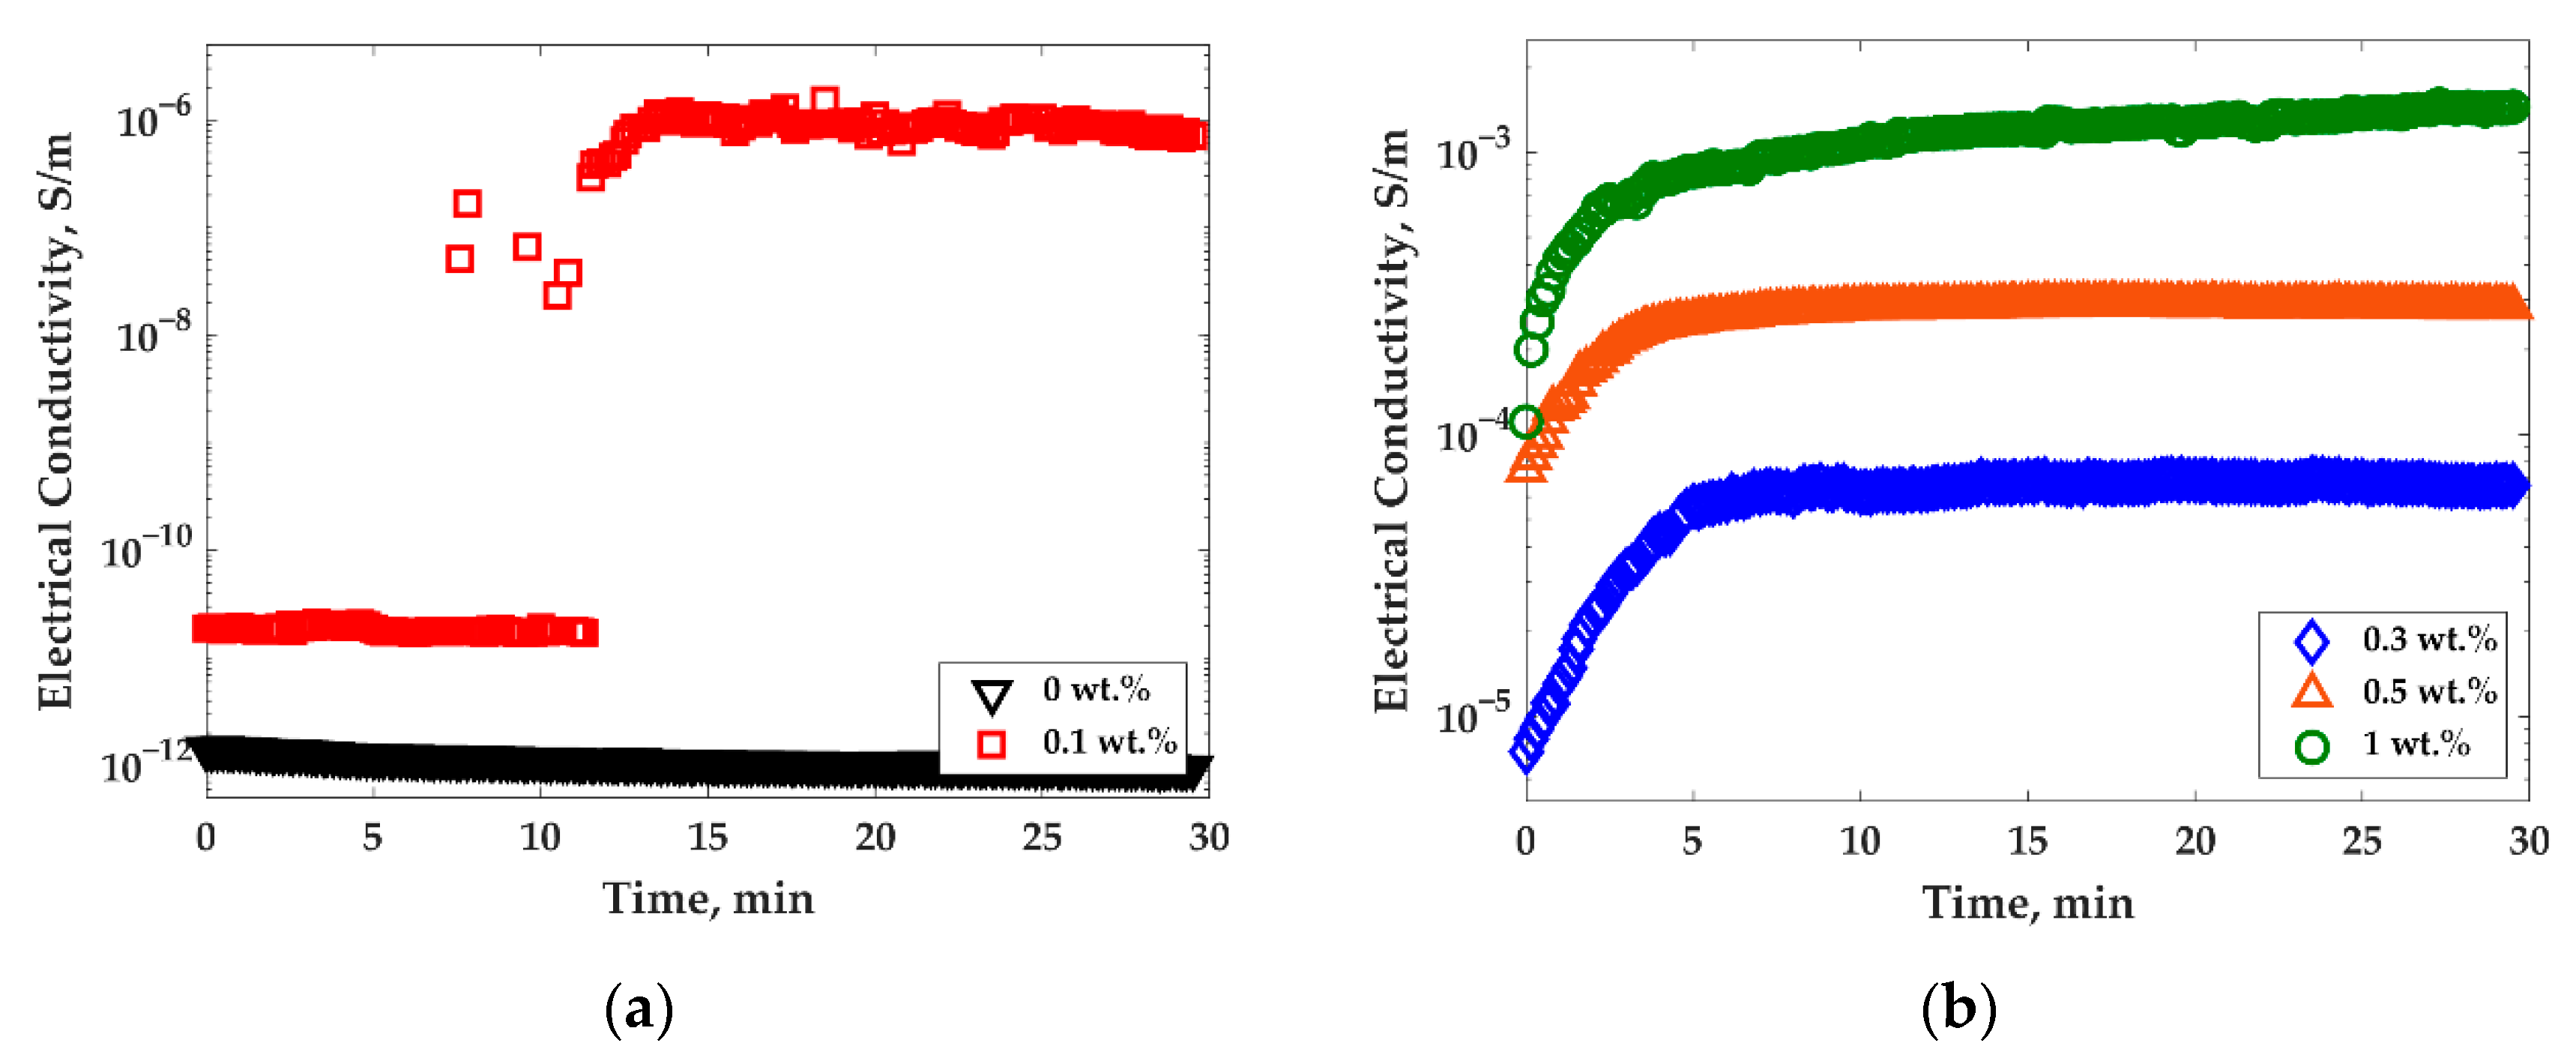
2.3.3. Electrical Conductivity
2.3.4. Scanning Electron Microscopy
3. Results
3.1. Effect of the Treatments on Electrical Conductivity and Morphology of PP/PS/MWCNTs Composites
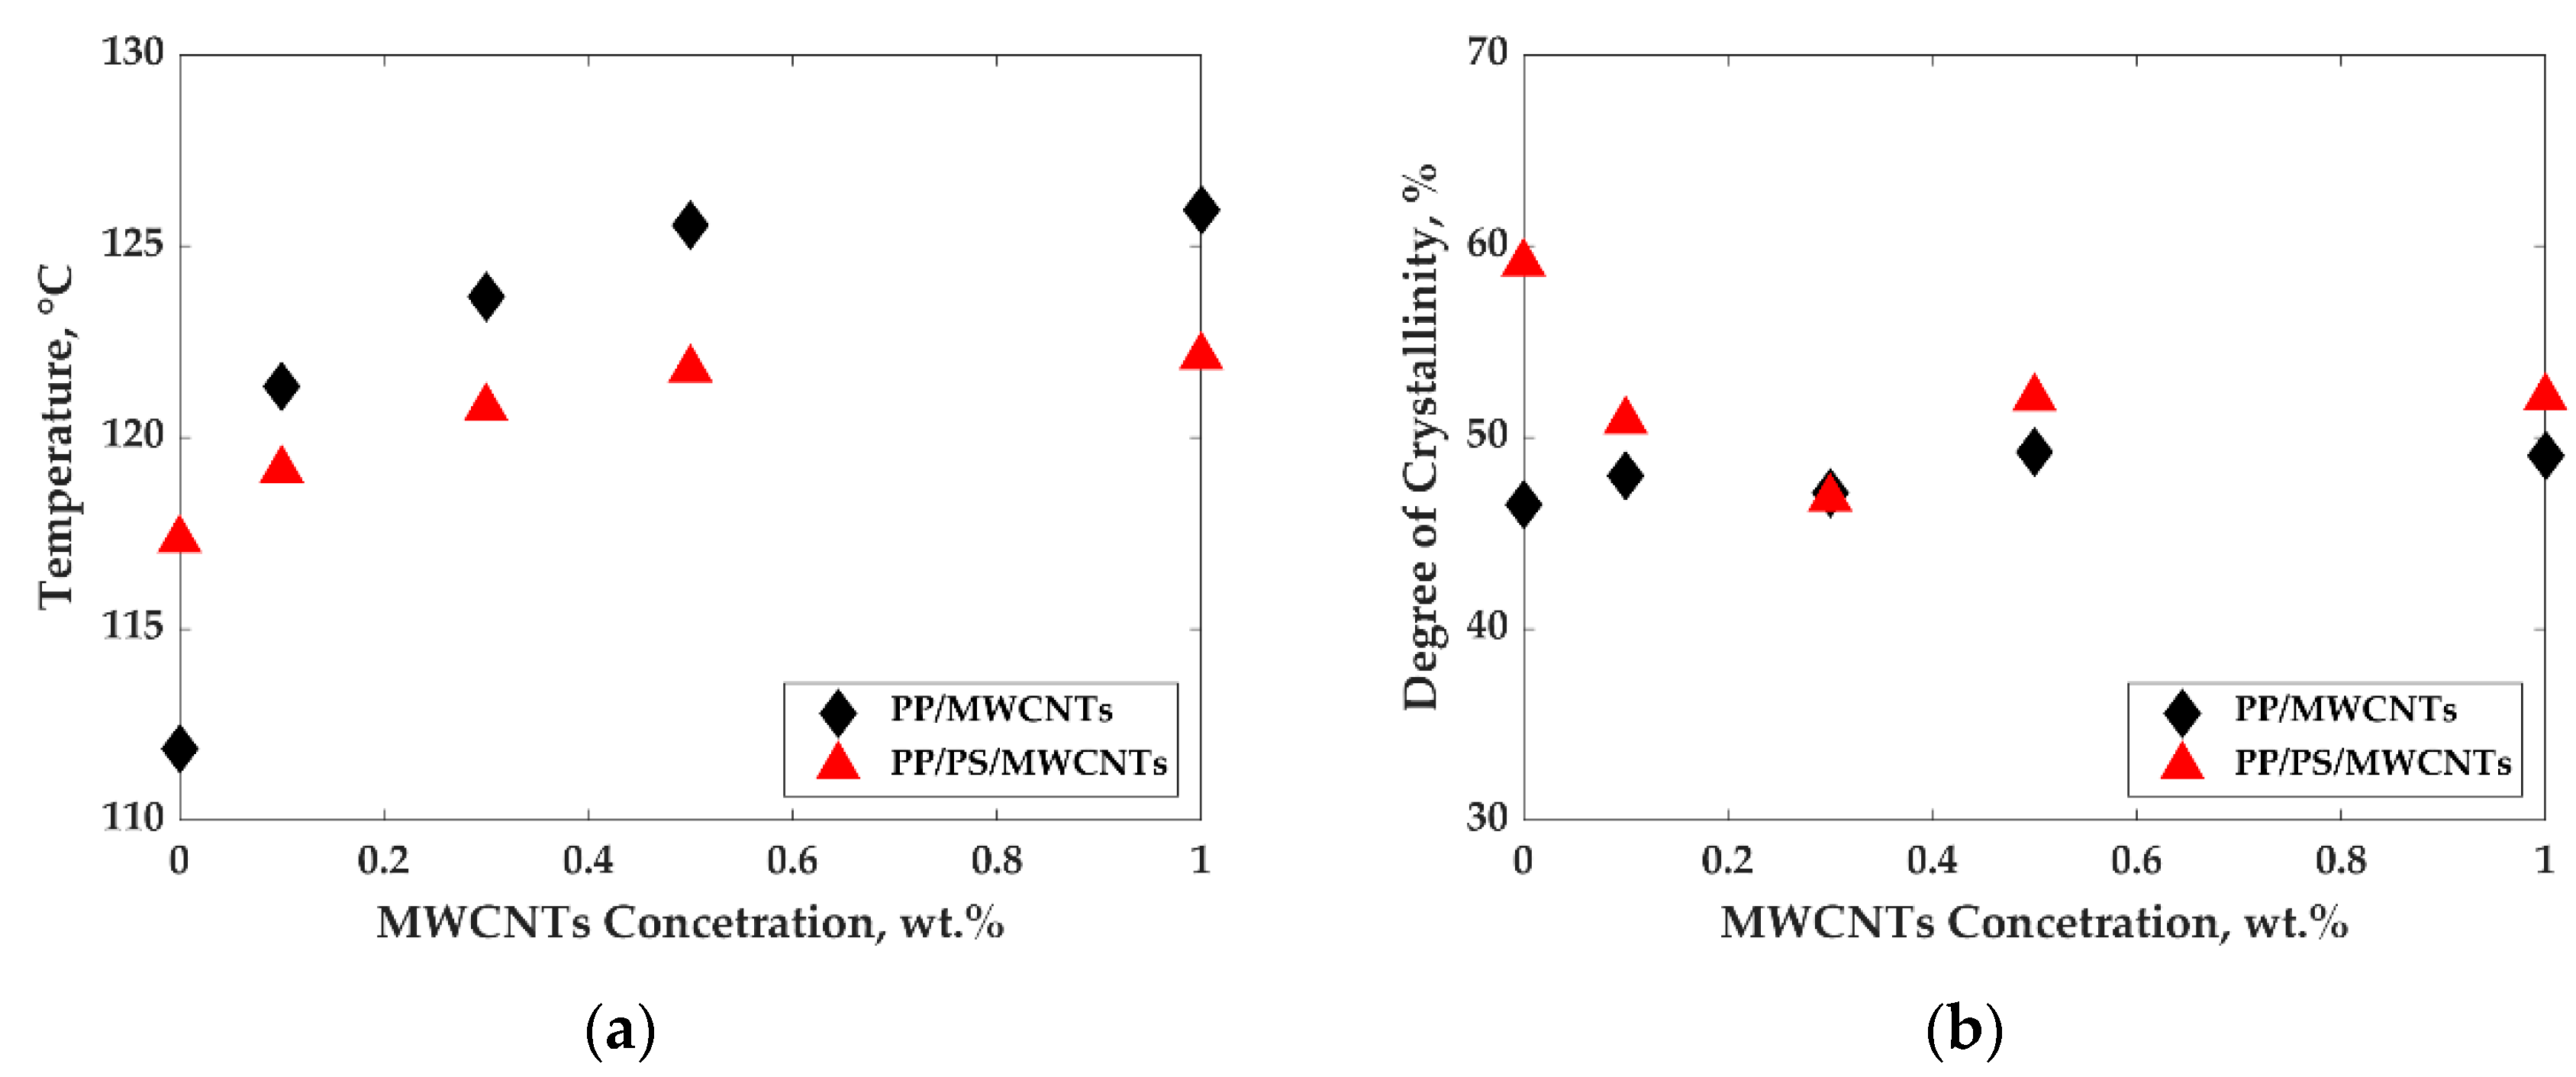
3.2. Crystallization Behavior and Electrical Conductivity of PP/MWCNTs and PP/PS/MWCNTs Nanocomposites
4. Discussion
5. Conclusions
Supplementary Materials
Author Contributions
Funding
Data Availability Statement
Acknowledgments
Conflicts of Interest
References
- Shi, Y.; He, L.; Chen, D.; Wang, Q.; Shen, J.; Guo, S. Simultaneously improved electromagnetic interference shielding and flame retarding properties of poly (butylene succinate)/thermoplastic polyurethane blends by constructing segregated flame retardants and multi-walled carbon nanotubes double network. Compos. Part A Appl. Sci. Manuf. 2020, 137, 106037. [Google Scholar] [CrossRef]
- Chen, J.; Liao, X.; Li, S.; Wang, W.; Guo, F.; Li, G. A promising strategy for efficient electromagnetic interference shielding by designing a porous double-percolated structure in MWCNT/polymer-based composites. Compos. Part A Appl. Sci. Manuf. 2020, 138, 106059. [Google Scholar] [CrossRef]
- Liu, T.; Huang, R.; Qi, X.; Dong, P.; Fu, Q. Facile preparation of rapidly electro-active shape memory thermoplastic polyurethane/polylactide blends via phase morphology control and incorporation of conductive fillers. Polymer 2017, 114, 28–35. [Google Scholar] [CrossRef]
- Yang, Y.; Feng, C.; Zhou, Y.; Zha, X.; Bao, R.; Ke, K.; Yang, M.; Tan, C.; Yang, W. Achieving improved electromagnetic interference shielding performance and balanced mechanical properties in polyketone nanocomposites via a composite MWCNTs carrier. Compos. Part A: Appl. Sci. Manuf. 2020, 136, 105967. [Google Scholar] [CrossRef]
- Ellingford, C.; Smith, H.; Yan, X.; Bowen, C.; Figiel, Ł.; McNally, T.; Wan, C. Electrical dual-percolation in MWCNTs/SBS/PVDF based thermoplastic elastomer (TPE) composites and the effect of mechanical stretching. Eur. Polym. J. 2019, 112, 504–514. [Google Scholar] [CrossRef]
- Bizhani, H.; Nayyeri, V.; Katbab, A.; Jalali-Arani, A.; Nazockdast, H. Double percolated MWCNTs loaded PC/SAN nanocomposites as an absorbing electromagnetic shield. Eur. Polym. J. 2018, 100, 209–218. [Google Scholar] [CrossRef]
- Soares, B.G.; Calheiros, L.F.; Silva, A.A.; Indrusiak, T.; Barra, G.M.; Livi, S. Conducting melt blending of polystyrene and EVA copolymer with carbon nanotube assisted by phosphonium-based ionic liquid. J. Appl. Polym. Sci. 2018, 135, 45564. [Google Scholar] [CrossRef]
- Soares, B.G.; Cordeiro, E.; Maia, J.; Pereira, E.C.; Silva, A.A. The effect of the noncovalent functionalization of CNT by ionic liquid on electrical conductivity and electromagnetic interference shielding effectiveness of semi-biodegradable polypropylene/poly (lactic acid) composites. Polym. Compos. 2020, 41, 82–93. [Google Scholar] [CrossRef]
- Kar, G.P.; Biswas, S.; Rohini, R.; Bose, S. Tailoring the dispersion of multiwall carbon nanotubes in co-continuous PVDF/ABS blends to design materials with enhanced electromagnetic interference shielding. J. Mater. Chem. A 2015, 3, 7974–7985. [Google Scholar] [CrossRef] [Green Version]
- Kuester, S.; Demarquette, N.R.; Ferreira, J.C., Jr.; Soares, B.G.; Barra, G.M. Hybrid nanocomposites of thermoplastic elastomer and carbon nanoadditives for electromagnetic shielding. Eur. Polym. J. 2017, 88, 328–339. [Google Scholar] [CrossRef]
- Kurusu, R.S.; Helal, E.; Moghimian, N.; David, E.; Demarquette, N. The role of selectively located commercial graphene nanoplatelets in the electrical properties, morphology, and stability of EVA/LLDPE blends. Macromol. Mater. Eng. 2018, 303, 1800187. [Google Scholar] [CrossRef]
- Lin, Y.; Liu, S.; Chen, S.; Wei, Y.; Dong, X.; Liu, L. A highly stretchable and sensitive strain sensor based on graphene–elastomer composites with a novel double-interconnected network. J. Mater. Chem. C 2016, 4, 6345–6352. [Google Scholar] [CrossRef]
- Zhang, Q.; Zhang, B.-Y.; Guo, Z.-X.; Yu, J. Comparison between the efficiencies of two conductive networks formed in carbon black-filled ternary polymer blends by different hierarchical structures. Polym. Test. 2017, 63, 141–149. [Google Scholar] [CrossRef]
- Sun, X.-R.; Gong, T.; Pu, J.-H.; Bao, R.-Y.; Xie, B.-H.; Yang, M.-B.; Yang, W. Effect of phase coarsening under melt annealing on the electrical performance of polymer composites with a double percolation structure. Phys. Chem. Chem. Phys. 2018, 20, 137–147. [Google Scholar] [CrossRef]
- Soares, B.G.; Touchaleaume, F.; Calheiros, L.F.; Barra, G.M. Effect of double percolation on the electrical properties and electromagnetic interference shielding effectiveness of carbon-black-loaded polystyrene/ethylene vinyl acetate copolymer blends. J. Appl. Polym. Sci. 2016, 133. [Google Scholar] [CrossRef]
- Scherzer, S.L.; Pavlova, E.; Esper, J.D.; Starý, Z. Phase structure, rheology and electrical conductivity of co-continuous polystyrene/polymethylmethacrylate blends filled with carbon black. Compos. Sci. Technol. 2015, 119, 138–147. [Google Scholar] [CrossRef]
- Qi, X.; Xiu, H.; Wei, Y.; Zhou, Y.; Guo, Y.; Huang, R.; Bai, H.; Fu, Q. Enhanced shape memory property of polylactide/thermoplastic poly (ether) urethane composites via carbon black self-networking induced co-continuous structure. Compos. Sci. Technol. 2017, 139, 8–16. [Google Scholar] [CrossRef]
- Pan, Y.; Liu, X.; Hao, X.; Starý, Z.; Schubert, D.W. Enhancing the electrical conductivity of carbon black-filled immiscible polymer blends by tuning the morphology. Eur. Polym. J. 2016, 78, 106–115. [Google Scholar] [CrossRef]
- Luo, Y.; Xiong, S.Y.; Zhang, F.; He, X.X.; Lu, X.; Peng, R.T. Preparation of conductive polylactic acid/high density polyethylene/carbon black composites with low percolation threshold by locating the carbon black at the Interface of co-continuous blends. J. Appl. Polym. Sci. 2021, 138, 50291. [Google Scholar] [CrossRef]
- Gong, T.; Peng, S.-P.; Bao, R.-Y.; Yang, W.; Xie, B.-H.; Yang, M.-B. Low percolation threshold and balanced electrical and mechanical performances in polypropylene/carbon black composites with a continuous segregated structure. Compos. Part B: Eng. 2016, 99, 348–357. [Google Scholar] [CrossRef]
- Gao, C.; Zhang, S.; Lin, Y.; Li, F.; Guan, S.; Jiang, Z. High-performance conductive materials based on the selective location of carbon black in poly (ether ether ketone)/polyimide matrix. Compos. Part B: Eng. 2015, 79, 124–131. [Google Scholar] [CrossRef]
- Chen, J.; Cui, X.; Sui, K.; Zhu, Y.; Jiang, W. Balance the electrical properties and mechanical properties of carbon black filled immiscible polymer blends with a double percolation structure. Compos. Sci. Technol. 2017, 140, 99–105. [Google Scholar] [CrossRef]
- Calberg, C.; Blacher, S.; Gubbels, F.; Brouers, F.; Deltour, R.; Jérôme, R. Electrical and dielectric properties of carbon black filled co-continuous two-phase polymer blends. J. Phys. D: Appl. Phys. 1999, 32, 1517. [Google Scholar] [CrossRef]
- Bose, S.; Bhattacharyya, A.R.; Kulkarni, A.R.; Pötschke, P. Electrical, rheological and morphological studies in co-continuous blends of polyamide 6 and acrylonitrile–butadiene–styrene with multiwall carbon nanotubes prepared by melt blending. Compos. Sci. Technol. 2009, 69, 365–372. [Google Scholar] [CrossRef]
- Chen, J.; Cui, X.; Zhu, Y.; Jiang, W.; Sui, K. Design of superior conductive polymer composite with precisely controlling carbon nanotubes at the interface of a co-continuous polymer blend via a balance of π-π interactions and dipole-dipole interactions. Carbon 2017, 114, 441–448. [Google Scholar] [CrossRef]
- Otero-Navas, I.; Arjmand, M.; Sundararaj, U. Carbon nanotube induced double percolation in polymer blends: Morphology, rheology and broadband dielectric properties. Polymer 2017, 114, 122–134. [Google Scholar] [CrossRef]
- Roman, C.; García-Morales, M.; Gupta, J.; McNally, T. On the phase affinity of multi-walled carbon nanotubes in PMMA: LDPE immiscible polymer blends. Polymer 2017, 118, 1–11. [Google Scholar] [CrossRef] [Green Version]
- Soares da Silva, J.P.; Soares, B.G.; Silva, A.A.; Livi, S. Double Percolation of Melt-Mixed PS/PBAT Blends Loaded With Carbon Nanotube: Effect of Molding Temperature and the Non-covalent Functionalization of the Filler by Ionic Liquid. Front. Mater. 2019, 6, 191. [Google Scholar] [CrossRef] [Green Version]
- Bai, L.; He, S.; Fruehwirth, J.W.; Stein, A.; Macosko, C.W.; Cheng, X. Localizing graphene at the interface of cocontinuous polymer blends: Morphology, rheology, and conductivity of cocontinuous conductive polymer composites. J. Rheol. 2017, 61, 575–587. [Google Scholar] [CrossRef]
- Bai, L.; Sharma, R.; Cheng, X.; Macosko, C.W. Kinetic control of graphene localization in co-continuous polymer blends via melt compounding. Langmuir 2018, 34, 1073–1083. [Google Scholar] [CrossRef]
- Helal, E.; Kurusu, R.S.; Moghimian, N.; Gutierrez, G.; David, E.; Demarquette, N.R. Correlation between morphology, rheological behavior, and electrical behavior of conductive cocontinuous LLDPE/EVA blends containing commercial graphene nanoplatelets. J. Rheol. 2019, 63, 961–976. [Google Scholar] [CrossRef]
- Lan, Y.; Liu, H.; Cao, X.; Zhao, S.; Dai, K.; Yan, X.; Zheng, G.; Liu, C.; Shen, C.; Guo, Z. Electrically conductive thermoplastic polyurethane/polypropylene nanocomposites with selectively distributed graphene. Polymer 2016, 97, 11–19. [Google Scholar] [CrossRef]
- Mao, C.; Zhu, Y.; Jiang, W. Design of electrical conductive composites: Tuning the morphology to improve the electrical properties of graphene filled immiscible polymer blends. ACS Appl. Mater. Interfaces 2012, 4, 5281–5286. [Google Scholar] [CrossRef]
- Rafeie, O.; Razavi Aghjeh, M.; Tavakoli, A.; Salami Kalajahi, M.; Jameie Oskooie, A. Conductive poly (vinylidene fluoride)/polyethylene/graphene blend-nanocomposites: Relationship between rheology, morphology, and electrical conductivity. J. Appl. Polym. Sci. 2018, 135, 46333. [Google Scholar] [CrossRef]
- Mun, S.C.; Kim, M.J.; Cobos, M.; Gu, L.; Macosko, C.W. Strategies for interfacial localization of graphene/polyethylene-based cocontinuous blends for electrical percolation. AIChE J. 2019, 65, e16579. [Google Scholar] [CrossRef]
- Sadeghi, A.; Moeini, R.; Yeganeh, J.K. Highly conductive PP/PET polymer blends with high electromagnetic interference shielding performances in the presence of thermally reduced graphene nanosheets prepared through melt compounding. Polym. Compos. 2019, 40, E1461–E1469. [Google Scholar] [CrossRef]
- Shen, Y.; Zhang, T.T.; Yang, J.H.; Zhang, N.; Huang, T.; Wang, Y. Selective localization of reduced graphene oxides at the interface of PLA/EVA blend and its resultant electrical resistivity. Polym. Compos. 2017, 38, 1982–1991. [Google Scholar] [CrossRef]
- Bruggeman, V.D. Berechnung verschiedener physikalischer Konstanten von heterogenen Substanzen. I. Dielektrizitätskonstanten und Leitfähigkeiten der Mischkörper aus isotropen Substanzen. Ann. Phys. 1935, 416, 636–664. [Google Scholar] [CrossRef]
- Böttcher, C. The dielectric constant of crystalline powders. Recl. Trav. Chim. Pays-Bas 1945, 64, 47–51. [Google Scholar] [CrossRef]
- Huang, J.; Mao, C.; Zhu, Y.; Jiang, W.; Yang, X. Control of carbon nanotubes at the interface of a co-continuous immiscible polymer blend to fabricate conductive composites with ultralow percolation thresholds. Carbon 2014, 73, 267–274. [Google Scholar] [CrossRef]
- Chen, J.; Shen, Y.; Yang, J.-H.; Zhang, N.; Huang, T.; Wang, Y.; Zhou, Z.-W. Trapping carbon nanotubes at the interface of a polymer blend through adding graphene oxide: A facile strategy to reduce electrical resistivity. J. Mater. Chem. C 2013, 1, 7808–7811. [Google Scholar] [CrossRef]
- Nasti, G.; Gentile, G.; Cerruti, P.; Carfagna, C.; Ambrogi, V. Double percolation of multiwalled carbon nanotubes in polystyrene/polylactic acid blends. Polymer 2016, 99, 193–203. [Google Scholar] [CrossRef]
- Xu, Z.; Zhang, Y.; Wang, Z.; Sun, N.; Li, H. Enhancement of electrical conductivity by changing phase morphology for composites consisting of polylactide and poly (ε-caprolactone) filled with acid-oxidized multiwalled carbon nanotubes. ACS Appl. Mater. Interfaces 2011, 3, 4858–4864. [Google Scholar] [CrossRef] [PubMed]
- Chen, J.; Hou, Y.B.; Zhang, M.L.; Liu, D.; Yang, J.H.; Wang, Y.; Zhou, Z.W.; Yuan, G.P. Combined effect of compatibilizer and carbon nanotubes on the morphology and electrical conductivity of PP/PS blend. Polym. Adv. Technol. 2014, 25, 624–630. [Google Scholar] [CrossRef]
- Pötschke, P.; Kretzschmar, B.; Janke, A. Use of carbon nanotube filled polycarbonate in blends with montmorillonite filled polypropylene. Compos. Sci. Technol. 2007, 67, 855–860. [Google Scholar] [CrossRef]
- Chen, J.; Lu, H.-Y.; Yang, J.-H.; Wang, Y.; Zheng, X.-T.; Zhang, C.-L.; Yuan, G.-P. Effect of organoclay on morphology and electrical conductivity of PC/PVDF/CNT blend composites. Compos. Sci. Technol. 2014, 94, 30–38. [Google Scholar] [CrossRef]
- Chen, J.; Du, X.-C.; Zhang, W.-B.; Yang, J.-H.; Zhang, N.; Huang, T.; Wang, Y. Synergistic effect of carbon nanotubes and carbon black on electrical conductivity of PA6/ABS blend. Compos. Sci. Technol. 2013, 81, 1–8. [Google Scholar] [CrossRef]
- Zhang, H.; Chen, J.; Cui, X.; Hu, Y.; Lei, L.; Zhu, Y.; Jiang, W. Thermal annealing induced enhancement of electrical properties of a co-continuous polymer blend filled with carbon nanotubes. Compos. Sci. Technol. 2018, 167, 522–528. [Google Scholar] [CrossRef]
- Chen, Y.; Yang, Q.; Huang, Y.; Liao, X.; Niu, Y. Influence of phase coarsening and filler agglomeration on electrical and rheological properties of MWNTs-filled PP/PMMA composites under annealing. Polymer 2015, 79, 159–170. [Google Scholar] [CrossRef]
- Bharati, A.; Cardinaels, R.; Seo, J.W.; Wübbenhorst, M.; Moldenaers, P. Enhancing the conductivity of carbon nanotube filled blends by tuning their phase separated morphology with a copolymer. Polymer 2015, 79, 271–282. [Google Scholar] [CrossRef]
- Fang, D.; Zhou, C.; Liu, G.; Luo, G.; Gong, P.; Yang, Q.; Niu, Y.; Li, G. Effects of ionic liquids and thermal annealing on the rheological behavior and electrical properties of poly (methyl methacrylate)/carbon nanotubes composites. Polymer 2018, 148, 68–78. [Google Scholar] [CrossRef]
- Palza, H.; Garzón, C.; Arias, O. Modifying the electrical behaviour of polypropylene/carbon nanotube composites by adding a second nanoparticle and by annealing processes. Express Polym. Lett. 2012, 6, 639–646. [Google Scholar] [CrossRef] [Green Version]
- Wang, J.; Kazemi, Y.; Wang, S.; Hamidinejad, M.; Mahmud, M.B.; Pötschke, P.; Park, C.B. Enhancing the electrical conductivity of PP/CNT nanocomposites through crystal-induced volume exclusion effect with a slow cooling rate. Compos. Part B Eng. 2020, 183, 107663. [Google Scholar] [CrossRef]
- Kazemi, Y.; Kakroodi, A.R.; Wang, S.; Ameli, A.; Filleter, T.; Pötschke, P.; Park, C.B. Conductive network formation and destruction in polypropylene/carbon nanotube composites via crystal control using supercritical carbon dioxide. Polymer 2017, 129, 179–188. [Google Scholar] [CrossRef]
- Huang, C.; Bai, H.; Xiu, H.; Zhang, Q.; Fu, Q. Matrix crystallization induced simultaneous enhancement of electrical conductivity and mechanical performance in poly (l-lactide)/multiwalled carbon nanotubes (PLLA/MWCNTs) nanocomposites. Compos. Sci. Technol. 2014, 102, 20–27. [Google Scholar] [CrossRef]
- Quan, H.; Zhang, S.-J.; Qiao, J.-L.; Zhang, L.-Y. The electrical properties and crystallization of stereocomplex poly (lactic acid) filled with carbon nanotubes. Polymer 2012, 53, 4547–4552. [Google Scholar] [CrossRef]
- Li, J.; Peng, W.-J.; Tan, Y.-J.; Weng, Y.-X.; Wang, M. Adjusting Distribution of Multiwall Carbon Nanotubes in Poly (L-lactide)/Poly (oxymethylene) Blends via Constructing Stereocomplex Crystallites: Toward Conductive and Microwave Shielding Enhancement. J. Phys. Chem. C 2019, 123, 27884–27895. [Google Scholar] [CrossRef]
- Liu, Z.; Ling, F.; Diao, X.; Fu, M.; Bai, H.; Zhang, Q.; Fu, Q. Stereocomplex-type polylactide with remarkably enhanced melt-processability and electrical performance via incorporating multifunctional carbon black. Polymer 2020, 188, 122136. [Google Scholar] [CrossRef]
- Zhang, D.; Lin, Y.; Wu, G. Polylactide-based nanocomposites with stereocomplex networks enhanced by GO-g-PDLA. Compos. Sci. Technol. 2017, 138, 57–67. [Google Scholar] [CrossRef]
- Zhang, K.; Yu, H.-O.; Shi, Y.-D.; Chen, Y.-F.; Zeng, J.-B.; Guo, J.; Wang, B.; Guo, Z.; Wang, M. Morphological regulation improved electrical conductivity and electromagnetic interference shielding in poly (L-lactide)/poly (ε-caprolactone)/carbon nanotube nanocomposites via constructing stereocomplex crystallites. J. Mater. Chem. C 2017, 5, 2807–2817. [Google Scholar] [CrossRef]
- Bousmina, M.; Ait-Kadi, A.; Faisant, J. Determination of shear rate and viscosity from batch mixer data. J. Rheol. 1999, 43, 415–433. [Google Scholar] [CrossRef]
- Kohlgrüber, K. Co-Rotating Twin-Screw Extruders-Fundamentals, Technology, and Applications; Carl Hanser Verlag GmbH & Co. KG: Stuttgart, Germany, 2008; Chapter 3; p. 367. [Google Scholar]
- Jordhamo, G.; Manson, J.; Sperling, L. Phase continuity and inversion in polymer blends and simultaneous interpenetrating networks. Polym. Eng. Sci. 1986, 26, 517–524. [Google Scholar] [CrossRef]
- Perrin-Sarazin, F.; Ton-That, M.-T.; Bureau, M.; Denault, J. Micro-and nano-structure in polypropylene/clay nanocomposites. Polymer 2005, 46, 11624–11634. [Google Scholar] [CrossRef] [Green Version]
- Shi, X.; Wang, J.; Jiang, B.; Yang, Y. Influence of nanofiller dimensionality on the crystallization behavior of HDPE/carbon nanocomposites. J. Appl. Polym. Sci. 2013, 128, 3609–3618. [Google Scholar] [CrossRef]


| Parameters | Fast-Cooling Treatment | Isothermal Treatment | Slow-Cooling Treatment |
|---|---|---|---|
| pc, wt.% | 0.28 | 0.08 | 0.06 |
| k, S/m | 8.5 × 10⁻⁴ | 0.12 | 0.15 |
| t | 1.60 | 2.20 | 2.00 |
| R2 | 0.97 | 0.89 | 0.99 |
| System | PT, wt.% | EC at PT, S/m | EC, S/m of PB with 1 wt.% of CNTs | Modification | Reference |
|---|---|---|---|---|---|
| PS/EVA/IL-CNTs (70/30 wt.%) | 0.050 | 10−9 | 5.0 × 10⁻¹ | Modification of MWCNTs with noncovalent ionic liquid | [7] |
| PS/PBAT/IL-CNTs (50/50 wt.%) | 0.050 | 10−6 | 5.0 × 10⁻¹ | Modification of MWCNTs with noncovalent ionic liquid | [28] |
| PS/PMMA/MWCNTs-COOH (40/60 wt.%) | 0.017 | 10−10 | 5.0 × 10⁻² | MWCNTs functionalization with carboxyl groups | [25] |
| PLLA/EVA/GO0.3/CNTs (60/40 wt.%) | 0.060 | 10−9 | 2.0 × 10⁻⁵ | Trapping CNTs at the interface with the help of 0.3 wt.% of GO | [41] |
| PS/PVDF/Clay0.1/CNTs (40/60 wt.%) | 0.060 | 10−9 | 5.0 × 10⁻⁵ | Trapping CNTs at the interface with the help of 0.1 wt.% of organoclay | [46] |
| PLA/PCL/MWCNTs (50/50 wt.%) | 0.025 | 10−9 | 2.0 × 10⁻⁴ | Adjustment of melt-mixing time | [40] |
| PP/PMMA/MWCNT (30/70 wt.%) | 0.090 | 10−7 | 2.0 × 10⁻¹ | 2 h of annealing at 200 °C | [49] |
| PP/PS/MWCNTs (50/50 wt.%) | 0.060 | 10−6 | 5.6 × 10⁻¹ | Slow-cooling treatment (takes 50 min) | Our work |
| PP/PS/MWCNTs (50/50 wt.%) | 0.080 | 10−5 | 5.1 × 10⁻¹ | Isothermal treatment (takes 15 min) | Our work |
Publisher’s Note: MDPI stays neutral with regard to jurisdictional claims in published maps and institutional affiliations. |
© 2021 by the authors. Licensee MDPI, Basel, Switzerland. This article is an open access article distributed under the terms and conditions of the Creative Commons Attribution (CC BY) license (https://creativecommons.org/licenses/by/4.0/).
Share and Cite
Strugova, D.; Ferreira Junior, J.C.; David, É.; Demarquette, N.R. Ultra-Low Percolation Threshold Induced by Thermal Treatments in Co-Continuous Blend-Based PP/PS/MWCNTs Nanocomposites. Nanomaterials 2021, 11, 1620. https://doi.org/10.3390/nano11061620
Strugova D, Ferreira Junior JC, David É, Demarquette NR. Ultra-Low Percolation Threshold Induced by Thermal Treatments in Co-Continuous Blend-Based PP/PS/MWCNTs Nanocomposites. Nanomaterials. 2021; 11(6):1620. https://doi.org/10.3390/nano11061620
Chicago/Turabian StyleStrugova, Daria, José Carlos Ferreira Junior, Éric David, and Nicole R. Demarquette. 2021. "Ultra-Low Percolation Threshold Induced by Thermal Treatments in Co-Continuous Blend-Based PP/PS/MWCNTs Nanocomposites" Nanomaterials 11, no. 6: 1620. https://doi.org/10.3390/nano11061620