Article

Introduction of Rare-Earth Oxide Nanoparticles in CNT-Based Nanocomposites for Improved Detection of Underlying CNT Network

1
Mechanical and Aerospace Engineering Department, Naval Postgraduate School, Monterey, CA 93943, USA
2
Materials Science and Engineering Department, University of Connecticut, Storrs, CT 06269, USA
3
School of Mechanical Engineering, Purdue University, West Lafayette, IN 47907, USA
*
Author to whom correspondence should be addressed.
Nanomaterials 2021, 11(9), 2168; https://doi.org/10.3390/nano11092168
Submission received: 31 July 2021 / Revised: 16 August 2021 / Accepted: 17 August 2021 / Published: 25 August 2021
(This article belongs to the Special Issue Carbon-Based Nanocomposites)

Abstract

:
Epoxy resins for adhesive and structural applications are widely employed by various industries. The introduction of high aspect ratio nanometric conductive fillers, i.e., carbon nanotubes, are well studied and are known to improve the electrical properties of the bulk material by orders of magnitude. This improved electrical conductivity has made carbon nanotube-based nanocomposites an attractive material for applications where their weight savings are at a premium. However, the analytical methods for validating carbon nanotube (CNT) nanofiller dispersion and for assuring that the properties they induce extend to the entire volume are destructive and inhibited by poor resolution between matrix and tube bundles. Herein, rare-earth oxide nanoparticles are synthesized on CNT walls for the purpose of increasing the contrast between their network and the surrounding matrix when studied by imaging techniques, alleviating these issues. The adherence of the synthesized nanoparticles to the CNT walls is documented via transmission electron microscopy. The crystalline phases generated during the various fabrication steps are determined using X-ray diffraction. Deep ultraviolet-induced fluorescence of the Eu:Y2O3-CNT nanostructures is verified. The impacts to nanocomposite electrical properties resulting from dopant introduction are characterized. The scanning electron microscopy imaging of CNT pulp and nanocomposites fabricated from untreated CNTs and Eu:Y2O3-CNTs are compared, resulting in improved contrast and detection of CNT bundles. The micro-CT scans of composites with similar results are presented for discussion.

1. Introduction

Nanoscale composites utilizing carbon nanotube (CNT) filler allow for significant reductions in resistivity of an otherwise highly insulating matrix material while requiring extremely low CNT loadings [1]. These improved conductivities result in an attractive material with extensive applications in diverse industries, but particularly for electrostatic discharge (ESD) and electromagnetic interference (EMI) prevention [2,3,4,5,6,7,8,9,10,11]. These enhancements are heavily dependent on nanofiller dispersion in the matrix material. Dispersion control becomes essential to ensuring uniform properties throughout the composite and eliminating hotspots that could affect reliability or performance.
Validation of uniform dispersion is difficult due to minimal contrast differences between CNTs and the surrounding matrix, making conventional imaging techniques difficult. Existing high-resolution methods include thermography in the infrared (IR) range [12] and voltage-contrast imaging with scanning electron microscopy (SEM) [13,14,15,16,17,18]. Both have been used to understand dispersion and nanostructures but are limited by the processing time and low fields-of-view. Thermography techniques are depth limited as the subsurface information is extrapolated.
Nondestructive evaluation (NDE) techniques that make the differences in the dispersion of the nanofiller or the porosity of the surrounding matrix readily apparent would be useful as the industrial use of these composites increases. This work aimed to improve the contrast of the CNT network through the addition of rare-earth oxides, specifically europium doped yttria, to the CNT surface. Europium doped yttria has been found to emit red light under stimulation by deep ultraviolet (DUV) wavelengths [19,20]. Since its discovery, Eu:Y2O3 has become a common red phosphor material due its narrow emission peak, easy stimulation under DUV radiation, and high quantum efficiency [21,22,23,24]. Efforts to exploit the demonstrated luminescence for increased visibility in bioimaging have been explored through the use of Eu:Y2O3 nanorods [25] and nanoparticles incorporated into CNT cavities [26]. Coincidently, rare-earth elements are heavier than those present in a conventional CNT composite, e.g., iron, carbon, and polymer chains. These heavier elements facilitate the compositional contrast through backscatter electron production in SEM imaging. By colocating Eu:Y2O3 nanoparticles and CNTs (hereafter Eu:Y2O3-CNT), the detection of red-emissions or the detection of heavy elements, yttrium and europium, can reveal the location of an underlying CNT network and make bulk dispersion determinations of the CNT filler easier to visualize and at greater depths.

2. Materials and Methods

2.1. Materials

The CNT pulp that served as substrate for the Eu:Y2O3 nanoparticle synthesis, and for the epoxy composite fabrication, was a multiwall carbon nanotube (MWCNT) product provided by Nanocomp Technologies Inc. (Huntsman Corporation, Merrimack, NH, USA). This nanofiller is produced as CNT sheets via a chemical vapor deposition (CVD) process facilitated by an iron (Fe) catalyst and subsequently reduced to a pulp by employing a Hollander Beater and industrial burr [27]. The pulp consists of MWCNT bundles approximately 0.05 mm in diameter and 1 mm in length with individual CNT diameter in the order of 30 nm. The pulp used throughout this research comes from a single production run (Lot C) and is contrasted later with CNTs from past batches (Lot A,B).
Yttrium (III) and europium (III) nitrate hexahydrate obtained from Sigma Aldrich (St. Louis, MO, USA) with a purity of 99.8% and 99.99% respectively, were used as precursors and dissolved in a >99.5% pure ethanol also obtained from Sigma Aldrich (St. Louis, MO, USA).

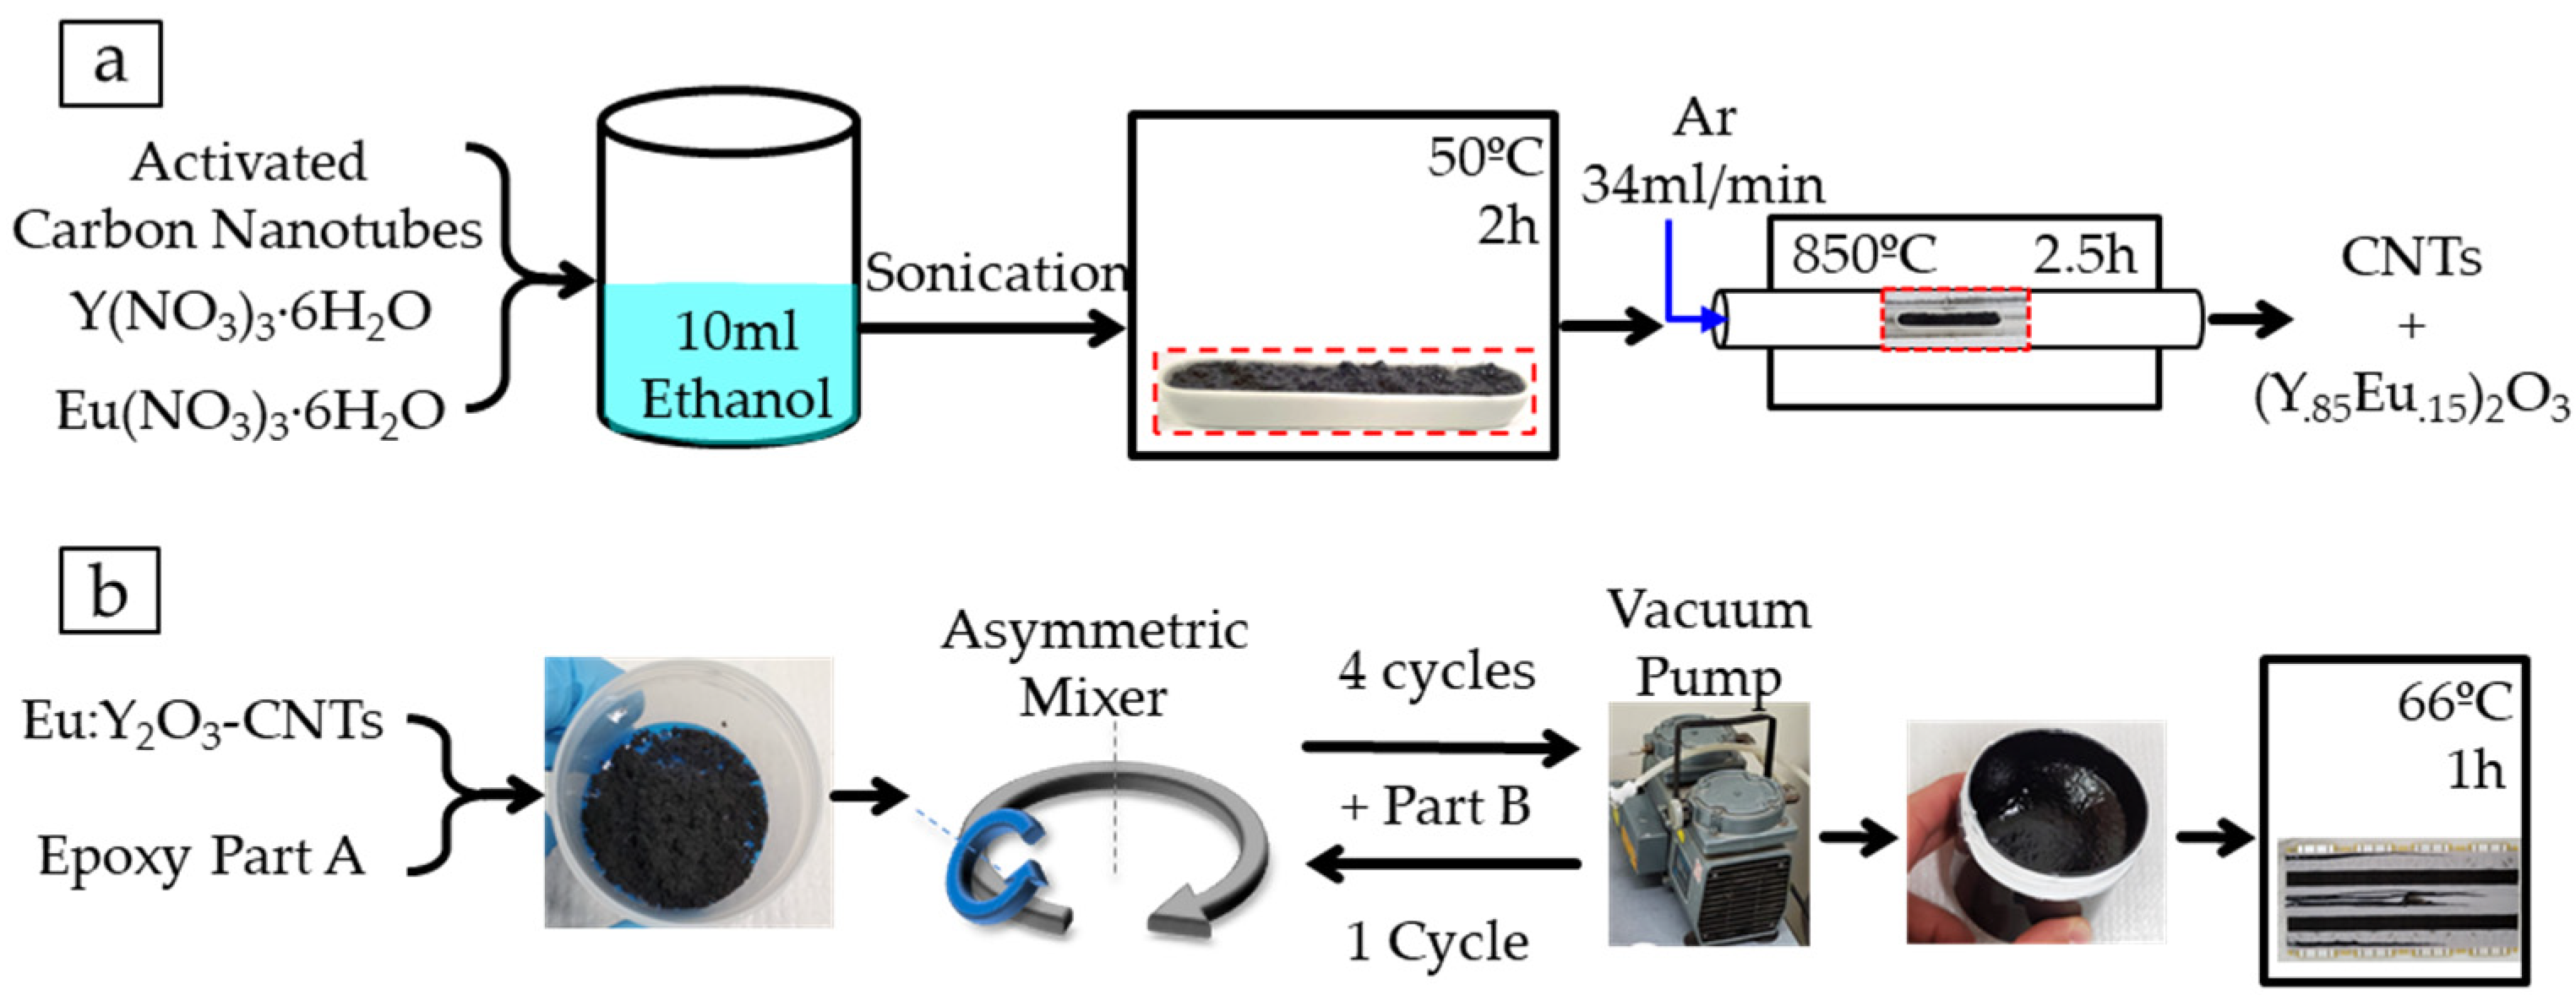
2.2. Carbon Nanotube Preparation and Eu:Y2O3 Nanoparticle Synthesis

Sample generation consisted of a three-step process where CNTs were (1) activated, (2) Eu:Y2O3 synthesized along tube walls, and (3) the resulting pulp dispersed into an epoxy matrix to form the nanocomposite.
The CNT pulp was first activated to facilitate the nucleation of rare-earth oxides at activation sites. CNTs were placed in an alumina boat and thermally activated by heating them to 500 °C in a tube furnace (Thermo Scientific Lindberg/Blue M model TF55035A-1, Waltham, MA, USA) for either 1, 2, or 2.5 h in an air atmosphere. The europium and yttrium nitrates were mixed into the activated CNT bundles via wet impregnation aided by the sonication technique illustrated in Figure 1a. Yttrium (III) and europium (III) nitrate hexahydrate and the activated CNT pulp were weighed to achieve europium substitution within the Y2O3 with a targeted stoichiometry of (Y0.85Eu0.15)2O3 and a 5%wt of Eu:Y2O3 in the CNT pulp. The nitrates were dissolved in 10 mL of ethanol and the resulting solution poured over the CNT pulp and agitated in an ultrasonic bath for several seconds. The saturated CNT bundles were dried at 50 °C for 2 h in a convection oven (Binder GmbH, Tuttlingen, Germany). Once dried, the remaining pulp and the alumina boat were placed in the tube furnace and purged with argon for 30 min. The mixture was calcinated in an ultrahigh purity Ar atmosphere for 2.5 h at 850 °C. The pulp was allowed to cool to room temperature over ~3 h under Ar.

2.3. Nanocomposite Fabrication

The nanocomposites used throughout this study were synthesized using the CNT pulp described in Section 2.1 and a two-part aerospace-grade epoxy matrix, Loctite Hysol EA 9396 (Henkel Corporation, Dusseldorf, Germany). The two-part epoxy was employed at a ratio of 100:30 by weight (part A:part B). All samples were cured at 66 °C for 1 h. The base epoxy mixture had a reported electrical resistivity of 2.14 × 10¹⁵ Ohm-cm, tensile strength of 35.2 MPa, and lap shear strength of 27.6 MPa at 25 °C [28].
The CNT dispersion and electrical board fabrication is illustrated in Figure 1b. The epoxy and CNTs were weighed to generate the desired loading (0.75%wt) and then dispersed by mixing in a FlackTek asymmetric speed mixer (Landrum, SC, USA). The mixer was operated for 3 min at lower speeds followed by three 1 min higher-speed cycles with Part B added before the final cycle. A vacuum pump was used to evacuate the air from the hermetic vessel where the samples were contained (low vacuum range) throughout the mixing process. The mixture was then applied to prefabricated electrical boards and, separately, poured into molds for curing. A convection oven (Binder GmbH, Tuttlingen, Germany) was used for the 66 °C curing process.

2.4. Thermo-Gravimetric Analysis

Untreated CNT pulp was analyzed in a simultaneous thermal analyzer (STA) 449 Jupiter F1 (Netzsch GmbH & Co. Holding KG, Selb, Germany) to determine initial iron catalyst content. Data was collected during a temperature-programmed oxidation, heating the CNTs under a 20% O2 80% N2 environment analogous to sea-level atmosphere composition, at a rate of 15 °C/min from room temperature to 850 °C.

2.5. Material Characterization and Imaging

A benchtop powder X-ray diffraction (XRD) Rigaku Miniflex 600 (Woodlands, TX, USA) with a Cu-Source was used to determine crystalline phases throughout the process of activation and Eu:Y2O3 inclusion.
An optical metallurgical microscope Nikon Epiphot 200 (Melville, NY, USA) was employed for low magnification observation of the CNT dispersions within the epoxy matrix.
A Zeiss Neon 40 (Zeiss, Oberkochen, Germany) Dual Beam SEM operating from 2 to 20 KV was utilized to investigate microstructural features of untreated CNT and Eu:Y2O3-CNT bundles and the resulting CNT epoxy composites. Secondary electron (SE) and backscattered electron (BSE) images were collected.
High-resolution transmission electron microscopy (HRTEM) images were acquired using a FEI Tecnai Osiris TEM (Hillsboro, OR, USA). TEM bright-field images were captured with an accelerating voltage of 200 kV, a second condenser aperture of 50 µm, and an objective aperture of 40 µm. Scanning TEM (STEM) was used in conjunction with a high angle annular dark-field (HAADF) detector for energy dispersive X-ray (EDX) spectroscopy studies, the TEM’s coupled Super-X system.
Micro-computed tomography (micro-CT) was utilized on two composite samples to determine if improvements in network detection were possible with Eu:Y2O3-CNT samples. The analysis was performed with a Zeiss Xradia 520 Versa (Zeiss, Oberkochen, Germany). Scan parameters were 100 kV source voltage, 9 W power, and 10× optical magnification. The source and detector distances were adjusted to achieve a voxel size of approximately 0.7 µm3 and 1601 projections through 360 degrees were collected with an exposure time of 1 s. Three-dimensional (3D) tomograms were rendered using tomviz freeware [29].

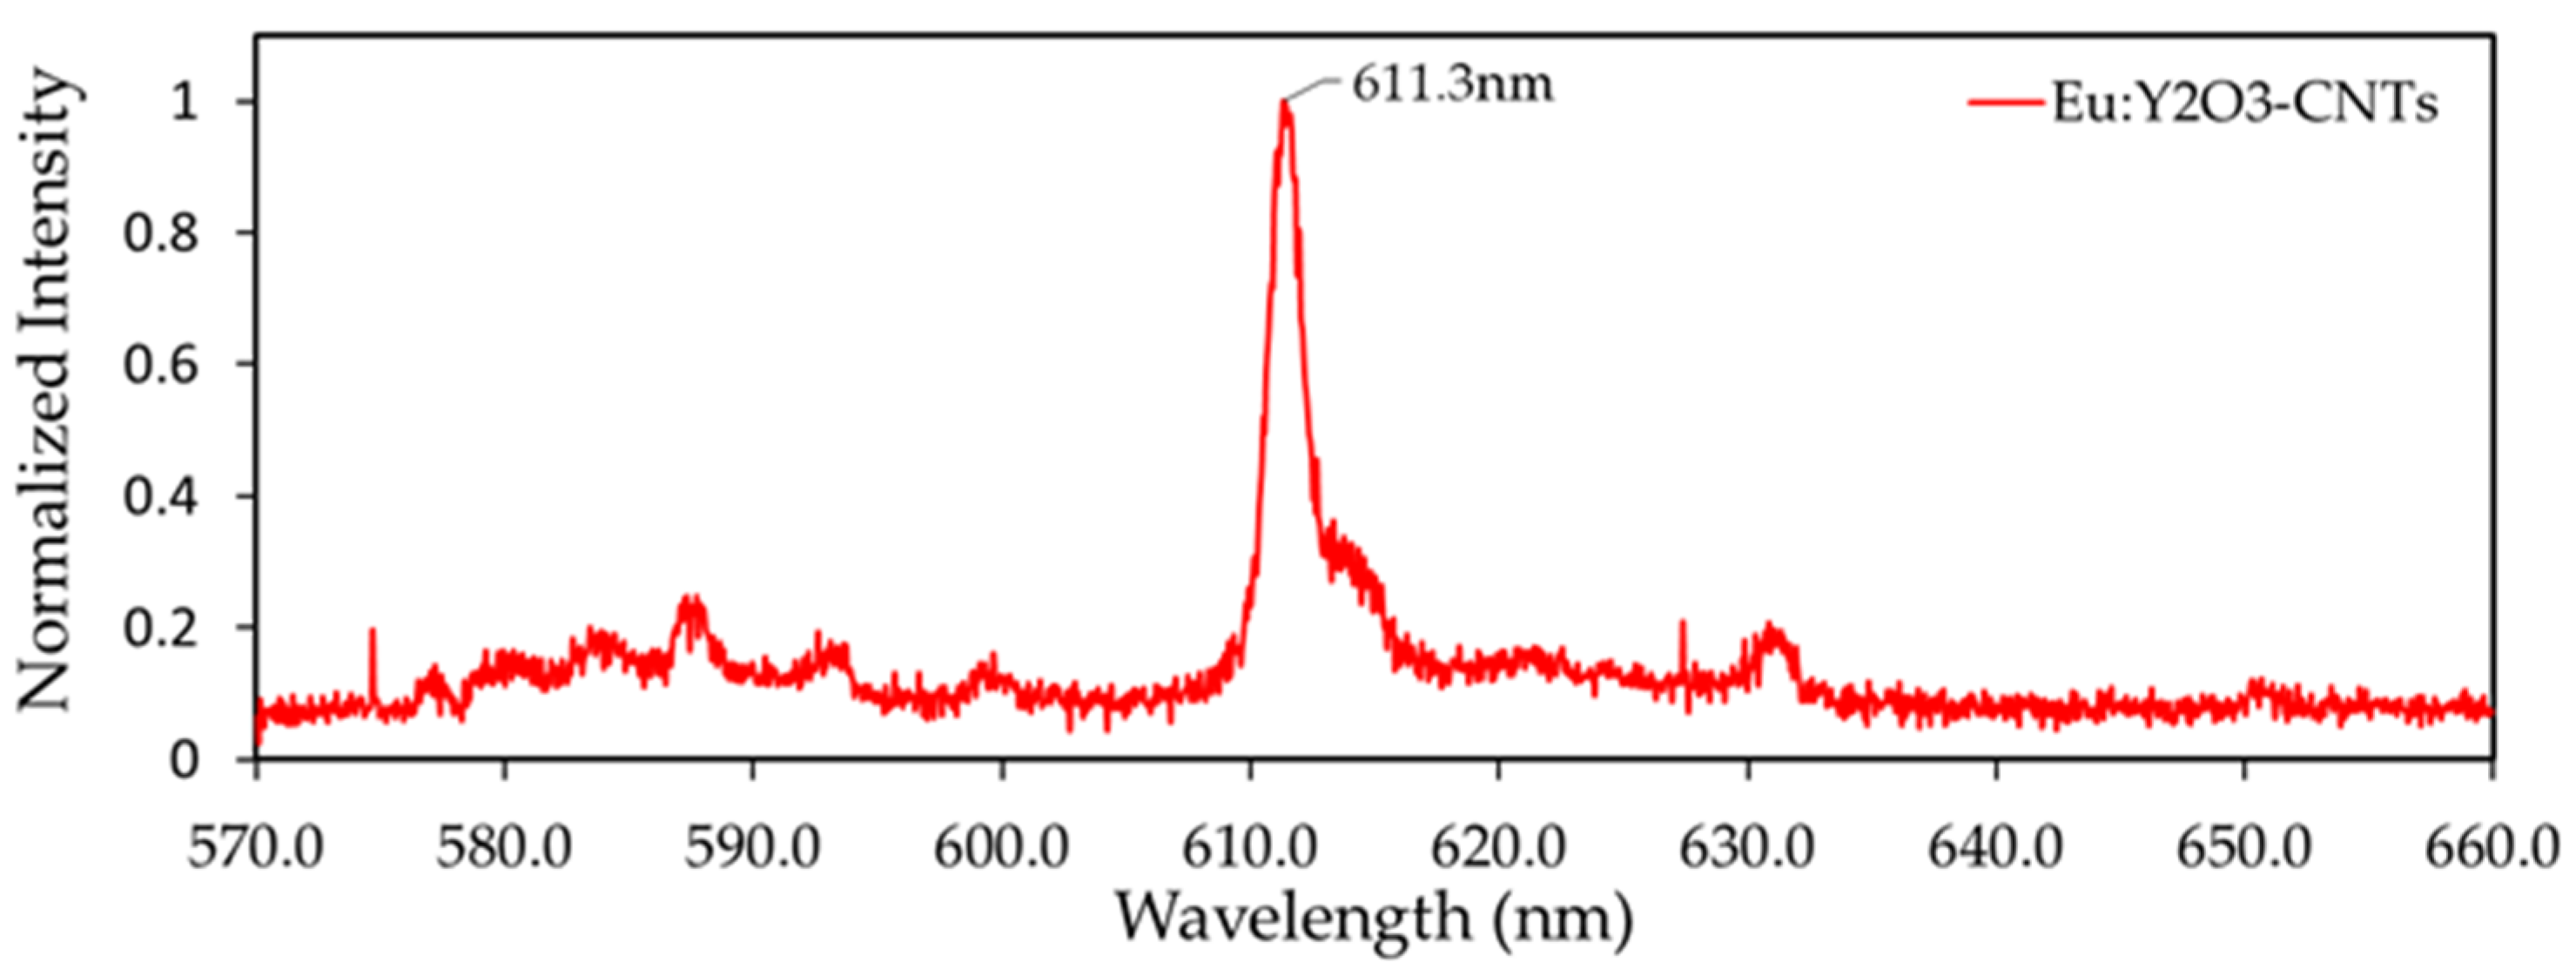
2.6. Deep Ultraviolet Fluorescence

Photoluminescence measurements of Eu:Y2O3-CNT composite samples were conducted using a LabRAM HR Raman Microscope (Horiba Scientific, Kyoto, Japan). A deep ultraviolet (DUV) source with an emission wavelength of 229 nm was used with a 600 gr/nm grating. Source power was limited to 100 µW due to sample degradation resulting in broadening of spectra peaks at higher intensities.

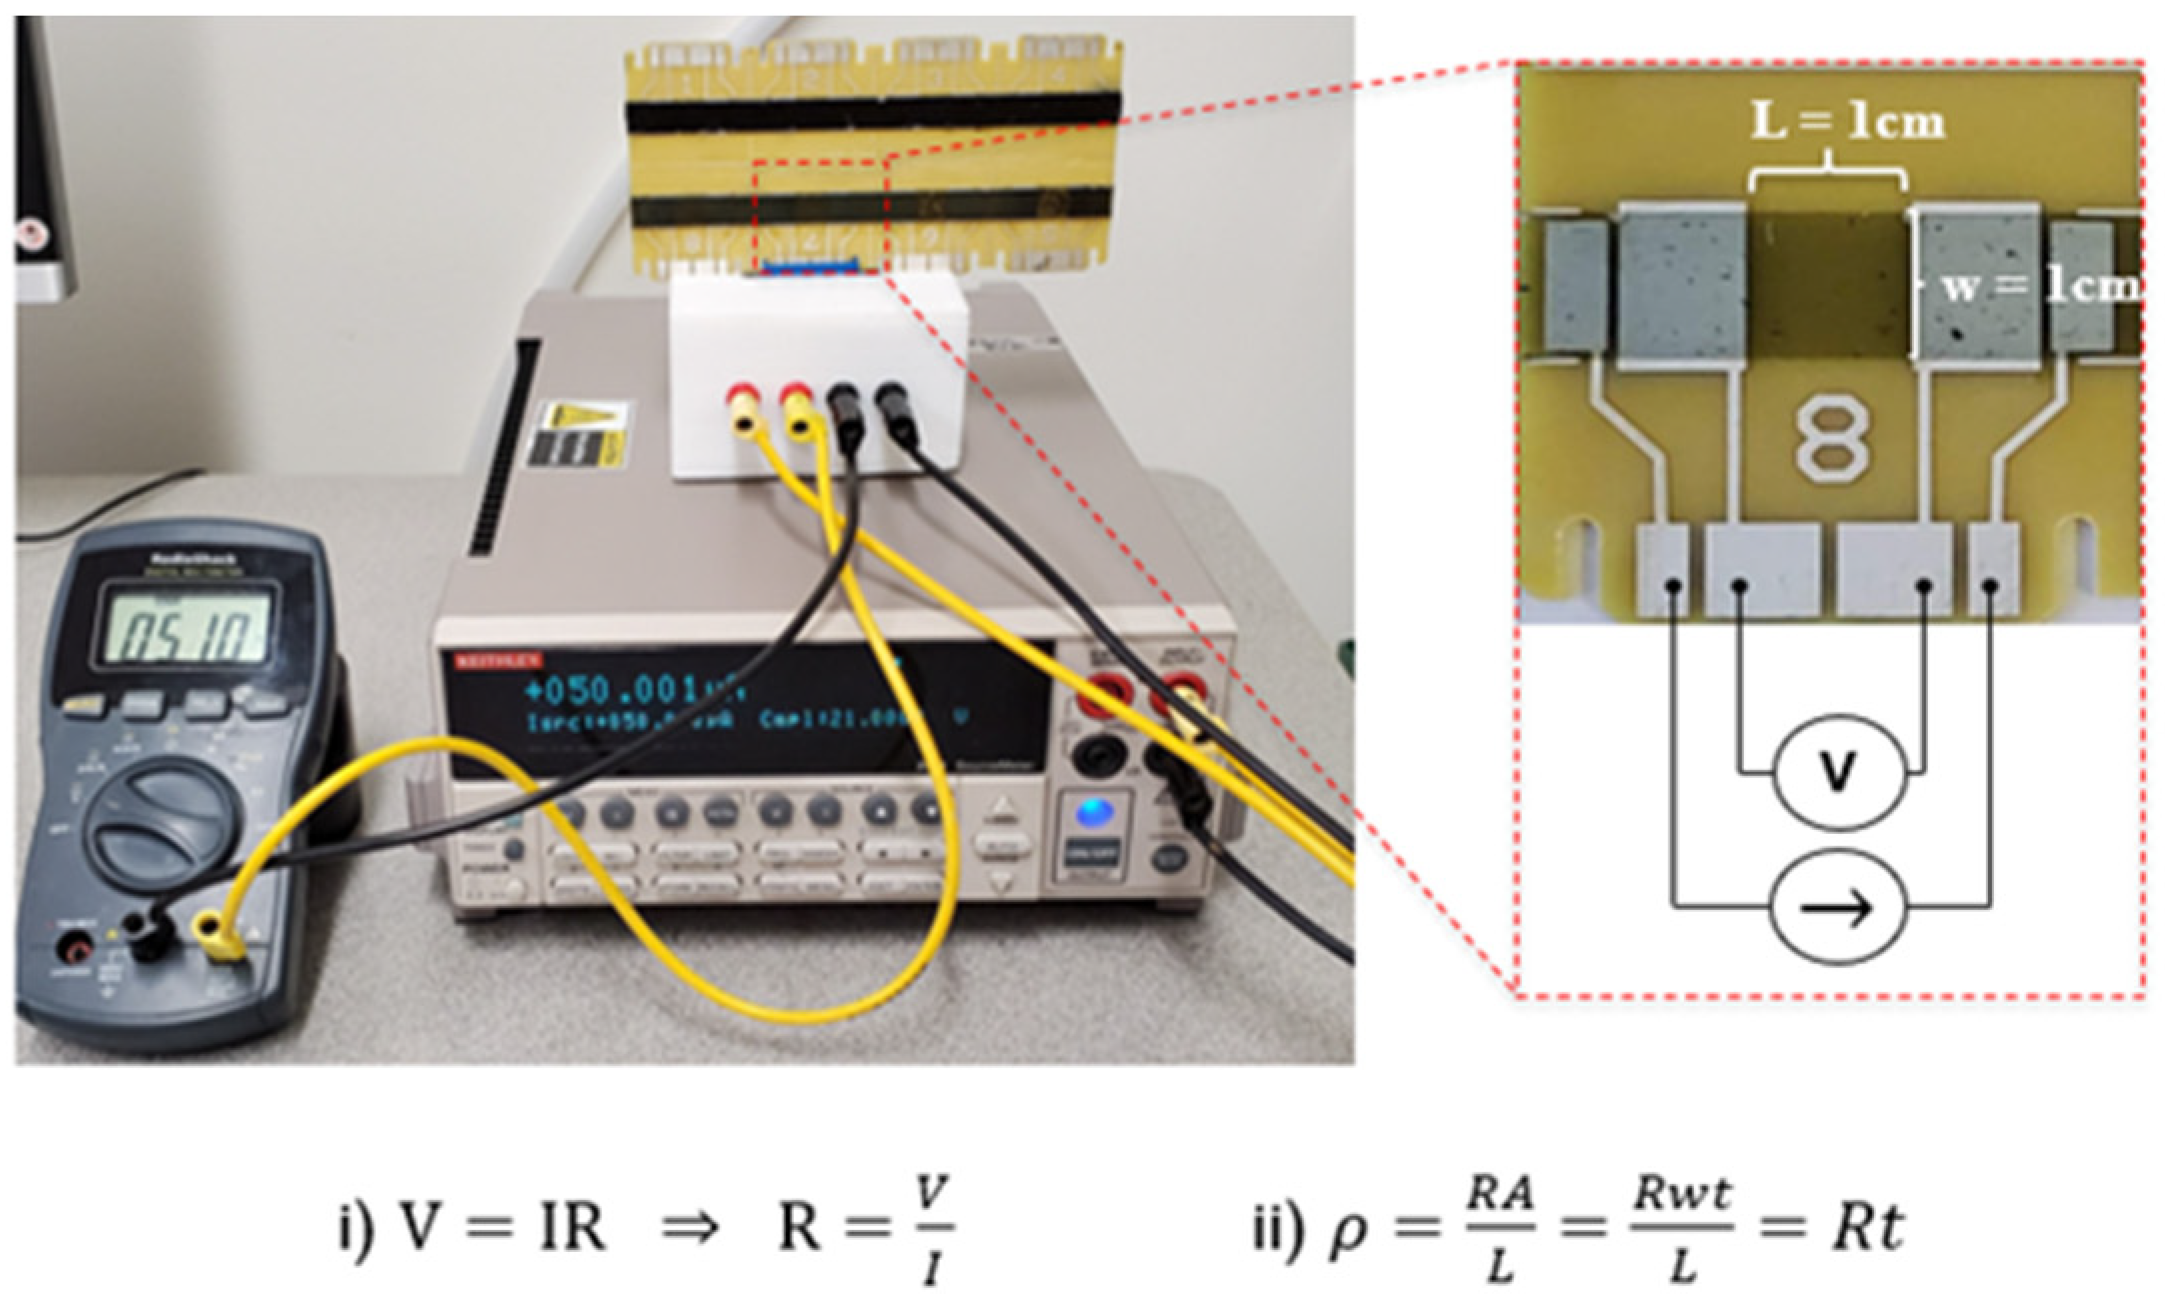
2.7. Conductivity Characterization

All electrical measurements were done by analyzing the prefabricated eight-point circuit boards with a 2400 Keithley source meter (Tektronix, Inc., Beaverton, OR, USA) operating as a current source and can be seen in Figure 2. A separate digital multimeter (DMM) was used to measure the voltage drop across the 1 cm wide epoxy section. One spot location was sectioned, and the thickness was measured via a Nikon Epiphot 200 reflective optical microscope (Nikon, Tokyo, Japan) to determine an average film thickness. The electrical resistivity was then derived using Equation (ii) in Figure 2.

3. Results and Discussion

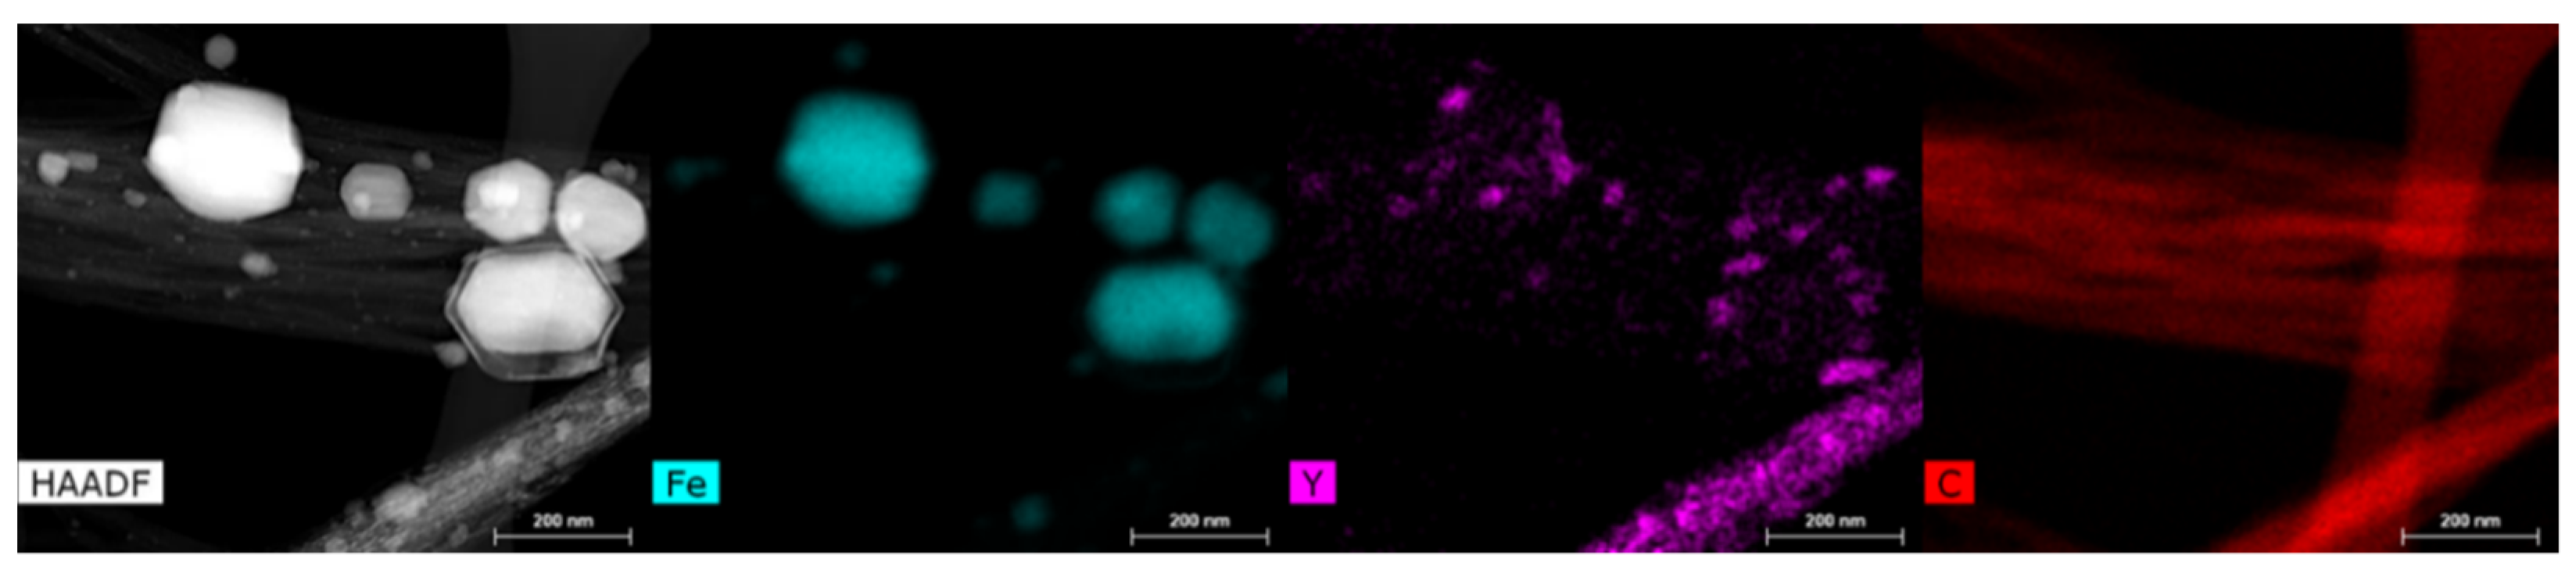
3.1. Characterization of CNT Pulp and Synthesized Eu:Y3O3 Nanoparticles

Scanning electron microscopy observations of untreated, activated, and Eu:Y2O3-CNT pulp were conducted and are shown in Figure 3. The untreated pulp shown in Figure 3a consisted of tight bundles of CNTs, in contrast with Figure 3b, where the loosely packed bundles of CNTs activated for 2.5 h can be seen. Figure 3c shows a section of the Eu:Y2O3-CNT pulp that exemplified a feature observed in all sample locations; increased laxity of the bundle structure. This progressive breakdown of the bundled CNTs results from the mechanical agitation associated with handling and sonication during the activation and Eu:Y2O3 nanoparticle synthesis.
HRTEM analysis was conducted to determine the location of the synthesized Eu:Y2O3. In all cases, the rare-earth oxides were found adhered to CNT bundles or to surrounding Fe particulates, never as individual particulates. CNT bundles were found to have Eu:Y2O3 nanoparticles of approximate diameters from 3 to 20 nm adhered to the tube or Fe surface despite the use of sonication to disperse the sample for observation. HRTEM analysis with the corresponding EDX elemental maps for Fe, Y, Eu, and oxygen are presented in Figure 4. Figure 5 shows a study performed in a different section of the sample, and is included to point out that the Eu:Y2O3 distribution in the samples occurred throughout the CNT network, to include both the Fe catalyst and bare CNT surfaces.
Iron particles, internal and external to the CNTs, with diameters between 10 and 120 nm, could be seen in all the sections analyzed and are a remnant of the CNT growth process that utilized iron as a catalyst. Larger iron particles > 30 nm were found on the tube surface and were surrounded by an oxide shell of approximately 5–8 nm in thickness. Synthesized europium-yttrium oxide particulates were distributed throughout the CNT and Fe surfaces and as agglomerated nodules reaching 20 nm in diameter on larger iron particles. This colocation of Eu:Y2O3 nanoparticles along the tube walls ensures that their detection indicates the presence of an underlying CNT bundle. It is worth noting that some of the Fe particulates appeared to sinter during the step meant to decompose the nitrates, conducted at 850 °C and described in Section 2.3.
X-ray diffraction was conducted with untreated CNTs, CNT pulp activated for 2.5 h, and the final product of 5wt% Eu:Y2O3-CNT pulp. Figure 6 presents the three samples with significant phases identified.
Untreated CNT pulp contained the ferritic iron used as a catalyst during the growth process and was left in place. Subsequent TGA analysis on the same pulp determined the iron content to be 25.6% by weight. Activation of the untreated pulp resulted in complete oxidation of the iron to form iron (III) oxide, Fe2O3. The Eu:Y2O3-CNT pulp sample exhibited iron and a new iron oxide phase, Fe3O4. The Eu:Y2O3 synthesis process introduced europium and yttrium nitrate hydrate and required calcination. These precursors underwent thermal decomposition of the hydrates and off-gassing of oxynitrates in various stages before eventually decomposing into the target oxides between 600 and 700 °C [30,31]. This same process results in the reduction of Fe2O3 to Fe3O4 and iron. The peaks identified as Eu:Y2O3 are consistent with JCPDS #058-0800 where similar Eu doping of the Y2O3 lattice was conducted as (Y0.8Eu0.2)2O3.
A phase was also identified in the completed Eu:Y2O3, marked in Figure 6 by an asterisk symbol. Two potential candidates were identified, iron nitrides with stoichiometric close to FeNx (with 0.03 < x < 0.09) or a carbon allotrope referred to as n-diamond (new-diamond). Previous studies have cataloged peaks with these iron nitrides [32]. However, data has suggested that pure single phases where x < 0.2 have not been observed and are energetically unfavorable [33]. N-diamond was discovered by Hirai and Kondo [34] at high temperatures and pressures and has since been synthesized by numerous groups in varying conditions [35]. The most relevant by Wen et al. using iron-catalyzed CNTs at atmospheric pressures and temperatures as low as 800 °C [36] at the sacrifice of the degradation of the CNT structure—something not seen here. Further analyses are required to unequivocally differentiate the phase that gives origin to these peaks.
In sum, the XRD analysis confirmed the presence of Eu:Y2O3 and TEM identified it as colocated with the CNT network.
The Eu3+ doping of yttria produces known photoluminescence in the visible spectrum. Figure 7 shows the emission spectra of Eu:Y2O3-CNTs under an excitation wavelength of 229 nm. The peak at 611 nm is the characteristic spectra indicative of Eu3+ transition from 5D07F2 that results in the desired red luminescence [19,20,23] and confirms the successful introduction of Eu3+ ions into the host Y2O3 lattice.

3.2. Characterization of the CNT and Eu:Y2O3-CNT Composites and Their Electrical Performance

Optical microscopy observations of epoxy nanocomposite films can be seen in Figure 7. The three-dimensional network of CNT bundles is comprised of bundles of increasingly smaller diameter and length at each step of the Eu:Y2O3-CNT production process. Under SEM imaging, the CNT pulp in Figure 3 exhibited laxation of the CNT bundle due to mechanical agitation. Dispersing the CNT pulp in the epoxy was done via a dual asymmetric mixer. It is suspected that the shear forces resulting from mixing in epoxy further separate the CNT bundles resulting in the smaller mean bundle size seen in Figure 8c.
Observationally, significant decreases in viscosities were seen between the uncured samples and support the previous discussion. The uncured epoxy with untreated CNT filler must be manually deposited into a mold and has a distinct texture, while the uncured Eu-Y2O3-CNTs epoxy is smooth and can be readily poured.
The electrical resistivity of the bulk nanocomposite must remain below 10–106 and 106–1011 Ohm-cm to maintain its applicability for EMI and ESD prevention applications, respectively [37]. Figure 9 presents the measured electrical resistivity of the epoxy composite as a function of %wt CNT loading. The samples generated in the present study span a large portion of the usable range for EMI and ESD applications. The composites based on 2.5 h activated CNTs had a resistivity roughly equal to past 0.014%wt CNT loadings of inactivated CNTs. However, once Eu:Y2O3 was included in the CNT epoxy, those values diminished, that is, the electrical conductivity increased.
Different activation times were explored, with each activated pulp subsequently subjected to synthesis of the Eu:Y2O3 nanoparticles. The resulting resistivity is plotted in Figure 10. The composite fabricated from untreated CNTs (0 h activation), 1, 2, and 2.5 h activation times resulted in resistivities of 15.67, 60.47, 982.7, and 5058 Ω-cm respectively. After synthesizing Eu:Y2O3, the untreated, 1 h, 2 h, and 2.5 h activated samples measured resistivities of 12.40, 18.14, 79.29, and 196.4 Ω-cm. Increases in resistivity during activation are attributed to the oxidation of the iron catalyst remaining from the CNT growth process into iron (III) oxide, a known electrical insulator [38]. Further, the activation process results in oxygen containing species in the form of ether C-O-C and quinone C=O groups along the CNT surface and likely plays a role in this decrease [39]. The resistivity improvements seen during the subsequent calcination are attributed to the reduction of the iron (III) oxide to small amounts of iron (II oxide) and iron. This is supported by the phase analysis presented in Figure 6.
Figure 11 presents the resistivity as a function of applied current. Standard deviation across samples is stable at ~5–10% of measured resistivity. Decreasing resistivity under increased current application was seen for the activated CNT composite. A resistivity reduction of 9.4% across the full current range was recorded. The drop across the full scale in the untreated and Eu:Y2O3-CNT samples was <1%. Past research has documented similar behavior at the high resistivities associated with 0.014%wt CNT composites. This current dependence with increasing current application is ascribed to temperature increases due to resistive heating and irreversibility in the conductive path within the composite. Further discussion can be found in [1]. Notably, a reduction in resistivity (increased conductivity) is a positive attribute for the proposed applications.

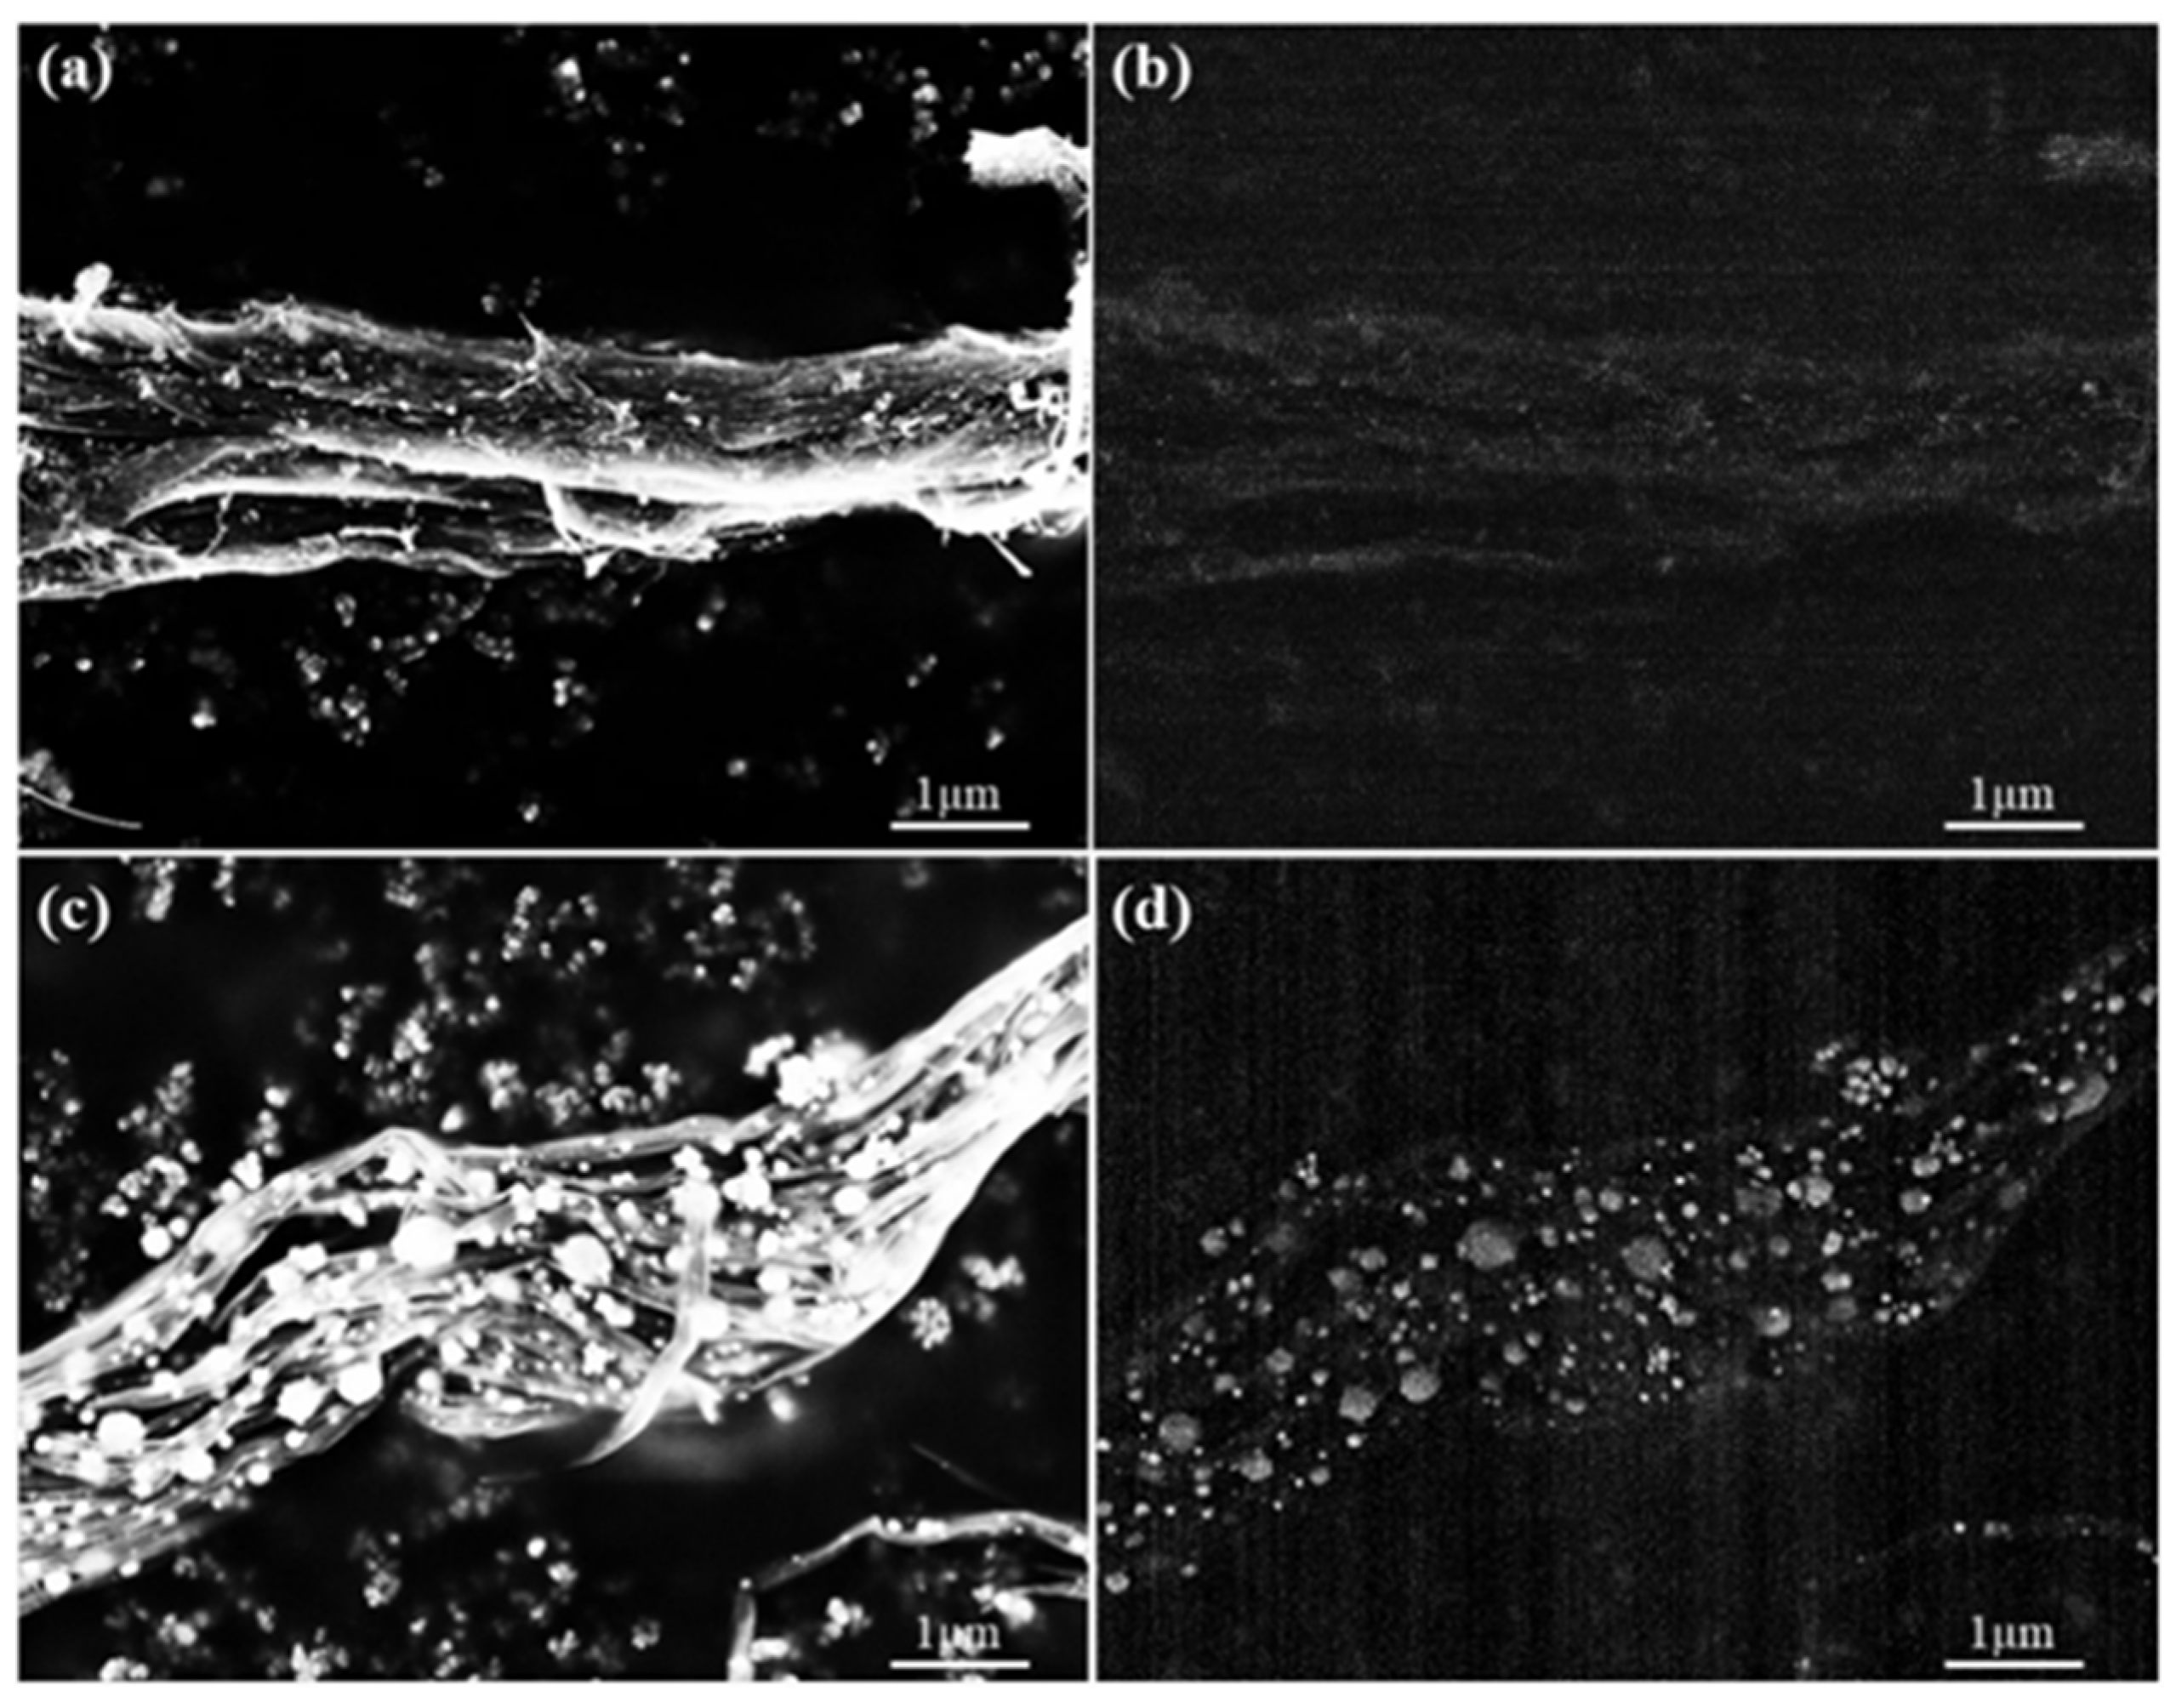
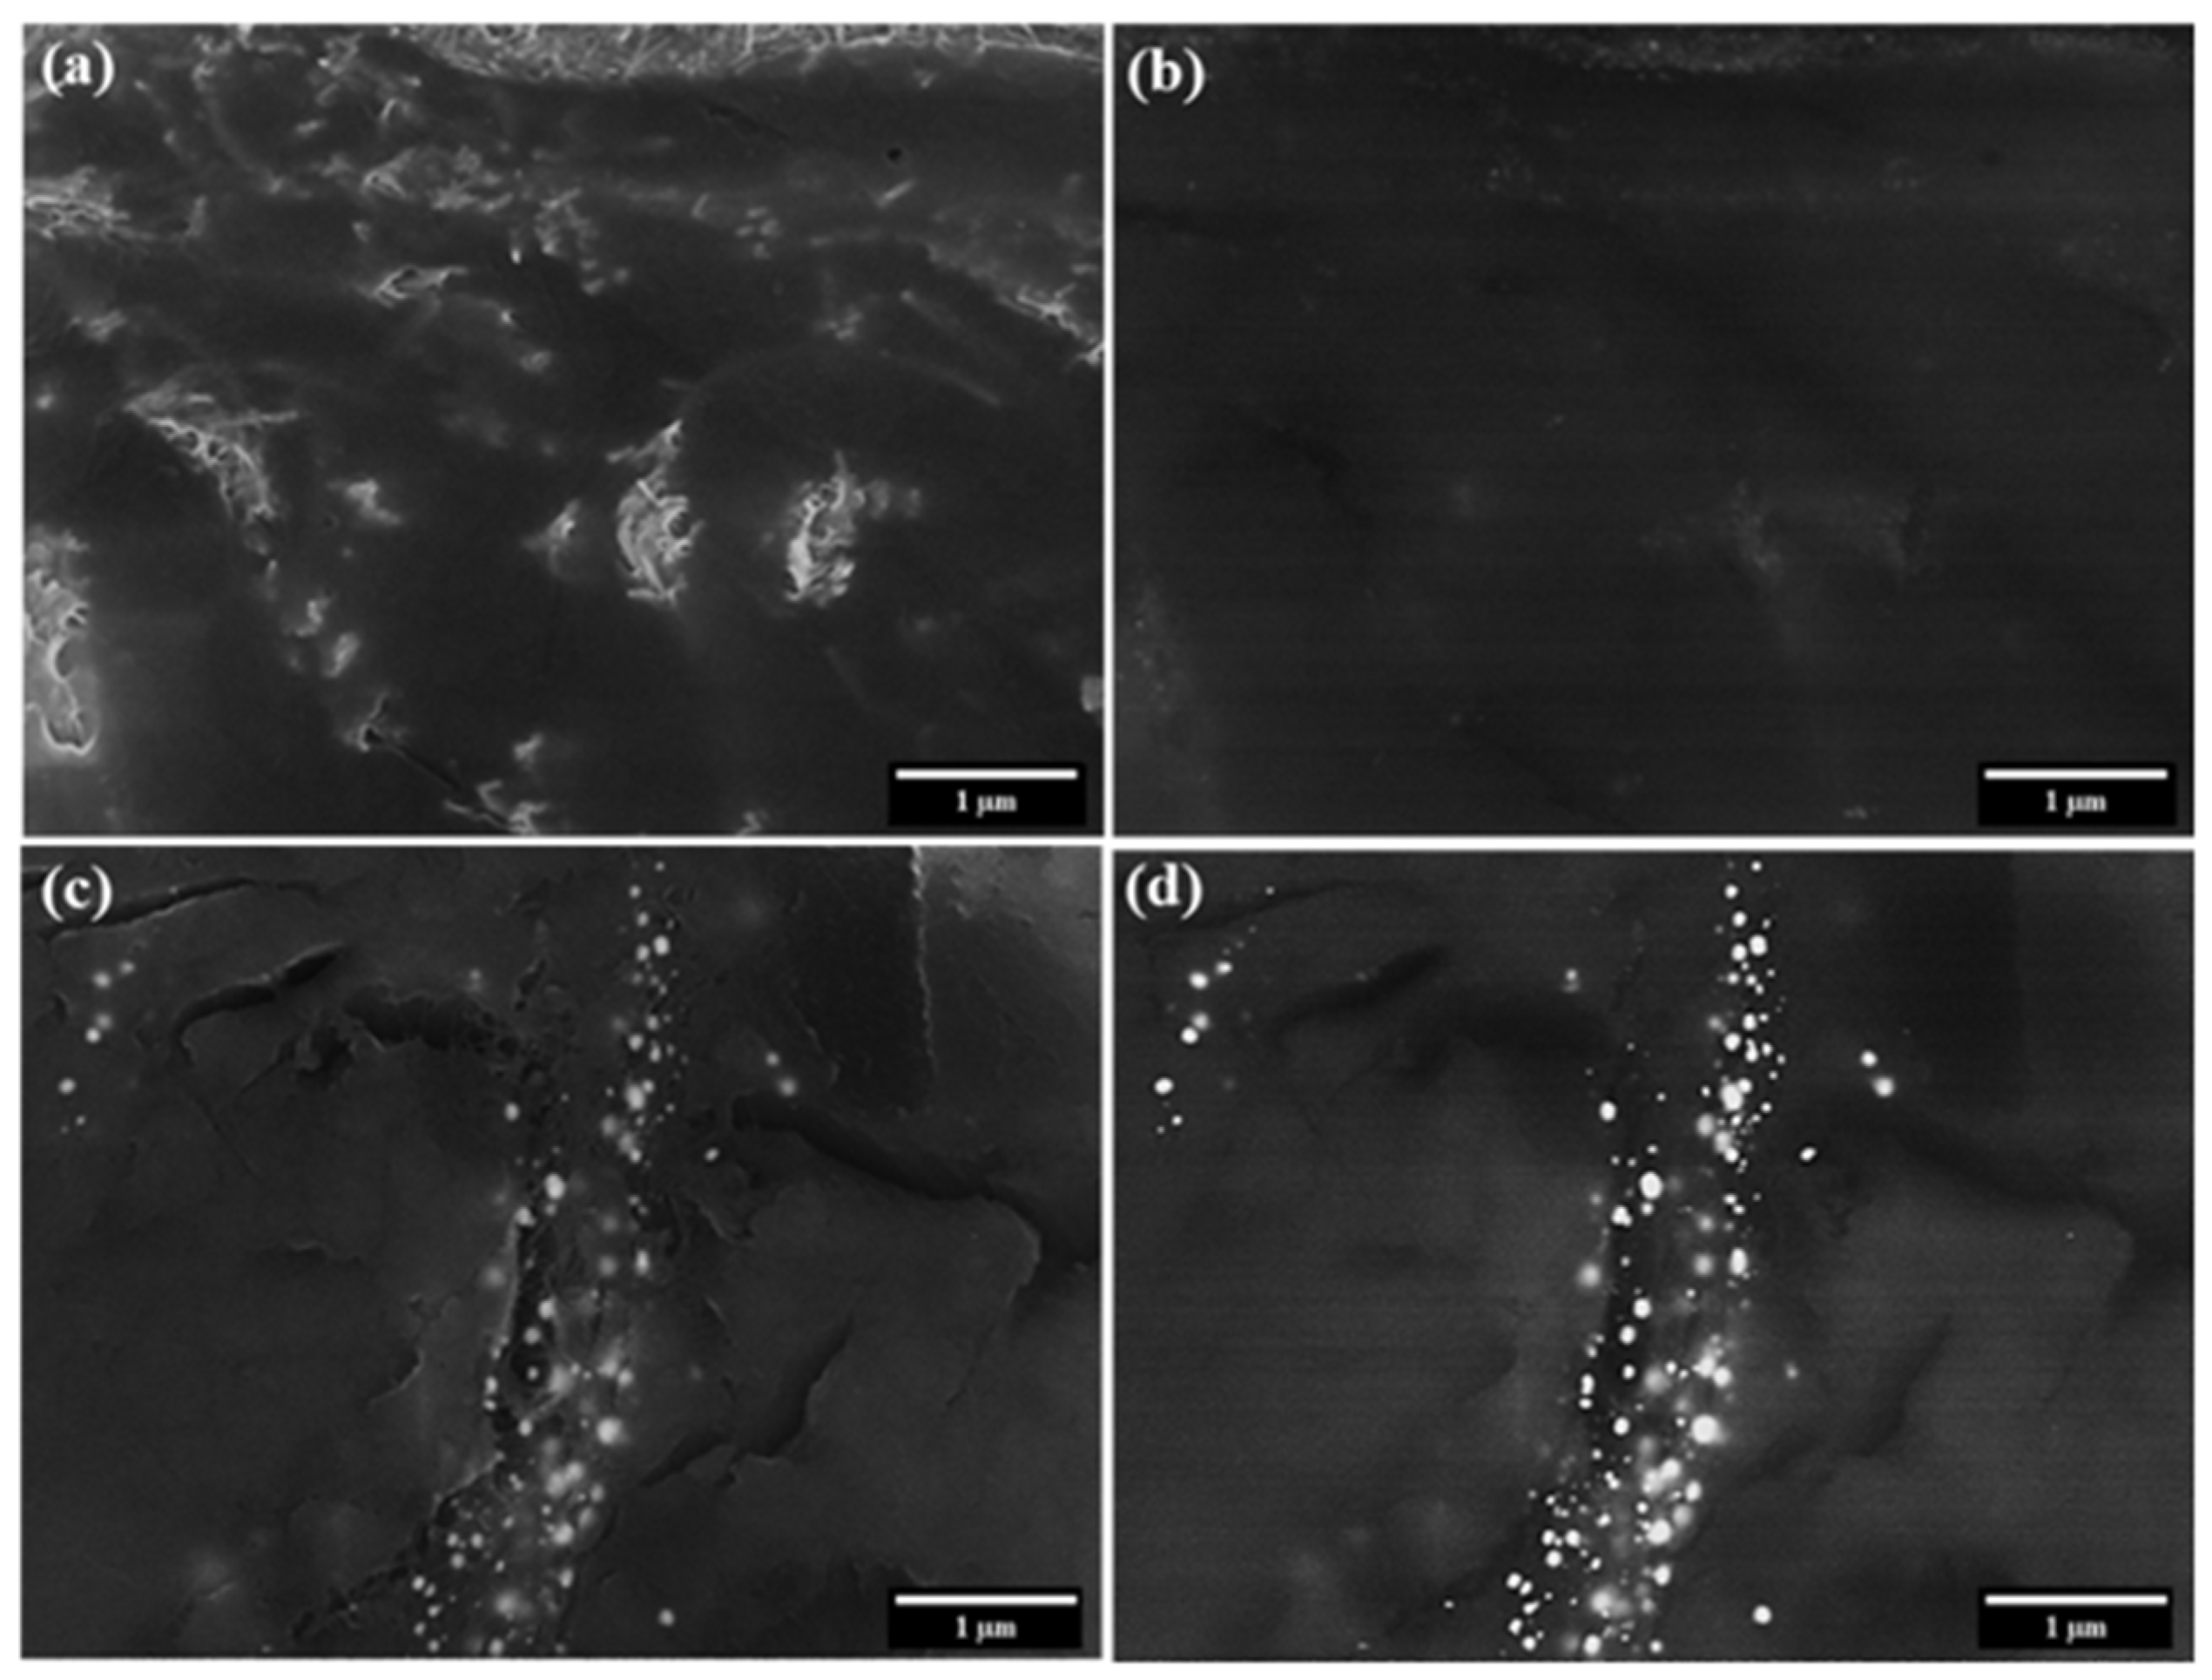
3.3. Scanning Electron Microscopy and Micro-Computed Tomography

SEM imaging was conducted on untreated CNT pulp, Eu:Y2O3-CNT, and nanocomposites fabricated from those two samples. SE and BSE images of CNT pulp (no epoxy) and epoxy CNT nanocomposites are compared in Figure 12 and Figure 13.
For CNT pulp, the addition of Eu:Y2O3 results in easier identification of individual tubes due to the increased contrast of the colocated CNT, the sintered Fe particulates and the Eu:Y2O3 when conducting SE imaging (Figure 12a vs. Figure 12c). The larger particulates observed in Figure 12c correspond to the sintered Fe, while the Eu:Y2O3 is finely dispersed. BSE detection is improved with the addition of the Eu:Y2O3 oxide nanoparticles due to both the presence of heavier elements absent from the bare CNT pulp and that the Fe particulates remained at smaller sizes in the untreated CNT pulp. The contrast between Figure 12b,d is remarkable; Figure 12d shows a brighter tone for the Eu:Y2O3, previously identified by TEM as the finely dispersed particles, than for Fe. The CNT network is barely distinguishable in the background. BSE imaging of the untreated CNT bundles results in poor contrast.
Epoxy nanocomposites fabricated from untreated CNT pulp allow the visualization of a well-dispersed CNT network via SE electron imaging. BSE imaging results in poor contrast between the epoxy matrix and the CNT network in the same sample (Figure 13a,b). Eu:Y2O3-CNT nanocomposites show increased contrast in both imaging modes.
Micro-CT analysis was conducted on nanocomposites made from untreated CNTs and Eu:Y2O3 and generated 3D tomograms of internal porosity and CNT network. Videos featuring the 3D tomograms can be found online as Video S1 and Video S2. A plane-view of the captured volumes is presented in Figure 14. CNT loading was 0.75wt% in each case however, stark differences were seen between the composite with untreated CNT filler and the Eu:Y2O3-CNT composite (Figure 14a,b). CNT bundles were detected more readily in the Eu:Y2O3 sample and porosity differences were clear with average pore diameters of 113 nm and 50.2 nm for the untreated and Eu:Y2O3-CNTs, respectively. Image processing in Figure 14c,d allowed the pore outlines to drop out, making CNT bundle detection differences clearer. The contrast seen in the micro-CT scans corresponds to X-ray attenuation, which indicates the fraction of X-rays absorbed or scattered at each voxel. High atomic number elements such as Eu and Y attenuate X-rays more intensely compared to the epoxy matrix. Therefore, Eu:Y2O3-CNT manifest as high-contrast bright spots while pores in the matrix are shown as a circular outline with less intensity.

4. Conclusions

Eu:Y2O3 was synthesized as distinct particles attached to CNT walls. The addition of Eu:Y2O3 indirectly resulted in an increase in bulk resistivity when compared to the untreated state. However, nanocomposite resistivity remained well within the required limits for its intended EMI and ESD applications.
Photoluminescence of the Eu:Y2O3-CNTs under DUV excitation was documented with a resulting red-orange emission wavelength of 611 nm. The utility of luminescence in relation to the Eu:Y2O3-CNT nanocomposite was not tested. Future work could focus on developing imaging and nondestructive techniques exploiting the photoluminescence within a cured composite.
Through this presence of heavier rare-earth elements, i.e., yttrium and europium, significant contrast improvements were realized in the SEM BSE imaging, potentially allowing the detection of tube bundles more readily and at greater depths. Similarly, the micro-CT scans benefited from Eu:Y2O3 inclusion and improvements to three-dimensional visualization of the CNT network through the reconstructed images resulted.

Supplementary Materials

The following are available online at https://www.mdpi.com/article/10.3390/nano11092168/s1, Video S1: 3D tomogram of untreated CNT composite, Video S2: 3D tomogram of Eu:Y2O3-CNT composite.

Author Contributions

Conceptualization, methodology, validation, and formal analysis, J.H., C.L.; investigation—TEM, J.H., T.Y.A.; investigation—micro-CT, T.I.; resources, C.L., V.O.; data curation, J.H.; writing—original draft preparation, J.H.; writing—review and editing, J.H., T.Y.A., C.L.; visualization, J.H., T.Y.A., T.I., V.O.; supervision, project administration, and funding acquisition, C.L. All authors have read and agreed to the published version of the manuscript.

Funding

This research received no external funding.

Acknowledgments

The CNT pulp samples were provided by Nanocomp Technologies, Inc.

Conflicts of Interest

The authors declare no conflict of interest. The views expressed in this document are those of the author and do not reflect the official policy or position of the Department of Defense or the U.S. Government.

References

  1. Earp, B.; Phillips, J.; Grbovic, D.; Vidmar, S.; Porter, M.; Luhrs, C.C. Impact of Current and Temperature on Extremely Low Loading Epoxy-CNT Conductive Composites. Polymers 2020, 12, 867. [Google Scholar] [CrossRef] [PubMed]
  2. Bellucci, S.; Balasubramanian, C.; Micciulla, F.; Rinaldi, G. CNT Composites for Aerospace Applications. J. Exp. Nanosci. 2007, 2, 193–206. [Google Scholar] [CrossRef]
  3. Du, J.-H.; Bai, J.; Cheng, H.-M. The Present Status and Key Problems of Carbon Nanotube Based Polymer Composites. Express Polym. Lett. 2007, 1, 253–273. [Google Scholar] [CrossRef]
  4. Harris, P.J.F. Carbon Nanotube Composites. Int. Mater. Rev. 2004, 49, 31–43. [Google Scholar] [CrossRef]
  5. Kausar, A.; Rafique, I.; Muhammad, B. Review of Applications of Polymer/Carbon Nanotubes and Epoxy/CNT Composites. Polym.-Plast. Technol. Eng. 2016, 55, 1167–1191. [Google Scholar] [CrossRef]
  6. Kumar, P.; Maiti, U.N.; Sikdar, A.; Das, T.K.; Kumar, A.; Sudarsan, V. Recent Advances in Polymer and Polymer Composites for Electromagnetic Interference Shielding: Review and Future Prospects. Polym. Rev. 2019, 59, 687–738. [Google Scholar] [CrossRef]
  7. Park, S.-H.; Ha, J.-H. Improved Electromagnetic Interference Shielding Properties Through the Use of Segregate Carbon Nanotube Networks. Materials 2019, 12, 1395. [Google Scholar] [CrossRef] [Green Version]
  8. Spitalsky, Z.; Tasis, D.; Papagelis, K.; Galiotis, C. Carbon Nanotube–Polymer Composites: Chemistry, Processing, Mechanical and Electrical Properties. Prog. Polym. Sci. 2010, 35, 357–401. [Google Scholar] [CrossRef]
  9. De Volder, M.F.L.; Tawfick, S.H.; Baughman, R.H.; Hart, A.J. Carbon Nanotubes: Present and Future Commercial Applications. Science 2013, 339, 535–539. [Google Scholar] [CrossRef] [Green Version]
  10. Yang, Y.; Gupta, M.C.; Dudley, K.L. Studies on Electromagnetic Interference Shielding Characteristics of Metal Nanoparticle- and Carbon Nanostructure-Filled Polymer Composites in the Ku-Band Frequency. Micro Nano Lett. 2007, 2, 85–89. [Google Scholar] [CrossRef]
  11. Khan, W.; Sharma, R.; Saini, P. Carbon Nanotube-Based Polymer Composites: Synthesis, Properties and Applications. In Carbon Nanotubes—Current Progress of Their Polymer Composites; Berber, M., Hafez, I.H., Eds.; Intech Open: London, UK, 2016; pp. 1–45. ISBN 978-953-51-2469-6. [Google Scholar]
  12. Pantano, A.; Montinaro, N.; Cerniglia, D.; Micciulla, F.; Bistarelli, S.; Cataldo, A.; Bellucci, S. Novel Non-Destructive Evaluation Technique for the Detection of Poor Dispersion of Carbon Nanotubes in Nanocomposites. Compos. Part B Eng. 2019, 163, 52–58. [Google Scholar] [CrossRef]
  13. Li, W.; Buschhorn, S.T.; Schulte, K.; Bauhofer, W. The Imaging Mechanism, Imaging Depth, and Parameters Influencing the Visibility of Carbon Nanotubes in a Polymer Matrix Using an SEM. Carbon 2011, 49, 1955–1964. [Google Scholar] [CrossRef]
  14. Finnie, P.; Kaminska, K.; Homma, Y.; Austing, D.G.; Lefebvre, J. Charge Contrast Imaging of Suspended Nanotubes by Scanning Electron Microscopy. Nanotechnology 2008, 19, 335202. [Google Scholar] [CrossRef] [PubMed]
  15. Loos, J.; Alexeev, A.; Grossiord, N.; Koning, C.E.; Regev, O. Visualization of Single-Wall Carbon Nanotube (SWNT) Networks in Conductive Polystyrene Nanocomposites by Charge Contrast Imaging. Ultramicroscopy 2005, 104, 160–167. [Google Scholar] [CrossRef] [PubMed]
  16. Lillehei, P.T.; Kim, J.-W.; Gibbons, L.J.; Park, C. A Quantitative Assessment of Carbon Nanotube Dispersion in Polymer Matrices. Nanotechnology 2009, 20, 325708. [Google Scholar] [CrossRef]
  17. Kovacs, J.Z.; Andresen, K.; Pauls, J.R.; Garcia, C.P.; Schossig, M.; Schulte, K.; Bauhofer, W. Analyzing the Quality of Carbon Nanotube Dispersions in Polymers Using Scanning Electron Microscopy. Carbon 2007, 45, 1279–1288. [Google Scholar] [CrossRef] [Green Version]
  18. Earp, B.; Simpson, J.; Phillips, J.; Grbovic, D.; Vidmar, S.; McCarthy, J.; Luhrs, C. Electrically Conductive CNT Composites at Loadings below Theoretical Percolation Values. Nanomaterials 2019, 9, 491. [Google Scholar] [CrossRef] [Green Version]
  19. Chang, N.C. Fluorescence and Stimulated Emission from Trivalent Europium in Yttrium Oxide. J. Appl. Phys. 1963, 34, 3500–3504. [Google Scholar] [CrossRef]
  20. Chang, N.C.; Gruber, J.B. Spectra and Energy Levels of Eu3+ in Y2O3. J. Chem. Phys. 1964, 41, 3227–3234. [Google Scholar] [CrossRef]
  21. Blasse, G.; Grabmaier, B.C. Luminescent Materials; Springer: Berlin/Heidelberg, Germany, 1994; ISBN 978-3-642-79017-1. [Google Scholar]
  22. Mariscal-Becerra, L.; Vázquez-Arreguín, R.; Balderas, U.; Carmona-Téllez, S.; Murrieta Sánchez, H.; Falcony, C. Luminescent Characteristics of Layered Yttrium Oxide Nano-Phosphors Doped with Europium. J. Appl. Phys. 2017, 121, 125111. [Google Scholar] [CrossRef]
  23. Wakefield, G.; Holland, E.; Dobson, P.J.; Hutchison, J.L. Luminescence Properties of Nanocrystalline Y2O3:Eu. Adv. Mater. 2001, 13, 1557–1560. [Google Scholar] [CrossRef]
  24. Schmechel, R.; Kennedy, M.; von Seggern, H.; Winkler, H.; Kolbe, M.; Fischer, R.A.; Xaomao, L.; Benker, A.; Winterer, M.; Hahn, H. Luminescence Properties of Nanocrystalline Y2O3:Eu3+ in Different Host Materials. J. Appl. Phys. 2001, 89, 1679–1686. [Google Scholar] [CrossRef]
  25. Das, G.K. Rare Earth Doped Nanomaterials as Potential Contrast Agents for Optical/Magnetic Resonance Imaging; Nanyang Technological University: Singapore, 2010. [Google Scholar]
  26. Yang, H.; Zhang, D.; Shi, L.; Fang, J. Synthesis and Strong Red Photoluminescence of Europium Oxide Nanotubes and Nanowires Using Carbon Nanotubes as Templates. Acta Mater. 2008, 56, 955–967. [Google Scholar] [CrossRef]
  27. Technologies, N. Nanocomp Technologies’ Products|Dispersed Products. Available online: https://www.miralon.com/dispersed-products (accessed on 28 January 2021).
  28. LOCTITE 9396aero. Available online: https://www.henkel-adhesives.com/vn/en/product/adhesives/loctite_ea_9396_aero.html (accessed on 28 January 2021).
  29. Tomviz for Tomographic Visualization of Nanoscale Materials. Available online: https://tomviz.org/ (accessed on 29 July 2021).
  30. Melnikov, P.; Nascimento, V.A.; Consolo, L.Z.Z.; Silva, A.F. Mechanism of Thermal Decomposition of Yttrium Nitrate Hexahydrate, Y(NO3)3·6H2O and Modeling of Intermediate Oxynitrates. J. Therm. Anal. Calorim. 2013, 111, 115–119. [Google Scholar] [CrossRef]
  31. Melnikov, P.; Arkhangelsky, I.V.; Nascimento, V.A.; de Oliveira, L.C.S.; Silva, A.F.; Zanoni, L.Z. Thermal Properties of Europium Nitrate Hexahydrate Eu(NO3)3·6H2O. J. Therm. Anal. Calorim. 2017, 128, 1353–1358. [Google Scholar] [CrossRef]
  32. Jack, K.H.; Goodeve, C.F. The Iron-Nitrogen System: The Preparation and the Crystal Structures of Nitrogen-Austenite(γ) and Nitrogen-Martensite(α’). Proc. R. Soc. Lond. Ser. Math. Phys. Sci. 1951, 208, 200–215. [Google Scholar] [CrossRef]
  33. Tessier, F.; Navrotsky, A.; Niewa, R.; Leineweber, A.; Jacobs, H.; Kikkawa, S.; Takahashi, M.; Kanamaru, F.; DiSalvo, F.J. Energetics of Binary Iron Nitrides. Solid State Sci. 2000, 2, 457–462. [Google Scholar] [CrossRef]
  34. Hirai, H.; Kondo, K. Modified Phases of Diamond Formed Under Shock Compression and Rapid Quenching. Science 1991, 253, 772. [Google Scholar] [CrossRef]
  35. Wen, B.; Zhao, J.J.; Li, T.J. Synthesis and Crystal Structure of N-Diamond. Int. Mater. Rev. 2007, 52, 131–151. [Google Scholar] [CrossRef]
  36. Wen, B.; Zhao, J.; Li, T.; Dong, C.; Jin, J. N-Diamond from Catalysed Carbon Nanotubes: Synthesis and Crystal Structure. J. Phys. Condens. Matter 2005, 17, L513–L519. [Google Scholar] [CrossRef]
  37. Pang, H.; Xu, L.; Yan, D.-X.; Li, Z.-M. Conductive Polymer Composites with Segregated Structures. Prog. Polym. Sci. 2014, 39, 1908–1933. [Google Scholar] [CrossRef]
  38. Mochizuki, S. Electrical Conductivity of α-Fe2O3. Phys. Status Solidi A 1977, 41, 591–594. [Google Scholar] [CrossRef]
  39. Chen, X.; Tang, X.-Z.; Liang, Y.N.; Cheah, J.W.; Hu, P.; Hu, X. Controlled Thermal Functionalization for Dispersion Enhancement of Multi-Wall Carbon Nanotube in Organic Solvents. J. Mater. Sci. 2016, 51, 5625–5634. [Google Scholar] [CrossRef]
Figure 1. Depiction of the processes for: (a) introducing Eu:Y2O3 nanoparticles to CNT walls; (b) fabrication of composite electrical boards and samples from epoxy and CNT pulp.
Nanomaterials 11 02168 g001
Figure 2. Experimental setup for measure electrical resistivity and governing equations.
Nanomaterials 11 02168 g002
Figure 3. SEM imaging of CNT bundles at 10k× magnification: (a) untreated CNT bundles; (b) activated bundles; (c) Eu:Y2O3-CNT bundles.
Nanomaterials 11 02168 g003
Figure 4. HRTEM, HAADF, imaging and EDX mapping of CNT bundles showing elemental distribution.
Nanomaterials 11 02168 g004
Figure 5. HAADF imaging and EDX mapping of CNT bundles showing the Yttria distribution on CNT wall.
Nanomaterials 11 02168 g005
Figure 6. XRD analysis of untreated, activated, and Eu:Y2O3-CNT pulp with corresponding phases identified.
Nanomaterials 11 02168 g006
Figure 7. Photoluminescent spectra resulting from 229 nm excitation of 5%wt Eu:Y2O3 CNTs that had been activated for 2.5 h.
Nanomaterials 11 02168 g007
Figure 8. Magnification microscope 50× images revealing CNT bundles, indicated by white arrows, in nanocomposites created from: (a) untreated CNT pulp; (b) 2.5 h activated CNT pulp; (c) Eu:Y2O3-CNTs.
Nanomaterials 11 02168 g008
Figure 9. Measured electrical resistivity of current CNT pulp (Lot C) contrasted with past production runs (Lot A,B) with an applied current of 400 µA.
Nanomaterials 11 02168 g009
Figure 10. Effects of activation and inclusion of Eu:Y2O3 particles on electrical resistivity on a nanocomposite samples with 0.75%wt CNT loading.
Nanomaterials 11 02168 g010
Figure 11. Electrical resistivity as a function of applied current for composites made with 0.75wt% CNTs at different phases of the preparing and Eu:Y2O3 synthesis process.
Nanomaterials 11 02168 g011
Figure 12. SEM imaging of CNT pulp: (a) SE image, (b) BSE image of untreated CNT pulp; (c) SE image, (d) BSE of Eu:Y2O3-CNT CNT pulp.
Nanomaterials 11 02168 g012
Figure 13. SEM imaging of 0.75%wt CNT nanocomposites made from: untreated CNTs (a) SE image (b) BSE image; Eu:Y2O3-CNTs (c) SE image (d) BSE image.
Nanomaterials 11 02168 g013
Figure 14. Micro-CT tomograms in high-contrast color revealing CNT network and pores and greyscale depicting only the CNT network: (a,c) untreated CNT nanocomposite; (b,d) Eu:Y2O3-CNT nanocomposite.
Nanomaterials 11 02168 g014
Publisher’s Note: MDPI stays neutral with regard to jurisdictional claims in published maps and institutional affiliations.

