3.1. Zeolites’ Synthesis and Surface Studies
In our previous study, the synthesized material from raw FA was characterized as a zeolite of Na-X type [
25]. The phase identification was provided by XRD analysis and confirmed by the SEM images [
25]. Intensive diffraction reflexes typical of the Faujasite framework have been found on the experimental diffractogram of the sample [
25]. The conducted XRD study of milled samples (not shown here) has confirmed that there is no change of crystal structure due to wet milling. Only a small decrease in diffraction reflexes was obtained after milling. SEM images revealed hexaoctahedral crystallites typical for zeolite Na-X with submicron sizes obtained as a result of the ultrasonic treatment [
25]. The iron oxides that are usually presented in the raw FA are transferred into the zeolite product as finely and uniformly dispersed ferric ions and Fe
2+/
3+–oxide entities, as confirmed by the Mössbauer studies [
25]. The nanocrystalline morphology along with the uniform distribution of the iron components in the zeolite matrix demonstrated the advantages of the ultrasonic-assisted double-stage fusion-hydrothermal synthesis. In this sample, a 94% degree of zeolitization of the raw coal ash was determined by the XRD deconvolution.
The obtained experimental N
2-adsorption/desorption isotherms of the parent and milled zeolite samples are plotted in
Figure 2a. All isotherms could be attributed to Type IV according to the International Union of Pure and Applied Chemistry (IUPAC) classification, which is typical for solids with a mixed micro-mesoporous structure [
27].
The fast adsorption at low p/p
0 is related to the filling in micropores. A comparative examination of the experimental isotherms showed the most intensive adsorption at low pressures in the parent Na-X zeolite, while the amount of the adsorbed N
2 decreases in the milled samples. For Na-X
60 and Na-X
120, the isotherms almost overlap, and the prolongation of the milling time led to the lowest adsorption in the low pressure range for Na-X
540. The monolayer adsorption is established up to p/p
0 = 0.05 for all samples, where the linear multipoint BET model was applied in five points with the highest correlation (up to 0.999999). Increasing the pressure, the adsorption in the studied samples continues by filling of mesopores and formation of a multilayer up to p/p
0 = 0.9. The intensive adsorption in the highest pressure region up to p/p
0 = 0.995 is indicative of the presence of macropores and filling into the inter-crystal free volume. The desorption and adsorption branches of the isotherms are slightly displaced, describing the hysteresis loops closed at p/p
0 = 0.35 for all samples. The displacement in the processes of adsorption and desorption relative to the pressure is related to capillary condensation in the mesopores. The experimental desorption data were used as input data in the BJH model to determine the pore size distribution. The plot of the free pore volume distribution (dV/dw,cm
3/g.Å) versus the pore width is presented in
Figure 2b. The results confirm the observation from the N
2-adsorption/desorption experiments that the non-milled Na-X zeolite possesses the highest free volume indicated by an intensive peak at a pore width range of 35–45 Å, and a trend of increasing the pore volume in the direction of the micropore sizes. The main part of the free volume at all samples is provided by pores with a width of 38Å, as the BJH plots of Na-X
60 and Na-X
120 almost overlap but the intensity of the peaks determining the pore volume is reduced as compared with Na-X
0. The sample Na-X
540 possesses drastically reduced free pore volume, which shows that the excessively prolonged milling time leads to destruction of the zeolite framework.
In
Table 1, the surface characteristics of the studied samples calculated from the experimental isotherms by standardized models are summarized: specific surface area (S
BET, m
2/g); external surface (S
external, m
2/g); surface described by micropores (S
micro, m
2/g); total internal volume (V
total, cm
3/g); the volume part determined by micro- (V
micro, cm
3/g) and mesopores (V
meso, cm
3/g); and average micro- (d
micro, Å) and mesopore (d
meso, Å) sizes of initial Na-X zeolite (Na-X
0) and zeolites after milling for 60 (Na-X
60), 120 (Na-X
120), and 540 (Na-X
540) seconds.
As can be seen, the specific S
BET surface of zeolites decreases after the milling process and the reduction is most pronounced for the sample milled for 540 s, in which case S
BET = 158.8 m
2/g is almost twice less than that of zeolites milled for 60 or 120 s. For the samples milled for 60 and 120 s, the difference in the specific surfaces is within the experimental error and the results are identical—around 300 m
2/g. Despite the lower surface area at Na-X
60 and Na-X
120 as compared with the initial Na-X
0 zeolite, the S
BET value of 300 m
2/g is sufficient for processes taking part on the solid surface. After the milling, the share of micro and mesopores decreases, and the external surface is reduced owing to the particle coalescence. However, the average mesopore width is increased. The effect of milling on the surface parameters is most pronounced in Na-X
540. It is well known that zeolite Na-X crystallizes as a metastable phase [
28]; therefore, prolonged mechanical treatment could cause recrystallization of Na-X in a thermodynamically more stable phase. As Na-X is a zeolite phase with extremely high specific surface area and porosity, its recrystallization into another zeolite phase will lead to deterioration of the surface characteristics of the material. This could also be the probable reason for the observed noticeable increase in the size of the mesopores in the Na-X
540 sample. However, as already mentioned, the XRD patterns of zeolites are similar. This leads to the conclusion that, if the recrystallization takes place, it is very weak and not detectable by X-ray diffraction.
3.2. Zeolites Size
The influence of the milling on the size of the Na-X zeolites was studied by measuring the hydrodynamic diameter of the particles using dynamic light scattering (DLS) (
Figure 3). From our previous studies, we know that not milled zeolites with average size around 1 µm impair the optical quality of the composite thin films of Nb
2O
5 matrix doped with zeolites. Whereas, in this case too, the initial zeolites Na-X
0 are of a similar size; therefore, with wet milling, we aim at decreasing the size of the particles and to obtain transparent films with smooth surfaces. This will assure negligible scattering that is vital when optical sensing is considered. As seen from
Figure 3, after 60 s of wet milling, the initial size of the zeolites decreases from 983 nm to 617 nm. It is interesting to note that an additional 60 s of milling leads to a slight increase in zeolites’ size from 617 nm to 729 nm. The longest milling with duration of 540 s does not substantially influence the particles size, but significantly changes their size distribution. The width of DLS curve for 540 s increases, thus indicating the presence of particles with various diameters ranging from 350 nm to 1500 nm.
SEM micrographs of powders from initial Na-X
0 zeolites and zeolites after milling for 60, 120, and 540 s, of Na-X
60, Na-X
120, and Na-X
540, respectively, are presented in
Figure 4 in two magnifications. Na-X
0 is composed of individual hexaoctahedral crystallites (
Figure 4a,e). The wet milling of 60 and 120 s results in finer morphology of closely packed nanocrystals, which reduces the free pore volume (
Figure 4b,c,f,g). The prolonged milling of Na-X
540 leads to the particle aggregation and formation of agglomerates, which explains the drastic reduction in the specific surface area and the internal free volume. Simultaneously, the prolonged milling results in widening of the particles’ size distribution, already noticed from DLS curves and confirmed by the SEM pictures presented in
Figure 4d,h, where particles with diverse sizes are seen.
The morphology of parent and milled zeolites was also investigated using transmission electron microscopy (TEM) at different magnifications. Typical TEM images of Na-X
0, Na-X
60, and Na-X
540 are presented in
Figure 5.
In the initial sample, the hexaoctahedral crystallites typical of the Na-X phase are clearly observed, which confirms the formation of a well-organized zeolite structure (
Figure 5a,d). Irregularly shaped crystals are also presented, indicating that the zeolites synthesized from by-products are characterized with more structural imperfections than the zeolites derived from pure starting materials. The structural irregularity of these materials may be an advantage in processes related to surface phenomena, as they lead to a stronger surface unsaturation. This is confirmed by the experimentally established high catalytic and adsorption ability of zeolites from FA, comparable to that of their pure synthetic analogues despite their lower specific surface area [
25]. At higher magnifications, the fingerprints of the crystalline phase are clearly visible. TEM images of the milled for the short time sample Na-X
60 show preservation of the typical Na-X crystal morphology (
Figure 5b,e). The morphology of Na-X
120 zeolite is similar, which is why the images are not presented. TEM analysis confirms the observations from surface studies and SEM pictures that prolonged milling of zeolite Na-X
540 leads to the destruction of crystallites and probable recrystallization of the zeolite phase (
Figure 5c,f).
3.3. Optical Properties
Our recent investigations of Nb
2O
5 films doped with zeolites synthesized by long-term alkaline atmospheric conversion of FA have shown that the films’ response towards liquid acetone substantially improves when milled zeolite particles are used as dopants as compared with untreated zeolites [
14]. Based on the results of our measurements and data on particle sizes, optical and sensing characterization was focused on thin films doped with milled zeolites. Therefore, Nb
2O
5 composite thin films with two different levels of doping with Na-X zeolites (1% and 5%) were deposited on silicon substrates. Pure Nb
2O
5 film with no addition of zeolites was also prepared in order to make a comparison with doped films. Afterwards, the reflectance spectra
R of the films were measured (
Figure 6a) at normal light incidence and refractive index
n, extinction coefficient
k, and thickness
d were determined from spectra (
Figure 6b and
Table 2).
It is seen from
Figure 6a that the shapes of the spectra of pure and doped thin Nb
2O
5 matrix are similar, but a blue shift takes place when zeolites are introduced into the matrix. The observed shift toward short wavelengths indicates a reduction in optical thickness (refractive index multiplied by the thickness of the film) and could be explained by the decrease in the effective refractive index of the Nb
2O
5/Na-X composite films due to addition in the matrix of a medium with low refractive index (Na-X zeolites). We have already shown that zeolites have a much lower refractive index than metal oxides [
23]. Further, the measured spectra are used for calculation of the refractive index,
n; extinction coefficient,
k; and film thickness,
d. Calculated dispersion curves of refractive index are shown in
Figure 6b. All curves exhibit normal dispersion (
n decreases with wavelength) that could be expected considering the excellent transparency of the films; the extinction coefficient is less than 0.02 (
Table 2). As expected, the refractive index of composite films is lower as compared with the oxide matrix. The reduction in the refractive index depends on the concentration of zeolites and is stronger for highly doped samples. It is seen from
Table 2 that, for the composite with 5% Na-X zeolites, the refractive index increases with the duration of milling, while a minimum is observed for the 1% doped composite when Na-X zeolites milled for 120 s are used as dopants. As mentioned above, the introduction of zeolites in the oxide matrix leads to the generation of free volume that finally results in a decrease in the refractive index of composite films as compared with the oxide matrix.
There are two factors that determine the free volume in the films: the intrinsic porosity of the zeolites and the interparticle spaces. The interplay between them governs the porosity of the composite films. Thus, if we assume that the interparticle spaces in the films do not depend on the zeolite size, then the lowest refractive index is expected for films doped with Na-X
120. The reason is that Na-X
120 zeolite exhibits the highest pore volume and specific surface area (
Table 1), i.e., it has the highest intrinsic porosity. This is exactly what happens for 1% doped films; the refractive index has a minimum for 120 s (
Table 2). However, this trend is not observed for heavily doped samples where the refractive index increases with the milling time. When zeolites are introduced in a higher concentration (Na-X-5%), it is very likely that some agglomeration will take place and the zeolite will be dispersed in the matrix less homogenously. Owing to the formation of clusters of several particles, the free volume generated from interparticle spaces decreases, leading to the reduction in overall porosity and an increase in the refractive index. The impact of clustering on refractive index is enhanced with prolonged milling because the size of particles increases, thus further decreasing the overall porosity due to interparticle spaces.
The rms surface roughness of the films was measured and the values are displayed in
Table 2. Pure Nb
2O
5 films and films doped with 1% Na-X zeolites have similar roughness, while the addition of 5% zeolites leads to a slight increase. The milling duration does not influence the film roughness.
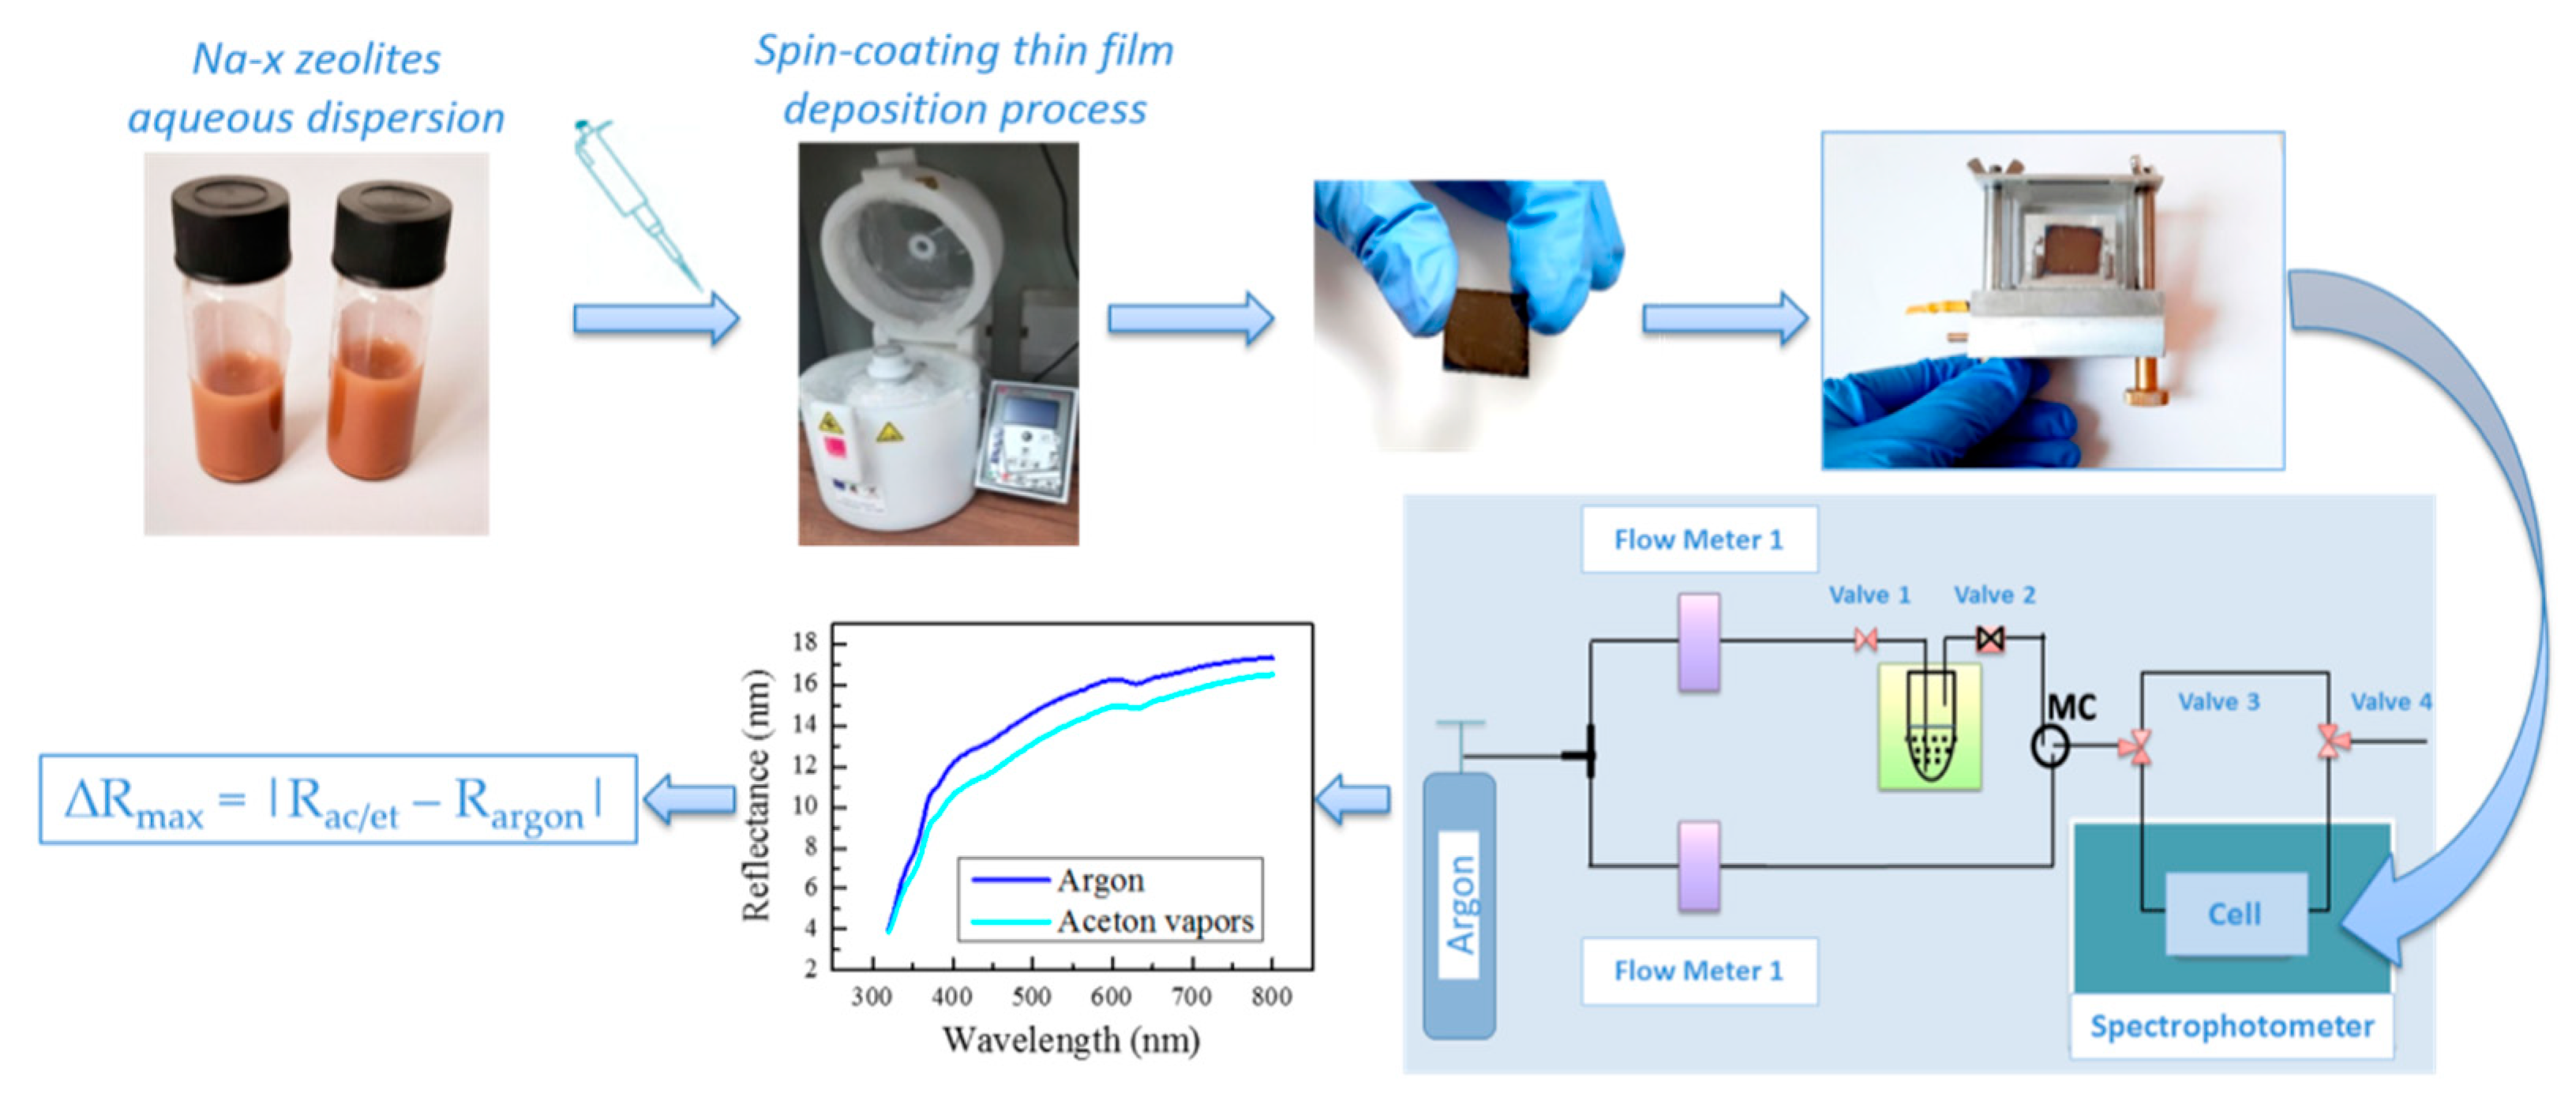
3.4. Sensing Experiments
VOCs’ vapors sensing experiments were conducted using a homemade bubbler system for the generation of acetone and ethanol vapors from liquid. Samples were placed in a cell where the atmosphere can be controlled and changed from argon to ethanol or acetone vapors. In order to evaluate the sensitivity and selectivity of the thin films, reflectance spectra were measured before and during exposure to acetone or ethanol vapors. Calculated changes in reflectance ∆
Rmax = |
Rac/et −
Rargon| induced as a result of exposure to acetone and ethanol vapors are shown in
Figure 7a,b, respectively. The exposure of the composite film to acetone/ethanol results in vapor condensation in the zeolite pores and replacement of the air inside with acetone/ethanol with a higher refractive index. As a result, the effective refractive index of the film increases, thus leading to a change in the reflectance spectra and increase in ∆
Rmax.
For acetone vapors, the same dependence of the reflectance change ∆
Rmax on the milling time is clearly observed for both zeolite concentrations. The greatest change is obtained for films doped with zeolites milled for 120 s, and the smallest for 540 s (
Figure 7a). There is a very weak concentration dependence of ∆
Rmax when zeolites are milled for 60 s and 540 s. However, when the milling time is 120 s, there is a strong concentration dependence of reflectance change; that is, ∆
Rmax for heavily doped sample is 1.6%, thus being almost four times higher than the response of the lightly doped one, which is 0.4%. We may conclude that there are optimal conditions under which the reaction to acetone vapors is the greatest, depending on the concentration of zeolites, their size, and the milling time. It is seen from
Table 1 that the pore volumes V
total, V
micro, and V
meso as well as the specific surface area S
BET and the area described by micro pores (S
micro) are the highest for zeolites milled for 120 s as compared with those milled for 60 s and 540 s. The biggest pore volumes along with the highest specific surface areas of Na-X
120 zeolites facilitate the vapor condensation and are the possible reason for the enhanced sensitivity observed for the Nb
2O
5/Na-X
120 sample. The deterioration of the sensitivity for a longer milling time (540 s) is most probably due to the decreased pore volumes and specific surface areas of Na-X
540 samples (
Table 1). Moreover, the data from optical characterization confirm that the overall porosity of this sample decreases. It is interesting to note that the pore volumes and specific surface areas of Na-X
60 zeolites are close to the values of Na-X
120, but the response of the Nb
2O
5/Na-X
60 films is lower as compared with the films consisting of Na-X
120 zeolites, and this is mostly pronounced in the case of heavily doped samples. Moreover, in this case, the refractive index on Nb
2O
5/Na-X
60 is lower as compared with Nb
2O
5/Na-X
120, which means more free volume exists in the sample. It seems that, although the overall porosity of the Nb
2O
5/Na-X
60 sample is higher, not all pores are accessible for the vapors, i.e., the dominating porosity in this sample is of the closed porosity type.
In order to study the selectivity, similar experiments were performed, but with ethanol vapors. The results for ∆
Rmax are summarized in
Figure 7b. It is seen that there is a significant decrease in films’ response to ethanol vapors as compared with acetone. The maximum value for ∆
Rmax achieved is 0.07% which is more than 20 times smaller than the response towards acetone vapors. This result clearly indicates the selectivity of Nb
2O
5/Na-X composite thin films toward acetone. As is well known, acetone has a rather extended electron charge cloud, as evidenced by a molecular diameter of 6.2 Å, while the diameter of ethanol molecules is 4.4 Å. As seen from
Table 1, the size of the pores is sufficient for both analyte molecules to penetrate. Favorable formation of reactive complexes between the ketones and the Brønsted acid sites into the zeolite framework via the proton exchange mechanism is widely used as a precursor stage for many organic reactions [
29]. However, ethanol could be also attached to the Brønsted acid sites, forming surface ethoxy species [
30]. Thus, the most likely reason for greater acetone reaction is the higher reactivity of the acetone molecules owing to their stronger polarizability [
31].
As mentioned above, the observed reflectance change when films are exposed to vapors is due to the increase of effective refractive index (Δ
n) of the composite films, which is a consequence of the condensation of vapors in the zeolite pores. For the calculation of Δ
n of each sample, a recently developed approach was used [
32]. It is based on fitting the discrepancies between calculated and measured values of Δ
Rmax. In this regard, a series of calculations of Δ
Rmax in the
n-
d plane were performed at fixed wavelength and different values of Δ
n. The latter was varied until the measured and calculated values of Δ
Rmax coincided at the point with coordinates (
n,
d) (
n,
d—refractive index and thickness of the film, respectively).
Figure 8 shows typical contour plots of calculated values of reflectance change Δ
Rmax for Nb
2O
5/Na-X
120 composite film as a function of the refractive index and thickness at a wavelength of 410 nm for three different values of Δ
n: 0.0442, 0.0444, and 0.0446. The particular value of wavelength for this sample is selected as a wavelength where Δ
R reaches its maximal value of 1.6%. It is seen from
Figure 8 that, for the Nb
2O
5/Na-X
120 composite film with
d = 37 nm and
n = 1.92 (at 410 nm), a match between measured and calculated Δ
Rmax is obtained for Δ
n = 0.0444 (
Figure 8b). When Δ
n is smaller (
Figure 8a, Δ
n = 0.0442) or higher (
Figure 8c, Δ
n = 0.0446), the point that represents the film deviates from the 1.6% contour line. This means that there is no a match between the measured and calculated Δ
Rmax values.
The calculated values of Δ
n using the contour plot approach are summarized in
Figure 8d and
Table 2. The observed dependences are similar to the dependences of Δ
Rmax presented in
Figure 7a. It is confirmed that composite films doped with 5% Na-X
120 zeolites exhibit the greatest absorption ability towards acetone vapors. Owing to condensation of vapors in the pores, the effective refractive index increases with 0.0444. It is interesting to note that these values are very close to Δ
n values of 0.048 obtained for mesoporous Nb
2O
5 thin films exposed to acetone vapors reported in [
33]. The porosity of the latter is about 50% and was generated using a commercial organic template [
33].
One possible way to enhance the sensitivity of a single film is to incorporate it in a multilayer structure. The latter could be, for example, a quarter-wavelength stack referred to as a Bragg stack. It consists of alternating films with a low and high refractive index. Because of the quarter-wavelength optical thickness of the layers, all multiple reflected waves are in phase and interfere constructively, generating a band of high reflectance. On the contrary, all multiple transmitted waves interfere destructively, causing the appearance of a low transmittance band (
Figure 9a). The spectral position of the bands depends on the optical thickness and a shift is observed if layers of the refractive index and/or thicknesses change (
Figure 9a).
In order to explore the possibility of utilization of Nb
2O
5/NaX
120 film as a building block for a vapor-responsive Bragg stack, we calculated the transmittance spectra in air and vapors of acetone of a theoretical Bragg stack with three, five, and seven layers (
Figure 9a), and compared ∆
T = |
Tac −
Targon| with the value for a single film (
Figure 9b). The modeled stacks comprise undoped Nb
2O
5 matrix as a layer with a high refractive index (
nH) and Nb
2O
5 doped with 5% Na-X
120 zeolites as a low refractive index layer (
nL). The exposure to acetone vapors (the acetone spectrum in
Figure 9a) is modelled by increasing of
nL with ∆
n = 0.0444 (this value is the change in the refractive index of Nb
2O
5/NaX
120 film calculated using the contour plot approach described above). A gradual increase in ∆
T with the number of the layer in the stack is obtained and an enhancement with a factor of more than 4 is achieved when a seven-layer stack is considered (
Figure 9b). The benefit of the multilayer structure is very well distinguished, especially if one compares ∆
T values for single-layer and three-layers stacks. The latter consists of an Nb
2O
5/NaX
120 composite layer stacked between two Nb
2O
5 films; therefore, the sensitive medium is the same for single layer and three-layer stacks. However, ∆
T increases from 1.5% to 2.2%, i.e., a 50% increase in ∆T is obtained if the sensitive Nb
2O
5/NaX
120 composite layer is incorporated between two Nb
2O
5 layers (
Figure 9b).
The next step in our investigation was to study the possibility of using the composite films for color sensing. Color sensing is a simple method for vapors’ detection and it is based on perceptual color change due to the presence of analyte. If a transparent film is deposited on an opaque substrate (silicon wafer, in our case), it exhibits a certain color depending on its optical thickness (the physical thickness multiplied by the refractive index). If thin film’s optical thickness changes due to the adsorption of vapors, the reflectance spectrum of the film will shift. As a result, the color of the film will change with the strength of the reflectance shift. The possibility of monitoring the color in response to different analytes is studied by calculating color coordinates CIE X and CIE Y of the thin films doped with zeolites prior to and during exposure to acetone vapors. The calculated color coordinates CIE X and CIE Y of a single Nb
2O
5/Na-X
120 film and theoretically modeled five-layer Bragg stack comprising Nb
2O
5 as a high refractive index layer and Nb
2O
5/Na-X
120 as a low refractive index layer are plotted in
Figure 10. In the case of a single film, reflectance spectra prior to and during analyte exposure are used for calculation, while for Bragg stack, the modelled transmittance spectra are used.
Each point on the CIE plot represents the color of the sample prior to and during exposure to acetone vapors. For single Nb2O5/Na-X120 deposited on silicon substrate, the two points are close to each other, which means the change in the color due to exposure to the analyte is not so distinct. However, the two points do not overlap, i.e., they are separated in the color space, thus enabling color detection of acetone vapors. The picture improves substantially if a Bragg stack is implemented for color sensing instead of a single film. It is seen that, in this case, the two points are well separated in the CIE color space, which confirms the possibility of successful application of FA zeolites for color sensing of acetone vapors.


 ,
, 


