Article

Synthesis of Titanium Nitride Nanoparticles by Pulsed Laser Ablation in Different Aqueous and Organic Solutions

by
Anton A. Popov
1,*,
Gleb V. Tikhonowski
1,
Pavel V. Shakhov
1,
Elena A. Popova-Kuznetsova
1,
Gleb I. Tselikov
2,
Roman I. Romanov
1,
Andrey M. Markeev
2,
Sergey M. Klimentov
1 and
Andrei V. Kabashin
3,*
1
National Research Nuclear University MEPhI, 115409 Moscow, Russia
2
Center for Photonics and 2D Materials, Moscow Institute of Physics and Technology, 141700 Dolgoprudny, Russia
3
Laboratory LP3, Campus de Luminy, Aix-Marseille University, CNRS, 13288 Marseille, France
*
Authors to whom correspondence should be addressed.
Nanomaterials 2022, 12(10), 1672; https://doi.org/10.3390/nano12101672
Submission received: 1 May 2022 / Revised: 10 May 2022 / Accepted: 12 May 2022 / Published: 13 May 2022
(This article belongs to the Section Biology and Medicines)

Abstract

:
Owing to a strong photothermal response in the near-IR spectral range and very low toxicity, titanium nitride (TiN) nanoparticles (NPs) synthesized by pulsed laser ablation in liquids (PLAL) present a novel appealing object for photo-induced therapy of cancer, but the properties of these NPs still require detailed investigation. Here, we have elaborated methods of femtosecond laser ablation from the TiN target in a variety of liquid solutions, including acetonitrile, dimethylformamide, acetone, water, and H2O2, to synthesize TiN NPs and clarify the effect of liquid type on the composition and properties of the formed NPs. The ablation in all solvents led to the formation of spherical NPs with a mean size depending on the liquid type, while the composition of the NPs ranged from partly oxidized TiN to almost pure TiO2, which conditioned variations of plasmonic peak in the region of relative tissue transparency (670–700 nm). The degree of NP oxidation depended on the solvent, with much stronger oxidation for NPs prepared in aqueous solutions (especially in H2O2), while the ablation in organic solvents resulted in a partial formation of titanium carbides as by-products. The obtained results contribute to better understanding of the processes in reactive PLAL and can be used to design TiN NPs with desired properties for biomedical applications.

1. Introduction

Titanium nitride (TiN) combines properties of covalent compounds, such as high mechanical and thermal stability, with metallic characteristics such as high thermal and electric conductivity [1]. TiN nanoparticles (NPs) have recently gained a huge boost of attention as an alternative plasmonic nanomaterial [2,3,4]. While the nanostructures of conventional plasmonic metals (silver, gold) exhibit their absorption/scattering resonance feature in ultraviolet (around 410 nm) and visible (around 520–550 nm), respectively, TiN NPs can provide a red-shifted plasmonic feature (around 670–700 nm) with a long tail over 800 nm [5,6], matching the window of relative tissue transparency (650–900 nm), which promises attractive biomedical applications [7,8]. Furthermore, TiN NPs predominantly dissipate absorbed electromagnetic energy into heat [6], which favors the use of these NPs in the photothermal therapy (PTT) of cancer. However, the synthesis of TiN NPs for biomedical applications is difficult within conventional chemical or plasma routes, as they are often contaminated by toxic byproducts, have a broad size and shape distribution, and are not easily water-dispersible. Indeed, chemical methods include reduction-nitridation reactions [9,10] employing hazardous reagents, which could cause toxicity issues. On the other hand, alternative physical methods [11,12] result in the production of TiN NPs in the form of dry powders. Therefore, similar wet chemistry steps are typically required to stabilize the colloidal solutions of these NPs.
Pulsed laser ablation in liquids (PLAL) is a low-cost and scalable method for the synthesis of stable colloidal solutions of bare (ligand-free) NPs [13,14]. In this method, a piece of solid material (a target) submerged into a liquid is irradiated by focused pulsed laser radiation. The laser-matter interaction results in “natural” production of NPs, which form colloidal NP solutions. Ultrashort laser ablation (femtosecond (fs) or picoseconds (ps)) has demonstrated the most efficient control of NPs among PLAL methods [14]. As an example, we used an fs laser-ablative technique to synthesize solutions of a variety of low size-dispersed nanomaterials, including Au [15,16], Si [17], and Bi [18] NPs. Recently, we adapted this technique for the synthesis of bare TiN NPs [19], which look extremely promising for biomedical applications due to high safety profiles both in vitro and in vivo [19,20]. We also demonstrated that the laser-synthesized TiN NPs are able to initiate the efficient photothermal destruction of cancer cells [19] and have a strong non-linear photoacoustic response, which can be used as an additional imaging channel [21].
It should be noted that PLAL is a very flexible technique, which can result in the formation of NPs with various chemical compositions from a single ablation target. This composition tuning can be achieved by ablation in liquids of different chemical origin. For example, PLAL of a metallic Cu target in water or H2O2 leads to the formation of Cu/CuO or Cu/CuO2 NPs, respectively [22]. As another example, the PLAL of metallic Ti target in different liquid ambient can lead to the formation of different compounds, including TiO2 [23], various titanium suboxides, TiOx (0 < x < 2), titanium carbides, TiC [24], and oxycarbides, TiCxOy [25]. In this context, one can expect similar compositional effects for TiN nanostructures under their laser-ablative synthesis in different liquid ambient, which could be used to obtain favorable surface chemistry and optical properties of formed NPs.
In this work, for the first time we systematically studied the effect of liquid ambient on the properties of TiN-based NPs synthesized by PLAL. To address the issue, we carried out experiments on the laser ablation of TiN target in five different liquid ambients, namely H2O2, water, acetone, dimethylformamide (DMF), and acetonitrile. We then systematically analyzed synthesized NPs using scanning electron microscopy (SEM), energy dispersive X-ray (EDX) spectroscopy, X-ray photoelectron spectroscopy (XPS), and spectrophotometry. Special attention was paid to the analysis of EDX data, for which we developed a statistical approach to account for variations of EDX signals from the NPs. The experimental data was carefully evaluated and discussed to clarify the effect of liquid ambient on the chemical composition and properties of the synthesized NPs. The presented results provide new insights into the processes that occur during reactive PLAL, and can be used to design TiN NPs with desired properties for various applications.

2. Materials and Methods

2.1. NPs Synthesis

To synthesize NPs, we used methods of pulsed laser ablation in liquids. A hot-pressed TiN target (1 × 20 × 20 mm plate, 99.5% purity, Girmet, Moscow, Russia) was fixed vertically in a 20 ml optical (ablation) cuvette. The target was irradiated horizontally by a laser beam from a Yb: KGW femtosecond laser (270 fs, 1030 nm, 30 uJ, 100 kHz, TETA-10, Avesta, Moscow, Russia) through a side wall of the ablation cuvette. The thickness of the liquid layer between the entrance glass of the cuvette and the surface of the ablation target was 3 mm. The laser beam was focused by a 100 mm working distance F-theta objective on the surface of the target. The lens–cuvette distance was 95–97 mm, while the exact value was adjusted independently for each liquid to ensure the highest productivity of the laser ablative synthesis. The laser beam was moved (scanned) along a spiral pattern on the target surface at the scanning velocity of 4 m/s using a galvanometric scanner. The duration of the ablation process was 10 min. The synthesis was performed in a series of liquids (Figure S1), namely: Acetone, DMF, acetonitrile, water, and hydrogen peroxide (H2O2). The obtained colloidal solutions were collected after the synthesis and examined without any additional post-processing.

2.2. NPs Characterization

Concentrations of NPs were determined by atomic absorption technique (AAS) using a MGA-1000 spectrometer (Lumex, Saint Petersburg, Russia), which provided information about the mass of Ti in the samples. Calibration of the spectrometer was performed using Ti standard calibration sample (Russian state standard sample #8464-2003). For measurements, colloidal solutions of NPs prepared by laser ablation were diluted 50,000-fold in 5% nitric acid. 20 uL of the final solution was measured three times, and the results were averaged. A complete temperature program for measurements is shown in Supplementary Materials Table S1.
Surface chemical states of the synthesized NPs were analyzed by X-ray photoelectron spectroscopy (XPS) using a Theta Probe tool (Thermo Scientific) under high-vacuum conditions using a monochromatic Al-Kα X-ray source (1486.6 eV). XPS spectra were measured using fixed analyzer transmission mode at 50 eV pass energy. The calibration was carried out by the C 1s peak centered at 284.5 eV.
Size, morphology, and semi-quantitative chemical composition of the synthesized NPs were measured by scanning electron microscopy (SEM) using an MAIA-3 electron microscope (Tescan, Brno, Czech Republic), equipped with energy dispersive X-ray (EDX) detector X-Act (Oxford Instruments, Abington, UK). SEM images were obtained at 30 keV accelerating voltage, while EDX spectra were collected at 20 keV. Samples for both SEM and EDX measurements were prepared by dropping 2 uL of colloidal solutions onto cleaned monocrystalline Si substrate, which was subsequently dried at ambient conditions.
Optical extinction spectra were measured using a PSI-MC 2 spectrophotometer (Sol Instruments, Minsk, Belarus) in glass cuvettes having 10 mm optical path length.

2.3. EDX Data Processing

To measure EDX spectra and obtain semi-quantitative information about the chemical composition of the synthesized NPs, we developed a deconvolution procedure, which included the following major steps, as shown in Figure S2. First, a background EDX spectrum obtained at a region free from NPs was subtracted from the experimental EDX spectrum obtained from a group of NPs (Figure S2A–C). Then, the background-corrected experimental spectrum was fitted with the Ti spectrum using K α and K β lines of Ti, centered around 4.5 and 4.9 keV (Figure S2D). This procedure enabled us to scale the reference Ti spectrum to the experimental one. Subsequently, we subtracted L lines of the Ti spectrum (which span from 0.26 to 0.55 keV) from the experimental spectrum (Figure S2E). This was necessary, because the L lines of Ti largely overlap with the EDX spectra of C (spanning from 0.16 to 0.36 keV with the center at 0.27 keV), N (spanning from 0.27 to 0.5 keV with the center at 0.39 keV), and O (spanning from 0.36 to 0.64 keV with the center at 0.52 keV). Finally, the spectral region from 0.16 to 0.64 keV was fitted with C, N, and O spectra (Figure S2F). At least 10 different points were measured on each sample, and peak intensities were averaged for each chemical element.
A special sample preparation procedure was applied to measure the reference spectrum from the TiN target. The sample was prepared by mechanical grinding of the target into sub micrometer particles. The particles were then placed on a crystalline silicon wafer. The reference EDX spectrum was taken from particles, which had roughly the same volume as agglomerates of laser-synthesized TiN NPs, which were previously measured. This sample preparation procedure was applied to account for attenuation of the X-ray signal in the sample material, which could lead to significant underestimation of nitrogen content in bulk TiN samples.

3. Results and Discussion

3.1. Synthesis of Nanoparticles

We started our study by choosing a series of liquids (H2O2, water, DMF, acetone, acetonitrile), in which the TiN target was ablated. In this article, NPs synthesized in these liquids are referred to as H2O2-TiN, W-TiN, DMF-TiN, A-TiN, and AN-TiN NPs, respectively; however, it does not mean that composition of NPs was a stoichiometric TiN. The choice of liquids for the laser ablative synthesis was reasoned as follows. First, we used a pair of liquids, namely water and acetone, which were the most widely used for PLAL synthesis of TiN NPs in the literature [19,20,21]. Then, we used two nitrogen-containing liquids: one with an oxygen atom in its molecular composition (DMF) and the other without oxygen (acetonitrile). The rational for using these two liquids is based on the presence of nitrogen atoms in their chemical compositions, which could potentially preserve more nitrogen in the NPs composition and decrease their oxidation. This argument is supported by the fact that the alternative physical synthesis methods of TiN NPs include the treatment of titanium oxide particles in a nitrogen-rich atmosphere at elevated temperatures [26] and plasma-assisted routes in a nitrogen atmosphere [27]. Thus, at appropriate conditions, nitrogen could replace oxygen even in fully oxidized titanium NPs. At the same time, PLAL synthesis include stages (plasma stage and cavitation bubble stage), which contain products of solvent molecule decomposition [14] and involve high temperature and high pressure conditions. Therefore, we supposed that the use of nitrogen containing liquids in PLAL can provide conditions that are similar to conditions of alternative physical TiN NP synthesis routes. Thus, these liquids can potentially be favorable for higher yields of titanium nitrides, whereas the competing presence or absence of oxygen atoms in the liquid molecules (DMF or acetonitrile) could affect the oxidation process. We finally selected H2O2 as one of the most oxidizing liquids, which therefore should lead to the highest oxidation of the synthesized NPs for comparison reasons.
Laser ablation of the TiN target led to fast coloration of liquids in the ablation chamber, which indicated the formation of NPs. The color was dark blue, almost black, for all liquids except H2O2, for which the color was almost transparent with a light blue-green tint.

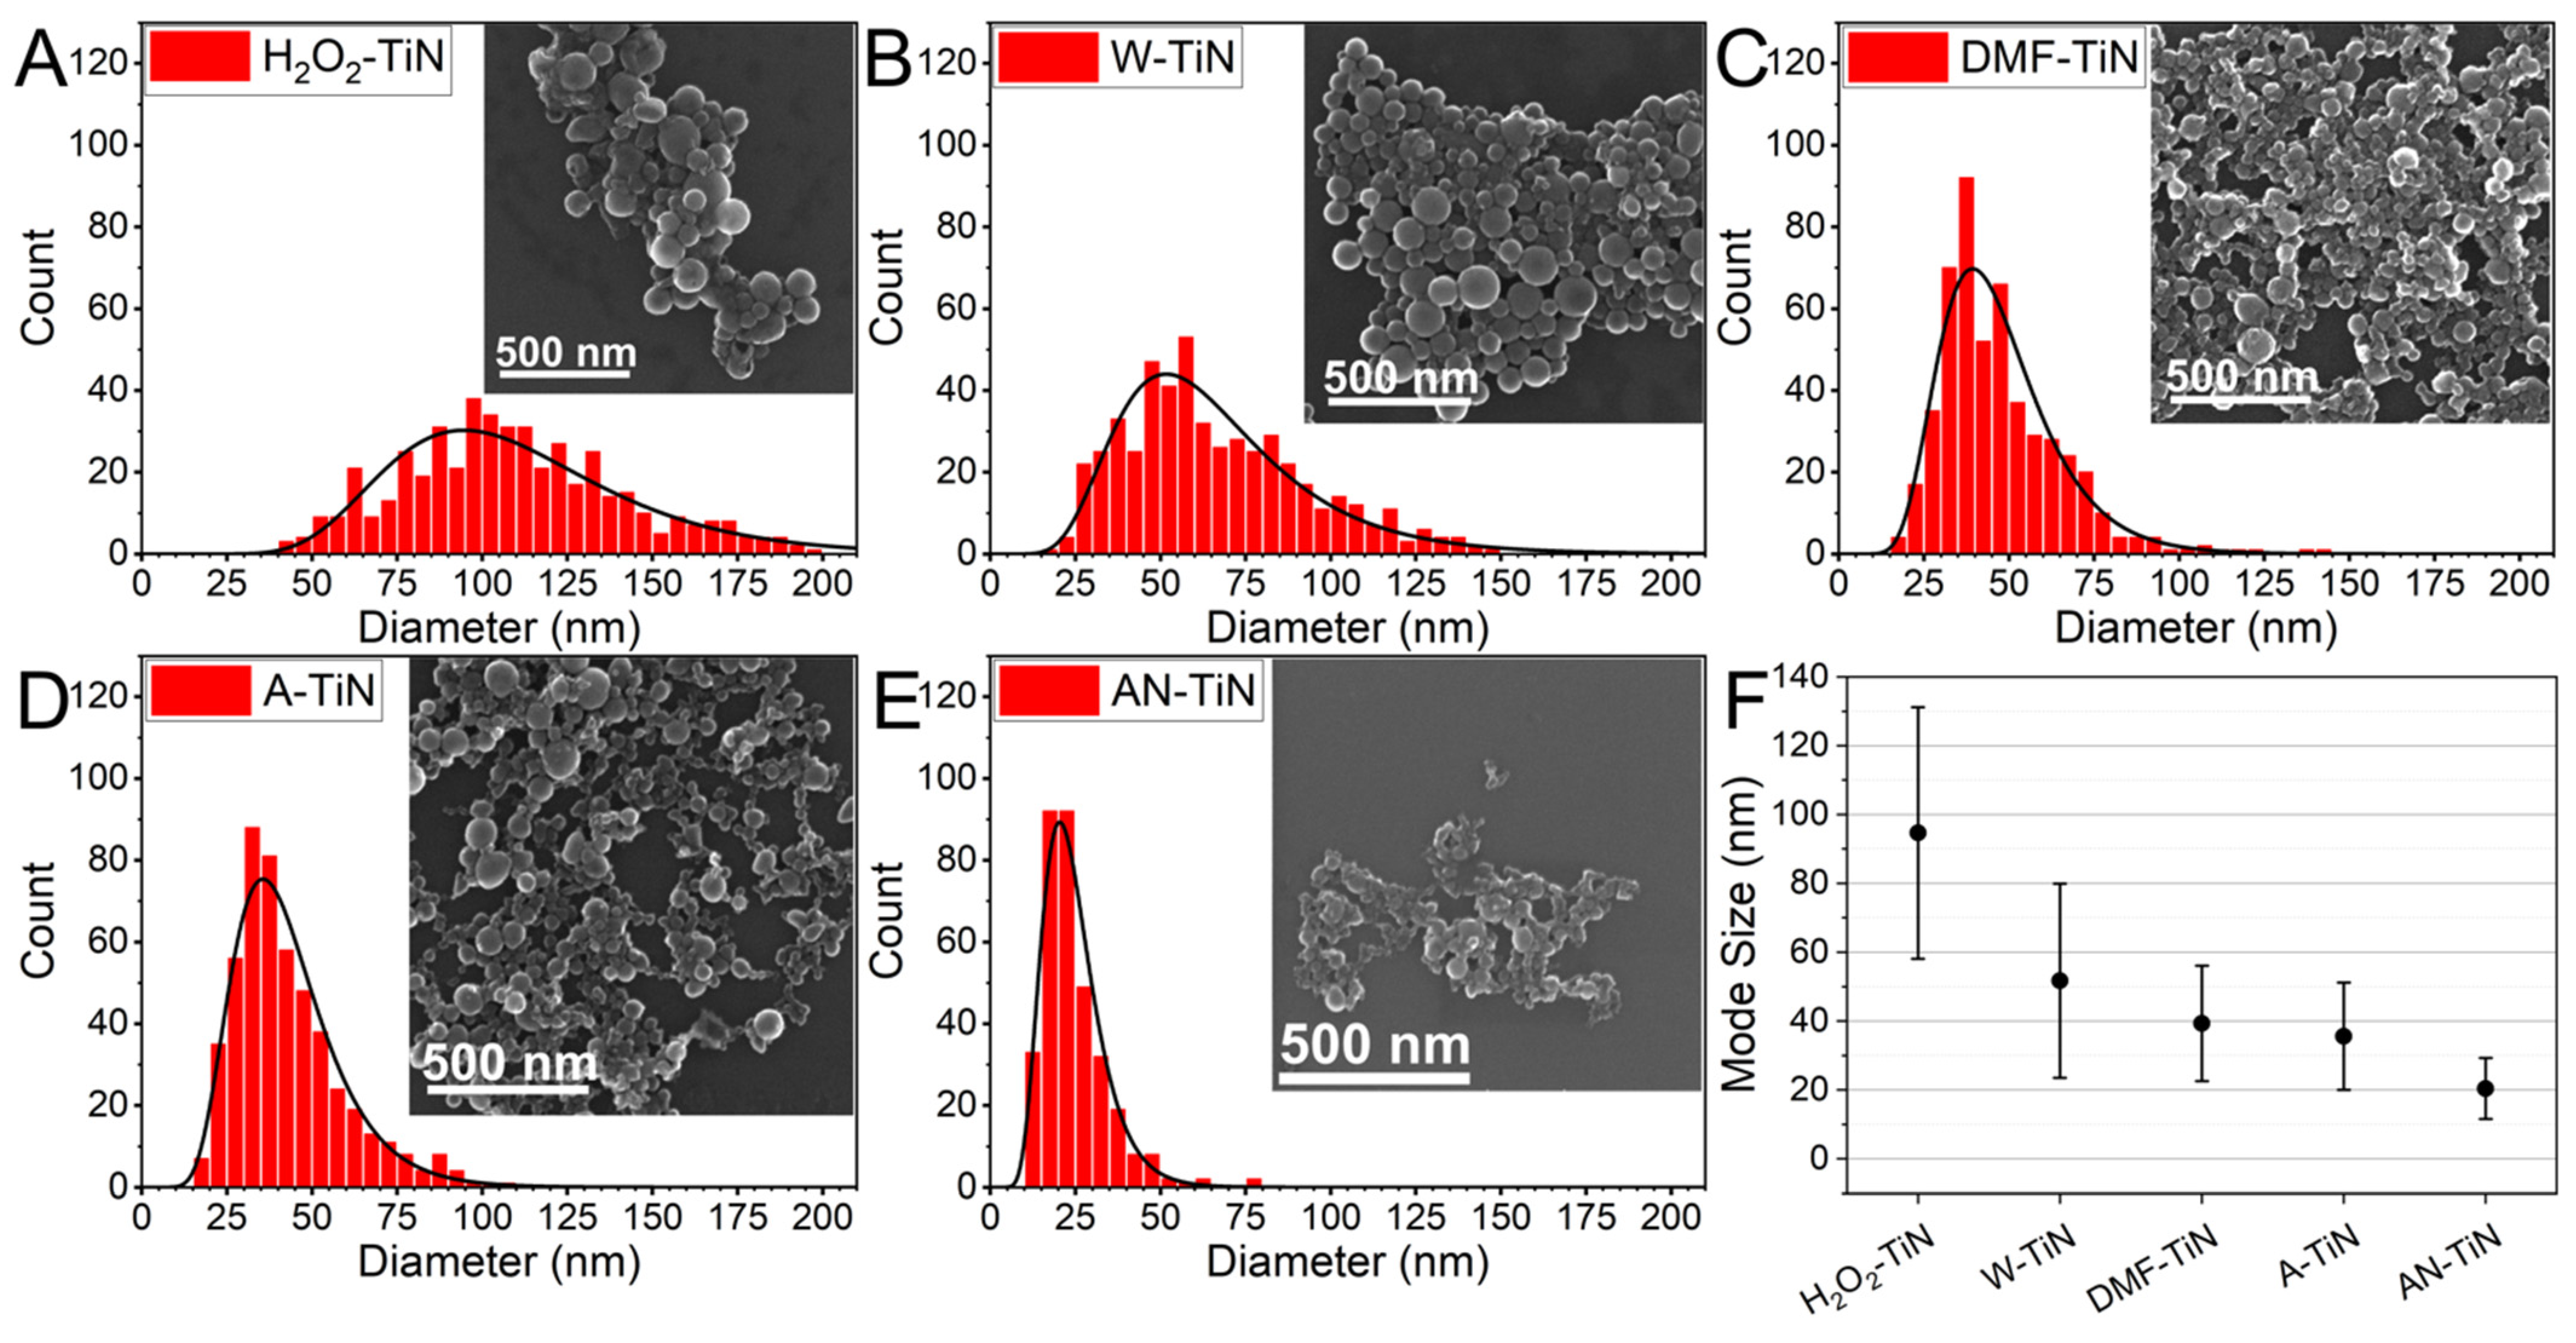
3.2. SEM Characterization

SEM imaging of the synthesized NPs revealed that the NPs had spherical morphology in all cases (Figure 1A–E). A significant number of H2O2-TiN NPs (up to 20–30%) had a morphology of ruptured shells, some characteristic images of which are shown in Figure S3. We already observed similar nanostructures in our previous studies [19,28] for NPs prepared by PLAL of TiN target in H2O2 and, to a lesser extent, in water; however, similar structures had never been observed in any organic solvents. A possible mechanism of the nano shell formation is discussed later in this article.
Statistical analysis of the SEM images showed that NP sizes were lognormally distributed, while the liquid ambient determined the mean size and the distribution width. Both values decreased as the liquids were replaced in the following sequence: H2O2–water–DMF–acetone–acetonitrile (Figure 1F and Table S2). The mean (modal) size of H2O2-TiN NPs was 95 nm, and some of the largest NPs were up to 200 nm, while the mean size of AN-TiN NPs was 20 nm, and almost no NPs exceeding 50 nm were observed. The tendency for the decrease of the NPs size in organic solvents could be explained by early capping of NPs formed just after the laser-target interaction, by solvent molecules, or by products of their decomposition similar to how it happens for other NPs synthesized by PLAL [14,29]. This explanation is indirectly supported by an amorphous carbon-containing matrix, which is often observed on SEM images of TiN NPs, synthesized in organic solvents, but not in water.

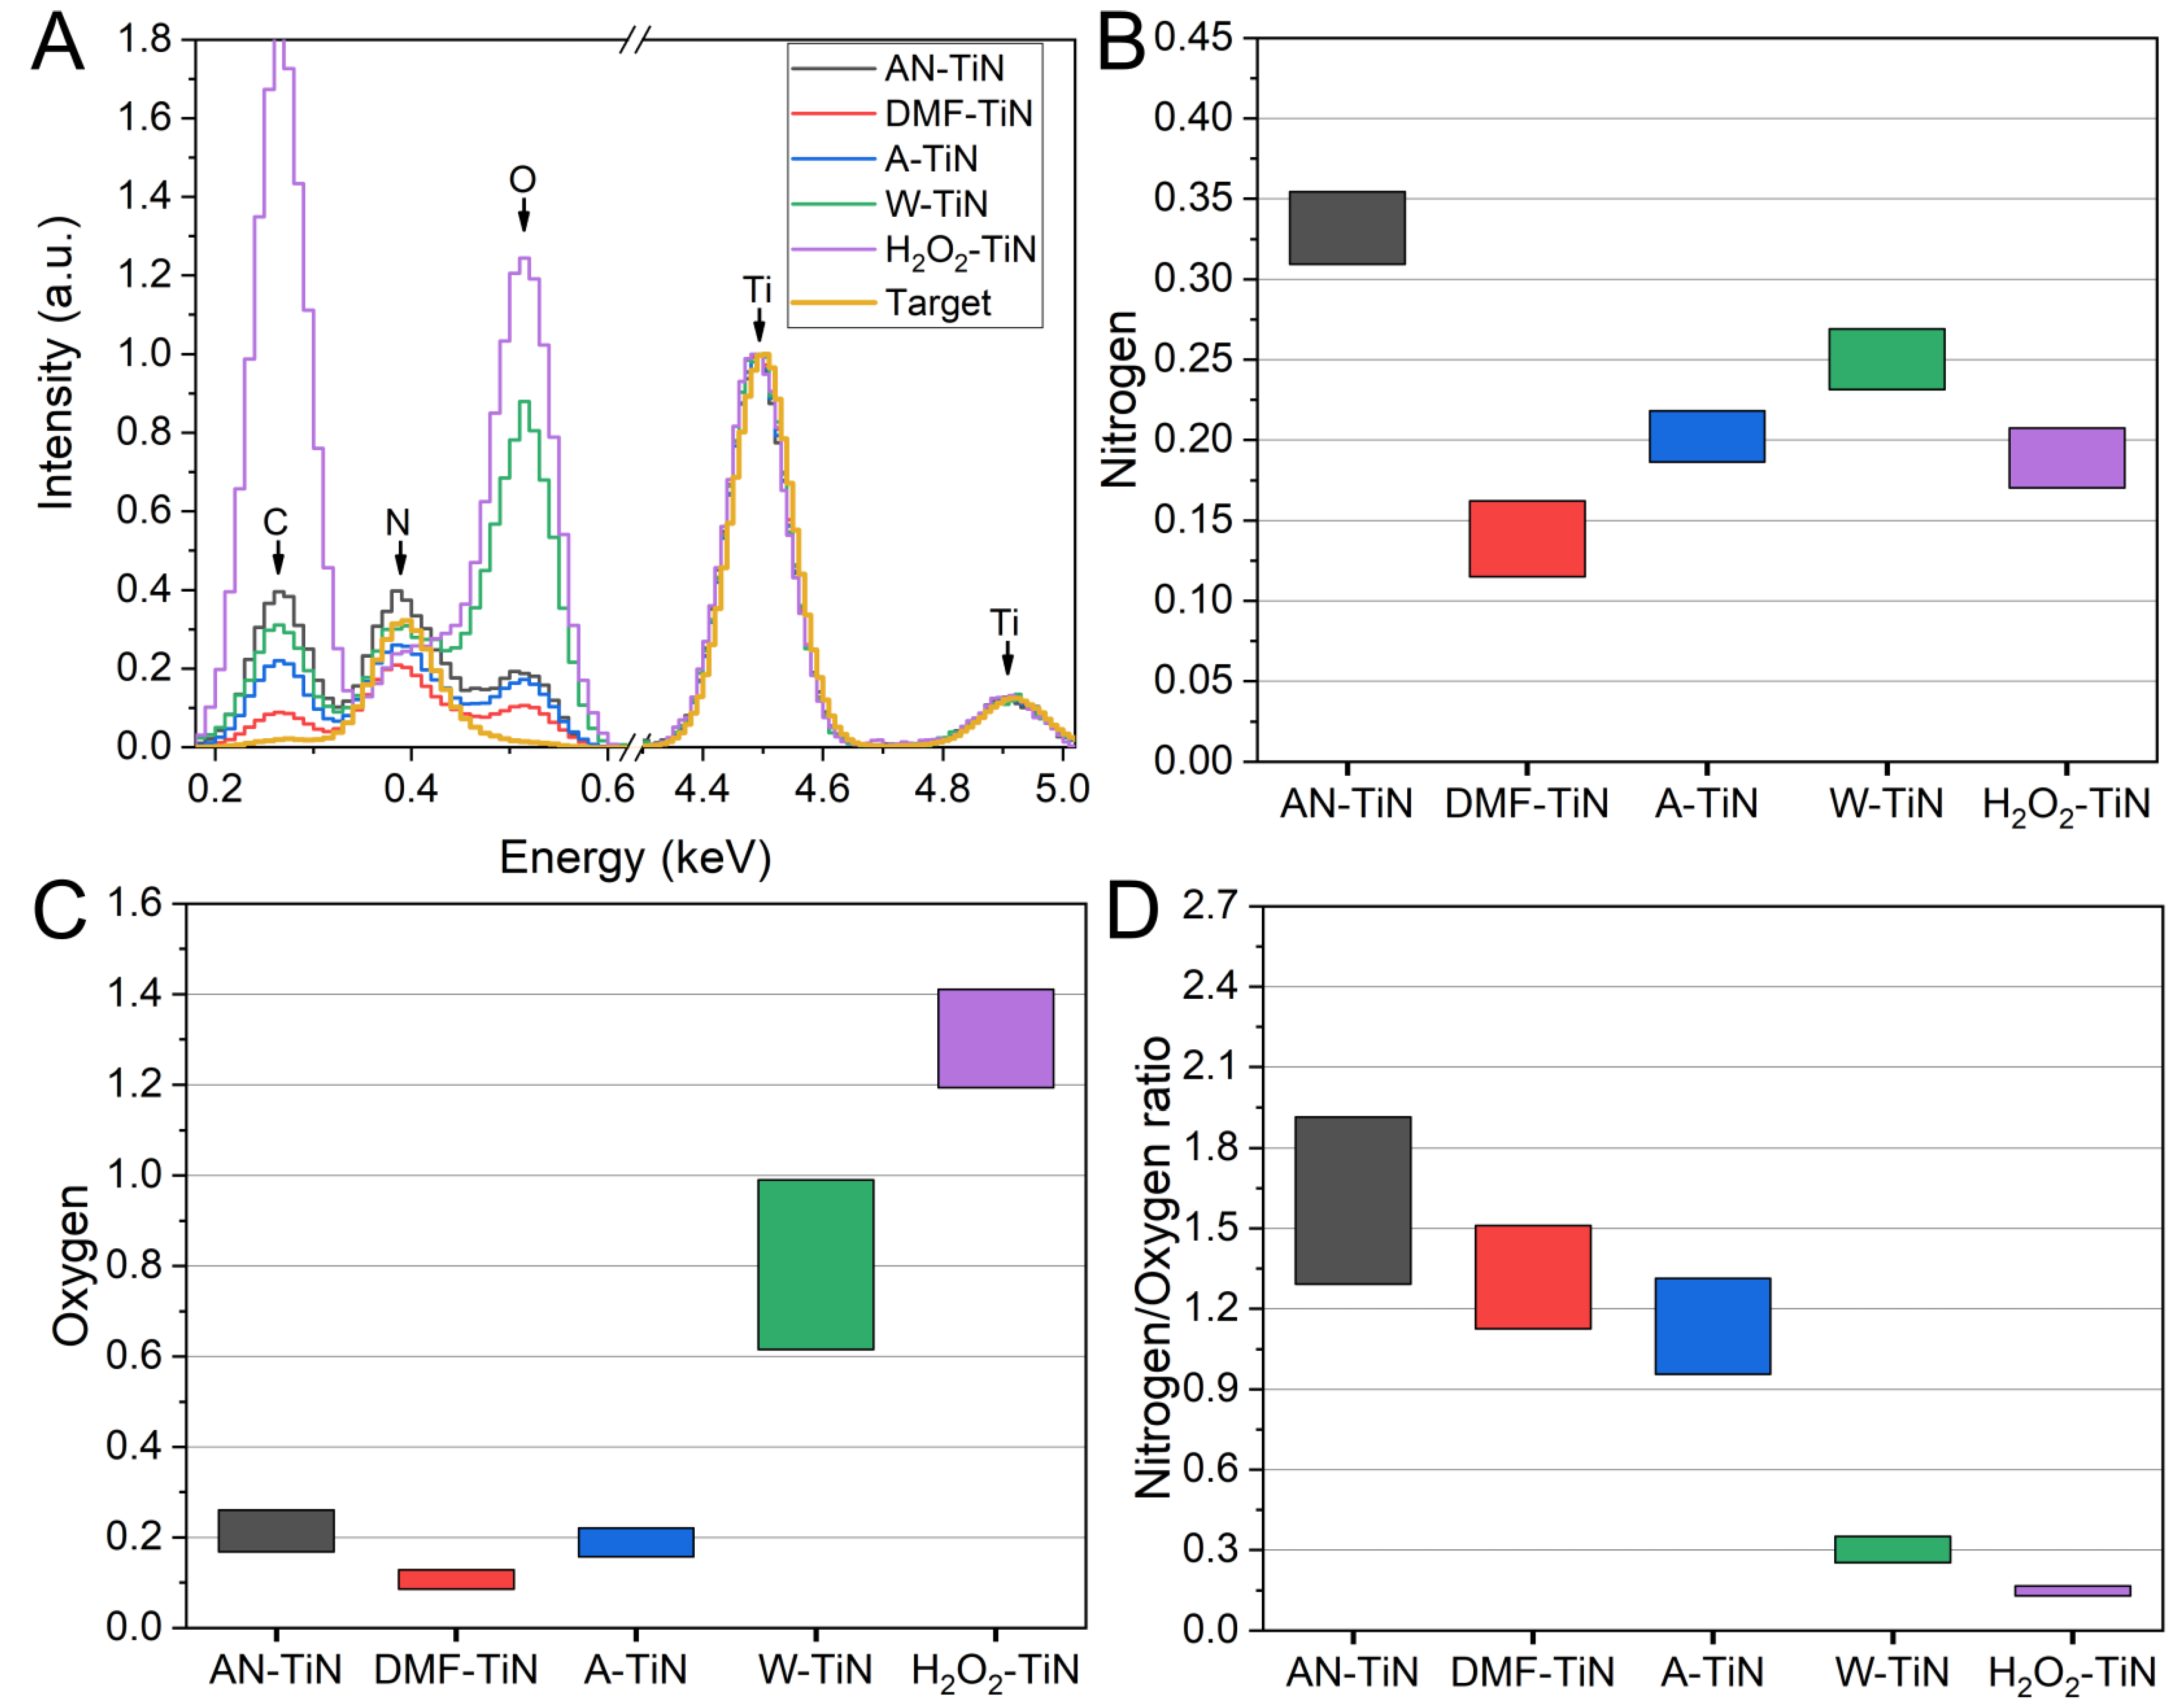
3.3. EDX Characterization

To study the chemical compositions of NPs, we developed a semi-quantitative statistical procedure to account for variations of EDX signals, which are often observed when NPs are measured. In this procedure, we first extracted data on the chemical elements of interest (titanium, nitrogen, oxygen, and carbon) and then statistically analyzed nitrogen and oxygen content normalized to titanium content in the NPs. The procedure details are described in the Materials and Methods section and in Figure S2.
Averaged EDX spectra of the NPs and an ablation target are shown in Figure 2A. As one can see, NPs synthesized in all liquids were oxidized, but the oxidation state was different. Indeed, AN-TiN, DMF-TiN, and A-TiN NPs were oxidized much weaker than H2O2-TiN and W-TiN NPs. Surprisingly, AN-TiN NPs had higher oxygen content than DMF-TiN NPs (and approximately equal oxygen content to A-TiN NPs), despite the absence of oxygen atoms in the molecular structure of acetonitrile. This result can be explained by a fast surface oxidation of the titanium nitride. Most of the TiN surface could be oxidized within several minutes, even at room temperature [30], while sample preparation procedure for the EDX measurements took several hours. Therefore, the surface of the analyzed NPs can be considered as almost fully covered by native oxides. Furthermore, AN-TiN NPs are almost two folds smaller than DMF-TiN or A-TiN NPs (Figure 1F), which means that AN-TiN NPs have a 4-fold large surface area. This could lead to overall higher oxygen signal from NPs prepared in acetonitrile due to the oxidation of a larger surface area. Another possible source of oxidation of AN-TiN NPs is atmospheric molecular oxygen dissolved in the acetonitrile, which could oxidize NPs during their formation by PLAL [29]. We tried to pump out the dissolved molecular oxygen O2 from the liquid by bubbling the liquids with N2 before and during the ablation process, but it did not lead to an increase of the nitrogen/oxygen ratio (data not shown).
Interestingly, the relative nitrogen signal from AN-TiN NPs was even higher than the nitrogen signal from the ablation target, which can be explained by the incorporation of nitrogen atoms from the decomposition of acetonitrile molecules into the NPs during the ablation process. However, the nitrogen content of DMF-TiN NPs was the lowest among all synthesized NPs, despite the presence of nitrogen in the molecular structure of DMF. Therefore, we suppose that the chemical state of nitrogen in the structure of liquid molecules appears to be an important factor for final composition of the laser-synthesized NPs. To further confirm this assumption, we performed PLAL of metallic Ti target in acetonitrile and DMF (AN-Ti NPs and DMF-Ti NPs, accordingly). The analysis of EDX spectra of the synthesized NPs (Figure S4) showed that AN-Ti NPs had several times higher nitrogen content than DMF-Ti NPs, which supports our assumption.
Figure 2B–D demonstrates statistical EDX information about nitrogen and oxygen and their ratio in NPs synthesized in different liquid ambients. As one can see, the main difference was in the amount of oxygen in the NP composition, while nitrogen signal level was more stable. NPs prepared in acetonitrile, DMF, and acetone had high (1.1–1.6) mean values of nitrogen/oxygen ratio with the highest value for AN-TiN NPs. At the same time, W-TiN and H2O2-TiN NPs had very low (0.15–0.3) nitrogen/oxygen values, which suggests that not only the surface, but also the core of the NPs was oxidized.

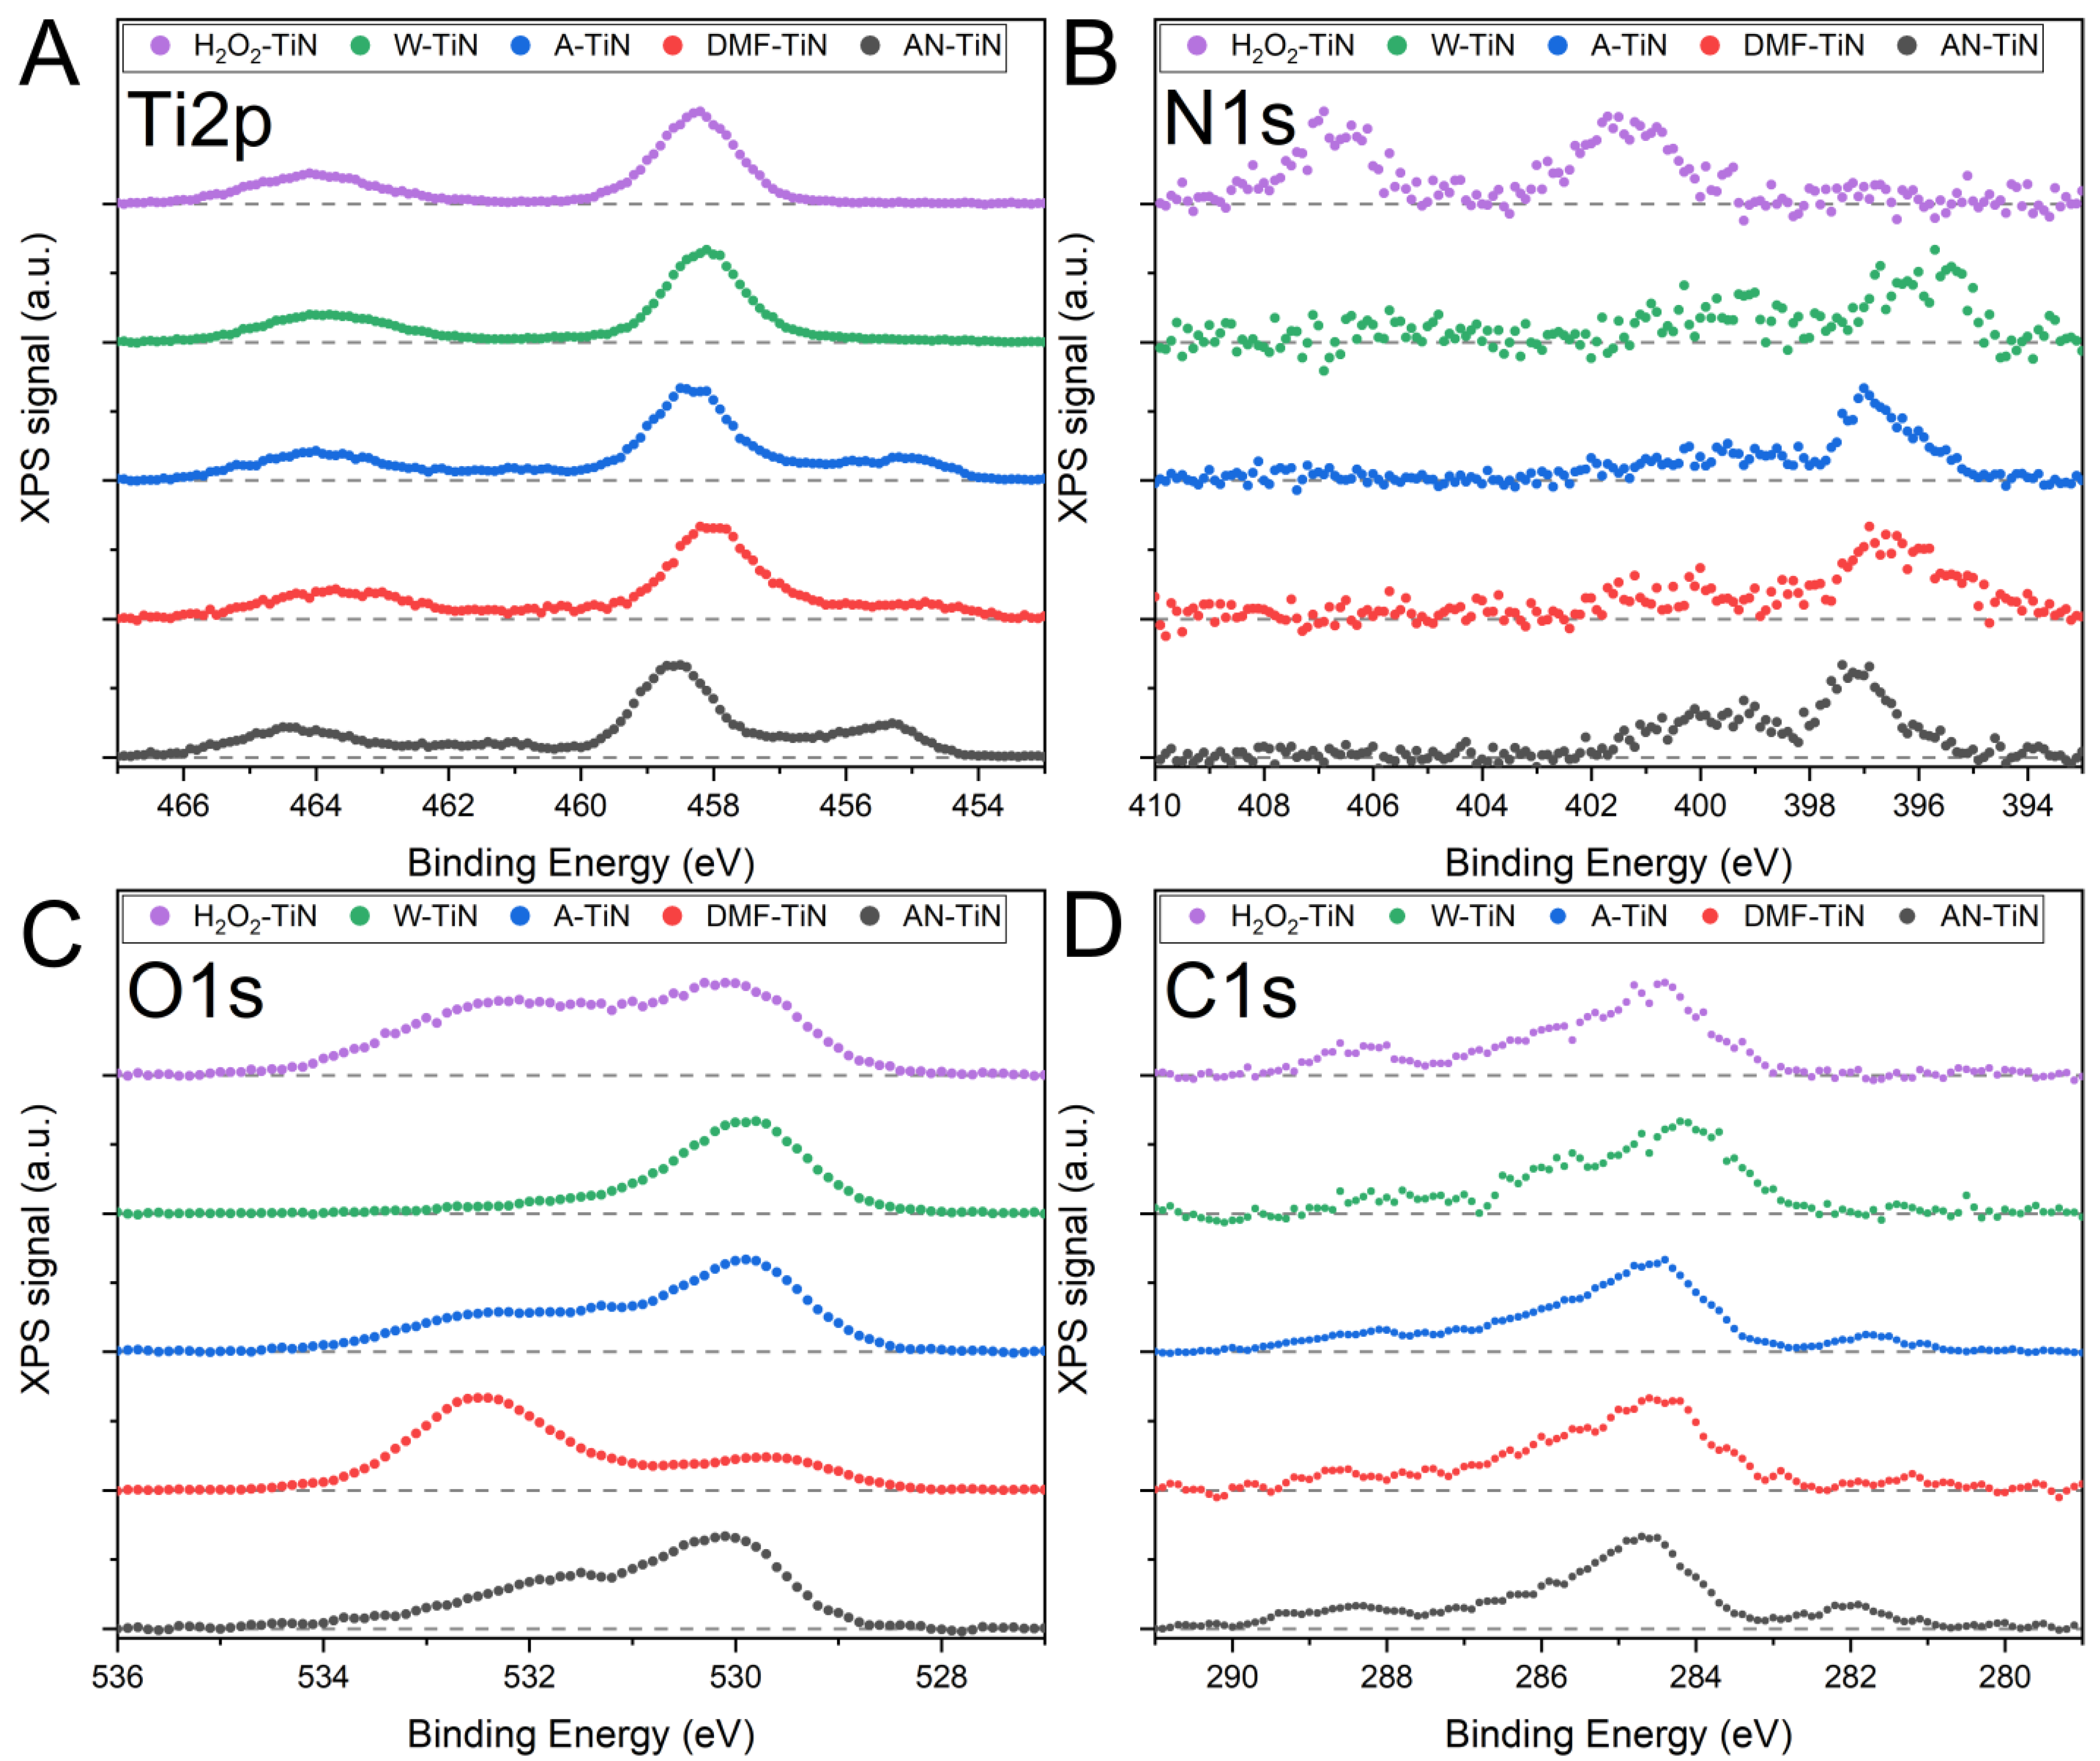
3.4. XPS Characterization

The surface chemistry of the synthesized NPs was studied by XPS. We measured binding energies of Ti 2p, N 1s, O 1s, and C 1s electrons. The obtained results are summarized in Figure 3 and in Table 1 and Table 2. A detailed deconvolution of XPS spectra is presented in Figure S5.
Table 1. Results of deconvolution of Ti 2p and N 1s XPS spectra of the synthesized NPs. Values in parenthesis represent alternative six-peak fit for W-TiN sample.
Ti 2p
BondSamplePeak Position, eVRelative Peak Intensity, %Reference
2p3/22p1/22p3/22p1/2
TiNAN-TiN455.44613415[27,31,32,33,34,35]
DMF-TiN454.9460.31613
A-TiN455.2460.82514
W-TiN(454.9)(459.8)(3)(7)
H2O2-TiN----
TiN, TiNOAN-TiN457.1463.3208[31,32,33,34,36]
DMF-TiN456.8462.82212
A-TiN457.1463.1199
W-TiN(456.9)(462.7)(9)(6)
H2O2-TiN----
TiO2AN-TiN458.6464.410026[33,37]
DMF-TiN458.146410026
A-TiN458.4464.210027
W-TiN458.246410029
H2O2-TiN458.2464.110031
N 1s
BondSamplePeak position, eVRelative peak intensity, %Reference
TiNAN-TiN397.1100[31,32,33,35,36]
DMF-TiN396.4100
A-TiN396.7100
W-TiN395.9100
H2O2-TiN--
TiNOAN-TiN399.853[31,32,33,35,36]
DMF-TiN399.630
A-TiN399.735
W-TiN399.647
H2O2-TiN--
N2, NOxAN-TiN--[33,38,39,40]
DMF-TiN--
A-TiN--
W-TiN--
H2O2-TiN401.4406.710090
The Ti 2p spectra of all samples (Figure 3) are dominated by a doublet of symmetrical peaks located at 458.3 ± 0.3 and 464.2 ± 0.2 eV. The positions of these peaks agree with literature values of Ti 2p3/2 and Ti 2p1/2 peaks of TiO2 [33,37]. For crystalline (anatase, rutile) TiO2, the intensity ratio of these peaks should be close to 100:50, while for amorphous titanium oxide it increases [33]. The values of this ratio for the synthesized NPs are between 100:26 and 100:31. Therefore, the analysis of XPS data suggests that the surface of NPs consists of predominantly amorphous TiO2. Note that the storage of H2O2-TiN NPs for several months leads to a reduction of the intensity ratio to almost 100:50 (Figure S6), which suggests that the surface TiO2 becomes more crystalline under aging.
Further deconvolution (Table 1, Figure S5) of the Ti 2p XPS spectra indicates the presence of two more doublets for AN-TiN, DMF-TiN, and A-TiN samples. Note that the Ti 2p XPS spectra of W-TiN, and especially H2O2-TiN, can be reasonably well fitted just by two peaks of TiO2 (Figure S5D,E first panel); however, the deconvolution of W-TiN NPs XPS spectra into six peaks gives a better fit (Figure S7). A very low (comparable to noise) intensity of TiN peaks confirms that the surfaces of W-TiN and H2O2-TiN NPs are almost completely oxidized. The first doublet at 455.1 ± 0.3 and 460.6 ± 0.8 eV is generally attributed to Ti 2p3/2 and Ti 2p1/2 of the Ti-N bond [27,33,34,35]. Note that the position of the TiN Ti 2p3/2 (and Ti 2p1/2 accordingly) varies for different samples (455.4 eV for AN-TiN, 454.9 eV for DMF-TiN, and 455.2 eV for A-TiN). Several reasons could explain these shifts. One of reasons can be related to the oxidation of the NP surface. Indeed, the influence of the native oxide on the position of TiN 2p3/2 peak was already mentioned in the literature [32,34]. As another reason, the shifts in the position of the TiN 2p3/2 could be due to the sub-stoichiometric nature of TiN in the synthesized NPs. Indeed, Porte et al. [34] studied sub-stoichiometric TiNx (0.5 < x < 1) and found that the position of the peak can shift by up to ~0.6 eV under the change of stoichiometry from TiN0.5 to TiN. At the same time, it is very likely that NPs produced by PLAL of the TiN target can have a sub-stoichiometric nature, and this could be a reason for the shifts of the TiN 2p3/2 peak position.
The value of intensity ratio of Ti 2p3/2 peaks of TiN (455.1 eV) and TiO2 (458.3 eV) can be used as a qualitative measure of relative abundance of surface titanium nitrides and oxides. The increase of this value means the increase in abundance of surface titanium nitrides over oxides. This intensity ratio increases 3% for W-TiN NPs (unreliable fit) to 34% for AN-TiN NPs, while no TiN peak can be found for H2O2-TiN NPs at all. This data suggests that AN-TiN NPs have the highest relative abundance of TiN bonds near the surface. Note that this doublet could also be attributed to the formation of TiC [41]. The last doublet of intermediate peaks centered at 457.0 ± 0.2 and 463 ± 0.3 eV is the most controversial. Some authors attribute them to titanium oxynitrides [33,36], while it was also demonstrated that these peaks could indicate sub-stochiometric titanium nitride [34].
The analysis of N 1s XPS spectra (Figure 3B and Table 1) demonstrate significant differences in XPS spectra between H2O2-TiN NPs and other types of NPs. AN-TiN, DMF-TiN, A-TiN, and W-TiN NPs demonstrate strong peak at 396.5 ± 0.6 eV and a smaller peak at 399.7 ± 0.1 eV (Figure S5). These peaks should be attributed to Ti-N bond and titanium oxynitride accordingly [33,35,36]. Note that the W-TiN NPs sample has very low intensity of the N 1s signal, while the position of its main peak is shifted to lower binding energies (395.9 eV). We believe that this can be attributed to TiNO rather than TiN [42]. The intensity ratio of Ti-N bond in N 1s level to TiO2 bond in Ti 2p3/2 level (11.2% for AN-TiN, 8.3% for DMF-TiN, 7.3% for A-TiN, and 1.7% for W-TiN) also demonstrates that AN-TiN NPs have the highest relative amount of surface nitrogen, while W-TiN NPs have the lowest amount. H2O2-TiN NPs have a completely different N 1s XPS spectrum. These NPs have two equally intense peaks at 401.4 and 406.7 eV. A possible origin of these peaks is adsorbed molecular N2 [33,38,39]. Another possible origin of these peaks is the formation of NOx bonds [40]. In any case, no Ti-N chemical bonds can be found for H2O2-TiN NPs.
The O 1s XPS spectra of the synthesized NPs can be fitted by three peaks (Figure 3C and Figure S5) centered at 529.8 ± 0.3, 531.4 ± 0.3, and 532.4 ± 0.2 eV, with the only exception of W-TiN NPs, in which O 1s XPS spectrum can be fitted by only two peaks (529.9 and 531.2 eV). The peak at 529.8 eV should be attributed to titanium oxide [33,36]. The origin of the peak at 531.4 is very controversial; it can be attributed to oxynitride [36] or OH- [37,39,43]. The peak at 533.4 should be attributed to H2O [39], which could appear from incomplete drying of samples.
We also analyzed C 1s XPS spectra because EDS data indicated the presence of carbon in the samples. Note that the carbon signal does not necessarily come from NPs but could originate from impurities during the sample preparation procedure (drying of liquid droplets) of from common contamination of vacuum chambers by organics. The C 1s XPS spectra of all synthesized NPs were mostly similar. The most prominent peaks were centered at 284.4 ± 0.3, 285.9 ± 0.3, and 288.3 ± 0.4 eV, which belong to C-C, C-O, and C=O bonds, respectively [44]. However, the C 1s XPS spectra of AN-TiN, DMF-TiN, and A-TiN NPs contain a peak centered at 281.7 ± 0.4 eV, which is absent in the spectra of W-TiN and H2O2-TiN NPs. The peak at 281.7 eV is generally attributed to inorganic carbides and therefore can be ascribed to the Ti-C bond [41]. The intensity ratio of N 1s peak at 396.5 eV (Ti-N bond) to the C 1s peak at 281.7 eV (Ti-C bond) is 1.36 for AN-TiN NPs, 1.41 for A-TiN NPs, and 2.28 for DMF-TiN NPs, which means that a significant amount of titanium carbides is formed (at least near the NPs surface) during PLAL in organic solvents.
The overall XPS analysis suggests that the surface of H2O2-TiN and W-TiN NPs consists primarily of amorphous TiO2 with an insignificant amount of Ti-N bonds for W-TiN NPs, while the surface of AN-TiN, DMF-TiN, and A-TiN NPs consist of titanium oxides, nitrides, carbides, and possibly oxynitrides.
Table 2. Results of deconvolution of O 1s and C 1s XPS spectra of the synthesized NPs.
O 1s
BondSamplePeak Position, eVRelative Peak Intensity, %Reference
TiO2AN-TiN530.1100[33,36]
DMF-TiN529.636
A-TiN529.9100
W-TiN529.9100
H2O2-TiN530100
NO, OHAN-TiN531.658[33,37,39,43]
DMF-TiN531.629
A-TiN531.221
W-TiN531.219
H2O2-TiN531.211
H2OAN-TiN533.211[33,37]
DMF-TiN532.6100
A-TiN532.343
W-TiN-
H2O2-TiN532.286
C 1s
TiCAN-TiN28225[41]
DMF-TiN281.213
A-TiN281.723
W-TiN--
H2O2-TiN--
CCAN-TiN284.7100[44]
DMF-TiN284.5100
A-TiN284.5100
W-TiN284.2100
H2O2-TiN284.5100
COAN-TiN286.236[44]
DMF-TiN286.146
A-TiN285.760
W-TiN285.853
H2O2-TiN286.145
C=OAN-TiN288.525
DMF-TiN288.621
A-TiN288.326[44]
W-TiN287.921
H2O2-TiN288.434

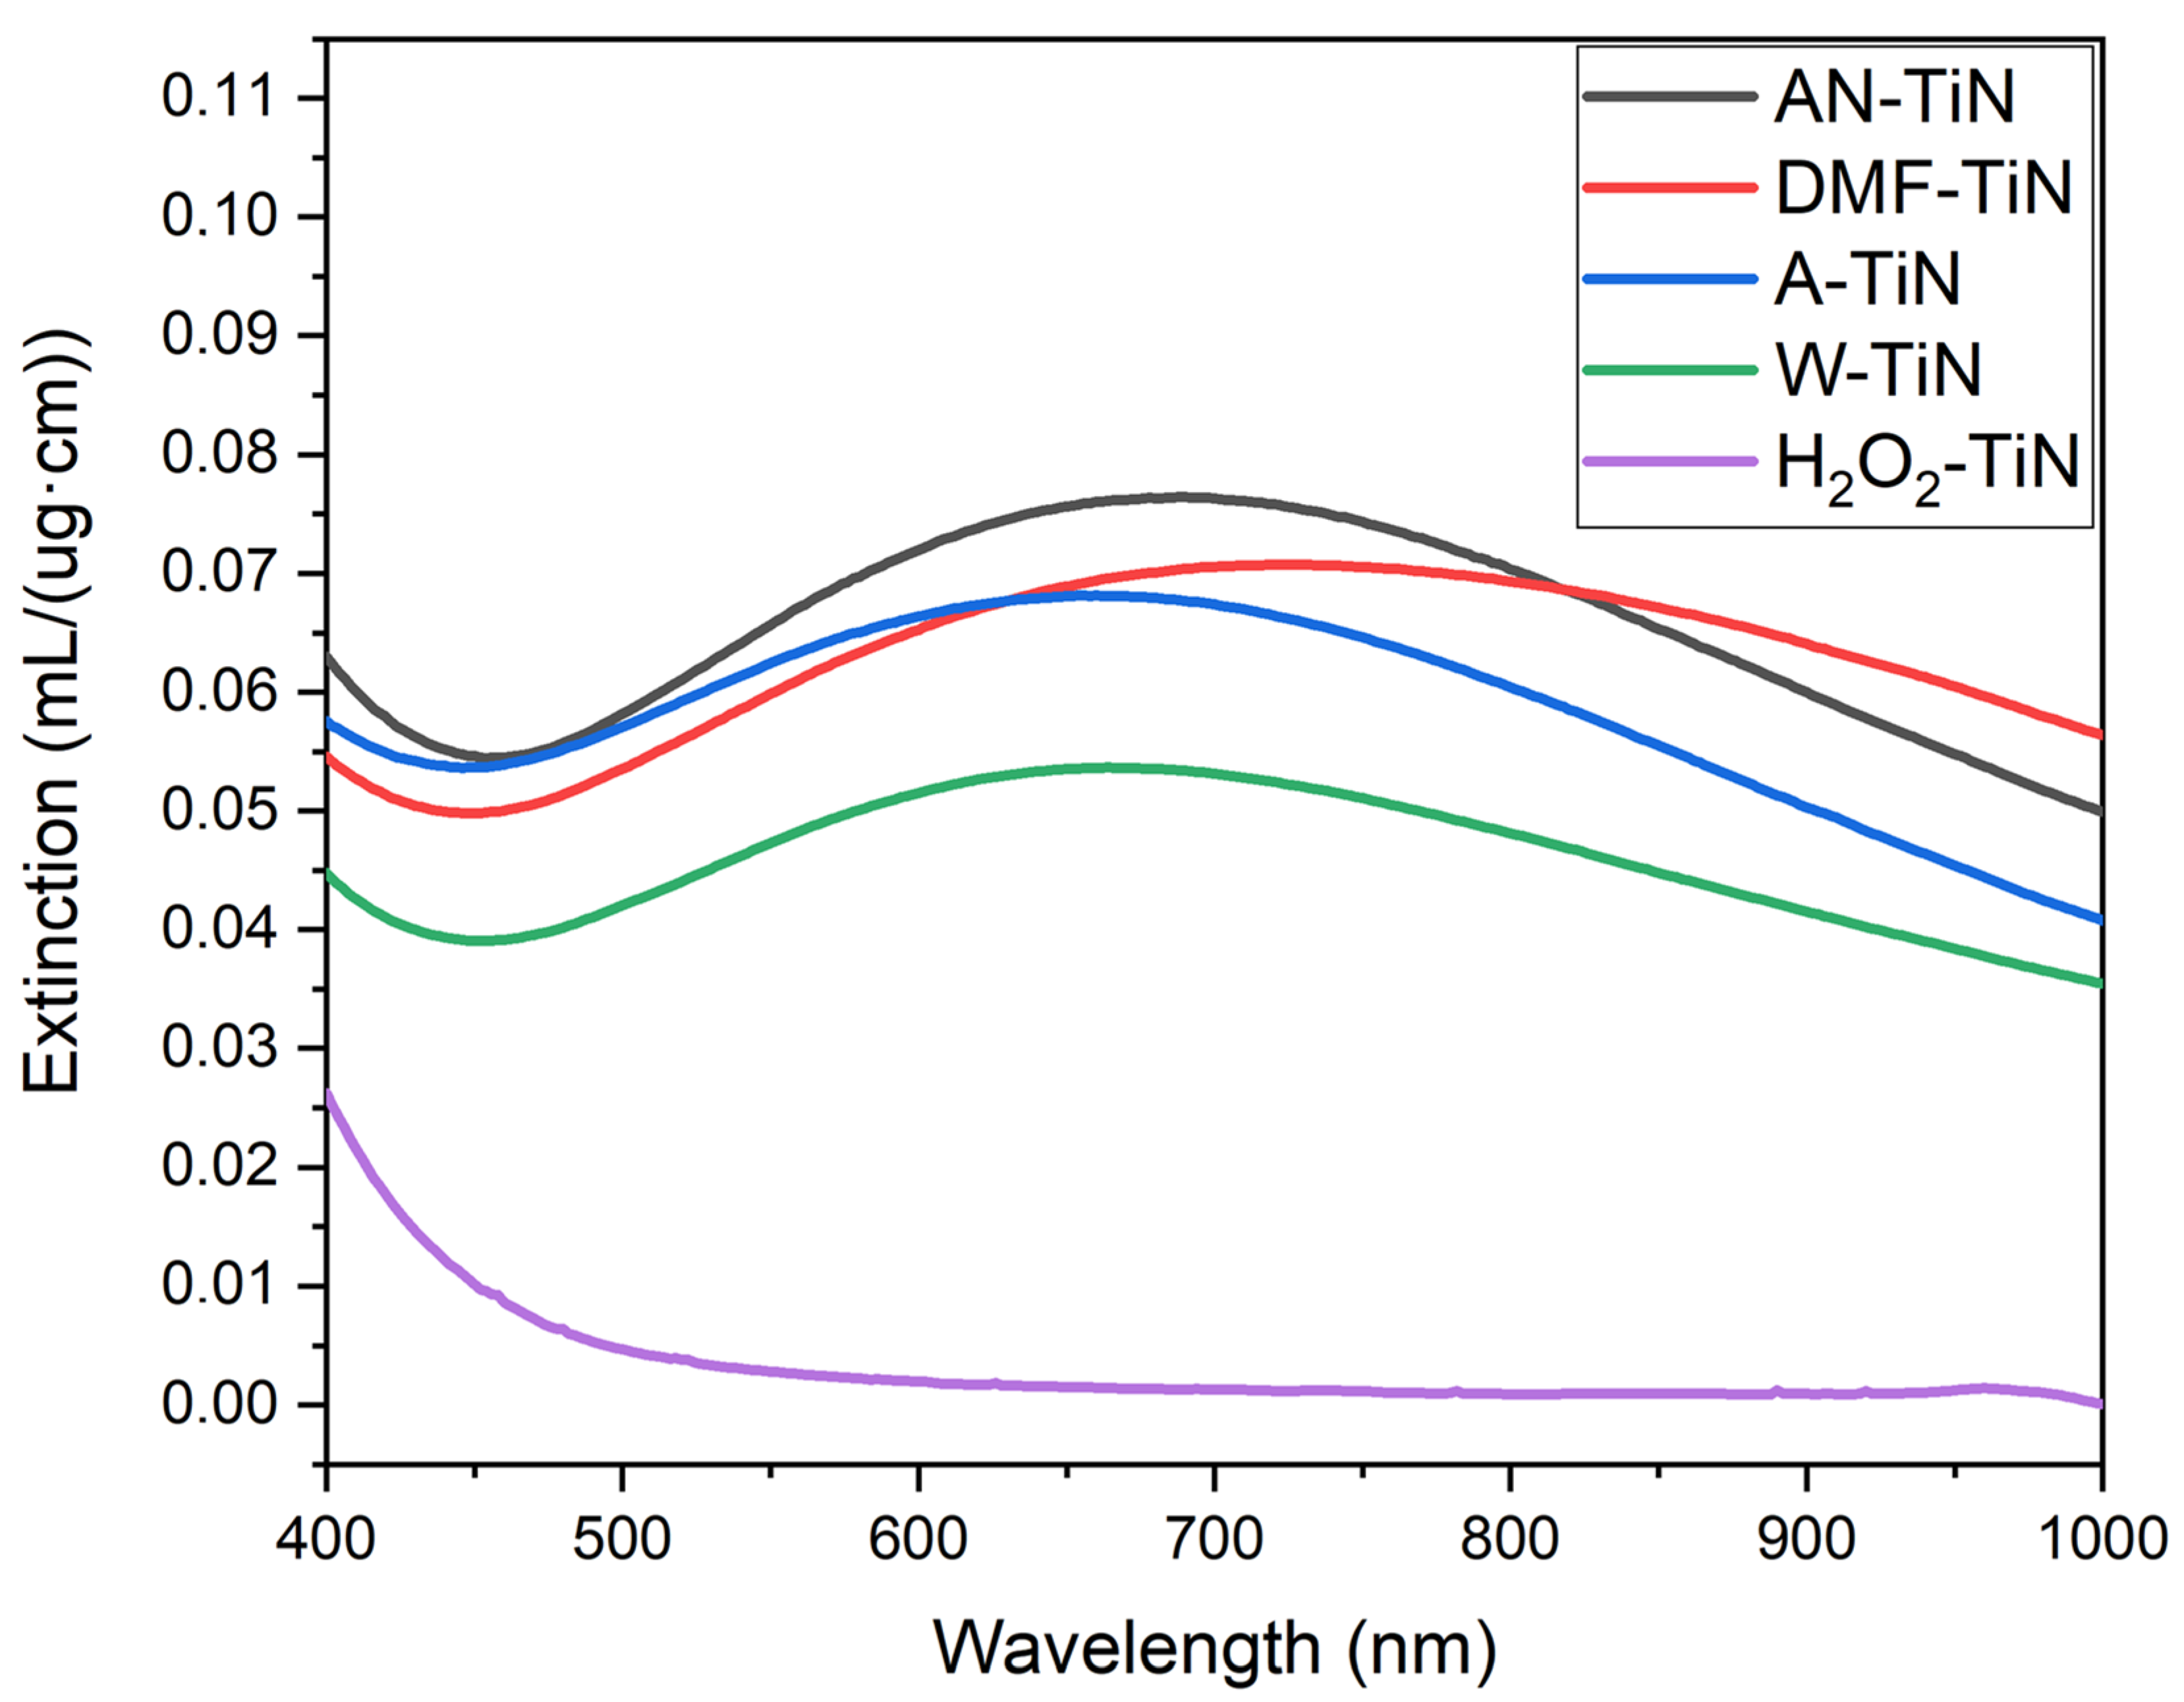
3.5. Optical Characterization

We finally measured the optical extinction spectra of TiN-based NPs in the visible and near-IR range. The spectra, normalized to mass concentration of Ti, are shown in Figure 4. As one can see, NPs synthesized in organic solvents (AN-TiN, DMF-TiN, A-TiN) exhibit broad peaks centered between 650 and 750 nm, with similar values of optical extinction in the near-IR. NPs ablated in nitrogen-containing liquids (AN-TiN and DMF-TiN) have slightly higher (~10%) optical extinction in near-IR than A-TiN NPs. W-TiN NPs have approximately 20% smaller value of the optical extinction due to the higher content of titanium oxide in the NP composition. H2O2-TiN NPs almost do not interact with light in red and near-IR range. This behavior is typical for TiO2 NPs [45], which additionally confirms that H2O2-TiN NPs are almost completely oxidized.

3.6. Discussion

Our data demonstrate the influence of a liquid ambient on the composition and properties of TiN NPs synthesized by PLAL. The results agree with previously reported data on laser-ablative synthesis using reactive chemical species [22,23,24,25].
The strongest effect is achieved in H2O2. In this case, Ti 2p XPS and optical characterization suggests the formation of almost pure TiO2. The results are also supported by EDX data, which indicate very high oxygen content in the H2O2-TiN NPs. However, EDX and N 1s XPS data also indicate the presence of nitrogen in the H2O2-TiN NPs. The analysis of the N 1s XPS spectrum suggests that the origin of this signal is not related to any kind of Ti-N bonds but can be attributed to adsorbed molecular nitrogen N2 or nitrogen oxides. At the same time, SEM imaging evidences the formation of characteristic voids inside H2O2-TiN NPs, which lead to the formation of ruptured shells-like NPs (Figure S3). These two features (XPS spectra of adsorbed molecular N2 or NOx and ruptured shells-like shape) were uniquely found in H2O2-TiN NPs during our study. Therefore, we believe that these features are linked and the voids could be filled with N2 or nitrogen oxide gas. We suppose that the gas originates from the TiN sample during formation of the NPs in highly oxidizing medium (H2O2). In the ruptured shell-like nanostructures, a part of this nitrogen-containing gas remains adsorbed at the inner surface of the NPs. In this case, XPS can detect peaks at 401.4 and 406.7 eV, which correspond to the presence of adsorbed gas molecules near the edges of the ruptured shells. These gas molecules (both adsorbed and inside voids) lead to the appearance of a nitrogen signal in the EDX spectra of H2O2-TiN NPs (Figure 2), but they do not affect the optical spectrum of the H2O2-TiN NPs. Therefore, despite nitrogen being present inside the H2O2-TiN NPs, the optical spectrum of the NPs corresponds to the spectrum of TiO2 NPs (Figure 4). Although this assumption seems logical and indirectly supported by all the experimental techniques used in this study, it still requires further direct confirmation.
The use of organic solvents (acetone, acetonitrile, DMF) in PLAL yields similar results. The NPs have close ratios of nitrogen to oxygen content, exhibit TiN, TiC, and possibly TiNO bonds on their surface. Oxygen in these NPs is present in the form of amorphous TiO2 and oxynitrides, while most of it originates from the fast surface oxidation of the NPs. The use of nitrogen-containing liquids for the preservation of nitrogen in the NPs composition turned out to be not straightforward. AN-TiN NPs demonstrate the highest value of nitrogen to oxygen ratio in the NPs composition (even higher nitrogen content than in the TiN target) and the strongest XPS peaks of TiN bonds. However, properties of DMF-TiN NPs are almost indistinguishable from those of A-TiN NPs. Therefore, we can conclude that not only the presence of a chemical element in the composition of a liquid molecule, but also the chemical state of this element, plays an important role in the formation of NPs by PLAL. Note that some titanium carbides can also be formed during ablation of TiN in organic solvents. Indeed, the intensity of Ti-C peak in C 1s XPS spectra is of the same order (although 1.4–2.2 fold lower), as the intensity of the Ti-N peak in N 1s XPS spectra of the same samples. At the same time, both Ti-N and Ti-C bonds appear at the same binding energy in Ti 2p XPS, and therefore Ti 2p XPS data cannot be used for the discrimination of these bonds. Furthermore, optical spectra in the visible and near-IR region are very similar for both titanium nitrides [6] and titanium carbides [46]. Moreover, the formation of titanium carbides was previously reported for PLAL of Ti target in organic solvents [24].
W-TiN NPs have intermediate properties between H2O2-TiN on one side and AN-TiN, DMF-TiN, and A-TiN on the other. The formation of various titanium oxides has already been described in the literature for the PLAL of Ti target in water [23,24]. The oxidation degree was found to decrease while the duration of laser pulses decreases from ms [23] to ns [24]. Our data indicate that even fs PLAL cannot exclude oxidation of Ti in water. We found that the surface of W-TiN NPs is almost fully oxidized without any sign of TiC on it. EDX data also suggest a high degree of NP oxidation, but optical spectra indicate the conservation of a significant TiN fraction. This experimental fact can be explained by a predominant oxidation of the NP surface, while the core remains unaffected. Similar oxidation behavior was reported for PLAL of Ti in water [24].
The synthesized TiN NPs present very appealing objects for biomedical and energy applications due to their high and wide optical absorption in near-IR spectral range. From this point of view, AN-TiN, DMF-TiN, and A-TiN seem to be especially relevant, as their optical mass extinction coefficients in the near-IR region (0.06–0.075 mL/(ug·cm)) are higher than values reported in the literature for NPs, which are tested for PTT [47,48,49,50]. In particular, the mass extinction coefficient at 808 nm of Au nanorods is 0.014 mL/(ug·cm) [47], nanosized graphene oxide is 0.025 mL/(ug·cm) [48], WS2 NPs is 0.024 mL/(ug·cm) [49], and MoS2 NPs is 0.028 mL/(ug·cm) [50].
The size of NPs is another important parameter, especially for biomedical applications. We established a strong dependence of the NPs size on the type of the solvent. Indeed, the mean size can be tuned from 20 to 100 nm (Figure 1F) by a simple change of the liquid ambient. Here, being the smallest (20 nm) among all the synthesized NPs, AN-TiN NPs look to be the best candidates for biomedical applications. However, the formation of toxic hydrogen cyanide during PLAL in acetonitrile could present a substantial difficulty in their biomedical applications, therefore further safety evaluation of AN-TiN NPs is required. W-TiN NPs can be treated as a good compromise for practical applications due to the simplicity of their preparation and the absence of any organic contamination, although they exhibit ~20% smaller optical extinction coefficient and have a slightly larger size (50 nm).

4. Conclusions

We presented a systematic study of NPs prepared by PLAL of a TiN target in different solvents, including acetonitrile, DMF, acetone, water, and H2O2. We showed that in all cases spherical NPs are formed. We also demonstrated that the size of the formed NPs depends on a liquid ambient type. AN-TiN and H2O2-TiN NPs have the smallest (20 nm) and largest (90 nm) mean sizes, respectively, while the sizes of other NPs were within the 40–50 nm range. All synthesized NPs had a high-oxidation state compared to the target material. The surface of W-TiN and H2O2-TiN NPs was almost fully oxidized. We also found that AN-TiN, DMF-TiN, and A-TiN NPs contained a slight titanium carbide fraction, which probably appeared due to solvent decomposition. AN-TiN, DMF-TiN, and A-TiN NPs demonstrated strong and wide optical extinction feature in the near-IR range (centered between 600 and 900 nm) with very high mass extinction coefficient of 0.06–0.075 mL/(ug·cm), which is very important for projected biomedical applications. The optical extinction of W-TiN NPs was 20% lower in the near-IR compared to NPs synthesized in organic solvents, but still significant, while H2O2-TiN did not exhibit any extinction in this range.

Supplementary Materials

The following supporting information can be downloaded at: https://www.mdpi.com/article/10.3390/nano12101672/s1, Figure S1. List of liquids, which were used as mediums for the laser ablative synthesis; Figure S2. EDX deconvolution procedure. (A) A typical SEM image with an experimental and a background data point marked by red circles. (B) An experimental (black line) and a background (red line) EDX spectra obtained at data points marked in (A). (C) A EDX spectrum obtained by subtraction of the background spectrum from the experimental spectrum. (D) Fit of the EDX spectrum from (C) (black line) by an “ideal” Titanium (red line) EDX spectrum. (E) A EDX spectrum obtained by subtraction of the titanium spectrum from the experimental spectrum. (F) Final fit of the experimental EDX spectrum by EDX spectra of carbon (C, red line), nitrogen (N, blue line), and oxygen (O, green line); Figure S3. SEM images of NPs synthesized by PLAL in H2O2. Red circles highlight raptured NPs; Figure S4. Averaged background corrected EDX spectra of NPs, synthesized by PLAL of Ti target in DMF (DMF-Ti, black line) and acetonitrile (AN-TiN, red line); Figure S5. Deconvolution of XPS spectra of the synthesized NPs. (A) AN-TiN NPs; (B) DMF-TiN NPs; (C) A-TiN NPs; (D) W-TiN NPs; (E) H2O2-TiN NPs; Figure S6. Ti 2p XPS spectra of H2O2-TiN NPs after storage for several months; Figure S7. Alternative six-peak fit of XPS spectra of Ti 2p level of W-TiN NPs sample; Table S1. Temperature program for measurement mass of Ti in TiN NPs using AAS technique; Table S2. Statistical parameters of lognormal fits of sizes of NPs, synthesized in different liquids. μ and σ are parameters of lognormal distributions.

Author Contributions

A.A.P. conceived the research; A.A.P., S.M.K. and A.V.K. designed laser fabrication experiments; A.A.P., G.V.T., P.V.S., G.I.T. and E.A.P.-K. performed fabrication and characterization of NPs. R.I.R. and A.M.M. performed XPS measurements and peak identification. All authors analyzed and discussed the obtained data. A.A.P. and A.V.K. prepared the manuscript using data from co-authors. A.A.P. guided the project. All authors have read and agreed to the published version of the manuscript.

Funding

This research was funded by the Russian Science Foundation, grant number 20-72-00081. The authors are grateful to the Ministry of Science and Higher Education of the Russian Federation (subject no. FSWU-2020-0035) for the infrastructure put at their disposal.

Data Availability Statement

Data is available on reasonable request from the corresponding author.

Conflicts of Interest

The authors declare no conflict of interest.

References

  1. Toth, L.E. Transition Metal Carbides and Nitrides; Margrave, J.L., Ed.; Academic Press: New York, NY, USA, 1971. [Google Scholar]
  2. Boltasseva, A.; Shalaev, V.M. All that glitters need not be gold. Science 2015, 347, 1308–1310. [Google Scholar] [CrossRef] [PubMed] [Green Version]
  3. Avasarala, B.; Haldar, P. Electrochemical oxidation behavior of titanium nitride based electrocatalysts under PEM fuel cell conditions. Electrochim. Acta 2010, 55, 9024–9034. [Google Scholar] [CrossRef]
  4. Patsalas, P.; Kalfagiannis, N.; Kassavetis, S. Optical Properties and Plasmonic Performance of Titanium Nitride. Materials 2015, 8, 3128–3154. [Google Scholar] [CrossRef] [Green Version]
  5. Guler, U.; Ndukaife, J.C.; Naik, G.V.; Nnanna, A.G.A.; Kildishev, A.V.; Shalaev, V.M.; Boltasseva, A. Local heating with lithographically fabricated plasmonic titanium nitride nanoparticles. Nano Lett. 2013, 13, 6078–6083. [Google Scholar] [CrossRef] [PubMed]
  6. Lalisse, A.; Tessier, G.; Plain, J.; Baffou, G. Plasmonic efficiencies of nanoparticles made of metal nitrides (TiN, ZrN) compared with gold. Sci. Rep. 2016, 6, 38647. [Google Scholar] [CrossRef]
  7. Wang, C.; Dai, C.; Hu, Z.; Li, H.; Yu, L.; Lin, H.; Bai, J.; Chen, Y. Photonic cancer nanomedicine using the near infrared-II biowindow enabled by biocompatible titanium nitride nanoplatforms. Nanoscale Horiz. 2019, 4, 415–425. [Google Scholar] [CrossRef]
  8. He, W.; Ai, K.; Jiang, C.; Li, Y.; Song, X.; Lu, L. Plasmonic titanium nitride nanoparticles for in vivo photoacoustic tomography imaging and photothermal cancer therapy. Biomaterials 2017, 132, 37–47. [Google Scholar] [CrossRef]
  9. Yang, X.; Li, C.; Yang, L.; Yan, Y.; Qian, Y. Reduction-nitridation synthesis of titanium nitride nanocrystals. J. Am. Ceram. Soc. 2003, 86, 206–208. [Google Scholar] [CrossRef]
  10. Zhang, H.; Li, F.; Jia, Q. Preparation of titanium nitride ultrafine powders by sol–gel and microwave carbothermal reduction nitridation methods. Ceram. Int. 2009, 35, 1071–1075. [Google Scholar] [CrossRef]
  11. Kumar, S.M.; Murugan, K.; Chandrasekhar, S.B.; Hebalkar, N.; Krishna, M.; Satyanarayana, B.S.; Madras, G. Synthesis and characterization of nano silicon and titanium nitride powders using atmospheric microwave plasma technique. J. Chem. Sci. 2012, 124, 557–563. [Google Scholar] [CrossRef] [Green Version]
  12. Tavares, J.; Coulombe, S.; Meunier, J.-L. Synthesis of cubic-structured monocrystalline titanium nitride nanoparticles by means of a dual plasma process. J. Phys. D. Appl. Phys. 2009, 42, 102001. [Google Scholar] [CrossRef]
  13. Fojtik, A.; Henglein, A. Laser Ablation of Films and Suspended Particles in a Solvent: Formation of Cluster and Colloid Solutions. Ber. Bunsenges. Für Phys. Chem. 1993, 97, 252. [Google Scholar] [CrossRef]
  14. Zhang, D.; Gökce, B.; Barcikowski, S. Laser Synthesis and Processing of Colloids: Fundamentals and Applications. Chem. Rev. 2017, 117, 3990–4103. [Google Scholar] [CrossRef] [PubMed]
  15. Kabashin, A.V.; Meunier, M. Synthesis of colloidal nanoparticles during femtosecond laser ablation of gold in water. J. Appl. Phys. 2003, 94, 7941. [Google Scholar] [CrossRef] [Green Version]
  16. Kögler, M.; Ryabchikov, Y.V.; Uusitalo, S.; Popov, A.; Popov, A.; Tselikov, G.; Välimaa, A.-L.; Al-Kattan, A.; Hiltunen, J.; Laitinen, R.; et al. Bare laser-synthesized Au-based nanoparticles as nondisturbing surface-enhanced Raman scattering probes for bacteria identification. J. Biophotonics 2018, 11, e201700225. [Google Scholar] [CrossRef] [Green Version]
  17. Al-Kattan, A.; Ryabchikov, Y.V.; Baati, T.; Chirvony, V.; Sánchez-Royo, J.F.; Sentis, M.; Braguer, D.; Timoshenko, V.Y.; Estève, M.-A.; Kabashin, A. V Ultrapure laser-synthesized Si nanoparticles with variable oxidation states for biomedical applications. J. Mater. Chem. B 2016, 4, 7852–7858. [Google Scholar] [CrossRef]
  18. Bulmahn, J.C.; Tikhonowski, G.; Popov, A.A.; Kuzmin, A.; Klimentov, S.M.; Kabashin, A.V.; Prasad, P.N. Laser-Ablative Synthesis of Stable Aqueous Solutions of Elemental Bismuth Nanoparticles for Multimodal Theranostic Applications. Nanomaterials 2020, 10, 1463. [Google Scholar] [CrossRef]
  19. Popov, A.A.; Tselikov, G.; Dumas, N.; Berard, C.; Metwally, K.; Jones, N.; Al-Kattan, A.; Larrat, B.; Braguer, D.; Mensah, S.; et al. Laser- synthesized TiN nanoparticles as promising plasmonic alternative for biomedical applications. Sci. Rep. 2019, 9, 1194. [Google Scholar] [CrossRef] [Green Version]
  20. Zelepukin, I.V.; Popov, A.A.; Shipunova, V.O.; Tikhonowski, G.V.; Mirkasymov, A.B.; Popova-Kuznetsova, E.A.; Klimentov, S.M.; Kabashin, A.V.; Deyev, S.M. Laser-synthesized TiN nanoparticles for biomedical applications: Evaluation of safety, biodistribution and pharmacokinetics. Mater. Sci. Eng. C 2021, 120, 111717. [Google Scholar] [CrossRef]
  21. Maldonado, M.E.; Das, A.; Gomes, A.S.L.; Popov, A.A.; Klimentov, S.M.; Kabashin, A.V. Nonlinear photoacoustic response of suspensions of laser-synthesized plasmonic titanium nitride nanoparticles. Opt. Lett. 2020, 45, 6695. [Google Scholar] [CrossRef]
  22. Gondal, M.A.; Qahtan, T.F.; Dastageer, M.A.; Saleh, T.A.; Maganda, Y.W.; Anjum, D.H. Effects of oxidizing medium on the composition, morphology and optical properties of copper oxide nanoparticles produced by pulsed laser ablation. Appl. Surf. Sci. 2013, 286, 149–155. [Google Scholar] [CrossRef]
  23. Tian, F.; Sun, J.; Yang, J.; Wu, P.; Wang, H.-L.; Du, X.-W. Preparation and photocatalytic properties of mixed-phase titania nanospheres by laser ablation. Mater. Lett. 2009, 63, 2384–2386. [Google Scholar] [CrossRef]
  24. Golightly, J.S.; Castleman, A.W. Analysis of Titanium Nanoparticles Created by Laser Irradiation under Liquid Environments. J. Phys. Chem. B 2006, 110, 19979–19984. [Google Scholar] [CrossRef] [PubMed]
  25. Wu, C.-H.; Chen, S.-Y.; Shen, P. C–H doped anatase nanospheres with disordered shell and planar defects synthesized by pulsed laser ablation of bulk Ti in tetraethyl orthosilicate. CrystEngComm 2014, 16, 2220. [Google Scholar] [CrossRef]
  26. Li, J.; Gao, L.; Sun, J.; Zhang, Q.; Guo, J.; Yan, D. Synthesis of nanocrystalline titanium nitride powders by direct nitridation of titanium oxide. J. Am. Ceram. Soc. 2001, 84, 3045–3047. [Google Scholar] [CrossRef]
  27. Alvarez Barragan, A.; Ilawe, N.V.; Zhong, L.; Wong, B.M.; Mangolini, L. A Non-Thermal Plasma Route to Plasmonic TiN Nanoparticles. J. Phys. Chem. C 2017, 121, 2316–2322. [Google Scholar] [CrossRef]
  28. Tikhonowski, G.V.; Popova-Kuznetsova, E.A.; Aleshchenko, Y.A.; Klimentov, S.M.; Kabashin, A.V.; Popov, A.A. Effect of Oxygen on Colloidal Stability of Titanium Nitride Nanoparticles Synthesized by Laser Ablation in Liquids. Bull. Lebedev Phys. Inst. 2021, 48, 216–220. [Google Scholar] [CrossRef]
  29. Amendola, V.; Meneghetti, M. What controls the composition and the structure of nanomaterials generated by laser ablation in liquid solution? Phys. Chem. Chem. Phys. 2013, 15, 3027–3046. [Google Scholar] [CrossRef]
  30. Logothetidis, S.; Meletis, E.I.; Stergioudis, G.; Adjaottor, A.A. Room temperature oxidation behavior of TiN thin films. Thin Solid Film. 1999, 338, 304–313. [Google Scholar] [CrossRef]
  31. Greczynski, G.; Primetzhofer, D.; Lu, J.; Hultman, L. Core-level spectra and binding energies of transition metal nitrides by non-destructive X-ray photoelectron spectroscopy through capping layers. Appl. Surf. Sci. 2017, 396, 347–358. [Google Scholar] [CrossRef] [Green Version]
  32. Jaeger, D.; Patscheider, J. A complete and self-consistent evaluation of XPS spectra of TiN. J. Electron Spectros. Relat. Phenom. 2012, 185, 523–534. [Google Scholar] [CrossRef]
  33. Saha, N.C.; Tompkins, H.G. Titanium nitride oxidation chemistry: An X-ray photoelectron spectroscopy study. J. Appl. Phys. 1992, 72, 3072–3079. [Google Scholar] [CrossRef]
  34. Porte, L.; Roux, L.; Hanus, J. Vacancy effects in the X-ray photoelectron spectra of TiNx. Phys. Rev. B 1983, 28, 3214–3224. [Google Scholar] [CrossRef]
  35. Vasile, M.J.; Emerson, A.B.; Baiocchi, F.A. The characterization of titanium nitride by X-ray photoelectron spectroscopy and Rutherford backscattering. J. Vac. Sci. Technol. A Vac. Surf. Film. 1990, 8, 99–105. [Google Scholar] [CrossRef]
  36. Rizzo, A.; Signore, M.A.; Mirenghi, L.; Di Luccio, T. Synthesis and characterization of titanium and zirconium oxynitride coatings. Thin Solid Film. 2009, 517, 5956–5964. [Google Scholar] [CrossRef]
  37. Zhu, L.; Lu, Q.; Lv, L.; Wang, Y.; Hu, Y.; Deng, Z.; Lou, Z.; Hou, Y.; Teng, F. Ligand-free rutile and anatase TiO2 nanocrystals as electron extraction layers for high performance inverted polymer solar cells. RSC Adv. 2017, 7, 20084–20092. [Google Scholar] [CrossRef] [Green Version]
  38. Shinn, N.D.; Tsang, K.-L. Strain-induced surface reactivity: Low temperature Cr/W(110) nitridation. J. Vac. Sci. Technol. A Vac. Surf. Film. 1991, 9, 1558–1562. [Google Scholar] [CrossRef]
  39. Milosev, I.; Strehblow, H.-H.; Navinsek, B.; Metikos-Hukovic, M. Electrochemical and thermal oxidation of TiN coatings studied by XPS. Surf. Interface Anal. 1995, 23, 529–539. [Google Scholar] [CrossRef]
  40. Wu, H.Z.; Chou, T.C.; Mishra, A.; Anderson, D.R.; Lampert, J.K.; Gujrathi, S.C. Characterization of titanium nitride thin films. Thin Solid Film. 1990, 191, 55–67. [Google Scholar] [CrossRef]
  41. Persson, I.; Näslund, L.Å.; Halim, J.; Barsoum, M.W.; Darakchieva, V.; Palisaitis, J.; Rosen, J.; Persson, P.O.Å. On the organization and thermal behavior of functional groups on Ti3C2 MXene surfaces in vacuum. 2D Mater. 2018, 5, 015002. [Google Scholar] [CrossRef]
  42. Bertóti, I.; Mohai, M.; Sullivan, J.L.; Saied, S.O. Surface characterisation of plasma-nitrided titanium: An XPS study. Appl. Surf. Sci. 1995, 84, 357–371. [Google Scholar] [CrossRef]
  43. Cheng, X.; Yu, X.; Xing, Z. Characterization and mechanism analysis of N doped TiO2 with visible light response and its enhanced visible activity. Appl. Surf. Sci. 2012, 258, 3244–3248. [Google Scholar] [CrossRef]
  44. Tang, L.; Wang, Y.; Li, Y.; Feng, H.; Lu, J.; Li, J. Preparation, Structure, and Electrochemical Properties of Reduced Graphene Sheet Films. Adv. Funct. Mater. 2009, 19, 2782–2789. [Google Scholar] [CrossRef]
  45. Zhao, Y.; Li, C.; Liu, X.; Gu, F.; Jiang, H.; Shao, W.; Zhang, L.; He, Y. Synthesis and optical properties of TiO2 nanoparticles. Mater. Lett. 2007, 61, 79–83. [Google Scholar] [CrossRef]
  46. Sarycheva, A.; Makaryan, T.; Maleski, K.; Satheeshkumar, E.; Melikyan, A.; Minassian, H.; Yoshimura, M.; Gogotsi, Y. Two-Dimensional Titanium Carbide (MXene) as Surface-Enhanced Raman Scattering Substrate. J. Phys. Chem. C 2017, 121, 19983–19988. [Google Scholar] [CrossRef]
  47. Robinson, J.T.; Welsher, K.; Tabakman, S.M.; Sherlock, S.P.; Wang, H.; Luong, R.; Dai, H. High performance in vivo near-IR (>1 μm) imaging and photothermal cancer therapy with carbon nanotubes. Nano Res. 2010, 3, 779–793. [Google Scholar] [CrossRef] [Green Version]
  48. Robinson, J.T.; Tabakman, S.M.; Liang, Y.; Wang, H.; Sanchez Casalongue, H.; Vinh, D.; Dai, H. Ultrasmall Reduced Graphene Oxide with High Near-Infrared Absorbance for Photothermal Therapy. J. Am. Chem. Soc. 2011, 133, 6825–6831. [Google Scholar] [CrossRef]
  49. Cheng, L.; Liu, J.; Gu, X.; Gong, H.; Shi, X.; Liu, T.; Wang, C.; Wang, X.; Liu, G.; Xing, H.; et al. PEGylated WS2 Nanosheets as a Multifunctional Theranostic Agent for in vivo Dual-Modal CT/Photoacoustic Imaging Guided Photothermal Therapy. Adv. Mater. 2014, 26, 1886–1893. [Google Scholar] [CrossRef]
  50. Liu, T.; Wang, C.; Gu, X.; Gong, H.; Cheng, L.; Shi, X.; Feng, L.; Sun, B.; Liu, Z. Drug Delivery with PEGylated MoS2 Nano-sheets for Combined Photothermal and Chemotherapy of Cancer. Adv. Mater. 2014, 26, 3433–3440. [Google Scholar] [CrossRef]
Figure 1. SEM characterization of NPs prepared by PLAL of TiN target in different liquids. (AE) size histograms of H2O2-TiN, W-TiN, DMF-TiN, A-TiN, and AN-TiN NPs, respectively. Black curves are lognormal data fits. Insets demonstrate characteristic SEM images of the NPs. (F) Mode size of the lognormal fits of size distribution of NPs prepared in different liquids. Error bars represent distribution widths.
Nanomaterials 12 01672 g001
Figure 2. EDX characterization of synthesized TiN-based NPs. (A) Averaged background corrected EDX spectra (black line—AN-TiN NPs, red line—DMF-TiN NPs, blue line—A-TiN NPs, green line—W-TiN NPs, purple line—H2O2-TiN NPs, brown line—TiN ablation target). All spectra are normalized to titanium and averaged over all data points, measured on each sample. (B) Nitrogen and (C) oxygen content of synthesized NPs normalized to titanium. Values are calculated as the intensity of nitrogen peak at 0.39 keV or oxygen peak at 0.52 keV, divided by intensity of the Ti peak at 4.5 keV, respectively. (D) Ratio of nitrogen content to oxygen content in the NPs. Data in (BD) are represented as mean ± standard deviation. At least seven different data points were measured on each sample.
Nanomaterials 12 01672 g002
Figure 3. XPS characterization of the synthesized NPs. (A) Ti 2p, (B) N 1s, (C) O 1s, and (D) C 1s electronic levels of H2O2-TiN (purple), W-TiN (green), A-TiN (blue), DMF-TiN (red), and AN-TiN (black) NPs.
Nanomaterials 12 01672 g003
Figure 4. Optical extinction spectra of H2O2-TiN (purple), W-TiN (green), A-TiN (blue), DMF-TiN (red), and AN-TiN (black) NPs measured in 10 mm optical cuvettes and normalized to mass concentration of Ti in ug/mL.
Nanomaterials 12 01672 g004
Publisher’s Note: MDPI stays neutral with regard to jurisdictional claims in published maps and institutional affiliations.

