5.1. Physical Characterization
Commercial samples were selected for this study to better gauge the quality of materials available to manufacturers that might incorporate nanomaterials into products and to help build a library of data that could be easily cross referenced with other labs who can purchase the same materials. This type of data can then be used to inform the development of regulations for the safe and effective use of NiO nanoparticles and their incorporation into consumer products. Indeed, funding for this work was provided with the intended purpose to use the data to help guide the development of regulations for the safe use of metal oxide nanoparticles in consumer products in Canada. This study was conducted using eight different materials purchased from four manufacturers, all of which were supplied as dry powders. The samples were selected to represent a range of sizes, suppliers, and surface coatings. These samples included three different surface coatings from a single manufacturer. The nominal particle size and specific surface area supplied by the manufacturers are included in
Table 1 along with a summary of our independent determinations for size, surface area, surface charge, and hydrodynamic diameter.
Dispersibility in water. The initial dispersion of powdered materials was carried out in deionized water instead of cell culture medium since the generation of reactive oxygen species by sonolysis may lead to the denaturation of proteins [
23]. To disperse samples in a manner that can be reproduced in other laboratories, the method established by Deloid et al. was followed [
24]. The probe sonicator was calibrated calorimetrically in order to determine the delivered sonication energy. Samples were sonicated with varying energies and plots of Z-average and PDI measured by DLS as a function of sonication energy (
Figure S1) were used to determine an appropriate sonication energy.
Table 1 summarizes the Z-average and PDI for samples sonicated with the recommended energy. It should be noted that the materials varied significantly in their dispersibility. Some samples, such as Ni-04 (
Figure S1), gave the expected decrease of Z-average and PDI with increased sonication at low energy and reached a plateau at higher energies; this made it straightforward to select an appropriate energy that dispersed the sample, but minimized possible damage at high applied energy. By contrast, samples such as Ni-01 and Ni-02 (
Figure S1), showed little effect of sonication except for the first one or two points and, otherwise, further sonication lead to DLS measurements with unstable readings that suggested rapid reagglomeration. Both of these samples gave intensity traces that varied from run to run and showed multiple components. Such results (PDI above ~ 0.3), are not suitable for analysis using the conventional cumulants approach and only approximate values for Z-average and PDI are provided in
Table 1.
With the exception of Ni-01 and Ni-02, the NiO samples gave Z-averages in the range of 230–380 nm with PDI between 0.27 and 0.37. The large Z-average, compared to the nominal size (
Table 1), and high polydispersity indicated that the samples were agglomerated with a wide range of sizes despite attempts to optimize the dispersion procedure. Qualitatively, most samples showed some level of sedimentation after sitting for a period of hours after sonication, consistent with the relatively large sizes. In this regard, these commercial NiO nanoparticles differ from other types of nanomaterials such as gold, silver, or silica nanoparticles which give colloidally stable suspensions with narrow size distributions. It should be noted that DLS is much more sensitive to large particles (intensity proportional to radius [
6]) and the agglomerates present in all these samples made it difficult to detect small particles. Examination of the individual intensity histograms provides evidence for a < 100 nm fraction in samples Ni-01, -03, -04, -06, -07, and -08. Therefore, despite the issues with agglomeration, these materials do contain a nanosized fraction that may possess unique nanoscale properties that require toxicological assessment. The discrepancy between the nominal size provided by the supplier and the DLS results also highlights the importance of complimentary TEM characterization to determine the primary particle size.
The surface charge for particles was measured for sonicated particle suspensions in deionized water. The pH of the prepared dispersions was measured since zeta potential measurements are a function of pH (
Table 1). Due to its hydrophobic character, the stearic acid-coated sample was dispersed and measured in ethanol; its relatively low surface charge value (13 ± 1 mV) can be explained by stearic acid shielding the surface. It can be noted that all NiO samples have a positive surface charge, which is consistent with the presence of Ni
2+ ions on the outer layer of the hydrated NiO surface as proposed by Kitakatsu et al. [
25]. Interestingly, most samples had a sufficient charge (≈30 mV) to maintain colloidally stable dispersions; however, DLS measurements still indicated sedimentation caused by the presence of large agglomerates.
Size distribution by TEM. TEM analysis was employed to obtain information on the size/shape of primary particles for comparison to the manufacturer information and the DLS experiments described above. Samples were dispersed using the recommended sonication energy provided in
Table 1 and deposited on TEM grids. Representative images are shown in
Figure 1 for each sample, with a second lower magnification image provided in
Figure S2. Aggregation was also a significant problem in TEM experiments and varied from sample to sample; the images shown in
Figure 1 and
Figure S2 are for less aggregated sample areas. The level of aggregation observed in the TEM images did not correlate with the level of dispersibility indicated by the DLS measurements. This indicates that further sample agglomeration during the deposition and drying of the sample on the TEM grid is the main factor in determining the level of dispersion observed by TEM. Nevertheless, it was possible to find areas that were suitable for size analysis of individual particles. With the exception of Ni-03 which had a higher aggregation level and lower contrast than the other samples, approximately 100 particles were analyzed for each sample. Box plots showing the distributions for mean equivalent diameter and aspect ratio for each sample are shown in
Figure S3. The mean equivalent circular diameter and standard deviation (a measure of the width of the particle size distribution) are provided in
Table 1.
All the NiO samples gave a mean equivalent diameter that was less than approximately 20 nm. In most cases (Ni-03–Ni-08), the mean equivalent diameter was close to the nominal value provided by the manufacturer, but it was considerably lower for two samples (Ni-01, Ni-02),
Figure S4. A previous study of four families of other commercial metal oxide nanoparticles has also demonstrated that a significant number of samples have primary particle sizes that differ substantially from those reported by the manufacturer [
26]. Note that the particle size distributions as assessed by the standard deviation are quite broad for most samples. The broad size distributions and limited statistics suggest that small differences between samples are unlikely to be meaningful. In some cases, the images contained large “features” that were not counted either because they overlapped with other particles, or their edges were ill-defined. In other cases, there were very small, poorly defined particles that were also not counted. Despite these complications, the TEM data confirmed that all samples contained a significant fraction of particles with an equivalent diameter significantly below 100 nm. As illustrated in
Figure 1, there are various particles shapes, ranging from approximately circular or elliptical to square or rectangular. However, the aspect ratios are all similar (means of 1.25 to 1.45 with no particles with an aspect ratio greater than ~2), indicating that differences in shape are unlikely to be a consideration for the toxicology studies.
Specific surface area(SSA). SSA values were measured by BET for all samples and compared to the values provided by the manufacturers where available. For most samples, the measured values were similar to those provided by the manufacturer (
Table 1). One exception was Ni-06, which had a significantly lower measured SSA (2 ± 1 m
2/g vs a reported value of 50–100 m
2/g). An estimated surface area can be calculated from the nominal particle diameter and the material density (6.67 g/cm
3 provided by US Research Nanomaterials). Calculated values were 18 m
2/g for 50 nm sample Ni-01, 10 m
2/g for 90 nm sample Ni-02, 50 m
2/g for all 18 nm samples, and 26–60 m
2/g for 15–35 nm sample Ni-08. The SSA measured by BET can indicate the level of aggregation of the dry powders. Low values compared to those estimated from the primary particle size suggest that the particles were strongly aggregated, preventing nitrogen penetration. This can indicate that the material may be difficult to disperse to give a colloidally stable suspension. In contrast, higher values than the estimated surface areas based on the particle diameter may be indicative of increased surface roughness or material porosity.
Quantification of surface coatings and functional groups. The selected materials represent three different types of surface coatings: Ni-05 with a physically adsorbed polymer (PVP) (
Figure 2), Ni-06 with stearic acid attached as a carboxylate, and Ni-07 covalently modified with a commonly used aminopropylsilane. Although a number of approaches for the quantification of coatings on nanomaterials has been reported, these vary in their range of applicability and sensitivity and validated standard procedures are still not available [
27]. We removed the coating from the particles for quantification by quantitative NMR after removal of the particles by centrifugation.
Removal of aminoproylsilane was achieved by basic hydrolysis using the same method optimized previously for a number of commercial ZnO nanoparticles [
28]. A ligand exchange process using hexametaphosphate and polyfluorooctanoic acid, respectively, was used to remove the PVP and stearic acid coating. Peaks in the NMR spectra of the material removed from the NiO nanoparticles were readily assigned to the expected coating as shown in
Figure 2 for the PVP sample, Ni-05; no additional signals were detected, indicating that the samples do not contain significant levels of organic contaminants. The results of quantification by comparison to an internal standard are provided in
Table 2. It should be noted that the accuracy of the qNMR method depends on the efficiency of the functional group hydrolysis or coating desorption. The detailed optimization of the hydrolysis and ligand exchange methods for several metal oxides nanoparticles and a comparison with other quantification methods, including thermogravimetric analysis and x-ray photoelectron spectroscopy, has been reported [
29]. This work and earlier studies [
21,
28] on silica and ZnO nanoparticles have indicated that qNMR has very good sensitivity and reproducibility and can be used to benchmark the reliability of other methods for quantifying surface functional groups and coatings. The previous metal oxide study demonstrated good agreement between the atomic nitrogen content measured by XPS and the qNMR data for APTES-functionalized nanoparticles. However, the presence of adventitious carbon containing contaminants in the commercial materials and the variable hydroxyl content made it impractical to obtain quantitative assessments of stearic acid content using signals in either the C1s or O1s region.
To better illustrate the surface coverage for various materials, the molar content was converted to the number of molecules (for PVP this is the vinylpyrrolidone monomer) per 1 nm
2. Based on atomic radii of nickel and oxygen (0.125 and 0.071 nm), 1 nm
2 area is occupied by ≈6.5 Ni atoms. Based on this approximation, the surface of Ni-06 is almost saturated with stearic acid which binds to ≈85% of the Ni atoms (5.5 molecules per nm
2,
Table 2) assuming that all stearic acid is bound at the surface. For comparison, previous XPS studies on single crystal NiO indicated adsorption of one carboxylate for every two nickel sites [
30]. It is more difficult to make a similar estimate for the aminopropylsilane functionalized sample. Geometrically, 1 nm
2 can fit 11 vertically stacked 3-aminopropylsiloxane molecules. However, these have to bind through the surface hydroxyls which are present in variable amounts on the NiO surface. The number of hydroxyls depends on the temperature applied during the synthesis and the humidity postsynthesis and can range between 10 and 85% [
25]. The estimated content of 7.6 aminopropyl siloxane moieties per nm
2 (
Table 2) may be higher than the hydroxyl content, in which case some vertical polymerisation of aminopropyl siloxane may occur. For the PVP-coated sample, the molecular weight of the polymer is not known. However, for illustration, 1 nm
2 can be occupied by ≈5 horizontally oriented ethylenepyrrolidone moieties. Therefore, the estimation of 10.6 vinylpyrolidone molecules per nm
2 suggests that the surface is completely covered by polymer chains. It should be noted that the NMR studies indicate that PVP rapidly desorbs from the NiO surface in an aqueous environment, which may have implications for studies in cell culture media.
5.3. Cell Culture Experiments
Stability in cell culture medium. The stability of nanoparticles in cell culture medium is critically important to understanding their potential cytotoxic risks. Measuring the size of a nanoform in water or other pure solvent may give a significantly different hydrodynamic radius than is observed in cell culture medium in the presence of salt and serum proteins. Moreover, agglomerates that may form during drying when preparing samples for TEM may not accurately reflect the state of the materials in the biological system. Components of the medium interact with the nanoparticle surface, creating a corona of adherent material at the surface [
31]. These interactions can cause particles to agglomerate, cause agglomerated particles to redisperse, or facilitate the dissolution of the particles by removing surface atoms. The rates of these processes are dependent on the composition of the serum (for example, which species it comes from) and its concentration [
32,
33]. Higher serum concentrations have a greater capacity to chelate free metal ions and may reduce cytotoxicity from dissolved ions. Serum concentrations may also alter the ionic strength of the medium which can impact the stability of the particles towards agglomeration.
From the TEM images in
Figure 1, we see that the particles are not uniformly sized or shaped with significant agglomeration, which may result in challenges in obtaining reliable measurements by DLS; however, it should be noted that a significant degree of agglomeration observed by TEM is due to the deposition of the nanoparticles on the TEM grid and that reasonable sizes and dispersion were achieved for most of the samples in water (
Table 1). All of the NiO particles that we measured agglomerated quickly in the cell culture medium (less than 30 min), resulting in a layer of precipitated particles at the bottom of the cuvette used for DLS. DLS measurements (
Table S2) were made immediately upon mixing the water suspension of particles with the appropriate amount of cell culture medium so as to mimic the conditions used for the in vitro assays. Subsequent measurements were made on the same samples after 24, 48, and 72 h incubations; however, the particles were resuspended by pipetting the suspension up and down several times to redisperse the precipitated agglomerates. Of the eight samples, only three initially measured an average hydrodynamic radius of less than 1 micron—Ni-03, Ni-07, and Ni-08, and even for these the PDI was very large. This may indicate that even over the ten-minute time course of the measurement, significant sedimentation was occurring. Ni-03 and Ni-08 are bare nanoparticles while Ni-07 is a silane-coated material. There was no obvious difference from the TEM images (
Figure 1) between these three samples and the other samples that agglomerated more quickly to account for this different behaviour. As shown above (
Table 1), of the eight total samples, six showed reasonable dispersion in water. Of those six, Ni-03 and Ni-07 had the largest hydrodynamic diameter while Ni-08 had the smallest. Within 24 h, both Ni-03 and Ni-07 increased in hydrodynamic diameter to over one micron, possibly indicating that these initially more heavily agglomerated materials in water agglomerated more slowly in medium compared to better dispersed materials. The Ni-08 dispersion, the best dispersed sample in water, was able to maintain a submicron size for 3 days, although the high PDI values prevented a proper quantitative assessment. While we have previously used DLS measurements in cell culture medium to measure changes in silver nanoparticle dispersions, these heavily agglomerated NiO particles were not well-suited for this approach [
32,
33].
Cytotoxicity. Two cytotoxicity assays were performed on two different cell lines. The assays were selected to measure different cellular endpoints that are related to cell viability. The MTT assay measures mitochondrial enzymatic activity while the neutral red assay measures the viability of a cell by its ability to uptake and retain the lysosomal staining dye. We also attempted to use a lactose dehydrogenase assay that measures membrane integrity; however, we were not able to compensate for interferences from the nanoparticles and obtained very inconsistent results for this assay. A549 cells are often used as a model cell line for lung exposure, a common route of entry for particles into the body, while J774A.1 macrophages were used because they are known to rapidly take up nanoparticles and inform on the effect that nanoparticles may have on the immune system. A549 cells have been found to be both sensitive and insensitive to NiO particles in recent reports [
13,
14,
15]. Performing the MTT assay on A549 cells (
Table 3,
Figure 3), we found that the NiO nanoparticles are indeed toxic at concentrations typically greater than 50 µg/mL. There was a significant increase in the measured cytotoxicity between 24 and 48 h, with no samples causing a 50% reduction in cell viability at 24 h. This suggests that studies that only report 24 h exposures may fail to capture the full extent of the impact of the particles on the cells. Between 48 and 72 h, very little difference was observed. The two samples that exhibited the highest cytotoxicity in this cell line were Ni-01 and Ni-03. Interestingly, these two samples are very different in their physical properties. Ni-01 is reported to be 50 nm in diameter; however, our TEM measurements suggest the diameter is actually less than 20 nm. This sample was also very poorly dispersed in water and cell culture medium and contained a significant fraction of metal impurities. By contrast, Ni-03 had nearly identical size by TEM but was much better dispersed in water and agglomerated more slowly in cell culture medium. The least cytotoxic sample was the stearic acid-coated sample, not surprising considering its very poor dispersibility in water or cell culture medium. Comparing the results from the MTT assay to the size measurements by DLS and TEM, there was no correlation between particle size and cytotoxicity. Indeed, by TEM there was no significant change at all in primary particle size. As for stability, three of the four most cytotoxic samples were the three samples that had hydrodynamic diameters less than a micron by DLS, suggesting some correlation to the agglomerate stability in cell culture medium, though the Ni-01 sample was an outlier and exhibited significant cytotoxicity despite being poorly dispersed.
We also performed a neutral red assay for each material for 72 h (
Table 3). This assay measures cell membrane integrity. Here, the results showed less overall cytotoxicity, with all samples showing greater than 50% cell viability at 250 µg/mL, the highest concentration tested. In fact, only Ni-01 showed less than 80% cell viability at that concentration. This suggests that while mitochondrial activity may be impaired, the cells appear to still be intact. This highlights the need to use multiple cytotoxicity assays when performing assessments of nanoparticles as different assays measure different markers linked to cytotoxicity. Ionic controls were performed with nickel sulphate for both the MTT and neutral red assays. The IC
50 value under our experimental conditions for NiSO
4 was 110 ± 10 µM at 24 h and 85 ± 10 µM at 48 and 72 h. This increase in cytotoxicity between 24 and 48 h was consistent with some of the NiO samples and could suggest that free ions are the ultimate form leading to cytotoxicity; however, it has been recently shown that the amount of NiO that dissolves in cell culture medium is very low [
34]. In order to determine if particle dissolution occurs inside or outside the cell, a detailed nanoparticle uptake study is needed to determine how quickly the nanoparticles are taken up compared to their rate of dissolution in cell culture medium. Unlike for particles, the ionic control gave the same IC
50 values in the neutral red assay as the MTT assay, suggesting that the mechanism, again, is particle dependent and not just a result of the particles dissolving in cell culture resulting in toxic-free ion concentrations.
The J774A.1 macrophage cell line showed a higher sensitivity to NiO nanoparticle exposure (
Table 4,
Figure 3) compared to the A549 cells under identical conditions. Here, the IC
50 values for four of the nanoparticles were lower—Ni-03, Ni-04, Ni-05, and Ni-07, and activity was observed already at 24 h for these samples. Ni-01 again showed significant cytotoxicity, but cell viability did not fall below 50% until the 48 h time point. Three samples showed less cytotoxicity in this cell line. Stearic acid-coated Ni-06 was very poorly dispersed in aqueous media. The other two coated samples, Ni-05 and Ni-07, showed similar cytotoxicity to the uncoated material of the same size from the same manufacturer, suggesting that the coating is not important for assessing the cytotoxicity in this cell line unless it prevents the particle from dispersing as the stearic acid coating does. Ni-02 also showed very poor dispersibility in water despite being uncoated. Ni-08 stood out against any trends as it was reasonably well-dispersed in cell culture medium and water, had approximately the same particle size as the other uncoated samples, yet exhibited less cytotoxicity. One reason for this may be that the nanoparticle agglomerates are driving the cytotoxicity, and that this sample does not agglomerate as much as other more toxic samples and thus the cells are less affected by it. Agglomerates are often excluded from consideration when considering the bioavailability of nanoparticles; however, since macrophages move across the surface of the wells, they may directly contact agglomerates of particles and endocytose them, resulting in a large and rapid increase in internalized Ni concentration. Ni-02 and Ni-06 may be too heavily agglomerated to interact correctly with the cells, excluding them from being more cytotoxic, and leaving those particles with an intermediate level of agglomeration to have the highest toxic effects—large enough to settle to the surface, yet small enough to still interface with the cellular pathways for uptake. The IC
50 from the ionic controls in this cell line were the same as in A549 cells. Differences in the cytotoxicity of the nanoparticles between the cell lines shows that the nanoparticles themselves must be responsible for the observed cytotoxicity as opposed to dissolution in cell culture medium, as the rate of extracellular dissolution should be the same in both systems.
Oxidative Stress. Just as not all of the NiO nanoparticles shared the same cytotoxic behaviour, the measurement of ROS also varied. In the A549 cells, there are reports that indicate that NiO nanoparticles both do and do not result in oxidative stress [
13,
14,
15]. These results can be harmonized, at least somewhat, by our data as, typically, results are reported only for a single nanoform and in some cases, only at a single concentration. In our experiments, we measured the ROS production of eight nanoforms across seven concentrations (
Supporting Information, Figure S5). Interestingly, there is not a direct link between the amount of ROS produced and the cytotoxicity of the particles in this cell line. This means that the particles are likely interacting with cellular molecules and either directly or indirectly inhibiting critical processes, resulting in cell death. While Ni-01 produced significant ROS and had high cytotoxicity, Ni-03 was even more cytotoxic but produced only minimal ROS compared to untreated controls and only at the very highest concentration tested. Ni-06, the stearic acid-coated sample, did not exhibit any significant cytotoxicity over 72 h; however, this sample still produced ROS in a concentration dependent manner. When we compare the ROS data against the physical chemistry data, we see that Ni-01, Ni-02, and Ni-06 produced higher levels of oxidative stress and were poorly dispersed in water and cell culture medium, while the other samples showed little effect in ROS production outside of the 250 µg/mL samples. Ni-02 is the same sample (different lot) from Sigma Aldrich that has been previously described as not causing oxidative stress [
14], although in this report only 20 ug/mL was tested. In our experiments, we observed that the effect was minimal at that concentration, but as the concentration increases, significant effects were seen for this material that are absent in other NiO samples. By acquiring such large data sets for different nanoforms, we can now start to harmonize some of the literature that appears to conflict but often includes too few concentrations or nanoforms or uses different cell lines which makes realistic comparisons impossible. Our results also emphasize the importance of good physical characterization of materials in order to properly assess their biological effects and the need for larger data sets to establish trends in size and coating effects in different cell lines.
In J774A.1 cells, the effect is more pronounced, with much more oxidative stress at higher particle concentrations (
supporting information, Figure S6). Here, again, while more samples showed oxidative stress, there was not an obvious correlation between oxidative stress and cytotoxicity. In fact, for samples such as Ni-04, Ni-05 and Ni-07 that exhibited significant cytotoxicity, while some ROS increase was observed at higher particle concentrations, no measurable effect was observed at 20 µg/mL, the concentration where half the cells were dead (
Table 4). This shows that while sometimes an effect is observed, there is a disconnect between the concentrations where ROS is observed and where cell viability is dropping. An ionic control using NiS0
4 also showed no significant ROS production at concentrations that were cytotoxic to both cell lines. NiO nanoparticles have been previously shown to not dissolve in cell culture medium [
15] but to dissolve rapidly under lysosomal conditions, suggesting that particles are likely releasing ions inside the cells after uptake, resulting in a process that is cytotoxic but that does not cause oxidative stress. Ni-02 and Ni-06 also exhibited lower cytotoxicity compared to the other samples, while they also exhibited very high levels of ROS production in this cell line. When comparing the ROS data to particle agglomeration, we again see no evidence for a trend. Ni-03, Ni-04, Ni-07, and Ni-08 exhibited the lowest levels of ROS production, and with the exception of Ni-04, the other three samples had Z-average smaller than one micron initially in cell culture medium. Interestingly, samples Ni-03, Ni-04, and Ni-08 are also all uncoated samples. Ni-07 is coated, but the amine-functionalized particles behaved in a manner more like the uncoated samples, while the PVP- and stearic acid-coated samples showed significant ROS production yet very different cytotoxicities in the MTT and neutral red assays. While Ni-01 and Ni-02 are also uncoated, they stood out as being poorly dispersed in water. This suggests that bare particles produce less oxidative stress if well-dispersed in water, and that the silane-coated sample, Ni-07, behaves similar to a bare, well-dispersed particle, while stearic acid and PVP change the behaviour of the particles in cell culture medium.


 and
and 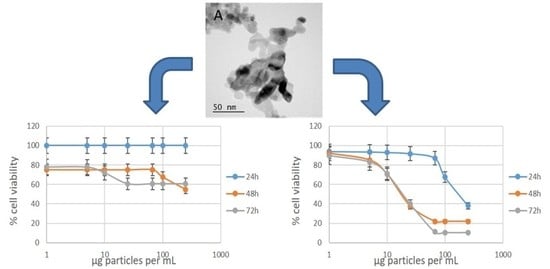


