
High Quality TaS2 Nanosheet SPR Biosensors Improved Sensitivity and the Experimental Demonstration for the Detection of Hg2+

1
International Collaborative Laboratory of 2D Materials for Optoelectronic Science & Technology of Ministry of Education, Key Laboratory of Optoelectronic Devices and Systems of Ministry of Education and Guangdong Province, College of Physics and Optoelectronic Engineering, Shenzhen University, Shenzhen 518060, China
2
International Collaborative Laboratory of 2D Materials for Optoelectronic Science & Technology of Ministry of Education, College of Optoelectronic Engineering, Shenzhen University, Shenzhen 518060, China
*
Author to whom correspondence should be addressed.
Nanomaterials 2022, 12(12), 2075; https://doi.org/10.3390/nano12122075
Submission received: 5 April 2022
/
Revised: 24 May 2022
/
Accepted: 7 June 2022
/
Published: 16 June 2022
(This article belongs to the Special Issue Visionary Development and Synthesis of Nanoparticles: Optical, Electronics, Sensing and Bio Applications)
Abstract
:TaS2 as transition metal dichalcogenide (TMD) two-dimensional (2D) material has sufficient unstructured bonds and large inter-layer spacing, which highly supports transporting and absorbing mercury ions. The structural characterizations and simulation data show that an SPR sensor with high sensitivity can be obtained with a TaS2 material-modified sensitive layer. In this paper, the role of TaS2 nanoparticles in an SPR sensor was explored by simulation and experiment, and the TaS2 layer in an SPR sensor was characterized by SEM, elemental mapping, XPS, and other methods. The application range of structured TaS2 nanoparticles is explored, these TaS2 based sensors were applied to detect Hg2+ ions at a detection limit approaching 1 pM, and an innovative idea for designing highly sensitive detection techniques is provided.
1. Introduction
The concentration of heavy metal mercury ions (Hg2+) in water is an important reference standard for people’s health, and the maximum concentration of Hg2+ allowed in an effluent is 7.5 pM. Water contaminated with mercury ions (Hg2+) and its detection is a global issue to be solved [1]. In the natural environment, Hg2+ exits in a stable state and might slowly accumulate in the food chain [2]. The existence of large amounts of Hg2+ may have a harmful effect on adult health and an even more harmful effect on the health of infants, foetuses, and lactating and pregnant women [3]. For instance, excess Hg2+ has a harmful effect on the digestive, immune, and nervous systems of an adult. It also causes severe harm to the stomach, lungs, and eyes of foetuses, and it may seriously damage them [4]. Hence, mercury pollution is considered a high risk to public safety and public health [5].
In order to lower the harmful effects produced as a result of mercury pollution, researchers have focused on limiting the release of substances that contain Hg2+ and have produced an extraordinarily low discharge standard [6,7]. For example, the US EPA standard is approximately 200pM [8], Japan’s standard is 40 ng/g, and China’s is 0.05 μg/L. However, current Hg2+ detection methods face numerous challenges as a result of the low discharge limit. The traditional technologies that detect Hg2+ are atomic fluorescence spectroscopy (AFS), electrochemistry (EC), and surface plasmon resonance (SPR) [9,10,11,12,13,14,15,16]. Thus, very sensitive pollution detection for Hg2+ is necessary [17,18]. The commonly used SPR optical sensing technologies have several advantages, for example, simple operation, low cost, and good stability [19,20,21]. Recently, graphene and MoS2 based SPR sensors were used as sensing layer materials [22,23,24,25,26]. However, due to the limited availability or shortage of sensing materials on gold surfaces, the use of old-fashioned SPR techniques for detecting low concentrations of metal ions is a big challenge. It is important to address the trace mercury ion low adsorption on to the current available sensing materials such as graphene, etc. [27,28]. Hence, recent research directions have focused on how to detect trace mercury ions and have illustrated the TaS2-based SPR sensors sensing mechanism.
The two-dimensional (2D) TaS2 material is currently a hot topic for researchers after the discovery of monolayer 1T-TaS2 [29,30]. TaS2 has a substantial potential for the removal of Hg2+, which has made it a perfect candidate for Hg2+ sensing [31,32,33,34,35]. By selecting the TaS2 material for a sensing layer as shown in Figure 1, a sensitive TaS2-based SPR biosensor was successfully fabricated to detect Hg2+, with TaS2 nanosheets as the sensing layer. This novel SPR sensor is compatible with the demands of trace Hg2+ detection, and these TaS2 based biosensors detection limit approaches 1 pM. It is evident from the results that the sufficient unsaturated bonds in the TaS2 structure and large interlayer spacing-based biosensors promote adsorption of Hg2+ and efficient transport.
2. Experiment
2.1. Synthesis of Superstructure TaS2 Nanoflakes
The liquid phase stripping method was used to produce the 2D TaS2 material ethanol suspensions. Using ultrasound and a mixture of purified water, the TaS2 interlayer van der Waals force was overcome. Using a centrifuge, TaS2 dispersions were formed by removing the TaS2 block from single and multilayer TaS2. First, 20 mg TaS2 was dissolved in 20 mL water, and we treated the entire solution in bath sonication at a power up to 300 W for 10 h. Furthermore, we controlled the effective temperature of the bath sonication at approximately 10 °C. After the entire procedure, the acquired TaS2 suspension was centrifuged for one hour with a rotation rate of 5000 r/min, then left for 12h for natural settling. For the upper layer liquid using a rotation rate of 12,000 r/min, the final step was centrifuged for 40 min. The subsequent supernatant was made of several layers of TaS2 dispersion for use in the next experiments.
2.2. Assembling of TaS2 Nanoflakes
TaS2 nanoparticles accumulated on gold (Au) chips using a layer-by-layer technique. TaS2 nanoparticle solution and polyetherimide (PEI) alternately flowed past the cell, and finally the TaS2 layers were assembled by electrostatic adsorption. Surplus cations were washed by Milli-Q de-ionized water (18.2 MΩ cm) flowing past the cell. In each dipping period, the thickness increased, and the liquid current velocity was controlled to be lower than 1 mL/min to avoid separation of the finished films.
2.3. Mercury Ion Detection
Mercury ion in a water solution at concentrations from 10−12 M to 10−6 M as imitations of domestic water supply were prepared to systematically pass through SPR biosensor equipment. The buffer was domestic water. We washed the sample using ultra-pure water after immersing it in Hg2+ solutions for half an hour, and then spectrum signals were recorded. The detection signal was exported through a computer linked with a Kretschmann structure electrochemical in situ time resolved SPR sensor.
3. Results and Discussion
3.1. Numerical Simulation
The monolayer TaS2 thickness is 0.361 nm [36,37]. The incident wavelength is 633 nm. In order to simulate this sensor sensitivity, the transmission matrix method is used. Type BK7 glass was selected as coupling prism, and 50 nm Au film was chosen as the metal layer. Equations for the BK7 glass refractive index was obtained from references [38,39]. The Au refractive index is represented by the Drude–Lorentz model [39]. The Au film surface was covered by TaS2 to prevent Au from being oxidized in order to further enhance the sensibility of the designed sensors. The refractive index of TaS2 is 12.25 + 3.06i [40,41,42]. The sensitive medium refractive index is expressed as ns = 1.33 + Δn, whereas Δn designates the sensitive medium refractive index change caused by biological and chemical reaction.
The transfer matrix method was used [43] to calculate the N-layer model incident TM-polarized light reflectivity. These layers are piled vertically to the direction of the BK7 glass coupling prism for these TaS2 allotrope sensors, and the name of each layer is selected using the dielectric constant (εk), thickness (dk) and refractive index (nk), separately.
The transformation of the sensing medium might change the resonance angle (Δθ), where SR1 = Δθ/Δn represents the sensitivity [44]. The BK7 glass has a low refractive index coupling prism to use in these biosensors. Figure 1 shows a conventional Kretschmann structure SPR biosensor that has a metallic layer to activate SPP. By applying a BK7 glass prism, the resulting Au metal layer SPR biosensor sensitivity is 133°/RIU, as shown in Figure 2. For a biochemical sensor, this sensitivity is unsatisfied [45]. Utilizing 2D materials TMDCs TaS2, we have developed SPR biochemical sensors in the current paper to enhance the sensitivity of the sensors [46,47,48].
Figure 2a–e shows the changes of reflectivity versus the incident angle. The resonance angles of the TaS2 sensor shift to higher incidence angles at one layer and the sensitive media refractive indices increase. Sensitivity can be increased by using 2D TMDCs material TaS2-based biochemical sensors. Figure 2f shows the changes in sensitivity of TaS2 on the Au surface. It shows that the biosensor sensitivity increases and then decreases with the addition of TaS2 layers from 1 to 9; the highest sensitivity for TaS2 biosensors is 201°/RIU when the TaS2 layers accumulate to 8 layers. The most likely reason for the transformation is because the light utilization rate reduces with an increase in the number of TaS2 layers. Therefore, the number of TaS2 layers has an optimal value and cannot be increased unboundedly.
From Table 1, we can see that TaS2-based Kretschmann structure SPR biosensors show an obviously improvement.
3.2. Application of TaS2 Based SPR Biosensors in Heavy Metal Ion Detection
The simulation results discussed in the last section provide details for depositing TaS2 nanoparticles onto SPR chip surfaces. First, using layer-by-layer (LBL) techniques, we assembled the as-prepared TaS2 nanosheets onto the SPR chip Au surface. Subsequently, using scanning electron microscopy (SEM), the surface morphology of TaS2 nanosheets over the SPR chips was characterized, as shown in Figure 3. By increasing the dipping cycle, TaS2 nanosheets were more thickly deposited, as shown in Figure 3a–c. Unexpectedly, it was observed that the morphology of the TaS2 nanosheets was not affected by the LBL process, as can be seen in the right side of Figure 3a–c. Thus, assembly of TaS2 nanosheets over SPR chip surfaces can be tuned by LBL assembly techniques. We have obtained SPR curves through different layers as the superstructure TaS2 materials were assembled via LBL method.
We have prepared SPR sensors with chips coated with TaS2 nanosheets that, using SEM, can be seen to detect heavy metal ions. SPR spectra for different mercury ion concentrations from 10−12 M to 10−6 M were obtained, as shown in Figure 4a. We have identified the obvious shift curve toward higher resonance, which shows the Hg2+ adsorption onto the sensing layer material. The Hg2+ detection limit value in the calibration curve for the SPR angle shift versus Hg2+ concentration, from 10−12 M to 10−6 M Hg2+ solution concentration, 1 pM, were found to be the SPR sensor detection range [55]. This method’s detection limit was 200 times lower compared with other techniques [56,57,58]. Figure 4b displays the SPR sensors calibration curve of angle shift along with mercury ion concentration without TaS2 material, which is also in the range of 10−12–10−6, and the SPR spectra do not have much diversification. Figure 4c shows the incident angle changes for mercury ion concentrations from 10−12 M to 10−6 M; after linear fitting, we get a sensitivity of 10.36°/μM.
Apart from detecting Hg2+ in everyday drinking water, we also calculated the SPR sensor selectivity through investigating their responses to other heavy metal ions, for instance, Cr3+, Cr6+, Ag2+, Pb2+, Cu2+, and Cd2+. Under the same conditions, the response of the SPR sensors to dissimilar interfering ions at a level of 10−6 M concentration is shown in Figure 4d. In order to prevent the interference of an ion, we detected six different salts using the same concentration. The signal response ∆θ of the six cations were similarly low, nearly 100 mdeg on the same 10−6 M concentrations. The results reveal that the SPR sensors have a strong selectivity to mercury ions compared with the other metal ions.
3.3. Study of the Mechanism of High Sensitivity of These SPR Biosensors
The mechanism of the sensitivities of these TaS-based SPR sensors to detect Hg2+ was measured using elemental mapping of TaS2 nanoflakes. Shown in the Figure 5, the elemental mapping characterizations of superstructure TaS2 nanosheets by STEM EDS are displayed. Figure 5a shows a STEM image of TaS2 nanoparticles; in the same way Figure 5b–d reveal Ta, S, and Ta + S EDS elemental maps. The distance between the layers of TaS2 nanosheets is large, which is favourable for Hg2+ to enter the inner space where S atoms as binding sites are most likely located. These features allow the use of these TaS2 nanosheets to detect Hg2+ in SPR sensors.
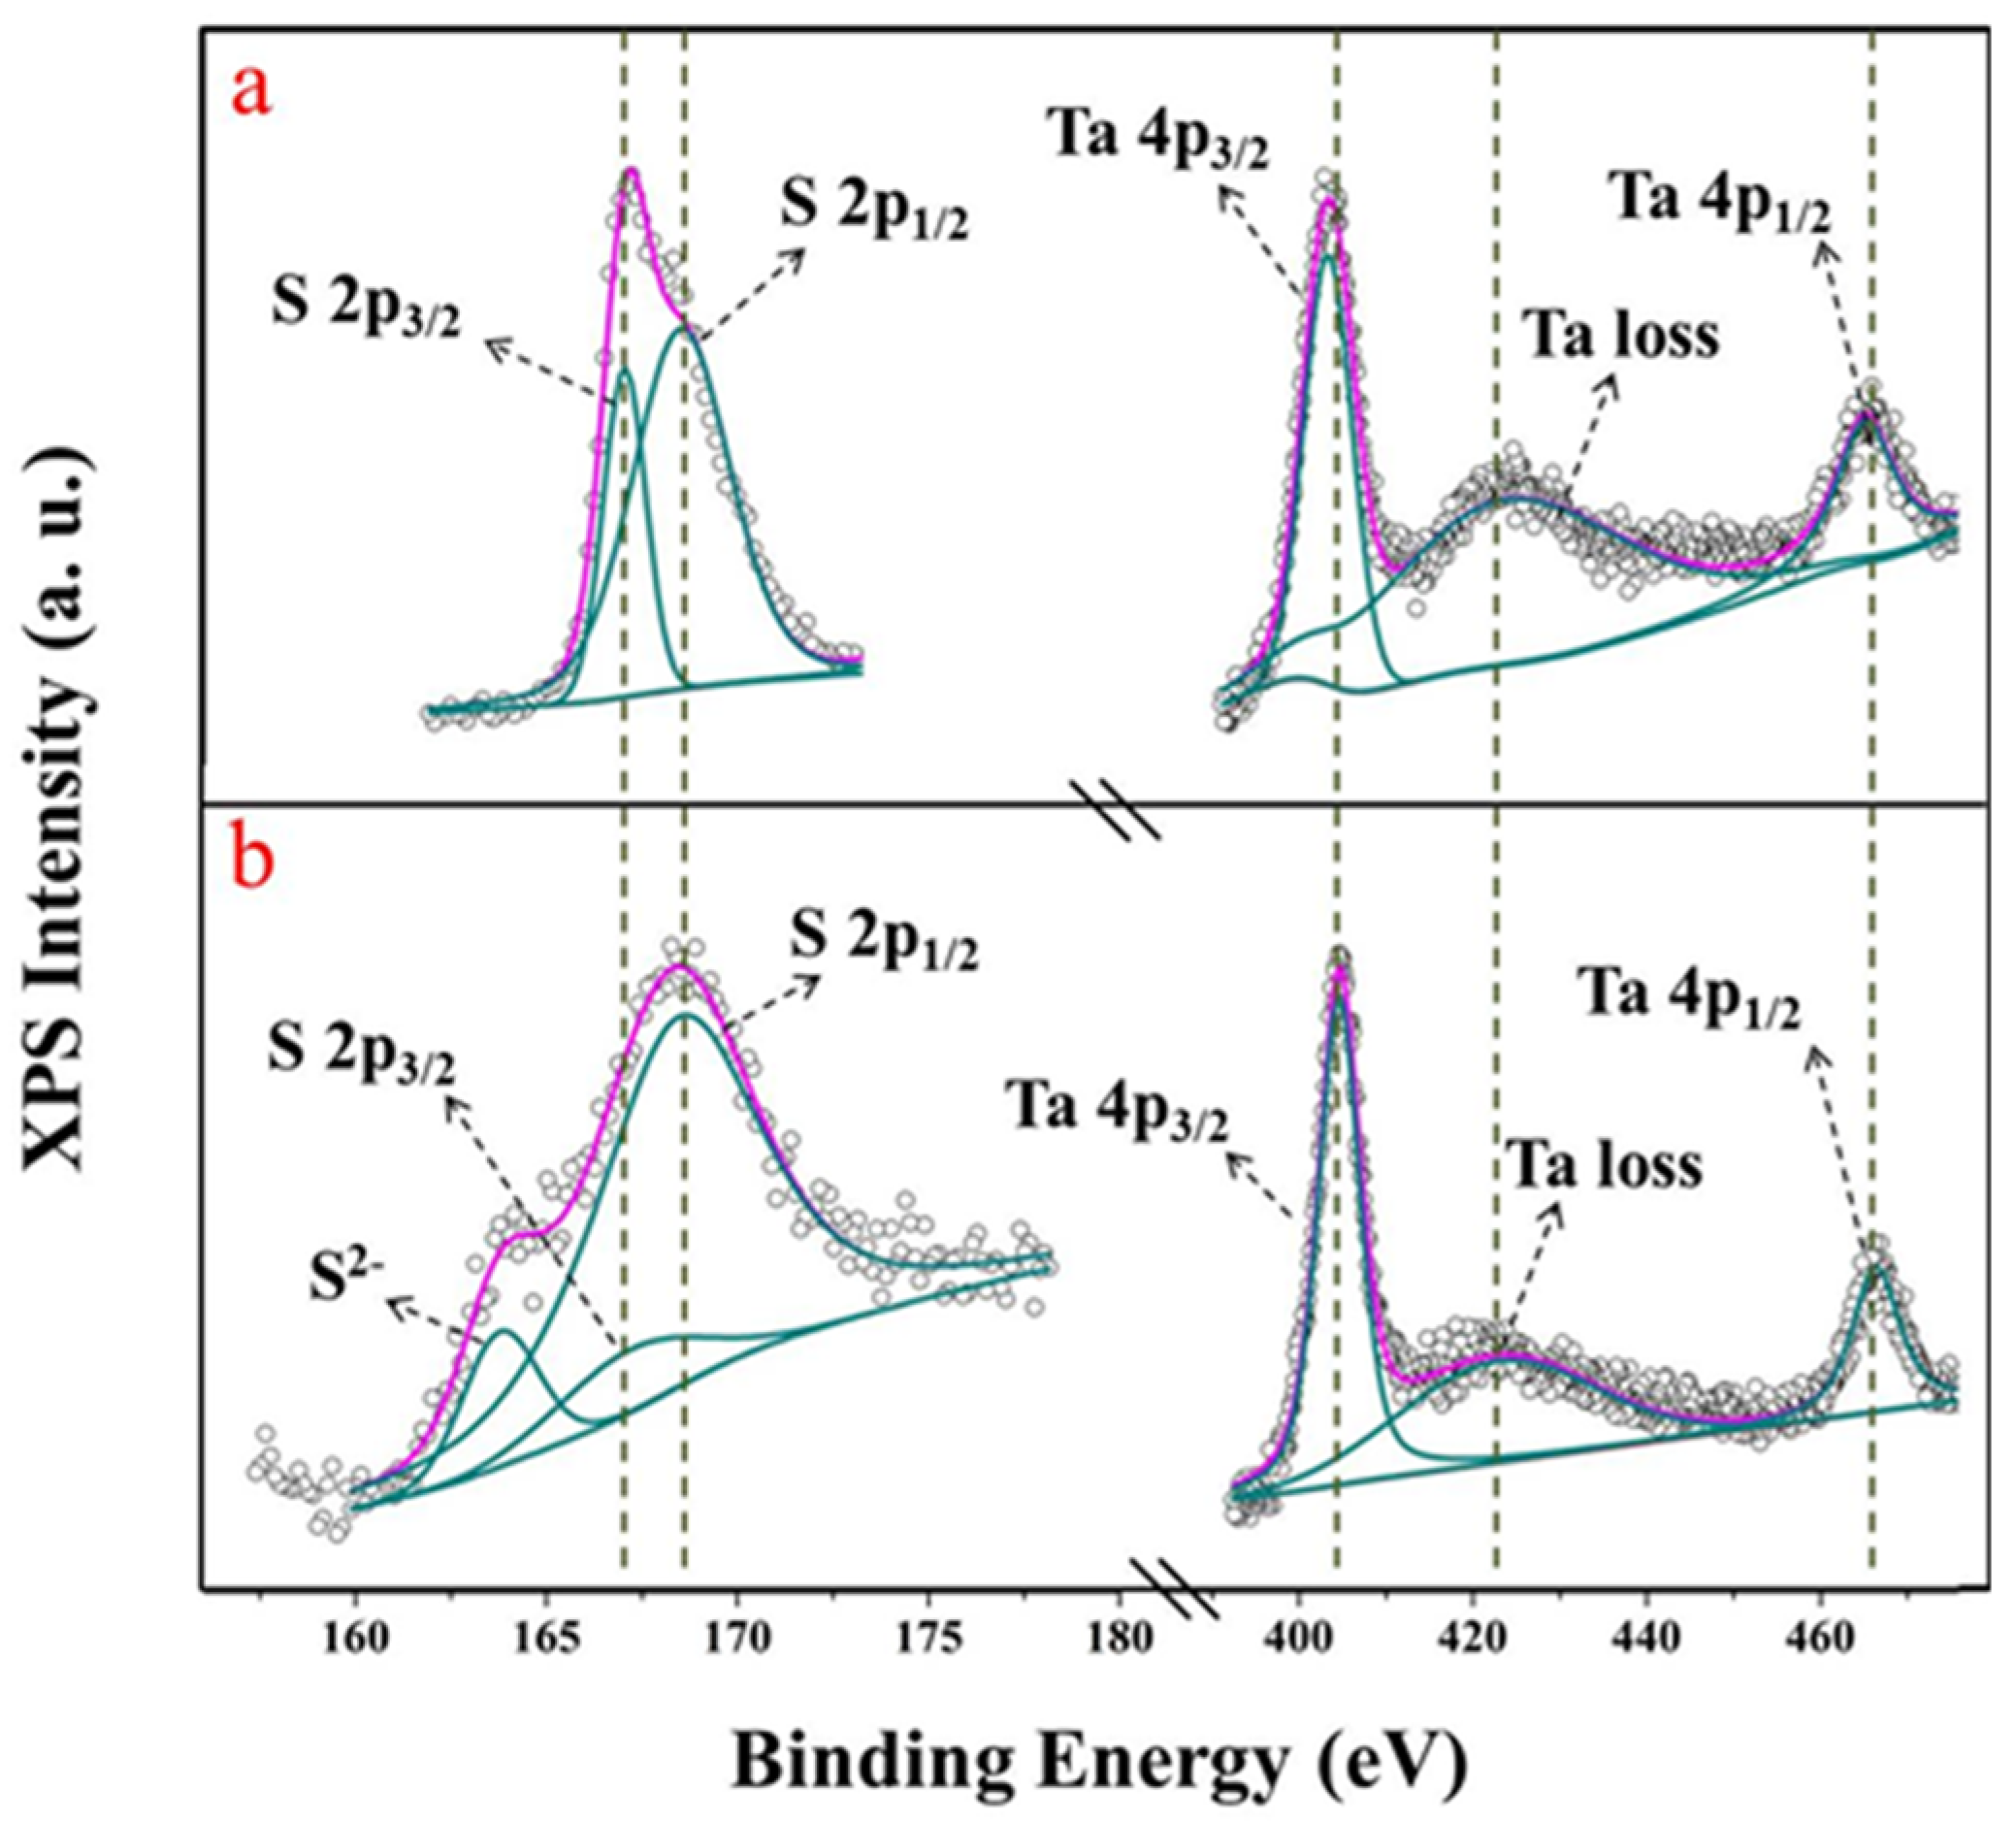
To get a clear picture of these highly sensitivity SPR sensors, we used the ESCALAB-250 instrument to measure X-ray photoelectron spectroscopy (XPS) in order to analyse the chemical states of Ta and S in structured TaS2 nanoparticles and the original TaS2 block. From Figure 6a, it is clear that two characteristic peaks of 167.1 eV and 168.4 eV are accredited to the 2p2/3 and 2p1/2 energy levels of divalent sulphide ions. Figure 6b, on the left side, illustrates that, at low intensity, the peak at 163.7 eV may be attributed to bridging S2-, which represents unsaturated S atoms. The Ta 3d spectra of the TaS2 powder are demonstrated by the peaks at 404.5 eV and 466.3 eV, corresponding to binding energies of Ta 4p3/2 and Ta 4d1/2, respectively (Figure 6a,b), which suggests the presence of TaS2 structure 422.3 eV is the loss of Ta.
The left side of Figure 6b shows new peaks, which suggests the occurrence of the TaS2 structure. The atomic configuration of TaS2 is very dense on the surface of the substrate and also has a very high electronic conductivity, thus facilitating the combination of Hg2+. In TaS2 nanoflakes, the increased sensitivity of Hg2+ in the SPR sensor is promoted by the unsaturated S atoms.
4. Conclusions
Innovative SPR biochemical sensors using 2D TMDCs TaS2 were designed and constructed to enhance the sensitivity to Hg2+ ions. The proposed design has improved the sensitivity of biochemical sensors to 201°/RIU for TaS2. The SPR sensor was developed, and its performance was evaluated through a combination of simulation and experimental results. The detection sensitivity limit of TaS2-based SPR biosensors is nearly 1 pM. TEM, HRTEM, and XPS were used to investigate the mechanism of these highly sensitive SPR sensors. From the obtained results, having a large inter-layer spacing and sufficient non-structural combination in the proposed TaS2-based structure makes Hg2+ effectively transported and absorbed. These studies provide efficient methods for the detection of low Hg2+ concentrations and generalize the utilization of structured TaS2 nanosheets.
Author Contributions
Y.J. is work on Conceptualization, and Writing Original Draft, Y.L. is work on Software, and H.C. is work on Project administration. All authors have read and agreed to the published version of the manuscript.
Funding
This work is supported by National Natural Science Foundation of China (NSFC) (11775147); Guangdong Basic and Applied Basic Research Foundation (Nos. 2019A1515011474 and 2019A1515110130); Shenzhen Science and Technology Program (Nos. JCYJ20210324095007020, JCYJ20200109105201936 and JCYJ20190808115605501).
Data Availability Statement
The data that support the findings of this study are available from the corresponding author upon reasonable request.
Conflicts of Interest
There is no conflict to declare.
References
- Bolisetty, S.; Mezzenga, R. Amyloid-carbon hybrid membranes for universal water purification. Nat. Nanotechnol. 2016, 11, 365. [Google Scholar] [CrossRef]
- Lamborg, C.H.; Hammerschmidt, C.R.; Bowman, K.L.; Swarr, G.J.; Munson, K.M.; Ohnemus, D.C.; Lam, P.J.; Heimbuerger, L.-E.; Rijkenberg, M.J.A.; Saito, M.A. A global ocean inventory of anthropogenic mercury based on water column measurements. Nature 2014, 512, 65. [Google Scholar] [CrossRef] [PubMed]
- Gu, B.; Zhou, Y.; Zhang, X.; Liu, X.; Zhang, Y.; Marks, R.; Zhang, H.; Liu, X.; Zhang, Q. Thiazole derivative-modified upconversion nanoparticles for Hg2+ detection in living cells. Nanoscale 2016, 8, 276–282. [Google Scholar] [CrossRef]
- Kosik-Bogacka, D.; Lanocha-Arendarczyk, N.; Kot, K.; Malinowski, W.; Szymanski, S.; Sipak-Szmigiel, O.; Pilarczyk, B.; Tomza-Marciniak, A.; Podlasinska, J.; Tomska, N.; et al. Concentrations of mercury (Hg) and selenium (Se) in afterbirth and their relations with various factors. Environ. Geochem. Health 2018, 40, 1683–1695. [Google Scholar] [CrossRef]
- Mao, S.; Chang, J.; Pu, H.; Lu, G.; He, Q.; Zhang, H.; Chen, J. Two-dimensional nanomaterial-based field-effect transistors for chemical and biological sensing. Chem. Soc. Rev. 2017, 46, 6872–6904. [Google Scholar] [CrossRef] [PubMed]
- Ai, K.; Ruan, C.; Shen, M.; Lu, L. MoS2 Nanosheets with Widened Interlayer Spacing for High-Efficiency Removal of Mercury in Aquatic Systems. Adv. Funct. Mater. 2016, 26, 5542–5549. [Google Scholar] [CrossRef]
- Geng, F.; Jiang, X.; Wang, Y.; Shao, C.; Wang, K.; Qu, P.; Xu, M. DNA-based dual fluorescence signals on and ratiometric mercury sensing in fetal calf serum with simultaneous excitation. Sens. Actuators B Chem. 2018, 260, 793–799. [Google Scholar] [CrossRef]
- Huang, J.; Gao, X.; Jia, J.; Kim, J.-K.; Li, Z. Graphene Oxide-Based Amplified Fluorescent Biosensor for Hg2+ Detection through Hybridization Chain Reactions. Anal. Chem. 2014, 86, 3209–3215. [Google Scholar] [CrossRef] [PubMed]
- Zhang, Z.; Tang, A.; Liao, S.; Chen, P.; Wu, Z.; Shen, G.; Yu, R. Oligonucleotide probes applied for sensitive enzyme-amplified electrochemical assay of mercury(II) ions. Biosens. Bioelectron. 2011, 26, 3320–3324. [Google Scholar] [CrossRef]
- Kopysc, E.; Pyrzynska, K.; Garbos, S.; Bulska, E. Determination of mercury by cold-vapor atomic absorption spectrometry with preconcentration on a gold-trap. Anal. Sci. 2000, 16, 1309–1312. [Google Scholar] [CrossRef] [Green Version]
- Karunasagar, D.; Arunachalam, J.; Gangadharan, S. Development of a ‘collect and punch’ cold vapour inductively coupled plasma mass spectrometric method for the direct determination of mercury at nanograms per litre levels. J. Anal. At. Spectrom. 1998, 13, 679–682. [Google Scholar] [CrossRef]
- Elgazali, A.A.S.; Gajdosechova, Z.; Abbas, Z.; Lombi, E.; Scheckel, K.G.; Donner, E.; Fiedler, H.; Feldmann, J.; Krupp, E.M. Reactive gaseous mercury is generated from chloralkali factories resulting in extreme concentrations of mercury in hair of workers. Sci. Rep. 2018, 8, 3675. [Google Scholar] [CrossRef] [Green Version]
- Kabashin, A.V.; Evans, P.; Pastkovsky, S.; Hendren, W.; Wurtz, G.A.; Atkinson, R.; Pollard, R.; Podolskiy, V.A.; Zayats, A.V. Plasmonic nanorod metamaterials for biosensing. Nat. Mater. 2009, 8, 867–871. [Google Scholar] [CrossRef]
- Sreekanth, K.V.; Alapan, Y.; ElKabbash, M.; Ilker, E.; Hinczewski, M.; Gurkan, U.A.; de Luca, A.; Strangi, G. Extreme sensitivity biosensing platform based on hyperbolic metamaterials. Nat. Mater. 2016, 15, 621–627. [Google Scholar] [CrossRef] [Green Version]
- Garoli, D.; Calandrini, E.; Giovannini, G.; Hubarevich, A.; Caligiuri, V.; de Angelis, F. Nanoporous gold metamaterials for high sensitivity plasmonic sensing. Nanoscale Horiz. 2019, 4, 1153–1157. [Google Scholar] [CrossRef]
- Yan, R.; Wang, T.; Yue, X.; Wang, H.; Zhang, Y.-H.; Xu, P.; Wang, L.; Wang, Y.; Zhang, J. Highly sensitive plasmonic nanorod hyperbolic metamaterial biosensor. Photon. Res. 2022, 10, 84–95. [Google Scholar] [CrossRef]
- Wei, Q.; Nagi, R.; Sadeghi, K.; Feng, S.; Yan, E.; Ki, S.J.; Caire, R.; Tseng, D.; Ozcan, A. Detection and Spatial Mapping of Mercury Contamination in Water Samples Using a Smart-Phone. ACS Nano 2014, 8, 1121–1129. [Google Scholar] [CrossRef] [PubMed]
- Gu, W.; Pei, X.; Cheng, Y.; Zhang, C.; Zhang, J.; Yan, Y.; Ding, C.; Xian, Y. Black Phosphorus Quantum Dots as the Ratiometric Fluorescence Probe for Trace Mercury Ion Detection Based on Inner Filter Effect. ACS Sens. 2017, 2, 576–582. [Google Scholar] [CrossRef]
- Berger, C.; Song, Z.; Li, X.; Wu, X.; Brown, N.; Naud, C.; Mayou, D.; Li, T.; Hass, J.; Marchenkov, A.N.; et al. Electronic confinement and coherence in patterned epitaxial graphene. Science 2006, 312, 1191–1196. [Google Scholar] [CrossRef] [Green Version]
- Xue, T.; Cui, X.; Chen, J.; Liu, C.; Wang, Q.; Wang, H.; Zheng, W. A Switch of the Oxidation State of Graphene Oxide on a Surface Plasmon Resonance Chip. ACS Appl. Mater. Interfaces 2013, 5, 2096–2103. [Google Scholar] [CrossRef]
- Han, S.-T.; Peng, H.; Sun, Q.; Venkatesh, S.; Chung, K.-S.; Lau, S.C.; Zhou, Y.; Roy, V.A.L. An Overview of the Development of Flexible Sensors. Adv. Mater. 2017, 29, 1700375. [Google Scholar] [CrossRef] [PubMed]
- Xue, T.; Qi, K.; Hu, C. Novel SPR sensing platform based on superstructure MoS2 nanosheets for ultrasensitive detection of mercury ion. Sens. Actuators B Chem. 2019, 284, 589–594. [Google Scholar] [CrossRef]
- Yuting, Z.; Shuaiwen, G.; Leiming, W.; Jiaqi, Z.; Yuanjiang, X.; Xiaoyu, D. GeSe nanosheets modified surface plasmon resonance sensors for enhancing sensitivity. Nanophotonics 2020, 9, 327–336. [Google Scholar]
- Xue, T.; Yu, S.; Zhang, X.; Zhang, X.; Wang, L.; Bao, Q.; Chen, C.; Zheng, W.; Cui, X. R6G molecule induced modulation of the optical properties of reduced graphene oxide nanosheets for use in ultrasensitive SPR sensing. Sci. Rep. 2016, 6, 21254. [Google Scholar] [CrossRef] [PubMed] [Green Version]
- Loh, K.P.; Bao, Q.; Eda, G.; Chhowalla, M. Graphene oxide as a chemically tunable platform for optical applications. Nat. Chem. 2010, 2, 1015–1024. [Google Scholar] [CrossRef]
- Tan, C.; Lai, Z.; Zhang, H. Ultrathin Two-Dimensional Multinary Layered Metal Chalcogenide Nanomaterials. Adv. Mater. 2017, 29, 1701392. [Google Scholar] [CrossRef]
- Zhou, G.; Chang, J.; Pu, H.; Shi, K.; Mao, S.; Sui, X.; Ren, R.; Cui, S.; Chen, J. Ultrasensitive Mercury Ion Detection Using DNA-Functionalized Molybdenum Disulfide Nanosheet/Gold Nanoparticle Hybrid Field Effect Transistor Device. ACS Sens. 2016, 1, 295–302. [Google Scholar] [CrossRef]
- Gooding, J.J.; Gaus, K. Single-Molecule Sensors: Challenges and Opportunities for Quantitative Analysis. Angew. Chem. Int. Ed. 2016, 55, 11354–11366. [Google Scholar] [CrossRef]
- Li, H.; Tan, Y.; Liu, P.; Guo, C.; Luo, M.; Han, J.; Lin, T.; Huang, F.; Chen, M. Atomic-Sized Pores Enhanced Electrocatalysis of TaS2 Nanosheets for Hydrogen Evolution. Adv. Mater. 2016, 28, 8945–8949. [Google Scholar] [CrossRef]
- Sanders, C.E.; Dendzik, M.; Ngankeu, A.S.; Eich, A.; Bruix, A.; Bianchi, M.; Miwa, J.A.; Hammer, B.; Khajetoorians, A.A.; Hofmann, P. Crystalline and electronic structure of single-layer TaS2. Phys. Rev. B 2016, 94, 081404. [Google Scholar] [CrossRef] [Green Version]
- Ma, L.; Ye, C.; Yu, Y.; Lu, X.F.; Niu, X.; Kim, S.; Feng, D.; Tomanek, D.; Son, Y.-W.; Chen, X.H.; et al. A metallic mosaic phase and the origin of Mott-insulating state in 1T-TaS2. Nat. Commun. 2016, 7, 10956. [Google Scholar] [CrossRef] [PubMed]
- Fu, W.; Chen, Y.; Lin, J.; Wang, X.; Zeng, Q.; Zhou, J.; Zheng, L.; Wang, H.; He, Y.; He, H.; et al. Controlled Synthesis of Atomically Thin 1T-TaS2 for Tunable Charge Density Wave Phase Transitions. Chem. Mater. 2016, 28, 7613–7618. [Google Scholar] [CrossRef]
- Yoshida, M.; Zhang, Y.; Ye, J.; Suzuki, R.; Imai, Y.; Kimura, S.; Fujiwara, A.; Iwasa, Y. Controlling charge-density-wave states in nano-thick crystals of 1T-TaS2. Sci. Rep. 2014, 4, 7302. [Google Scholar] [CrossRef] [PubMed] [Green Version]
- Ding, Y.; Wang, Y.; Ni, J.; Shi, L.; Shi, S.; Tang, W. First principles study of structural, vibrational and electronic properties of graphene-like MX2 (M=Mo, Nb, W, Ta; X=S, Se, Te) monolayers. Phys. B Condens. Matter 2011, 406, 2254–2260. [Google Scholar] [CrossRef]
- Yang, Y.; Fang, S.; Fatemi, V.; Ruhman, J.; Navarro-Moratalla, E.; Watanabe, K.; Taniguchi, T.; Kaxiras, E.; Jarillo-Herrero, P. Enhanced superconductivity upon weakening of charge density wave transport in 2H-TaS2 in the two-dimensional limit. Phys. Rev. B 2018, 98, 035203. [Google Scholar] [CrossRef] [Green Version]
- Wu, J.; Peng, J.; Yu, Z.; Zhou, Y.; Guo, Y.; Li, Z.; Lin, Y.; Ruan, K.; Wu, C.; Xie, Y. Acid-Assisted Exfoliation toward Metallic Sub-nanopore TaS2 Monolayer with High Volumetric Capacitance. J. Am. Chem. Soc. 2018, 140, 493–498. [Google Scholar] [CrossRef]
- Zeng, Z.; Tan, C.; Huang, X.; Bao, S.; Zhang, H. Growth of noble metal nanoparticles on single-layer TiS2 and TaS2 nanosheets for hydrogen evolution reaction. Energy Environ. Sci. 2014, 7, 797–803. [Google Scholar] [CrossRef]
- Zeng, S.; Hu, S.; Xia, J.; Anderson, T.; Dinh, X.-Q.; Meng, X.-M.; Coquet, P.; Yong, K.-T. Graphene-MoS2 hybrid nanostructures enhanced surface plasmon resonance biosensors. Sens. Actuators B Chem. 2015, 207, 801–810. [Google Scholar] [CrossRef]
- Polyanskiy, M.M. Refractive Index Database. Johnson and Christy 1972. Available online: http://refractiveindex.info (accessed on 4 April 2022).
- Gupta, B.D.; Sharma, A.K. Sensitivity evaluation of a multi-layered surface plasmon resonance-based fiber optic sensor: A theoretical study. Sens. Actuators B Chem. 2005, 107, 40–46. [Google Scholar] [CrossRef]
- Van Soest, J.P. Optical and Electronic Reflectivity of TaS2. 2018. Available online: https://hdl.handle.net/1887/64692 (accessed on 4 April 2022).
- Albertini, O.R.; Liu, A.Y.; Calandra, M. Effect of electron doping on lattice instabilities in single-layer 1H-TaS2. Phys. Rev. B 2017, 95, 235121. [Google Scholar] [CrossRef] [Green Version]
- Hansen, W.N. Electric fields produced by propagation of plane coherent electromagnetic radiation in a stratified medium. J. Opt. Soc. Am. 1968, 58, 380–390. [Google Scholar] [CrossRef]
- Maharana, P.K.; Jha, R. Chalcogenide prism and graphene multilayer based surface plasmon resonance affinity biosensor for high performance. Sens. Actuators B Chem. 2012, 169, 161–166. [Google Scholar] [CrossRef]
- Zeng, S.; Baillargeat, D.; Ho, H.-P.; Yong, K.-T. Nanomaterials enhanced surface plasmon resonance for biological and chemical sensing applications. Chem. Soc. Rev. 2014, 43, 3426–3452. [Google Scholar] [CrossRef] [PubMed]
- Qiao, Y.-B.; Li, Y.-L.; Zhong, G.-H.; Zeng, Z.; Qin, X.-Y. Anisotropic properties of TaS2. Chin. Phys. 2007, 16, 3809–3814. [Google Scholar]
- Reshak, A.H.; Auluck, S. Full-potential calculations of the electronic and optical properties for 1T and 2H phases of TaS2 and TaSe2. Phys. B Condens. Matter 2005, 358, 158–165. [Google Scholar] [CrossRef]
- Sharma, S.; Auluck, S.; Khan, M.A. Optical properties of 1T and 2H phases of TaS2 and TaSe2. Pramana 2000, 54, 431–440. [Google Scholar] [CrossRef]
- Meshginqalam, B.; Ahmadi, M.T.; Ismail, R.; Sabatyan, A. Graphene/Graphene Oxide-Based Ultrasensitive Surface Plasmon Resonance Biosensor. Plasmonics 2017, 12, 1991–1997. [Google Scholar] [CrossRef]
- Choi, S.H.; Kim, Y.L.; Byun, K.M. Graphene-on-silver substrates for sensitive surface plasmon resonance imaging biosensors. Opt. Express 2011, 19, 458–466. [Google Scholar] [CrossRef]
- Nigam, A.; Goel, N.; Bhat, T.N.; Rahman, M.T.; Dolmanan, S.B.; Qiao, Q.; Tripathy, S.; Kumar, M. Real time detection of Hg2+ ions using MoS2 functionalized AlGaN/GaN high electron mobility transistor for water quality monitoring. Sens. Actuators B Chem. 2020, 309, 127832. [Google Scholar] [CrossRef]
- Wu, L.; Zhu, J.; Gan, S.; Ma, Q.; Dai, X.; Xiang, Y. Application of Few-Layer Transition Metal Dichalcogenides to Detect the Refractive Index Variation in Lossy-Mode Resonance Sensors with High Figure of Merit. IEEE Sens. J. 2019, 19, 5030–5034. [Google Scholar] [CrossRef]
- Zhu, J.; Ke, Y.; Dai, J.; You, Q.; Wu, L.; Li, J.; Guo, J.; Xiang, Y.; Dai, X. Topological insulator overlayer to enhance the sensitivity and detection limit of surface plasmon resonance sensor. Nanophotonics 2020, 9, 1941–1951. [Google Scholar] [CrossRef] [Green Version]
- Zuo, X.; Zhang, H.; Zhu, Q.; Wang, W.; Feng, J.; Chen, X. A dual-color fluorescent biosensing platform based on WS2 nanosheet for detection of Hg2+ and Ag+. Biosens. Bioelectron. 2016, 85, 464–470. [Google Scholar] [CrossRef] [PubMed]
- Thompson, M.; Ellison, S.L.R.; Wood, R. Harmonized guidelines for single-laboratory validation of methods of analysis—(IUPAC technical report). Pure Appl. Chem. 2002, 74, 835–855. [Google Scholar] [CrossRef]
- Xuan, F.; Luo, X.; Hsing, I.M. Conformation-Dependent Exonuclease III Activity Mediated by Metal Ions Reshuffling on Thymine-Rich DNA Duplexes for an Ultrasensitive Electrochemical Method for Hg2+ Detection. Anal. Chem. 2013, 85, 4586–4593. [Google Scholar] [CrossRef] [PubMed]
- Cui, L.; Wu, J.; Li, M.; Ju, H. Highly sensitive electrochemical detection of mercury (II) via single ion-induced three-way junction of DNA. Electrochem. Commun 2015, 59, 77–80. [Google Scholar] [CrossRef]
- Shahat, A.; Elsalam, S.A.; Herrero-Martinez, J.M.; Simo-Alfonso, E.F.; Ramis-Ramos, G. Optical recognition and removal of Hg(II) using a new self-chemosensor based on a modified amino-functionalized Al-MOF. Sens. Actuators B Chem. 2017, 253, 164–172. [Google Scholar] [CrossRef]
Figure 1.
TaS2 nanoflakes as the sensing layer to detect trace mercury ions in SPR sensors.
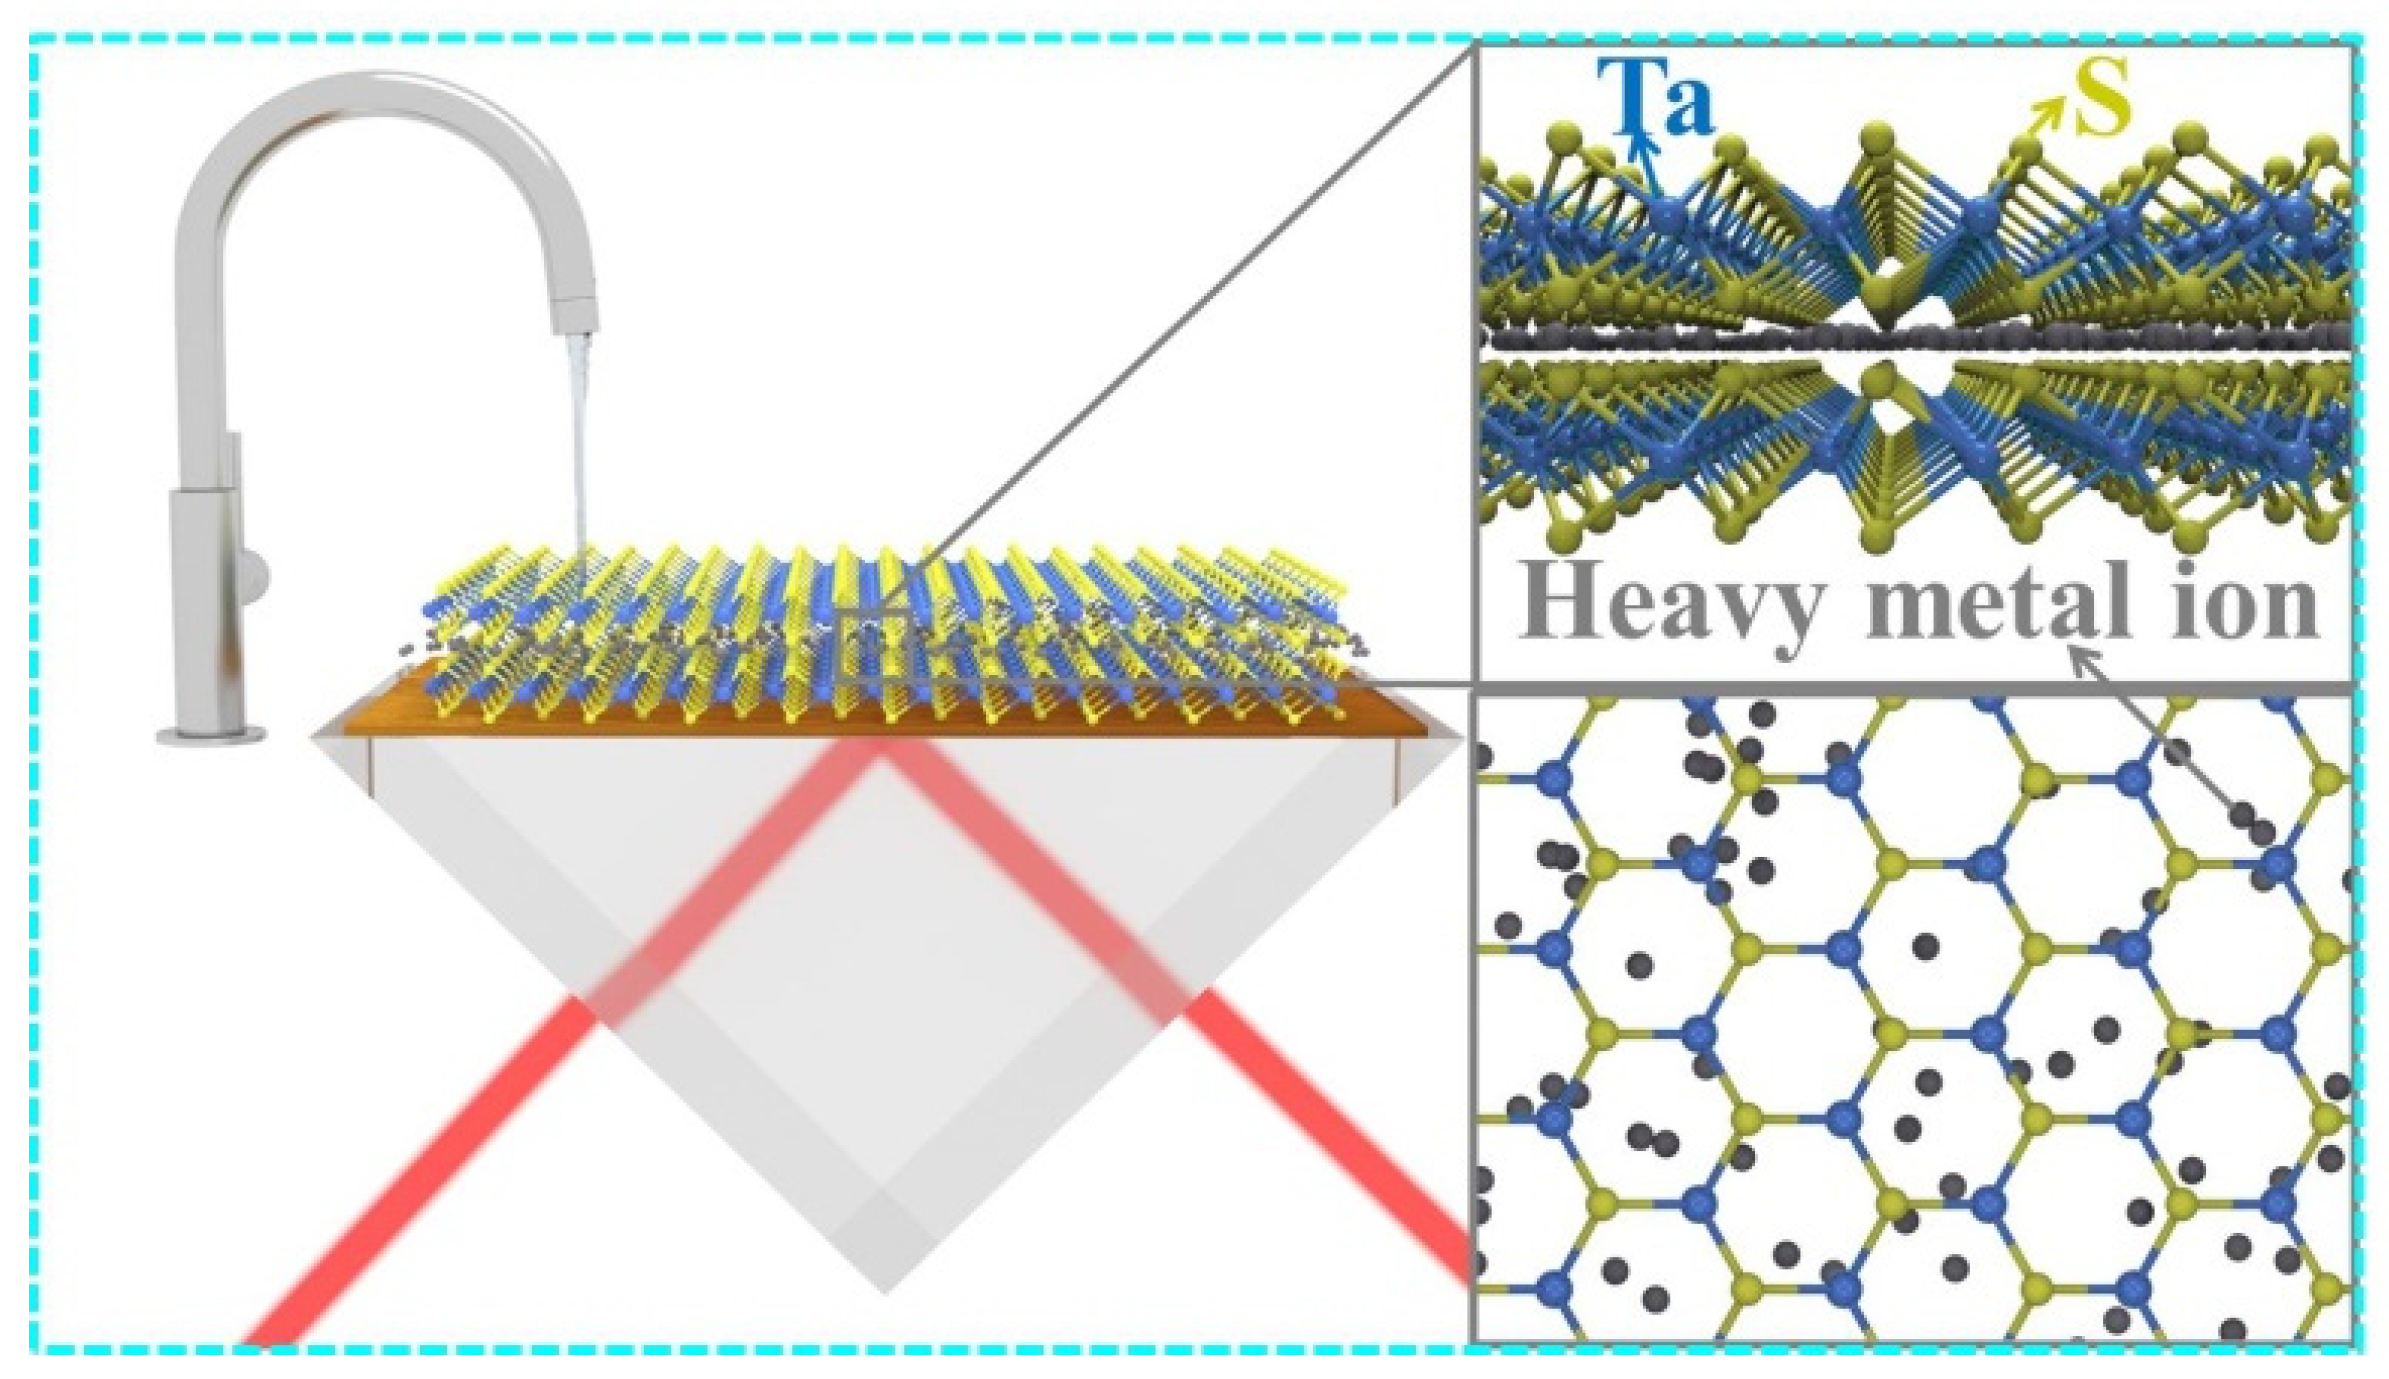
Figure 2.
(a–e) Simulation change of reflectivity relative to incident angles with different numbers of TaS2 nanosheets; (f) variation of sensitivity with respect to the number of TaS2 nanosheets.
Figure 2.
(a–e) Simulation change of reflectivity relative to incident angles with different numbers of TaS2 nanosheets; (f) variation of sensitivity with respect to the number of TaS2 nanosheets.
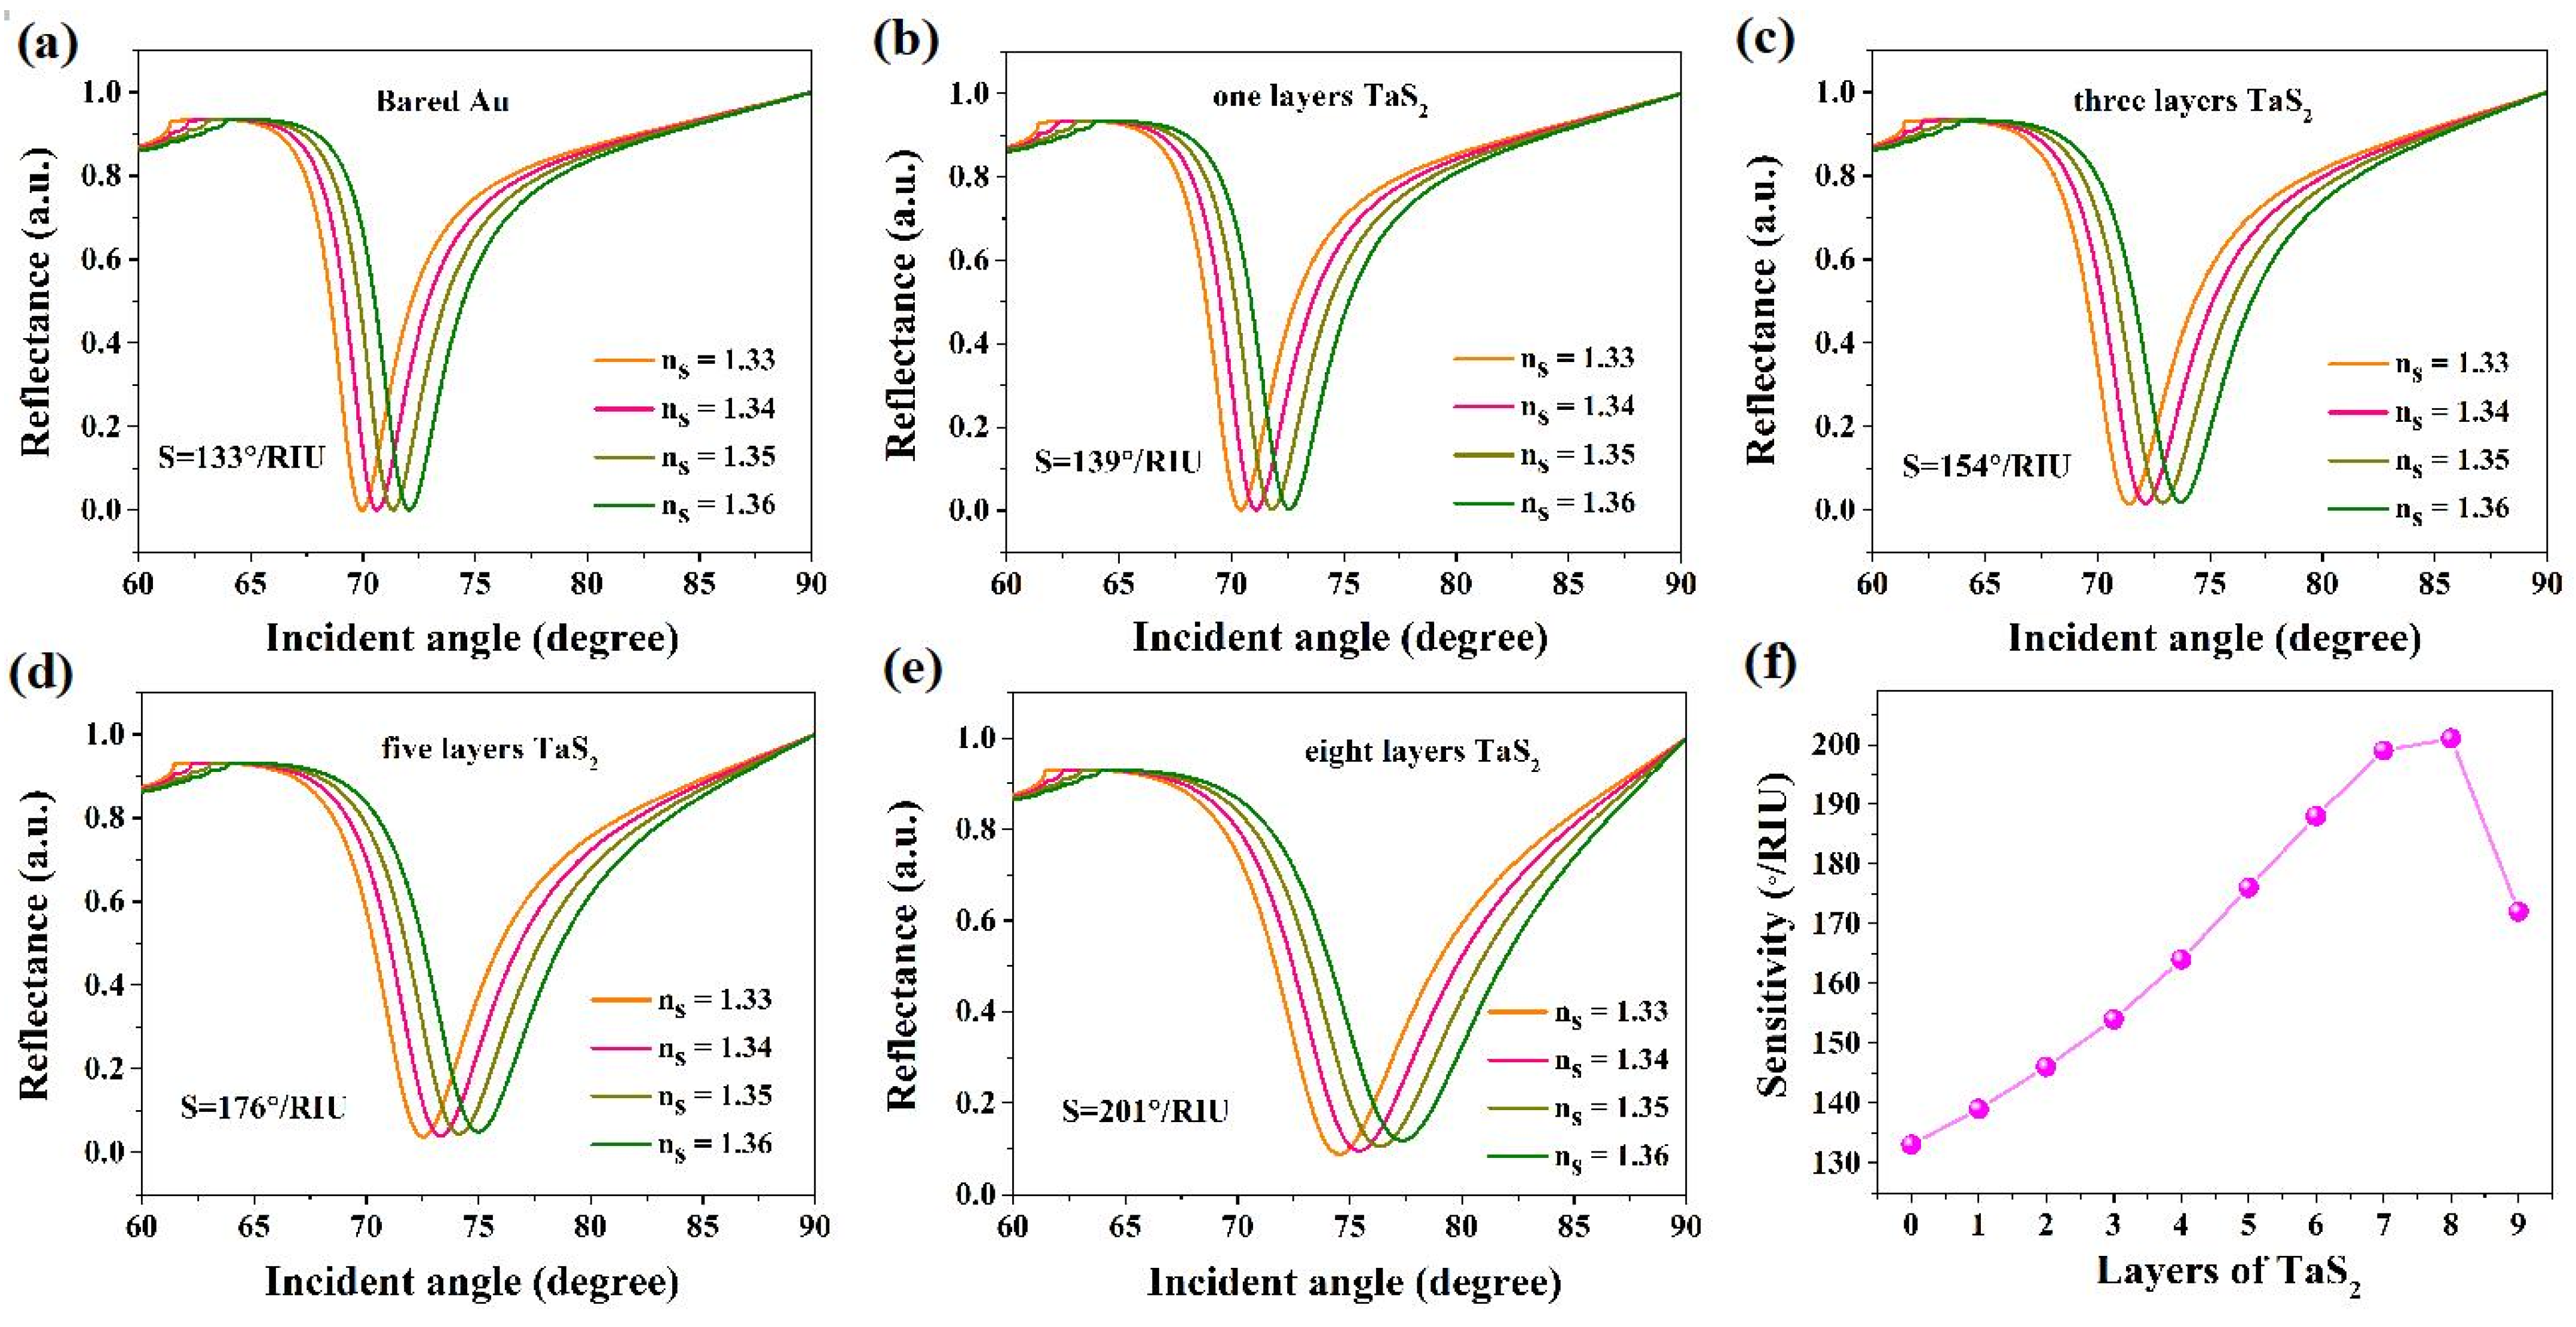
Figure 3.
(a–c) The SEM images of the superstructure TaS2 nanoparticles assembled with different thicknesses were obtained for 1 μm scale bar on the SPR chip surface. The panels on the right side are the magnified images, with a scale bar of 100 nm.
Figure 3.
(a–c) The SEM images of the superstructure TaS2 nanoparticles assembled with different thicknesses were obtained for 1 μm scale bar on the SPR chip surface. The panels on the right side are the magnified images, with a scale bar of 100 nm.
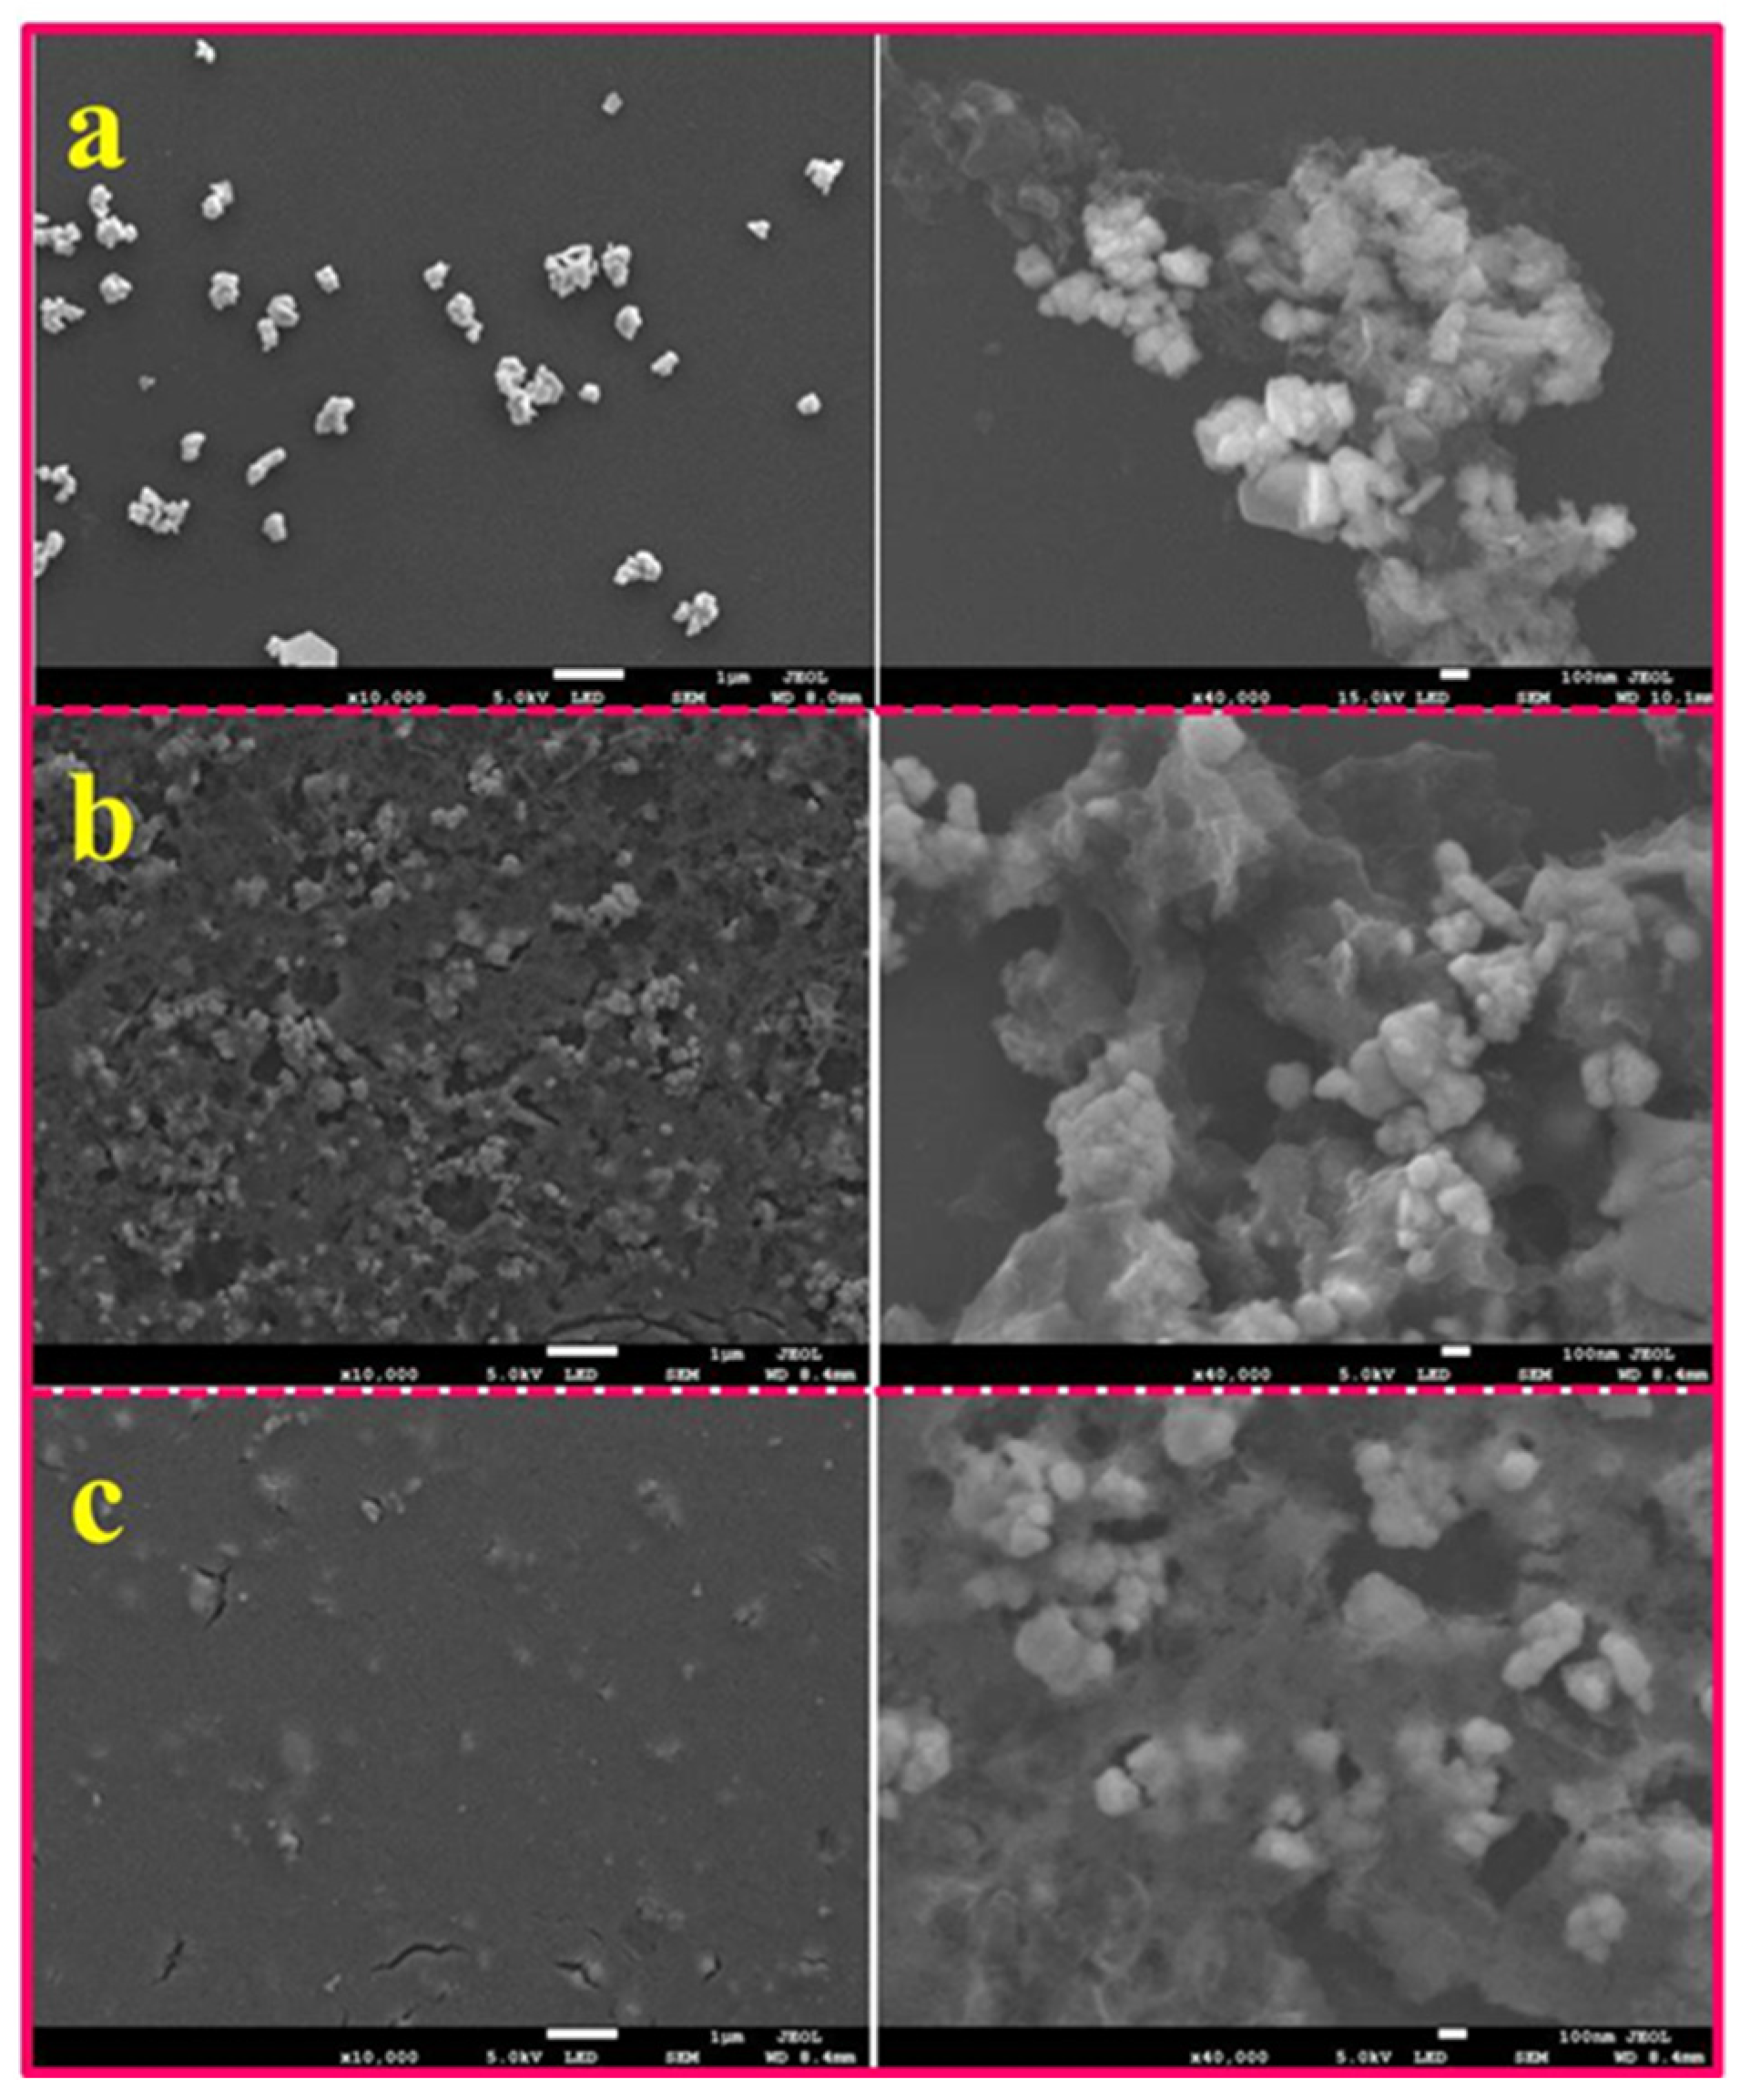
Figure 4.
(a) The TaS2 SPR spectra at different concentrations of Hg2+ from 10−12 to 10−6 M; (b) SPR spectra without TaS2 at different concentrations of Hg2+ from 10−12 to 10−6 M; (c) the fitting curve of the incident angle at different concentrations of Hg2+ from 10−12 to 10−6 M; (d) selectivity of these TaS2 based Hg2+ sensors.
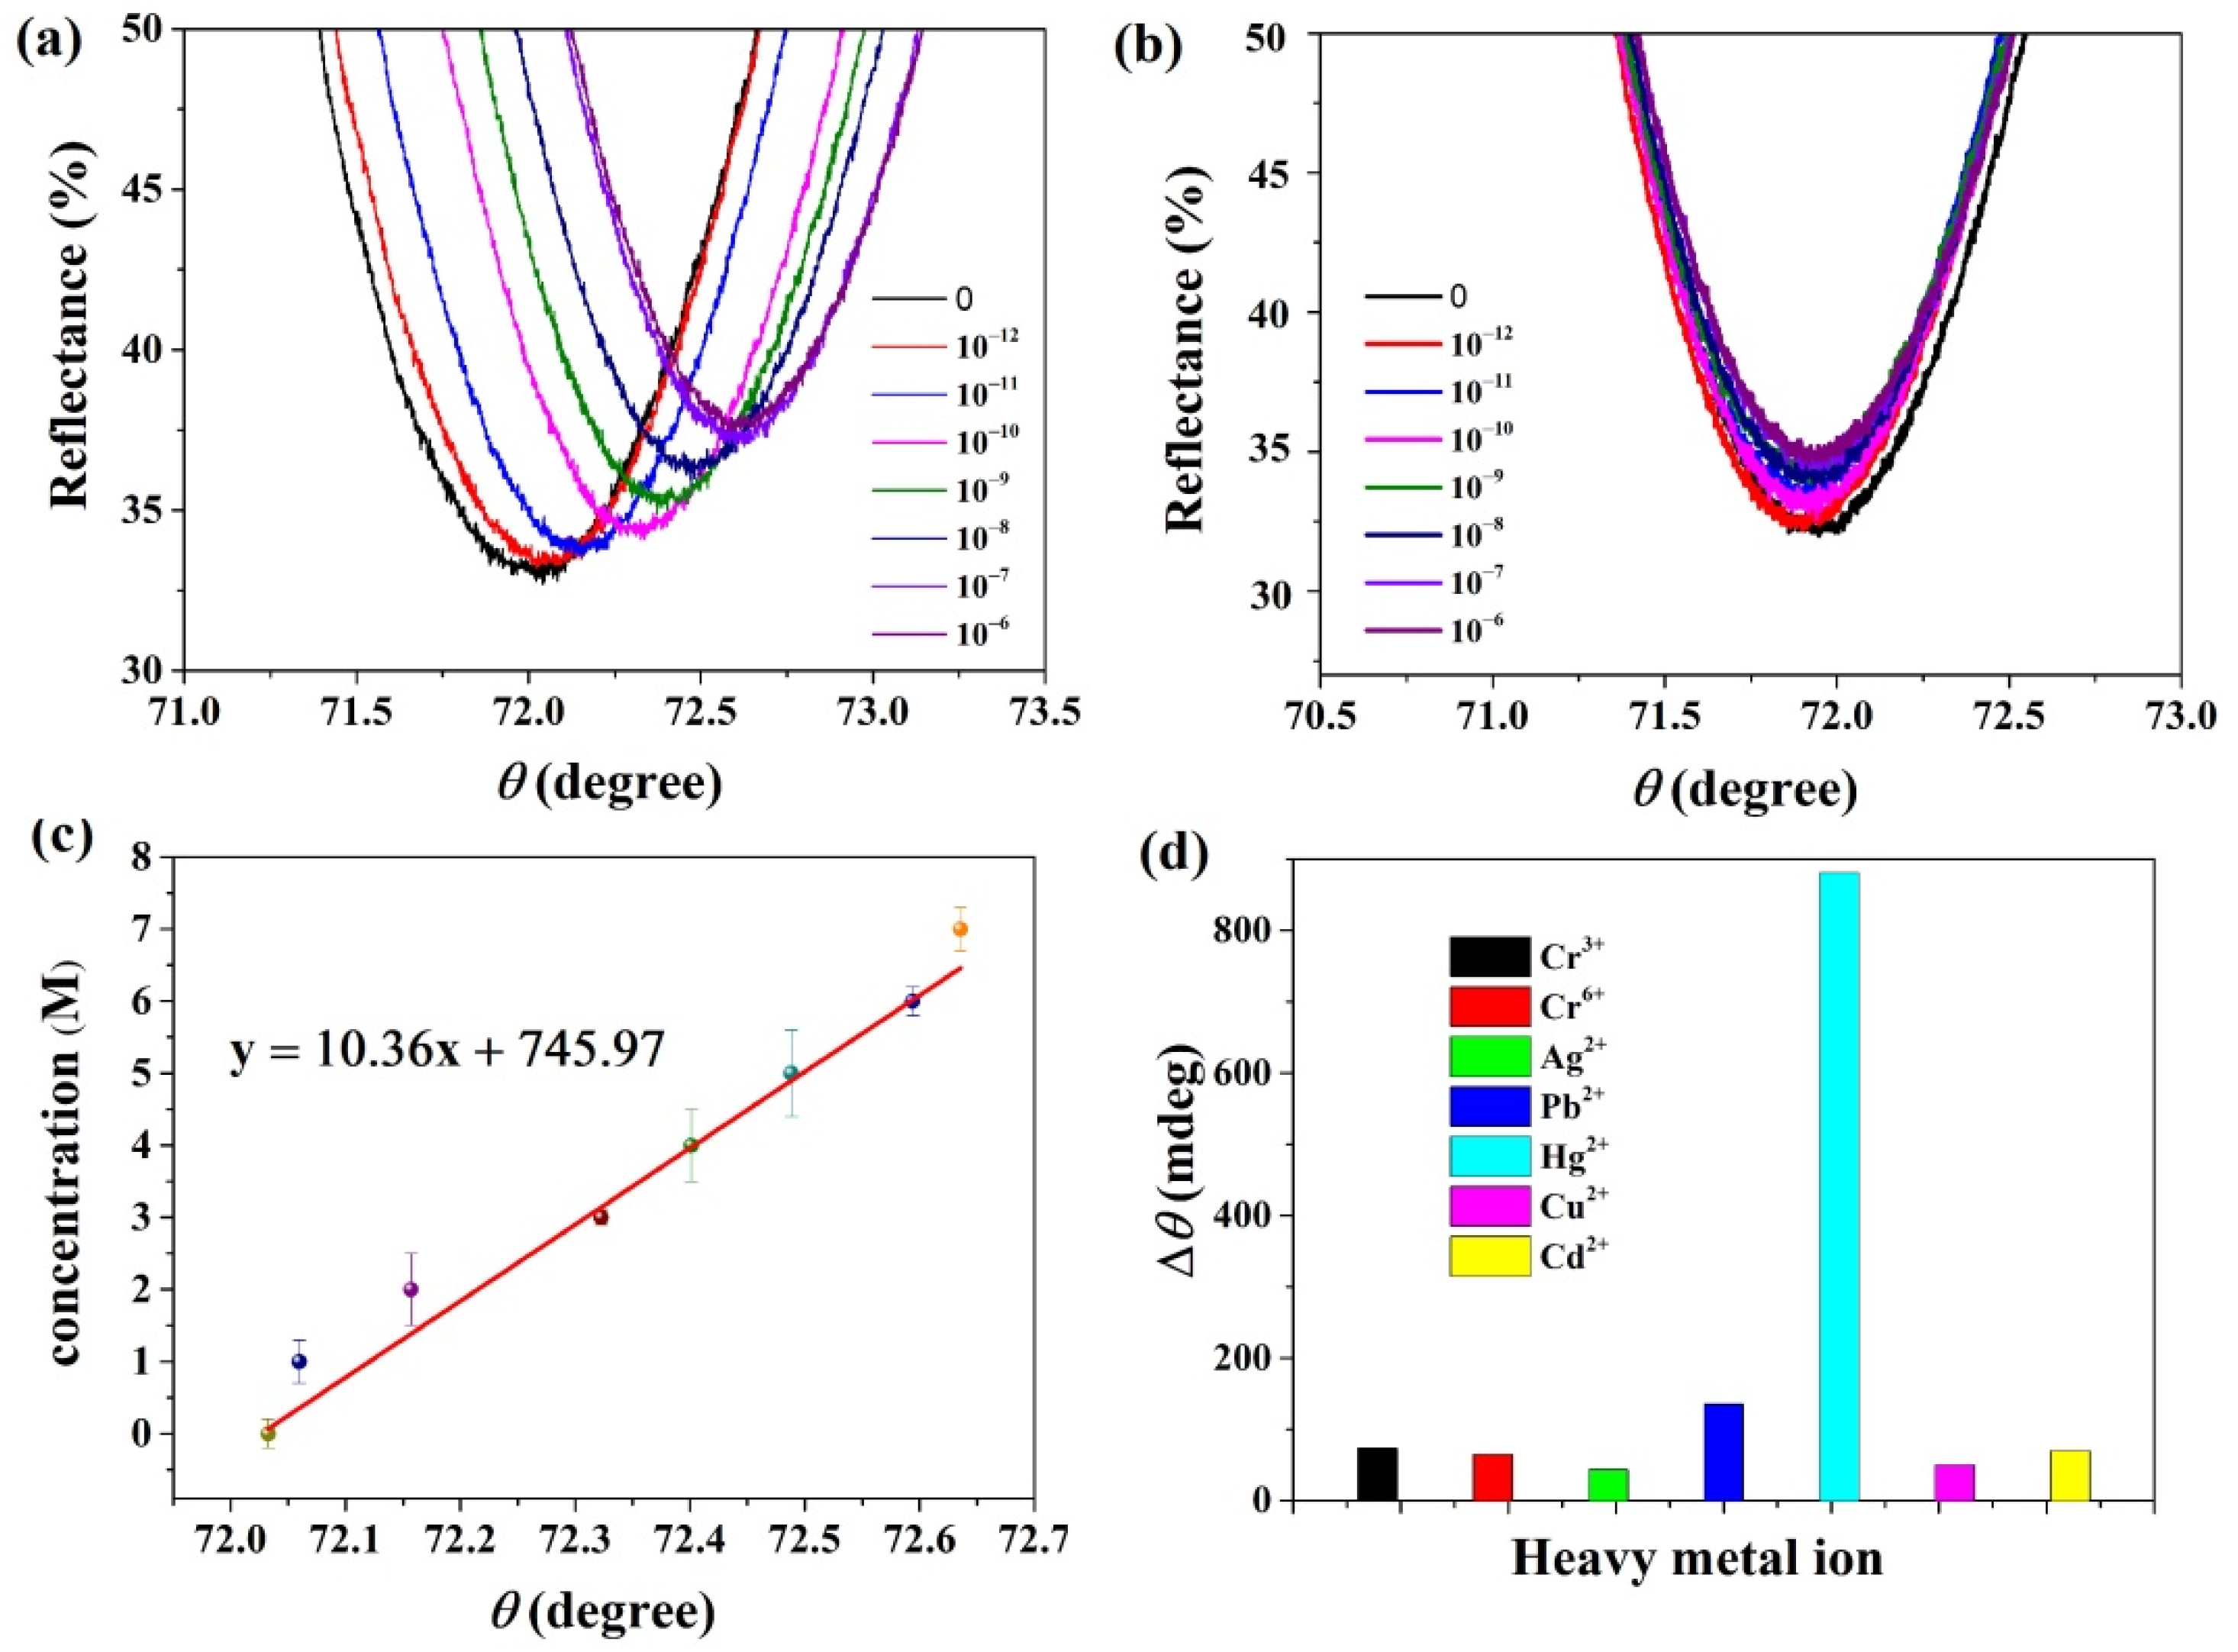
Figure 5.
Elemental mapping characterizations of superstructure TaS2 nanosheets by STEM EDS. (a) STEM image of TaS2 nanosheets, similarly acquired with (b–d) Ta, S, and Ta + S EDS elemental maps.
Figure 5.
Elemental mapping characterizations of superstructure TaS2 nanosheets by STEM EDS. (a) STEM image of TaS2 nanosheets, similarly acquired with (b–d) Ta, S, and Ta + S EDS elemental maps.
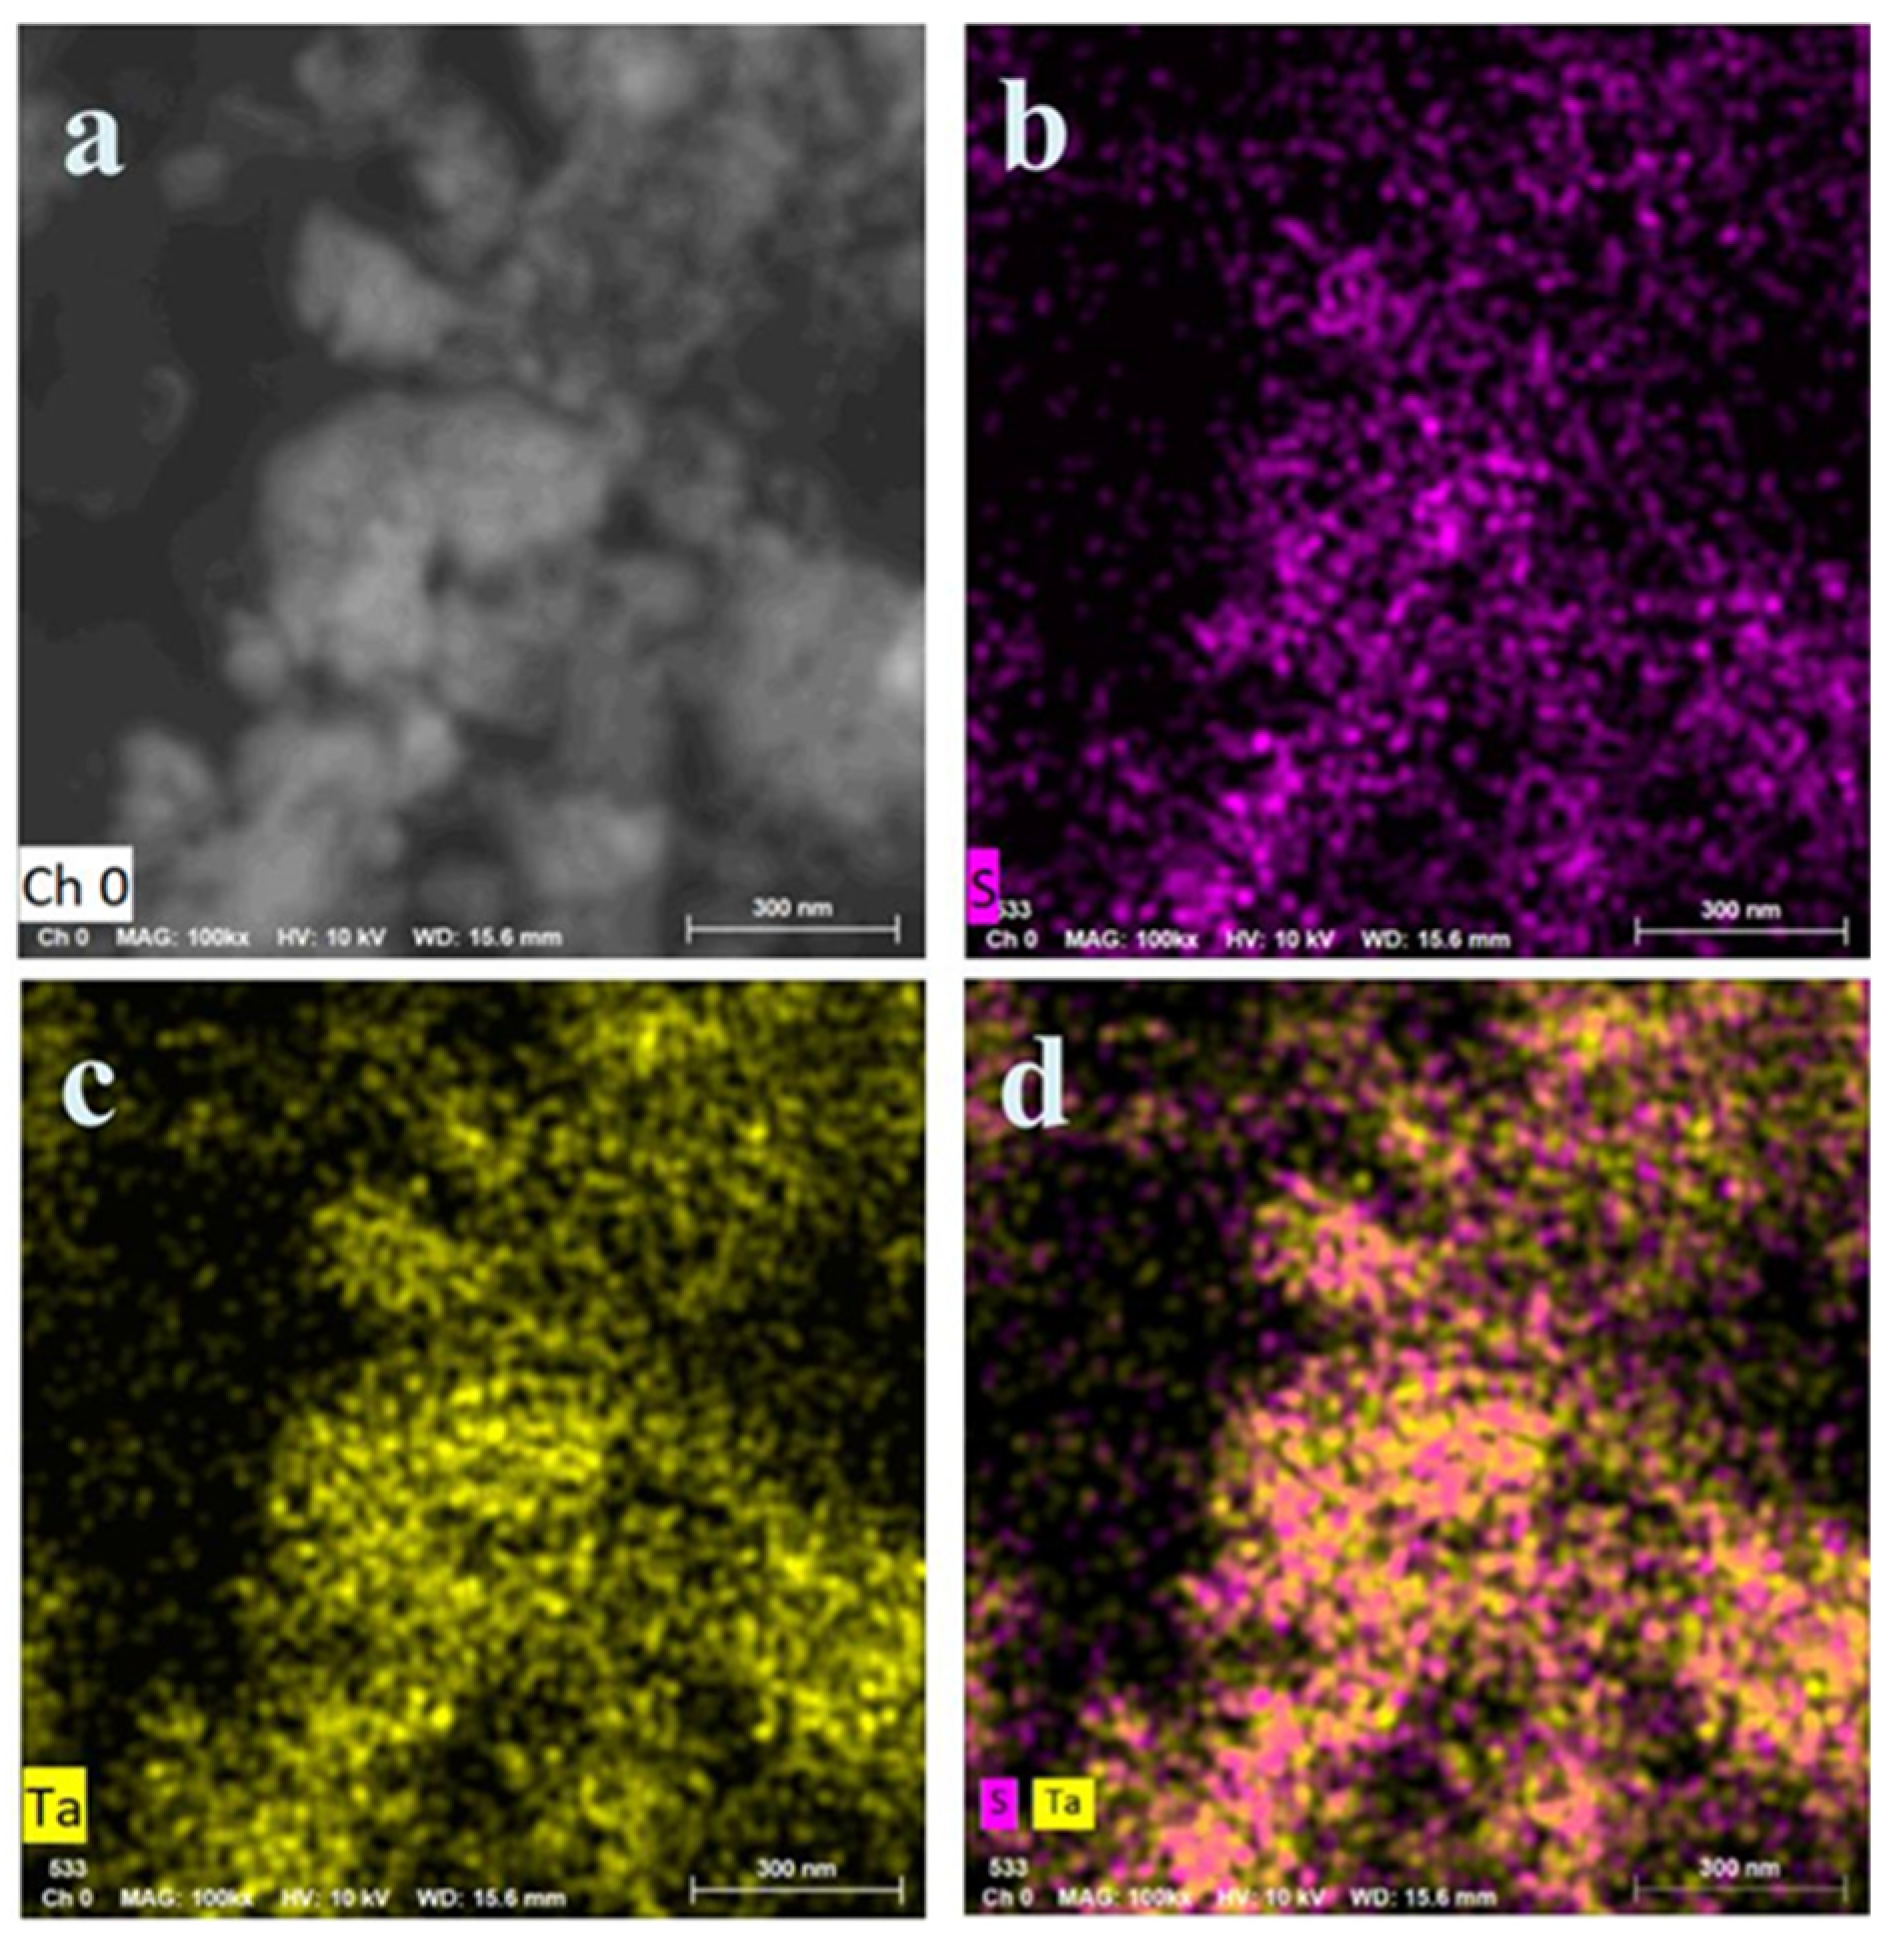
Figure 6.
(a) XPS spectra of bulk TaS2; (b) XPS spectra of TaS2 nanoflakes.

Table 1.
Different 2D material sensing medium layers to improve biosensors.
| 2D Materials | Optimal Sensitivity | Maximum Sensitivity | Detection Limit | Ref. |
|---|---|---|---|---|
| Graphene oxide | 91.1°/RIU | 2715 nm/RIU | 10−11 mol/L | [49,50] |
| MoS2 | 49.2°/RIU | 0.64 μA/ppb | 11.52 × 10⁻³ ppb | [51,52] |
| MoSe2 | 50.4°/RIU | 2524 nm/RIU | 3.5 nM | [53] |
| WS2 | 48.6°/RIU | 2459 nm/RIU | 3.3 nM | [54] |
| TaS2 | 201°/RIU | 10.36°/μM | 1 pM | Our work |
Publisher’s Note: MDPI stays neutral with regard to jurisdictional claims in published maps and institutional affiliations. |
© 2022 by the authors. Licensee MDPI, Basel, Switzerland. This article is an open access article distributed under the terms and conditions of the Creative Commons Attribution (CC BY) license (https://creativecommons.org/licenses/by/4.0/).
Share and Cite
MDPI and ACS Style
Jia, Y.; Liao, Y.; Cai, H. High Quality TaS2 Nanosheet SPR Biosensors Improved Sensitivity and the Experimental Demonstration for the Detection of Hg2+. Nanomaterials 2022, 12, 2075. https://doi.org/10.3390/nano12122075
AMA Style
Jia Y, Liao Y, Cai H. High Quality TaS2 Nanosheet SPR Biosensors Improved Sensitivity and the Experimental Demonstration for the Detection of Hg2+. Nanomaterials. 2022; 12(12):2075. https://doi.org/10.3390/nano12122075
Chicago/Turabian StyleJia, Yue, Yunlong Liao, and Houzhi Cai. 2022. "High Quality TaS2 Nanosheet SPR Biosensors Improved Sensitivity and the Experimental Demonstration for the Detection of Hg2+" Nanomaterials 12, no. 12: 2075. https://doi.org/10.3390/nano12122075
Note that from the first issue of 2016, this journal uses article numbers instead of page numbers. See further details here.