

Improving Minutiae Image of Latent Fingerprint Detection on Non-Porous Surface Materials under UV Light Using Sulfur Doped Carbon Quantum Dots from Magnolia Grandiflora Flower


Abstract
:
1. Introduction
2. Methods and Matrial
2.1. Chemicals and Reagents
2.2. Synthesis
2.2.1. Preparation of Magnolia Grandiflora Powder
2.2.2. Preparation of S-CQDs with Microwave Method
2.2.3. Preparation of S-CQDs Detecting Powder
3. Results and Discussion
3.1. Fourier-Transform Infrared Spectroscopy (FTIR)
3.2. X-ray Diffraction Analysis (XRD)
3.3. Elemental X-ray Photoelectron Spectroscopy (XPS) Analysis
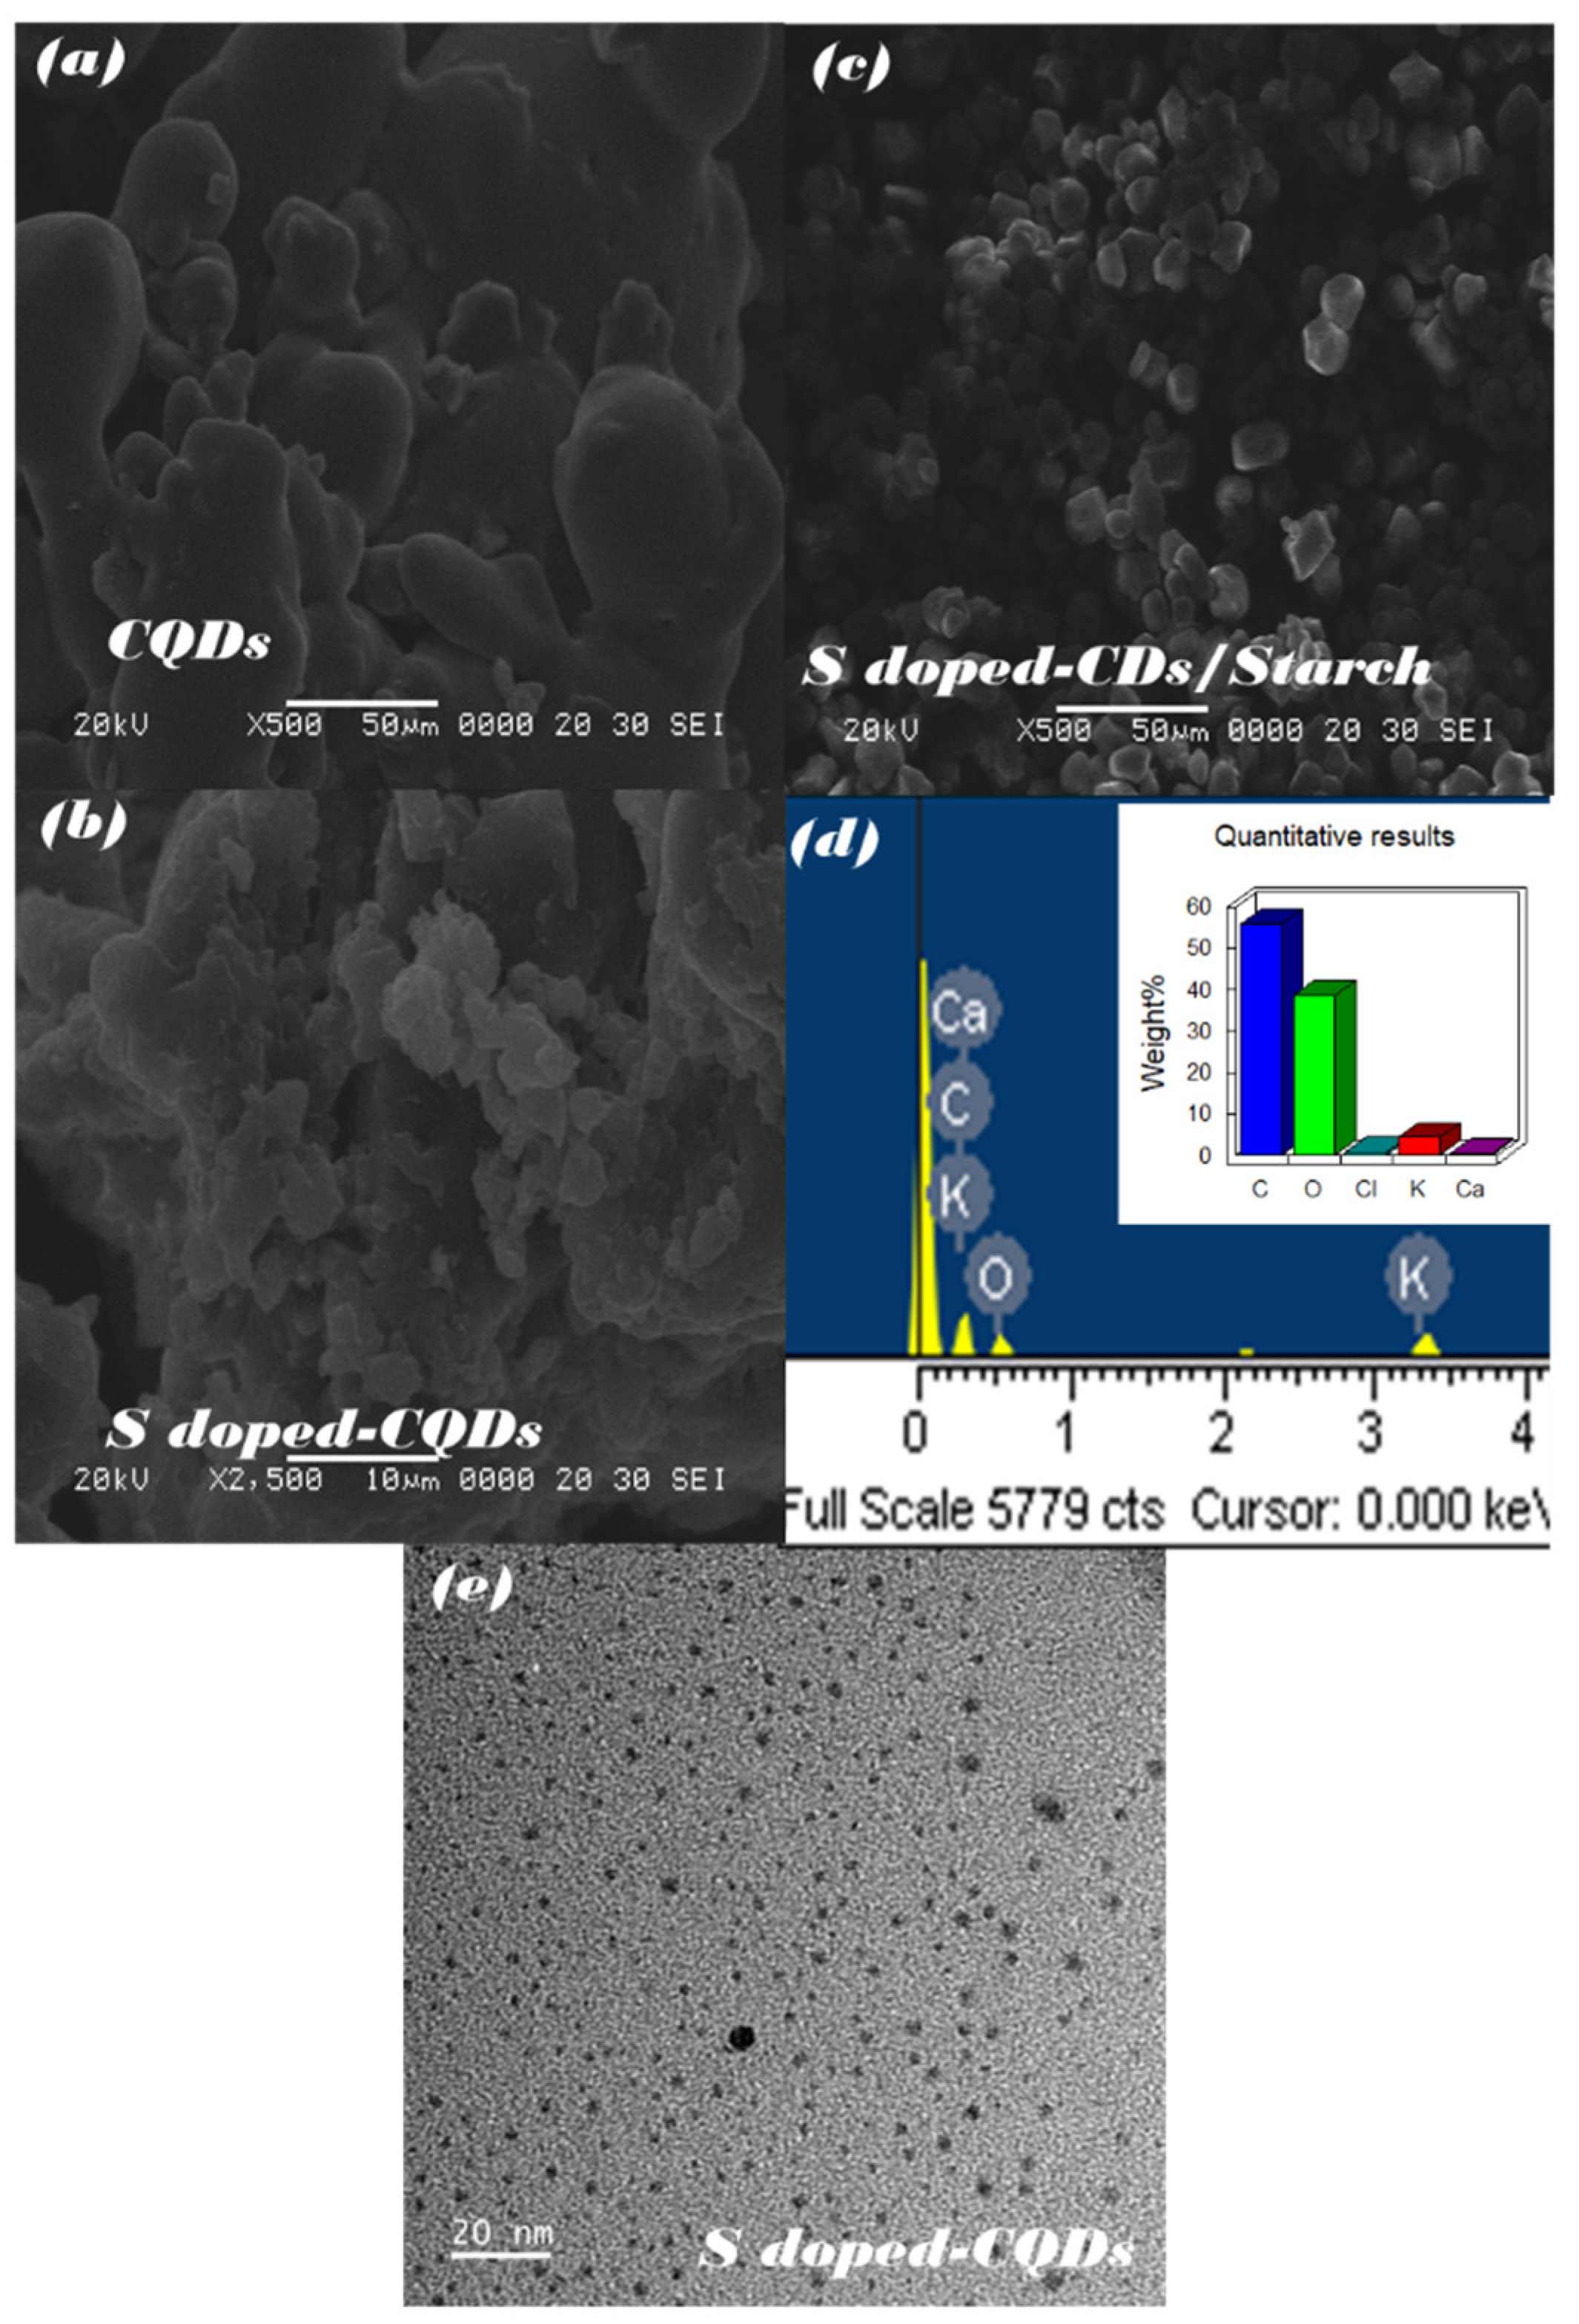
3.4. Morphological and Optical Property Analysis
3.5. Detection of Latent Fingerprints
3.5.1. Comparison of S-CQDs and CQDs for Latent Fingerprint Detection on Non-Porous Material Surface
3.5.2. Effect of Particle Size Powder for Latent Fingerprint Detection
3.5.3. Comparison of S-CQDs and Commercial Powder on Latent Fingerprint Detection on Non-Porous Material Surfaces
3.5.4. Temperature and Storage Time and for Latent Fingerprint Detection
4. Conclusions
Author Contributions
Funding
Institutional Review Board Statement
Informed Consent Statement
Data Availability Statement
Acknowledgments
Conflicts of Interest
Sample Availability
References
- Prabakaran, E.; Pillay, K. Nanomaterials for latent fingerprint detection: A review. J. Mater. Res. Technol. 2021, 12, 1856–1885. [Google Scholar] [CrossRef]
- Wang, M.; Li, M.; Yu, A.; Zhu, Y.; Yang, M.; Mao, C. Fluorescent Nanomaterials for the Development of Latent Fingerprints in Forensic Sciences. Adv. Funct. Mater. 2017, 27, 1606243. [Google Scholar] [CrossRef] [PubMed]
- Abdelwahab, W.; Phillips, E.; Patonay, G. Preparation of fluorescently labeled silica nanoparticles using an amino acid-catalyzed seeds regrowth technique: Application to latent fingerprints detection and hemocompatibility studies. J. Colloid Interface Sci. 2018, 512, 801–811. [Google Scholar] [CrossRef]
- Yuan, C.; Li, M.; Wang, M.; Zhang, X.; Yin, Z.; Song, K.; Zhang, Z. Sensitive development of latent fingerprints using Rhodamine B-diatomaceous earth composites and principle of efficient image nhancement behind their fluorescence characteristics. Chem. Eng. J. 2020, 383, 123076. [Google Scholar] [CrossRef]
- Li, H.; Guo, X.; Liu, J.; Li, F. A synthesis of fluorescent starch based on carbon nanoparticles for fingerprints detection. Opt. Mater. 2016, 60, 404–410. [Google Scholar] [CrossRef]
- Milenkovic, I.; Algarra, M.; Alcoholado, C.; Cifuentes, M.; Lázaro-Martínez, J.M.; Rodríguez-Castellón, E.; Mutavdžić, D.; Radotić, K.; Bandosz, T.J. Fingerprint imaging using N-doped carbon dots. Carbon 2018, 144, 791–797. [Google Scholar] [CrossRef]
- Wang, J.; Ma, Q.; Liu, H.; Wang, Y.; Shen, H.; Hu, X.; Tan, W. Time-Gated Imaging of Latent Fingerprints and Specific Visualization of Protein Secretions via Molecular Recognition. Anal. Chem. 2017, 89, 12764–12770. [Google Scholar] [CrossRef]
- Kumbhakar, P.; Biswas, S.; Pandey, P.; Tiwary, C.; Kumbhakar, P. Tailoring of structural and photoluminescence emissions by Mn and Cu co-doping in 2D nanostructures of ZnS for the visualization of latent fingerprints and generation of white light. Nanoscale 2019, 11, 2017–2026. [Google Scholar] [CrossRef]
- Xu, C.; Zhou, R.; He, W.; Wu, L.; Wu, P.; Hou, X. Fast Imaging of Eccrine Latent Fingerprints with Nontoxic Mn-Doped ZnS QDs. Anal. Chem. 2014, 86, 3279–3283. [Google Scholar] [CrossRef]
- Haque, F.; Westland, A.; Milligan, J.; Kerr, M. A small particle (iron oxide) suspension for detection of latent fingerprints on smooth surfaces. Forensic Sci. Int. 1989, 41, 73–82. [Google Scholar] [CrossRef]
- Bumbrah, G.S. Cyanoacrylate fuming method for detection of latent fingermarks: A review. Egypt. J. Forensic Sci. 2017, 7, 4. [Google Scholar] [CrossRef]
- Jiao, Y.; Gong, X.; Han, H.; Gao, Y.; Lu, W.; Liu, Y.; Xian, M.; Shuang, S.; Dong, C. Facile synthesis of orange fluorescence 1 carbon dots with excitation independent emission for pH sensing and cellular imaging. Anal. Chim. Acta 2018, 1042, 125–132. [Google Scholar] [CrossRef]
- Gao, D.; Gao, F.; Kuang, Q.; Zha, X.; Zhang, Z.; Pan, Y.; Jiao, H. Zinc Germanate Nanophosphors with Persistent Luminescence for Multi-Mode Imaging of Latent Fingerprints. ACS Appl. Nano Mater. 2022, 5, 9929–9939. [Google Scholar] [CrossRef]
- Xu, J.; Zhang, B.; Jia, L.; Fan, Y.; Chen, R.; Zhu, T.; Liu, B. Dual-Mode, Color-Tunable, Lanthanide-Doped Core–Shell Nanoarchitectures for Anti-Counterfeiting Inks and Latent Fingerprint Recognition. ACS Appl. Mater. Interfaces 2019, 11, 38. [Google Scholar] [CrossRef]
- Koutsogiannis, P.; Thomou, E.; Stamatis, H.; Gournis, D.; Rudolf, P. Advances in fluorescent carbon dots for biomedical applications. Adv. Phys.-X. 2020, 5, 1758592. [Google Scholar] [CrossRef]
- Zhang, Q.; Zhao, Q.; Fu, M.; Fan, X.; Lu, H.; Wang, H.; Zhang, Y.; Wang, H. Carbon quantum dots encapsulated in super small platinum nanocrystals core-shell architecture/nitrogen doped graphene hybrid nanocomposite for electrochemical biosensing of DNA damagebiomarker-8’-hydroxy-2’-deoxyguanosine. Anal. Chim. Acta 2018, 1047, 9–20. [Google Scholar] [CrossRef]
- Macairan, J.-R.; Jaunky, D.B.; Naccache, R.; Piekny, A. Intracellular ratiometric temperature sensing using fluorescent carbon dots. Nanoscale Adv. 2019, 1, 105–113. [Google Scholar] [CrossRef]
- Feng, T.; Ai, X.; Ong, H.; Zhao, Y. Dual-Responsive Carbon Dots for Tumor Extracellular Microenvironment Triggered Targeting and Enhanced Anticancer Drug Delivery. ACS Appl. Mater. Interfaces 2016, 8, 18732–18740. [Google Scholar] [CrossRef]
- Cadd, S.; Islam, M.; Manson, P.; Bleay, S. Fingerprint composition and aging: A literature review. Sci. Justice 2015, 55, 219–238. [Google Scholar] [CrossRef]
- Benes, H.; Cerna, R.; Durackova, A. Utilization of Natural Oils for Decomposition of Polyurethanes. J. Polym. Environ. 2016, 20, 175–185. [Google Scholar] [CrossRef]
- Boukir, A.; Fellak, S.; Doumenq, P. Structural characterization of Argania spinosa Moroccan wooden artifacts during natural degradation progress using infrared spectroscopy (ATR-FTIR) and X-Ray diffraction (XRD). Heliyon 2019, 5, e02477. [Google Scholar] [CrossRef] [PubMed]
- Djunaidi, M. Gold imprinted adsorption based on eugenol. J. Phys. Conf. Ser. 2020, 1524, 012077. [Google Scholar] [CrossRef]
- Gopinath, V.; Priyadarshini, S.; Al-Maleki, A.R.; Alagiri, M.; Yahya, R.; Saravanan, S.; Vadivelu, J. In vitro toxicity, apoptosis and antimicrobial effects of phyto-mediated copper oxide nanoparticles. RSC Adv. 2016, 6, 110986. [Google Scholar] [CrossRef]
- Li, Y.; Kong, D.; Wu, H. Comprehensive chemical analysis of the flower buds of five Lonicera species by ATR-FTIR, HPLC-DAD, and chemometric methods. Rev. Bras. Farm. 2018, 28, 533–541. [Google Scholar] [CrossRef]
- Razali, N.; Conte, M.; McGregor, J. The role of impurities in the La2O3 catalysed carboxylation of crude glycerol. Catal. Lett. 2019, 149, 1403–1414. [Google Scholar] [CrossRef]
- Rehman, A.; Eze, V.; Resul, M.; Harvey, A. A kinetic study of Zn halide/TBAB-catalysed fixation of CO2 with styrene oxide in propylene carbonate. Green Process. Synth. 2019, 8, 719–729. [Google Scholar] [CrossRef]
- Rozali, M.; Ahmad, Z.; Isa, M. Interaction Between Carboxy Methylcellulose And Salicylic Acid Solid Biopolymer Electrolytes. Adv. Mater. Res. 2015, 1107, 223–229. [Google Scholar] [CrossRef]
- Sim, L.; Gan, S.; Chan, C.; Yahya, R. ATR-FTIR studies on ion interaction of lithium perchlorate in polyacrylate/poly(ethylene oxide) blends. SAA 2010, 76, 287–292. [Google Scholar] [CrossRef] [PubMed]
- Brozek-Pluska, B.; Musial, J.; Kordek, R.; Abramczyk, H. Analysis of Human Colon by Raman Spectroscopy and Imaging-Elucidation of Biochemical Changes in Carcinogenesis. Int. J. Mol. Sci. 2019, 20, 3398. [Google Scholar] [CrossRef]
- Ilin, A.; Velasco, F.; Navarro, R.; Tornos, F. New data on Alpine type fluorite deposits: Case of Lújar mine in Betic Cordillera (SE Spain). Macla 2019, 24, 63–64. [Google Scholar]
- Travlou, N.; Secor, J.; Bandosz, T. Highly luminescent S-doped carbon dots for the selective detection of ammonia. Carbon 2019, 114, 544–556. [Google Scholar] [CrossRef]
- Varga, G.; Kozma, V.; Kolcsár, V.; Kukovecz, Á.; Kónya, Z.; Sipos, P.; Szὅllὅsi, G. β-Isocupreidinate–CaAl-layered double hydroxide composites—heterogenized catalysts for asymmetric Michael addition. Mol. Catal. 2020, 482, 110675. [Google Scholar] [CrossRef]
- Wang, Y.; Zhou, Q.; Li, B.; Liu, B.; Wu, G.; Ibrahim, M.; Sun, G. Differentiation in MALDI-TOF MS and FTIR spectra between two closely related species Acidovorax oryzae and Acidovorax citrulli. BMC Microbiol. 2012, 12, 182. [Google Scholar] [CrossRef] [PubMed]
- Gupta, B.; Kumar, N.; Panda, K.; Kanan, V.; Joshi, S.; Fisher, I. Role of oxygen functional groups in reduced graphene oxide for lubrication. Sci. Rep. 2017, 7, 45030. [Google Scholar] [CrossRef]
- Qie, L.; Chen, W.; Xiong, X.; Hu, C.; Zou, F.; Hu, P.; Huang, Y. Sulfur-Doped Carbon with Enlarged Interlayer Distance as a High-Performance Anode Material for Sodium-Ion Batteries. Adv. Sci. 2015, 2, 1500195. [Google Scholar] [CrossRef]
- Qiu, B.; Cai, L.; Zhang, N.; Tao, X.; Chai, Y. A Ternary Dumbbell Structure with Spatially Separated Catalytic Sites for Photocatalytic Overall Water Splitting. Adv. Sci. 2020, 7, 1903568. [Google Scholar] [CrossRef] [PubMed]
- Shanthi, P.; Hanumantha, P.; Ramalinga, K.; Gattu, B.; Datta, M.; Kumta, P. Sulfonic Acid Based Complex Framework Materials (CFM): Nanostructured Polysulfide Immobilization Systems for Rechargeable Lithium–Sulfur Battery. J. Electrochem. Soc. 2019, 166, A1827–A1835. [Google Scholar] [CrossRef]
- Urana, S.; Alhani, A.; Silva, C. Study of ultraviolet-visible light absorbance of exfoliated graphite forms. AIP Adv. 2017, 7, 035323. [Google Scholar] [CrossRef]
- Li, S.; Li, Y.; Cao, J.; Zhu, J.; Fan, L.; Li, X. Sulfur-Doped Graphene Quantum Dots as a Novel Fluorescent Probe for Highly Selective and Sensitive Detection of Fe3+. Anal. Chem. 2014, 86, 10201–10207. [Google Scholar] [CrossRef]
- Nugroho, D.; Keawprom, C.; Chanthai, S.; Oh, W.-C.; Benchawattananon, R. Highly Sensitive Fingerprint Detection under UV Light on Non-Porous Surface Using Starch-Powder Based Luminol-Doped Carbon Dots (N-CDs) from Tender Coconut Water as a Green Carbon Source. Nanomaterials 2022, 12, 400. [Google Scholar] [CrossRef]


| Material Type | CQDs/Starch (Normal Lamp) | CQDs/Starch (UV Lamp) | S-CQDs/Starch (Normal Lamp) | S-CQDs/Starch (UV Lamp) |
|---|---|---|---|---|
| Knife surface |  |  | 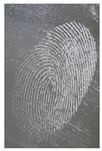 | 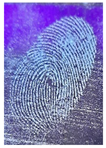 |
| Glass surface |  | 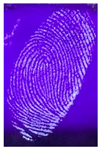 | 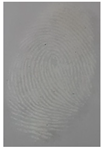 | 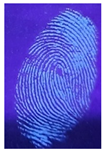 |
| Aluminum surface | 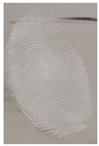 | 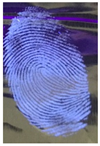 |  |  |
| Particle Size (μm) | S-CQDs/Corn Starch (Normal Lamp) | S-CQDs/Corn Starch (UV Lamp) | Total Minutiae of Latent Fingerprint Can Be Detect |
|---|---|---|---|
| 38 |  | 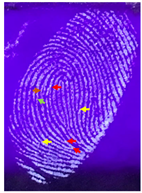 | Bifurcation: 3 Minutiae Termination: 2 Minutiae Island: 1 Minutiae Orange: 1 Minutiae Total: 7 Minutiae |
| 53 | 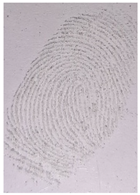 | 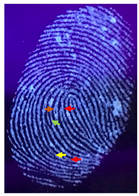 | Bifurcation: 2 Minutiae Termination: 1 Minutiae Island: 1 Minutiae Orange: 1 Minutiae Total: 5 Minutiae |
| 73 | 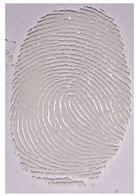 | 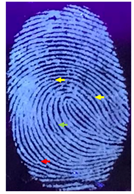 | Bifurcation: 1 Minutiae Termination: 2 Minutiae Island: 1 Minutiae Total: 4 Minutiae |
| Material Type | Commercial Powder (Normal Lamp) | Commercial Powder (UV Lamp) | S-CQDs/Starch (Normal Lamp) | S-CQDs/Starch (UV Lamp) |
|---|---|---|---|---|
| Glass |  | 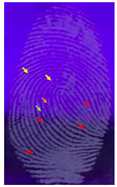 |  |  |
| XT | −10 °C | Room Temp. (25–27 °C) | 60 °C |
|---|---|---|---|
| 24 | MD | MD | MD |
| 48 | LFD | MD | MD |
| 72 | LFD | MD | MD |
| 96 | LFD | MD | LFD |
| 120 | LFD | MD | LFD |
Publisher’s Note: MDPI stays neutral with regard to jurisdictional claims in published maps and institutional affiliations. |
© 2022 by the authors. Licensee MDPI, Basel, Switzerland. This article is an open access article distributed under the terms and conditions of the Creative Commons Attribution (CC BY) license (https://creativecommons.org/licenses/by/4.0/).
Share and Cite
Nugroho, D.; Oh, W.-C.; Chanthai, S.; Benchawattananon, R. Improving Minutiae Image of Latent Fingerprint Detection on Non-Porous Surface Materials under UV Light Using Sulfur Doped Carbon Quantum Dots from Magnolia Grandiflora Flower. Nanomaterials 2022, 12, 3277. https://doi.org/10.3390/nano12193277
Nugroho D, Oh W-C, Chanthai S, Benchawattananon R. Improving Minutiae Image of Latent Fingerprint Detection on Non-Porous Surface Materials under UV Light Using Sulfur Doped Carbon Quantum Dots from Magnolia Grandiflora Flower. Nanomaterials. 2022; 12(19):3277. https://doi.org/10.3390/nano12193277
Chicago/Turabian StyleNugroho, David, Won-Chun Oh, Saksit Chanthai, and Rachadaporn Benchawattananon. 2022. "Improving Minutiae Image of Latent Fingerprint Detection on Non-Porous Surface Materials under UV Light Using Sulfur Doped Carbon Quantum Dots from Magnolia Grandiflora Flower" Nanomaterials 12, no. 19: 3277. https://doi.org/10.3390/nano12193277