Abstract
In the semiconductor industry, fluorocarbon (FC) plasma is widely used in SiO2 etching, with Ar typically employed in the dilution of the FC plasma due to its cost effectiveness and accessibility. While it has been reported that plasmas with other noble gases, namely Kr and Xe, have distinct physical properties such as electron density and temperature, their implementation into plasma etching has not been sufficiently studied. In this work, we conducted SiO2 etching with FC plasmas diluted with different noble gases, i.e., FC precursors of C4F8 and CH2F2 with Ar, Kr, or Xe, under various gas flow rates of each as well as plasma diagnostics for the process interpretation. We show that Ar, Kr, and Xe gas mixtures depend on the FC precursor flow rate and the pattern width in a significantly different manner and we elucidate these findings based on plasma diagnostic results. The results of this work are expected to offer a practical etching database for diverse applications including plasma process engineering and the development of plasma simulation in the semiconductor industry.
1. Introduction
Plasma is of increasing importance in semiconductor manufacturing that proceeds through multiple and repetitive processes such as lithography, deposition, and etching [1]. In particular, as the feature size of transistors continues to shrink to meet market demands for higher device performance, the etch process should achieve critical dimensions on the sub-ten nanometer scale for next-generation semiconductors, leading plasmas to play a bigger role in the industry [2].
The etching of SiO2, which is one of the most widely used materials in semiconductor devices, has been intensely studied for decades in terms of etch rate, selectivity, etc. In plasma SiO2 etching, halogen-containing precursors are employed to generate volatile etch products such as silicon halide. Gas mixtures with Br and Cl have been studied for SiO2 etching to overcome the disadvantage of isotropic etching from the use of F-containing precursors such as SF6 [3]. Perfluorocarbon (PFC) gases such as CF4 and C4F8 are widely used owing to their characteristic behaviors that improve the etch selectivity of SiO2 over other materials including Si and Si3N4, as well as their achievement of etch anisotropy by forming fluorocarbon (FC) films on the surface of SiO2 trench sidewalls [4]. Although there have been numerous reports on the development of alternative precursors to the conventional PFC gases due to their high global warming potential [5,6,7,8], the conventional PFC gases such as C4F8 still remain indispensable in plasma SiO2 etching for denser patterning.
The addition of H2 or O2 gas in PFC plasmas has been widely employed to control the etching characteristics; while H atoms generated through the dissociation of H2 in plasma act as a scavenger for F atoms, thereby lowering etch rates and increasing SiO2-to-Si selectivity, O atoms from O2 dissociation consume C atoms on the material surfaces, reducing the formation of FC films [9]. Following the same mechanism as H2/O2 addition, hydrofluorocarbon gases (HFC, CHxF4−x with x = 1, 2, or 3) with H atoms in their molecular structures instead of F atoms are frequently adopted, and numerous studies on the mixture of PFC and HFC precursors have been reported over the years [10,11,12,13,14,15,16,17,18].
Fluorocarbon precursors, referring to one or both of the PFC and HFC precursors in this paper, are typically diluted with noble gases when used in SiO2 etching to control the extent of the polymeric properties of the plasma. While Ar is the most widely used for FC precursor dilution due to its low cost and accessibility, other noble gases have been examined as diluting gases following reports that plasmas of various noble gases have significantly different characteristics as compared with Ar plasmas, which mainly originate from differences in mass and ionization energy [10,19,20]. The employment of diverse noble gas species in FC precursor dilution can, thus, be another process condition control knob to adjust the physical and chemical properties of the plasma via variation of plasma parameters including electron density and temperature. In particular, among the various noble gas species, Kr and Xe are attracting more research interest since their use in etching SiO2 with FC plasmas has been relatively less reported as compared with the numerous studies on their physical and chemical properties [19,20,21]. Therefore, there is a need to develop a plasma etch database with respect to various gas mixtures of different noble gases including Kr and Xe.
In this work, we present experimental results of plasma SiO2 etching with various gas mixtures of C4F8, CH2F2, and O2 diluted with Ar, Kr, and Xe to provide a SiO2 etching database, which has been relatively little studied. Changes in the plasma parameters from process condition variations are identified via various plasma diagnostic methods to interpret the resulting etch profiles. The scanning electron microscope (SEM) results show significant changes in the etch profiles according to the process condition variations with respect to the noble gases.
2. Experiments
2.1. Description of the Processing Chamber
Figure 1 illustrates a schematic of the plasma etching chamber. For etching, coupon wafers with a diameter of 300 mm are loaded on the electrode and 13.56 MHz radiofrequency (RF) power of 500 W is applied. A turbomolecular pump evacuates the chamber, resulting in a base pressure of approximately 10−5 Torr before etching, and a throttle valve maintains the processing pressure at 28 mTorr with gases injected by mass flow controllers through a showerhead that faces the electrode and acts as the grounded electrode (not shown in Figure 1). Further details are described in our previous reports [21,22,23]. The reference gas mixture examined in this work consists of C4F8, CH2F2, O2, and Ar with flow rates of 6, 6, 3, and 60 sccm, respectively. An increase in the gas flow rate of either the noble gas (Ar, Kr, or Xe) or the FC precursors is adopted in this work for process condition variation. As also shown in Figure 1, the plasma diagnostic tools, namely a floating harmonic probe and quadrupole mass spectrometer (QMS) (PSM, Hidden Analytical, Warrington, UK), are mounted after plasma processing.
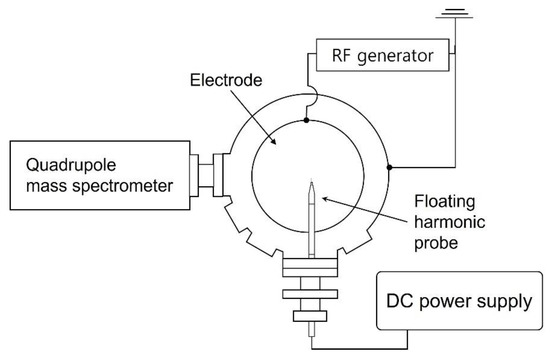
Figure 1.
Top schematic view of the plasma etching chamber and plasma diagnostic tools.
2.2. Sample Preparation
The coupon wafers are prepared for etching by dicing patterned wafers with a diameter of 300 mm into 1 × 2 cm2 pieces. An amorphous carbon layer (ACL) of 1500 nm deposited on SiO2 acts as an etch mask, having line patterns with different widths of 185, 196, 221, and 240 nm. Figure 2 shows a cross-sectional view of a coupon wafer with a pattern width of 220 nm, obtained using a SEM. While most SEM images of the etch results shown in this article are the 220 nm width, we briefly address the effect of the pattern width on the etch profile in Section 3.
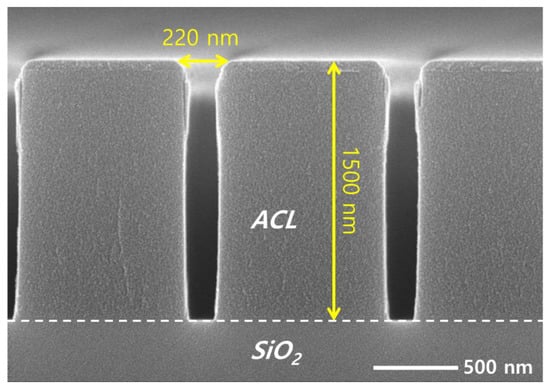
Figure 2.
SEM image of the mask pattern on the target silicon dioxide before etching.
2.3. Plasma Diagnostic Methods
2.3.1. Electron Density Measurement
We employ a floating harmonic probe for the electron density measurements, which has been reported to be suitable for processing plasma diagnostics where the deposition of polymer films deteriorates the performance of other plasma diagnostic tools such as the Langmuir probe [24]. The working principle of the floating harmonic probe is briefly described below.
Plasma current collected in the biased metallic tip of the probe can be expressed as modified Bessel functions that represent the harmonic components of the current originating from the oscillation of the plasma potential [25]. Blocking the direct current (DC) component of the current, i.e., , the plasma current has the form , where is the ion saturation current, is the DC bias voltage, is the electron temperature, is the voltage frequency applied to the probe, and is the n-th harmonic components of the current [24]. Thus, the ion density can be calculated using the following equation:
where is the ion density, is the Bohm velocity, and A is the probe area. The first harmonic current measurement provides the ion density with Equation (1).
2.3.2. Radical and Ion Density Measurement
FC radical densities such as CF2 and CF3 are measured with a QMS (PSM, Hiden Analytical, Warrington, UK), one of the most widely used plasma diagnostic tools. Gas-phase neutral species should be ionized before entering the mass filter, which is a quadrupole with two pairs of electrodes biased with opposite RF and DC voltages. The applied RF and DC voltages determine which mass will pass the quadrupole filter [26]. Details of the working principle can be found in numerous reports [22,27,28,29]. The QMS chamber is separated from the main chamber via an orifice with a diameter of 150 µm, and the QMS chamber pressure in the present work is maintained under 10−6 Torr during the measurements with a differential pumping unit. While the filament in the QMS ionizer emits thermionic electrons for the ionization of radicals, it is not necessary for the plasma ion measurements. Instead, an energy filter, normally termed a Bessel box, is used to obtain the ion energy distribution for specific ions with a target mass. Note that the measured radical and ion signals are quantified by normalizing them to the gas density calculated by the ideal gas law and the electron density obtained by the floating harmonic probe, respectively [22].
3. Results and Discussion
3.1. Effects of Noble Gas Species
Figure 3 shows the results of SiO2 etching with the addition of different noble gas species at different flow rates. The left, middle, and right columns represent noble gas flow rates of 60, 65, 70 sccm, respectively, while the top, middle, and bottom rows represent the addition of Ar, Kr, and Xe, respectively. Leaving the asymmetric SiO2 etch profiles observed with Ar and Xe addition aside, it is worth noting that the remaining ACL mask profiles are found to depend on the noble gas species. The use of Xe instead of Ar or Kr leads to a wider mask pattern width, which means less selective etching.
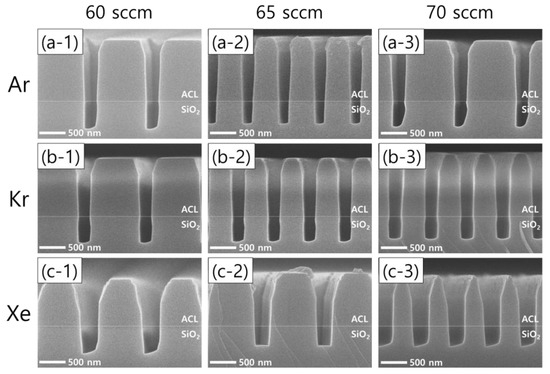
Figure 3.
SEM images of the etch profile evolution with different noble gas species of (a) Ar, (b) Kr, and (c) Xe at varying flow rates of 60 sccm (left column), 65 sccm (middle column), and 70 sccm (right column). The flow rates of the FC precursors and O2 are 6 sccm and 3 sccm, respectively.
The difference in the mask etch profiles according to the noble gas variation can be explained by using the plasma diagnostic results. Figure 4 plots the changes in the electron density by noble gas species and flow rate variation. While the electron density barely changes with an increase in the noble gas flow rate, the different noble gases themselves show significant differences: electron density is highest for Xe, then Kr, and then Ar. This trend stems from the different ionization threshold energies among the noble gases [19,20,30]. Since a higher electron density reflects that more positive ions bombard the substrate, it is considered that the mask experiences the most intense ion bombardment when Xe is added to the gas mixture. Moreover, assuming all ions obtain the same kinetic energy while being accelerated in the sheath, Xe ions having the highest mass among the tested noble gases would provide the highest momentum transfer to the mask.
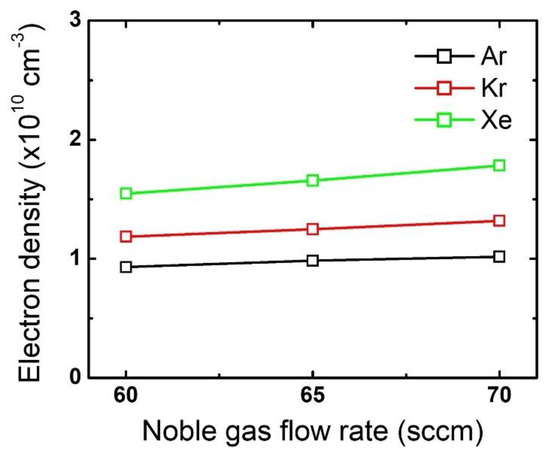
Figure 4.
Electron density obtained from different noble gas species by flow rate. The flow rates of the FC precursors and O2 are 6 sccm and 3 sccm, respectively.
In addition to the electron density, radical and ion densities with different noble gases at different flow rates were measured, as shown in Figure 5. Among the various chemical species in Figure 5a,b, the O radicals are expected to have the greatest impact on the ACL mask etching [31], yet no notable difference is found in the measured O radical density with different noble gases at different flow rates. Thus, we consider that the widest mask pattern width observed in the etch results with the Xe addition might be attributed to the more intense ion bombardment from Xe than from Ar or Kr, which enhances the chemical reactions between O radicals and the mask. The discussion about the effects of noble gas species is summarized in Table 1.
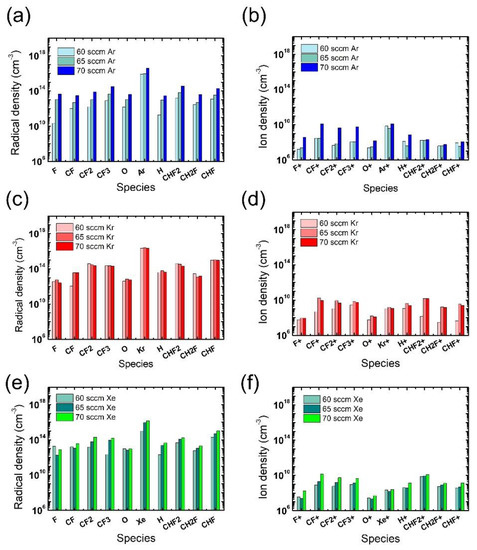
Figure 5.
Radical (left) and ion (right) densities obtained from (a,b) Ar-mixture plasma, (c,d) Kr-mixture plasma, and (e,f) Xe-mixture plasma, at various noble gas flow rates. The flow rates of the FC precursors and O2 are 6 sccm and 3 sccm, respectively.

Table 1.
Summary on the discussion about the effects of noble gas species.
3.2. Effects of FC Precursor Flow Rate
An increase in the flow rate of the FC precursors (both C4F8 and CH2F2) exhibits interesting etch profile evolutions. Figure 6 shows the etch results from an increased FC precursor flow rate from 6 sccm (left column) to 8.5 sccm (right column) with Ar, Kr, and Xe of 60 sccm (top, middle, and bottom rows, respectively). It can readily be seen that increasing the FC flow rate results in significantly different etch profiles among the cases of different noble gases.
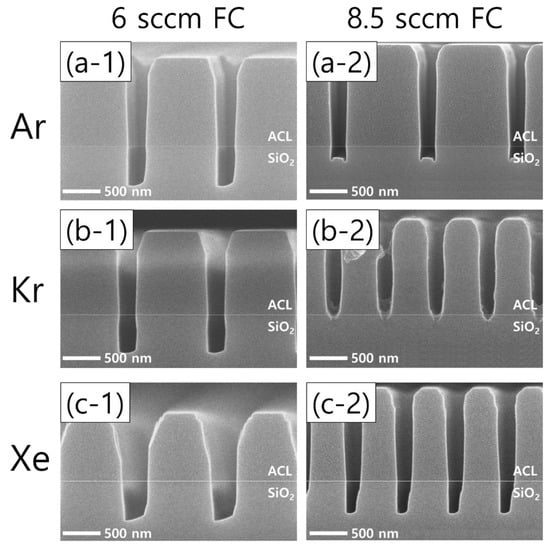
Figure 6.
SEM images of the etch profiles with different noble gas species of (a) Ar, (b) Kr, and (c) Xe, at a fixed flow rate of 60 sccm. The flow rate of the FC precursors is 6 sccm (left column) and 8.5 sccm (right column), while the O2 flow rate is 3 sccm.
Looking at the Ar results, microtrenching is found as the FC flow rate increases, which is considered to derive from more ions colliding with the trench sidewalls that have shrunk by increased FC film deposition, allowing the etch rate at the corners of the trench bottoms to increase [32]. The effects of the FC flow rate increase are more pronounced in the cases of Kr and Xe than Ar. With Kr, the FC flow rate increase immediately results in etch stops of the trench bottoms. In a similar but less effective way, the etch profile evolution with Xe shows narrower pattern widths and SiO2 etch profiles. Comparing the changes in the Kr and Xe cases with those of the Ar case, it is found that Kr and Xe plasmas are more sensitive to changes in the flow rate of the FC precursor gas mixtures. The etch profile evolutions shown in Figure 6 will be briefly discussed with the plasma diagnostics results.
Moreover, significant differences in the etch profiles among noble gas species are observed as the pattern width shrinks with the FC flow rate of 8.5 sccm, as shown in Figure 7. Taking the Ar cases first, Figure 7(a-1–a-4) show that microtrenching disappears with narrowing pattern widths. In other words, an increase in the pattern width has the same effect as an increase in the FC precursor flow rate, which reflects that the wider pattern widths are, the higher the FC radical fluxes are in the trenches. Meanwhile, the etch stop with Kr, shown in Figure 6(b-2), is also found with different pattern widths, as shown in Figure 7b. As for Xe, one interesting profile evolution behavior is observed. With decreasing pattern widths from 245 nm to 185 nm, the trench bottoms become narrower, leaving seam-like holes near the center of the trench bottoms. This feature has not been reported to the best of our knowledge. The seam-like etch profile is not clearly understood here, requiring more rigorous investigations in the future.
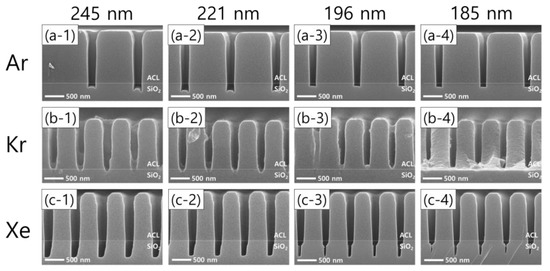
Figure 7.
SEM images of the etch profile evolution with different noble gas mixtures of (a-1–a-4) Ar, (b-1–b-4) Kr, and (c-1–c-4) Xe, by pattern width.
Changes in electron density with an increase in the FC flow rate are plotted in Figure 8. Note that the electron density at the 6 sccm FC flow rate is the same as the one shown in Figure 4. As the FC flow rate increases from 6 sccm to 8.5 sccm, the electron density slightly decreases for all the cases with different noble gas mixtures. These changes in electron density with FC flow rate increase explain the evolution of the etch profiles in Figure 6, which was not observed with the noble gas flow rate variations.
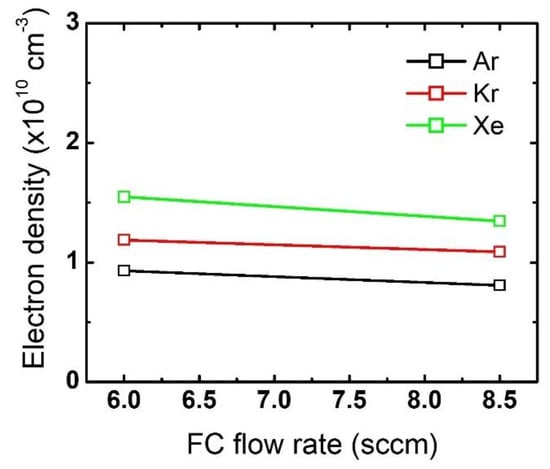
Figure 8.
Electron density obtained from different FC gas flow rates. The flow rates of the noble gases and O2 are 60 sccm and 3 sccm, respectively.
The radical and ion densities of the gas mixtures with an FC flow rate of 8.5 sccm were measured and compared to those for the 6 sccm FC flow rate in Figure 9. It is seen in Figure 9a,b that the FC flow rate increase with the Ar mixture leads to overall increases in both radical and ion density, driving an evolution of the microtrenching profiles shown in Figure 6(a-2). For the Kr mixture, changes in the ion density with FC flow rate increase are more notable than those in the radical density. With barely changing radical densities, the density of PFC ions significantly decreases while that of HFC ions increases, as shown in Figure 9c,d, respectively. The etch condition transition shown in Figure 6(b-1,b-2) with the increasing FC flow rate might be elucidated with this notable trend of varying ion densities; the increase in the H-containing ions, namely CHF2+, CH2F+, and CHF+, can significantly impede SiO2 etching since they are more polymeric than non H-containing FC ions [17], and this phenomenon could be significant in trench bottoms due to their directionality. For the gas mixture with Xe, the changes in the radical density are more remarkable than those in ion density. The increase in FC radical densities can be more effective in the mask region than near the etch bottom of the trench, as shown in Figure 6(c-2), where mask etching is reduced possibly due to an enhanced passivation of the mask sidewall by the increase in FC radical densities. The discussion about the effects of FC precursor flow rates and pattern widths is summarized in Table 2.
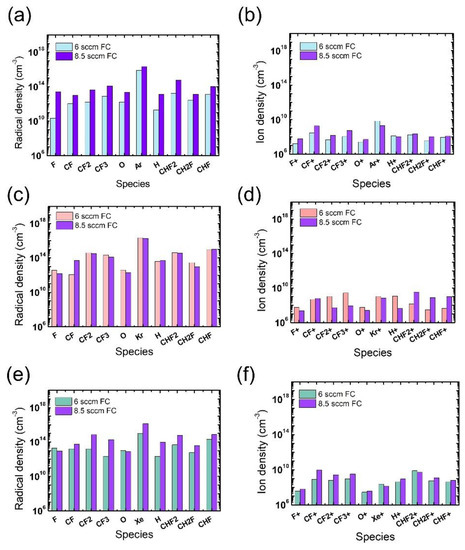
Figure 9.
Radical (left) and ion (right) densities obtained from (a,b) Ar-mixture plasma, (c,d) Kr-mixture plasma, and (e,f) Xe-mixture plasma, at various FC precursor flow rates. The O2 flow rate is 3 sccm.
Table 2.
Summary on the discussion about the effects of FC precursor flow rates and pattern widths.
4. Conclusions
We examined FC plasma SiO2 etching with gas mixtures of FC precursors (C4F8 and CH2F2), O2, and a noble gas (Ar, Kr, or Xe) under different gas flow rates of either the FC precursors or the noble gas. This work was conducted to address the lack of an etch database for the additions of Kr and Xe to gas mixtures in SiO2 etching, despite the fact that the addition of Kr and Xe in place of Ar has been reported to have promising potential as another process control knob. In the present results, replacing Ar with Kr or Xe is found to lead to significant differences in the etch profiles, especially when the etch environment is highly polymeric. These results reflect that changes in the plasma parameters according to the noble gas species provide more opportunities to vary the plasma processing conditions, which were identified via various plasma diagnostic methods in this work.
The remarkable evolution of the etch profiles observed with decreasing pattern widths in the Xe-added polymeric plasma is worth noting again. As the pattern width shrinks, the SiO2 is only etched near the center of the trench bottoms, eventually leaving seam-like, narrow etch profiles. This interesting etch profile is not observed with Ar or Kr. Thus, Xe is expected to be the key factor for the seam-like etch profile, but the underlying mechanism is currently out of scope. Theoretical and experimental approaches to finding the mechanism will be explored in future work.
Author Contributions
Conceptualization, Y.L., H.Y., H.L. and S.Y.; validation, Y.L., H.Y., H.L. and S.Y.; formal analysis, Y.L., H.Y., J.L., J.K., H.L. and S.Y.; data curation, Y.L., H.Y. and D.C.; writing—original draft preparation, Y.L.; writing—review and editing, S.K.; visualization, Y.L.; supervision, H.L. and S.Y. All authors have read and agreed to the published version of the manuscript.
Funding
This research was supported by National Research Council of Science & Technology (NST) grants by the Korean government (MSIP) (CRF-20-01-NFRI); by the next-generation intelligence semiconductor R&D Program through the Korea Evaluation Institute of Industrial Technology (KEIT) funded by the Korean government (MOTIE); by the Korea Institute of Energy Technology Evaluation and Planning (KETEP) and the MOTIE of the Republic of Korea (20202010100020); by the MOTIE (1415179040, 1415179069, 1415181071, 1415180221) and KSRC (Korea Semiconductor Research Consortium) (20009818, 20010420, 20019500, 20019473) support program for the development of future semiconductor devices; by a Korea Institute for Advancement of Technology (KIAT) grant funded by the Korean government (MOTIE) (P0008458, HRD Program for Industrial Innovation); by a Basic Science Research Program through the National Research Foundation of Korea (NRF) funded by the Ministry of Education (NRF-2020R1A6A1A03047771); and by the KIMM Institutional Program (NK236F) and NST/KIMM.
Institutional Review Board Statement
Not applicable.
Informed Consent Statement
Not applicable.
Data Availability Statement
The data presented in this study are available on request from the corresponding author.
Conflicts of Interest
The authors declare no conflict of interest.
References
- Adamovich, I.; Baalrud, S.D.; Bogaerts, A.; Bruggeman, P.J.; Cappelli, M.; Colombo, V.; Czarnetzki, U.; Ebert, U.; Eden, J.G.; Favia, P.; et al. The 2017 Plasma Roadmap: Low Temperature Plasma Science and Technology. J. Phys. D Appl. Phys. 2017, 50, 323001. [Google Scholar] [CrossRef]
- Lee, C.G.N.; Kanarik, K.J.; Gottscho, R.A. The Grand Challenges of Plasma Etching: A Manufacturing Perspective. J. Phys. D Appl. Phys. 2014, 47, 273001. [Google Scholar] [CrossRef]
- Lee, B.J.; Efremov, A.; Kwon, K.-H. Plasma parameters, gas-phase chemistry and Si/SiO2 etching mechanisms in HBr+Cl2+O2 gas mixture: Effect of HBr/O2 mixing ratio. Vacuum 2019, 163, 110–118. [Google Scholar] [CrossRef]
- Chang, W.S.; Yook, Y.G.; You, H.S.; Park, J.H.; Kwon, D.C.; Song, M.Y.; Yoon, J.S.; Kim, D.W.; You, S.J.; Yu, D.H.; et al. A unified semi-global surface reaction model of polymer deposition and SiO2 etching in fluorocarbon plasma. Appl. Surf. Sci. 2020, 515, 145975. [Google Scholar] [CrossRef]
- Kim, Y.; Kim, S.; Kang, H.; You, S.; Kim, C.; Chae, H. Low Global Warming C4H3F7O Isomers for Plasma Etching of SiO2 and Si3N4 Films. ACS Sustain. Chem. Eng. 2022, 10, 10537–10546. [Google Scholar] [CrossRef]
- Gholami, P.; Khataee, A.; Bhatnagar, A.; Vahid, B. Synthesis of N-Doped Magnetic WO3-x@Mesoporous Carbon Using a Diatom Template and Plasma Modification: Visible-Light-Driven Photocatalytic Activities. ACS Appl. Mater. Interfaces 2021, 13, 13072–13086. [Google Scholar] [CrossRef]
- Kim, J.-H.; Park, J.-S.; Kim, C.-K. SiO2 etching in inductively coupled plasmas using heptafluoroisopropyl methyl ether and 1,1,2,2-tetrafluoroethyl 2,2,2-trifluoroethyl ether. Appl. Surf. Sci. 2020, 508, 144787. [Google Scholar] [CrossRef]
- Khataee, A.; Gholami, P.; Sheydaei, M.; Khorram, S.; Joo, S.W. Preparation of nanostructured pyrite with N2 glow discharge plasma and the study of its catalytic performance in the heterogeneous Fenton process. New J. Chem. 2016, 40, 5221–5230. [Google Scholar] [CrossRef]
- Grill, A. Cold Plasma in Materials Fabrication; IEEE Press: Piscataway, NJ, USA, 2010; ISBN 9781475740301. [Google Scholar]
- Kondo, Y.; Miyawaki, Y.; Ishikawa, K.; Hayashi, T.; Takeda, K.; Kondo, H.; Sekine, M.; Hori, M. Hydrofluorocarbon Ion Density of Argon- or Krypton-Diluted CH2F2 Plasmas: Generation of CH2F+ and CHF2+ by Dissociative-Ionization in Charge Exchange Collisions. J. Phys. D Appl. Phys. 2015, 48, 045202. [Google Scholar] [CrossRef]
- Lin, K.-Y.; Li, C.; Engelmann, S.; Bruce, R.L.; Joseph, E.A.; Metzler, D.; Oehrlein, G.S. Achieving Ultrahigh Etching Selectivity of SiO2 over Si3N4 and Si in Atomic Layer Etching by Exploiting Chemistry of Complex Hydrofluorocarbon Precursors. J. Vac. Sci. Technol. A 2018, 36, 040601. [Google Scholar] [CrossRef]
- Gasvoda, R.J.; Zhang, Z.; Wang, S.; Hudson, E.A.; Agarwal, S. Etch Selectivity during Plasma-Assisted Etching of SiO2 and SiNx: Transitioning from Reactive Ion Etching to Atomic Layer Etching. J. Vac. Sci. Technol. A 2020, 38, 050803. [Google Scholar] [CrossRef]
- Miyake, K.; Ito, T.; Isobe, M.; Karahashi, K.; Fukasawa, M.; Nagahata, K.; Tatsumi, T.; Hamaguchi, S. Characterization of Polymer Layer Formation during SiO2/SiN Etching by Fluoro/Hydrofluorocarbon Plasmas. Jpn. J. Appl. Phys. 2014, 53, 03DD02. [Google Scholar] [CrossRef]
- Iijima, Y.; Ishikawa, Y.; Yang, C.L.; Chang, M.; Okano, H. Highly Selective SiO2 Etch Employing Inductively Coupled Hydro-Fluorocarbon Plasma Chemistry for Self Aligned Contact Etch. Jpn. J. Appl. Phys. 1997, 36, 5498–5501. [Google Scholar] [CrossRef]
- Gaboriau, F.; Cartry, G.; Peignon, M.-C.; Cardinaud, C. Selective and Deep Plasma Etching of SiO2: Comparison between Different Fluorocarbon Gases (CF4, C2F6, CHF3) Mixed with CH4 or H2 and Influence of the Residence Time. J. Vac. Sci. Technol. B 2002, 20, 1514–1521. [Google Scholar] [CrossRef]
- Tak, H.W.; Lee, H.J.; Wen, L.; Kang, B.J.; Sung, D.; Bae, J.W.; Kim, D.W.; Lee, W.; Lee, S.B.; Kim, K.; et al. Effect of Hydrofluorocarbon Structure of C3H2F6 Isomers on High Aspect Ratio Etching of Silicon Oxide. Appl. Surf. Sci. 2022, 600, 154050. [Google Scholar] [CrossRef]
- Kwon, B.S.; Kim, J.S.; Moon, H.K.; Lee, N.E. Improvement in Etch Selectivity of SiO2 to CVD Amorphous Carbon Mask in Dual-Frequency Capacitively Coupled C4F8/CH2F2/O2/Ar Plasmas. Thin Solid Film. 2010, 518, 6451–6454. [Google Scholar] [CrossRef]
- Lee, J.; Efremov, A.; Kim, K.; Kwon, K.H. Etching Characteristics of SiC in Inductively Coupled CH2F2/CF4/O2/Ar Ar Inductively Coupled Plasma: Effect of CF4/CH2F2 Mixing Ratio. J. Appl. Phys. 2016, 3, 106201. [Google Scholar] [CrossRef]
- Bai, K.H.; Chang, H.Y.; Uhm, H.S. Electron Temperature Analysis of Two-Gas-Species Inductively Coupled Plasma. Appl. Phys. Lett. 2001, 79, 1596–1598. [Google Scholar] [CrossRef]
- Bai, K.H.; You, S.J.; Chang, H.Y.; Uhm, H.S. Plasma Parameters Analysis of Various Mixed Gas Inductively Coupled Plasmas. Phys. Plasmas 2002, 9, 2831–2838. [Google Scholar] [CrossRef]
- Shin, H.; Zhu, W.; Economou, D.J.; Donnelly, V.M. Ion Energy Distributions, Electron Temperatures, and Electron Densities in Ar, Kr, and Xe Pulsed Discharges. J. Vac. Sci. Technol. A 2012, 30, 031304. [Google Scholar] [CrossRef]
- Cho, C.; You, K.; Kim, S.; Lee, Y.; Lee, J.; You, S. Characterization of SiO2 Etching Profiles in Pulse-Modulated Capacitively Coupled Plasmas. Materials 2021, 14, 5036. [Google Scholar] [CrossRef]
- Lee, Y.S.; Oh, S.H.; Lee, J.J.; Cho, C.H.; Kim, S.J.; You, S.J. A Quantification Method in Quadrupole Mass Spectrometer Measurement. Appl. Sci. Converg. Technol. 2021, 30, 50–53. [Google Scholar] [CrossRef]
- Seong, I.H.; Lee, J.J.; Cho, C.H.; Lee, Y.S.; Kim, S.J.; You, S.J. Characterization of SiO2 over Poly-Si Mask Etching in Ar/C4f8 Capacitively Coupled Plasma. Appl. Sci. Converg. Technol. 2021, 30, 176–182. [Google Scholar] [CrossRef]
- Lee, M.-H.; Jang, S.-H.; Chung, C.-W. Floating probe for electron temperature and ion density measurement applicable to processing plasmas. J. Appl. Phys. 2007, 101, 033305. [Google Scholar] [CrossRef]
- Van Nieuwenhove, R.; Van Oost, G. Novel Langmuir Probe Technique for the Real-Time Measurement of the Electron Temperature. Rev. Sci. Instrum. 1988, 59, 1053–1056. [Google Scholar] [CrossRef]
- Dawson, P.H. Quadrüpole Mass Spectrometry Its Applications; Elsevier Scientific Publishing Company: Amsterdam, The Netherlands, 1976; ISBN 0444413456. [Google Scholar]
- Kessels, W.M.M.; Leewis, C.M.; Van De Sanden, M.C.M.; Schram, D.C. Formation of Cationic Silicon Clusters in a Remote Silane Plasma and Their Contribution to Hydrogenated Amorphous Silicon Film Growth. J. Appl. Phys. 1999, 86, 4029–4039. [Google Scholar] [CrossRef]
- Singh, H.; Coburn, J.W.; Graves, D.B. Mass Spectrometric Detection of Reactive Neutral Species: Beam-to-Background Ratio. J. Vac. Sci. Technol. A 1999, 17, 2447–2455. [Google Scholar] [CrossRef]
- Singh, H.; Coburn, J.W.; Graves, D.B. Appearance Potential Mass Spectrometry: Discrimination of Dissociative Ionization Products. J. Vac. Sci. Technol. A 2000, 18, 299–305. [Google Scholar] [CrossRef]
- Kim, J.K.; Cho, S.I.; Kim, N.G.; Jhon, M.S.; Min, K.S.; Kim, C.K.; Yeom, G.Y. Study on the etching characteristics of amorphous carbon layer in oxygen plasma with carbonyl sulfide. J. Vac. Sci. Technol. A Vac. Surf. Film. 2013, 31, 021301. [Google Scholar] [CrossRef]
- Hoekstra, R.J. Microtrenching Resulting from Specular Reflection during Chlorine Etching of Silicon. J. Vac. Sci. Technol. B 1998, 16, 2102–2104. [Google Scholar] [CrossRef]


Publisher’s Note: MDPI stays neutral with regard to jurisdictional claims in published maps and institutional affiliations. |
© 2022 by the authors. Licensee MDPI, Basel, Switzerland. This article is an open access article distributed under the terms and conditions of the Creative Commons Attribution (CC BY) license (https://creativecommons.org/licenses/by/4.0/).