Article

Nonlinear Optical Properties of Zinc Oxide Nanoparticle Colloids Prepared by Pulsed Laser Ablation in Distilled Water

1
Laser Institute for Research and Applications LIRA, Beni-Suef University, Beni-Suef 62511, Egypt
2
Department of Engineering, Faculty of Advanced Technology and Multidiscipline, Universitas Airlangga, Surabaya 60115, Indonesia
3
Al Anbar Health Directorate, Ramadi 31001, Iraq
4
High Institute of Optics Technology HIOT, Sheraton Heliopolis, Cairo 11799, Egypt
5
Physics Department, Stockholm University, AlbaNova, 10691 Stockholm, Sweden
*
Author to whom correspondence should be addressed.
Nanomaterials 2022, 12(23), 4220; https://doi.org/10.3390/nano12234220
Submission received: 9 November 2022 / Revised: 24 November 2022 / Accepted: 25 November 2022 / Published: 28 November 2022

Abstract

:
The nonlinear optical properties of zinc oxide nanoparticles (ZnONPs) in distilled water were measured using a femtosecond laser and the Z-scan technique. The ZnONPs colloids were created by the ablation of zinc bulk in distilled water with a 532 nm Nd: YAG laser. Transmission electron microscopy, an ultraviolet-visible spectrophotometer, and atomic absorption spectrophotometry were used to determine the size, shape, absorption spectra, and concentration of the ZnONPs colloids. The nonlinear absorption coefficient and nonlinear refractive index were measured at different excitation wavelengths and intensities. The nonlinear absorption coefficient of the ZnONPs colloids was found to be positive, caused by reverse saturable absorption, whereas the nonlinear refractive index was found to be negative due to self-defocusing in the ZnONPs. Both laser parameters, such as excitation wavelength and input intensity, and nanoparticle features, such as concentration and size, were found to influence the nonlinear optical properties of the ZnONPs.

1. Introduction

Recently, the development of intense ultrafast lasers has attracted great attention from many researchers for the study of nonlinear optical (NLO) materials [1,2]. Materials with a strong nonlinearity and fast response times are important in many fields, such as nonlinear spectroscopy [3,4], optical switch [5], optical data-storage [6], biomedicine [7,8], and optoelectronic devices [9,10,11]. Future optoelectronic devices are predicted to be small in size with a high performance and high operation speeds. Nanomaterials are thought to be the appropriate medium for these devices [12]. Among nanomaterials, the transparent conducting oxide (TCO) nanomaterial is one of the best candidates for applications in the abovementioned fields. The combination of unique optical and electrical properties of TCO makes it a crucial element in a variety of optoelectronic devices. TCO nanomaterials are wide-bandgap semiconductors (>3.1 eV) characterized by high transparency in the visible range and high carrier density, which makes it electrically conductive [13,14]. TCO nanomaterials are of particular interest in the domain of NLO due to their large optical nonlinearity and short response time [15,16], as well as the fact that their NLO properties can be adapted by controlling the size and shape or doping with metallic ions [12,17].
Zinc oxide nanoparticles (ZnONPs) are one particular type of TCO nanomaterial that has attracted great attention because of their wide bandgap, negligible absorption in the visible region and large exciton-binding energy of 60 meV at room temperature [18], high mechanical and chemical stability, and low cost [19]. This combination of properties has made them a powerful element in many applications, such as electronics [20], nanomedicine [21], bioinspired systems [22], and communications [23]. Owing to their perfect crystalline nature, stability at high temperature and pressure, and high transparency in a wide-band optical region, ZnONPs are considered to be a suitable material in many nonlinear optical devices, including optical limiters, new frequency generation, optical switches, biological imaging and treatment with high resolution [24,25,26], and UV-blue nanolasers [27,28]. Based on the stated applications, there has been a lot of interest in the synthesis and study of the NLO properties of ZnONPs.
Several physical and chemical approaches, including solgel [29], thermal plasma [30], hydrothermal methods [31], and pulsed laser ablation in liquids (PLAL) [32], have recently been investigated for the liquid-phase synthesis of ZnONPs. PLAL is one of the most important physical approaches for producing NPs from their bulk form. When compared with other methods for obtaining metal colloids, PLAL is advantageous due to its ability to create high-purity nanomaterials using a simpler, faster, and direct methodology that does not require many steps or long process times [33]. It gives a smaller NP size with a narrower size distribution as compared with other conventional techniques [34]. Furthermore, PLAL is a flexible and environmentally friendly approach that enables the synthesis of a wide range of NPs without the use of any toxic or hazardous substances [32,35]. In PLAL, the high-intensity laser light is targeted on the surface of the solid target immersed in liquid. The sizes and shapes of the nanoparticles created by PLAL can be controlled by adjusting the laser beam’s parameters [36]. It is a one-step process that can result in ready-to-use batches without the need for additional sorting procedures [37].
The techniques for studying the NLO properties of ZnONPs are, e.g., nonlinear interferometry, optical Kerr gate, degenerate four-wave mixing, beam-distortion measurements, and Z-scan [38,39]. Z-scan [40] is the most comfortable and informative technique due to its experimental simplicity and high sensitivity compared with the other techniques. Z-scan is also applicable to different materials including liquids [41], semiconductors [42], and glasses [43,44].
Several reports [45,46,47,48,49,50,51] employed the Z-scan technique to explore the NLO properties of ZnO thin films. The results revealed that ZnO thin films had reverse saturable absorption (RSA) and a negative nonlinear refractive index. However, due to the difficulty in creating colloids with high homogeneity and homogeneous sizes and shapes, only a few studies [52,53] have reported on the investigation of ZnO nonlinearity as nanocolloids. Due to thermal effects, the NLO properties of ZnONPs under ns laser pulses are stronger than those under ps laser pulses, according to [52]. On the other hand, [53] looked at the effects of ZnONPs’ shapes and solvents on the NLO properties. ZnO nanospheres have higher NLO properties than ZnO triangular nanostructures. The ZnO nanospheres dispersed in water have higher NLO properties than ZnO nanospheres scattered in 2-propanol.
In the present work, ZnONPs colloids were prepared in a nanospheres structure by pulsed laser ablation in distilled water at various concentrations by using the second harmonic Nd: YAG laser with a constant fluence of 28.29 J/cm2. Furthermore, using femtosecond laser pulses and the Z-scan technique, a comprehensive study of the NLO properties of ZnONPs was carried out at different excitation wavelengths ranging from 740 nm to 820 nm and different excitation intensities ranging from 12.7 to 22.2 GW/cm2. The structure of the paper is as follows. The preparation of the ZnONPs colloids and the Z-scan experimental setup are described in Section 2. The experimental results are presented in the third section. The conclusions are presented in section four.

2. Experimental Setup

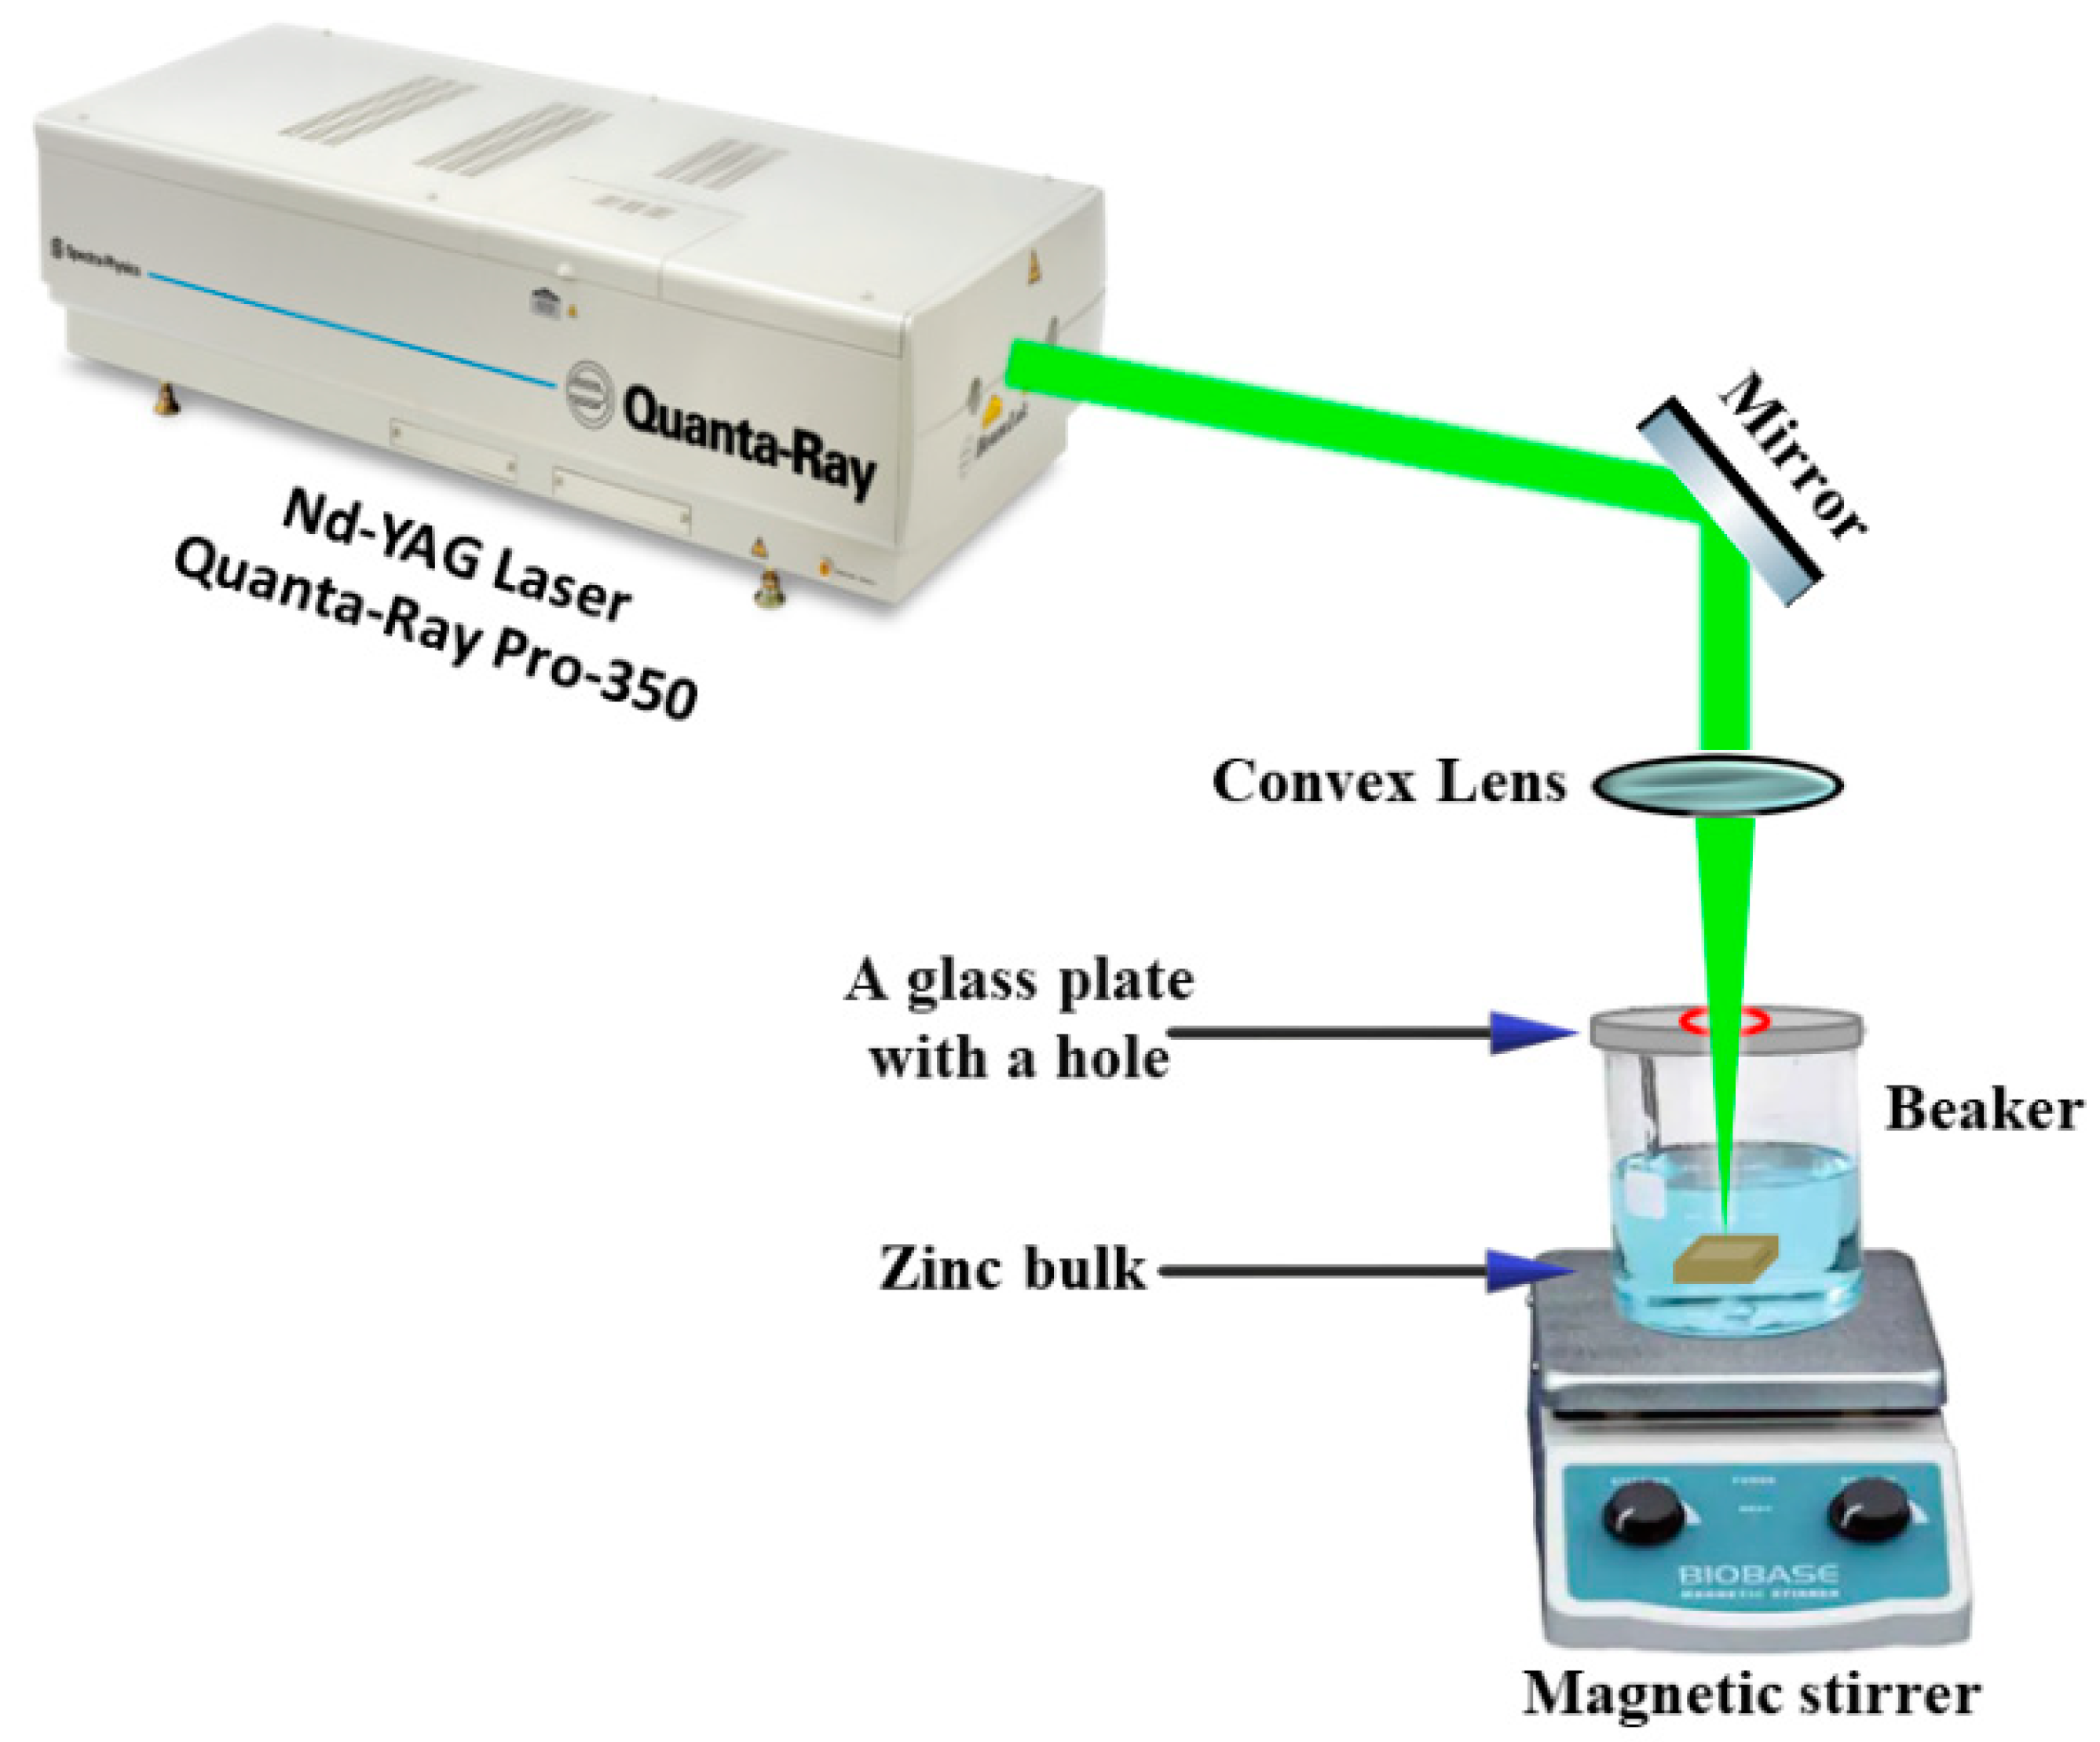
2.1. Sample Preparation

Figure 1 shows the experimental setup for preparing the ZnONPs colloids by using the 2nd harmonic Nd: YAG laser system from Spectra-Physics (Quanta-Ray PRO 350), which had a pulse duration of 10 ns and a repetition rate of 10 Hz. A 532 nm laser had a Gaussian beam distribution with a TEM00 with a maximum pulse energy of 1500 mJ per pulse. This pulse energy could be controlled by controlling the discharge voltage of the pump source (flash lamp).
ZnONPs colloids were prepared in distilled water from bulk zinc (rectangular in shape and with a purity > 99%). The laser beam with a constant energy per pulse of 20 mJ was focused by a convex lens with a focal length of 10 cm. By using the knife-edge approach, the focal spot’s size was confirmed to be ∼150 µm. The bulk zinc was placed in a beaker filled with 22 mL distilled water and covered with a glass plate that had a hole that had a similar diameter to the laser beam to reduce the splashes, which were ejected by the ablating beam from the air-water interface. The problem with splashing is the deposition of solution outside the beaker was that it was undesirable because the ejected droplets could reach the focusing lens, resulting in a decrease in irradiation intensity, sample loss, focal-distance changes, and decreased ablation efficiency. The liquid was stirred gently by a magnetic stirrer to homogenize the colloid and remove the particles from the laser path, while the zinc bulk was moved to prevent deterioration during the ablation. The nanoparticles were prepared at different ablation times of 5 and 10 min.

2.2. Z-Scan Setup

The setup of the Z-scan technique is shown in Figure 2 [54]. The femtosecond laser pulses were delivered by the INSPIRE HF100 laser system from Spectra-Physics, which was pumped by a mode-locked femtosecond Ti: sapphire MAI TAI HP laser, with ~1.5–2.9 W average power, 80 MHz repetition rate, and wavelengths ranging from 690 to 1040 nm.
The laser beam had a Gaussian distribution with TEM00 spatial mode and M2 < 1.1. The INSPIRE HF100 laser system operated at the fundamental IR pump wavelengths and two other modes of operation: (i) second-harmonic generator (SHG) and (ii) optical-parametric oscillator (OPO). The SHG mode generated an output in the range of 345–520 nm, achieved by tuning the Ti: sapphire laser and rotating the second harmonic NLO crystal. The OPO mode generated two simultaneous outputs; one of which covered the range 490–750 nm for the signal, and the other 930–2500 nm for the idler for a fixed-pump wavelength of 820 nm, tuned primarily by rotating the OPO crystal. These modes of operation allowed for us to tune the output wavelength from 345 to 2500 nm, which was covered by four exit apertures.
The nonlinear optical properties of ZnONPs colloids were studied by using horizontally polarized pulses with 100 fs FWHM pulse duration and in the wavelength range of 740–820 nm, selected by the fundamental IR pump aperture. The Gaussian laser pulses were tightly focused to the beam waist of 22.4 µm by a lens with 5 cm focal length. The ZnONPs colloids were filled in a 1 mm path-length quartz cuvette, which is less than the Rayleigh length (z0). The cuvette was scanned through the focus with a micrometer linear-translation stage. The total transmitted laser power was recorded by a power meter (Newport 843R) for the open aperture (OA) Z-scan in order to determine the nonlinear absorption coefficient. In the closed aperture (CA) Z-scan, which was used to determine the sign and the value of the nonlinear refractive index of the substance, an aperture was placed in front of the power meter and adjusted to transmit a fixed fraction of 30% of the total transmitted light of the OA Z-scan in order to achieve a good balance between sensitivity and signal-to-noise ratio [40]. The experimental error in the obtained NLO parameters was about 10%, which mainly originated from the determination of the irradiance distribution used in the experiment, i.e., beam waist, pulse width, and laser power calibration.

3. Results and Discussion

3.1. ZnONPs Colloids Analysis

The concentration of the prepared ZnONPs colloids was measured by atomic absorption spectrometry (AAS) (Agilent Technologies 200 Series AA). The AAS device worked because each ion or atom absorbed a specific wavelength, and the amount of light absorbed at this wavelength was exactly proportional to the concentration of the substance, which was determined using the Beer–Lambert law. In the AAS, the concentration is normally calculated using a calibration curve obtained with known concentration standards [55]. The concentration of ZnONPs colloids was increased from 5 to 13 mg/L by increasing the ablation time from 5 to 10 min. That also showed that as the ablation time increases, the ablation efficiency improves. The optical transmittance of the ZnONPs colloids was measured in a wavelength range of 200–850 nm by using the UV-Vis–NIR spectrophotometer (Perkin-Elmer, Lambda 950 spectrometer), as shown in Figure 3.
The transmissions of the two prepared ZnONPs samples (5, 13 mg/L) were high in the visible and near-infrared regions; however, they were low in the ultraviolet region. This result agrees with the obtained transmission spectrum in [51]. The energy bandgap was determined from the optical transmission data of ZnONPs colloids by using Tauc’s plot equation [56], which can be written as:
( α h ν ) 2 = A ( h ν E g )
where α is the linear absorption coefficient, is the energy of the photons, A is an energy-independent constant, and Eɡ is the bandgap energy. Using Tauc’s equation, the bandgaps of the ZnONPs colloids were found to be 5.28 and 5.10 eV for concentrations of 5 and 13 mg/L, respectively, as shown in Figure 4.
Figure 5a,b shows the TEM images and size-distribution graph histograms of the colloidal ZnONPs colloids at the different concentrations of 5 and 13 mg/L, respectively. The ablation laser fluence was kept constant at 28.29 J/cm2, and the ZnONPs colloids had a spherical morphology. The average sizes of the ZnONPs colloids at concentrations of 5 and 13 mg/L were 19.5, and 16.2 nm, respectively. Due to the photo-fragmentation process being more effective with longer ablation times compared with bulk thermal ablation, the average sample size of 13 mg/L decreased as the ablation time was increased from 5 to 10 min. This observation would be clarified with a description of the physics that goes beyond PLAL’s production of nanoparticles. The PLAL is a straightforward thermal effect that involves heating, melting, vaporizing, and ionizing the target material to produce plasma, from which the matter is expelled [57,58]. However, in the present work, the irradiation of the bulk zinc is more related to the photo-fragmentation of the ablated nanoparticles that accumulate close to the laser spot. Once the amount of created nanoparticles becomes sufficiently enormous, they shield the incident laser’s light. Hence, the incident laser energy reaching the zinc bulk is attenuated, which causes no further increase in the number of nanoparticles. As a result, rather than removing material from the zinc bulk, most of the laser’s energy is used to break up the larger ablated particles into smaller ones [59]. Figure 5b, which depicts this finding, demonstrates how the number of nanoparticles with small sizes increases while the number of nanoparticles with large sizes decreases after a 10-min ablation time. The bandgap of ZnONP colloids decreases from 5.28 to 5.1 eV with decreasing size from 19.5 to 16.2 eV, which disagrees with the theory of electron confinement at the nanoscopic scale [60,61,62]. This theory is only applicable to nanoparticles in the quantum range that are between 1 and 10 nm in size, and is not applicable to particles larger than 10 nm, as shown in Figure 4 and Figure 5.

3.2. OA Z-Scan Measurements of ZnONPs

In the OA Z-scan measurements performed using 100 fs and 80 MHz repetition-rate laser pulses, two samples of ZnONPs colloids with different concentrations were irradiated by an excitation wavelength of 800 nm and different incident peak intensities from 12.7 to 22.2 GW/cm2. Figure 6 shows the OA Z-scan traces of the ZnONPs colloids, in which all of the curves show a valley that is induced by reverse-saturable absorption (RSA) behavior (i.e., positive nonlinear absorption coefficient) that agrees with the results in [51,63]. The reason for the RSA behavior may be three-photon absorption (3PA), free carriers’ absorption, excited-state absorption, nonlinear scattering, or a combination of these processes [64]. According to the bandgaps of the two samples, it is reasonable to assume that 3PA occurs, which induces the nonlinear absorption process. By fitting the experimental data of Figure 6a–d using Equation (2) [40], the nonlinear absorption coefficients for the samples were obtained at different incident peak intensities.
Δ T O A = 1 + α 3     I 0 2 L 3   ( 3 / 2 ) [   1 + ( z z 0 ) 2 ] 2
where Δ T O A is the normalized transmittance, α 3   is the 3PA coefficient, I0 is the peak intensity at the focus (Z = 0), and L is the thickness of the sample. The solid curves in Figure 6a–d are the fits using Equation (2).
Figure 7 shows how   α 3   is affected by the incident laser peak intensity. α 3   increases with an increasing incident laser peak intensity. This is because increasing the laser intensity increases the number of excited electrons in the conduction band (3PA), which thus increases the probability of free-carrier absorption [64]. It is also noticeable that the α 3   of 13 mg/L is higher than that of 5 mg/L, reaching 289 × 10−22 cm3/W2 and 497 × 10−22 cm3/W2, respectively. This is because increasing the concentration of ZnONPs colloids from 5 to 13 mg/L increases the number of nanoparticles in the solution, which increases the amount of three-photon absorption [54]. According to the previous report [51], the obtained 3PA coefficient is three times larger than that of thin film, and eight times larger than that of bulk zinc.
With the aim of investigating the dependence of the nonlinear absorption coefficient on the excitation wavelength for the ZnONPs colloids, the OA Z-scan was performed at a constant peak intensity of 15.8 GW/cm2 and different excitation wavelengths of 740 nm, 760, 780, 800 nm, and 820 nm, as shown in Figure 8a–e. This wavelength range was selected for the purpose of preventing high linear absorption, as it is far from the absorption peak of ZnONPs colloids.
The data in Figure 8a–e was fitted by using Equation (2) to extract the nonlinear absorption coefficients at different excitation wavelengths. Figure 9 shows that the 3PA coefficient increases from 123 × 10−22 to 280× 10−22 cm3/W2 for the concentration of 5 mg/L and from 241× 10−22 to 718× 10−22 cm3/W2 for the concentration of 13 mg/L as the excitation wavelengths increases from 740 nm to 820 nm. This indicates a significant dependence of the ZnONPs colloids nonlinear-absorption coefficient on the excitation wavelength domain spanning from 740 nm to 820 nm.

3.3. CA Z-Scan Measurements of ZnONPs

The CA Z-scan of the ZnONPs colloids was performed using 100 fs and 80 MHz high repetition rate (HRR) laser pulses. The HRR causes thermal heating in the sample due to the absorption of a portion of the laser energy and its conversion to heat. As a result, during the time between laser pulses, the sample does not return to its initial equilibrium temperature, thus resulting in heat accumulation. This heat can cause a temperature distribution, which in turn causes a change in the distribution of the refractive index. The change in refractive index causes accumulative thermal heating which alters the divergence and convergence of the next incident pulses, resulting in the incorrect interpretation of the CA Z-scan measurements. The separation time between laser pulses in the experiment was ⋍12.5 ns (80 MHz), which was less than the thermal characteristic time of the sample (tc = w/4D), where w is the diameter of the laser beam and D is the thermal diffusion coefficient (D = k/ρCp), which is dependent on the sample parameters (k thermal conductivity, ρ the sample density, and Cp the specific heat capacity). The thermal characteristic time estimated for liquids and some optical glasses is higher than 40 µs [65]. To overcome the problem of accumulative thermal lensing in this study, a new method was used, which is described in [66] as:
1 f ( Z ) = a   L   E p F l 3 2 ω ( Z ) 2 ( 1 1 N p )
where a is the fitting parameter, a = α (dn/dT)/2 κ 3D)1/2, dn/dT is the temperature derivative of the refractive index, Ep is the energy per laser pulse, ω ( z ) is the radius of the laser beam at the sample, Fl is the repetition rate, L is the sample thickness, and Np is the number of laser pulses incident on the sample. Np = t × Fl, where t represents the exposure time for each ZnONPs sample during the scan. The normalized transmittance of the CA Z-scan measurements ΔTCA, the features of which depend on the focal length of the induced lensing f(Z), is given by [67]:
Δ T CA = 1 + 2 Z f ( Z )
Thus, the nonlinear refractive index (n2) can be measured by using the following equation [66,67,68]:
n 2 = λ   w 0 2   Δ ϕ 2   P p e a k   L  
where Δ ϕ is the phase shift, the Ppeak is the peak power, and L is the length of the sample (⋍1 mm). The phase shift can be expressed by [66] as:
Δ ϕ = z 0 2   f ( 0 )
where f (0) is the focal length of the induced thermal lens when the sample is placed at the focus (Z = 0). The CA Z-scan studies were performed for the 5 and 13 mg/L samples of ZnONPs colloids; the samples were irradiated by an excitation wavelength of 800 nm and different incident peak intensities ranging from 12.7 to 22.2 GW/cm2. The closed aperture was adjusted to transmit a fixed fraction of 30% from the total transmitted light in the OA, and the results are shown in Figure 10a–d. The experimental data was fitted to the expression given by Equation (4). In Figure 10, the transmission exhibits a pre-focal peak, followed by a post-focal valley. This reveals that ZnONPs colloids exhibit a negative nonlinear refractive index that is induced by the self-defocusing property of the ZnONPs colloids, which agrees with the previous reports [51,63].
Figure 11 shows the dependence of the nonlinear refractive index on the incident peak intensity. The main reasons for nonlinear refraction in semiconductor materials are the absorptive processes [69,70]. As a result, increasing nonlinear absorption by increasing the intensity as shown in Figure 7 increases the nonlinear refractive index. The data provides that the nonlinear refractive index increases from 55 × 10−16 to 65 × 10−16 cm2/W for a concentration of 5 mg/L and from 95 × 10−16 to 121 × 10−16 cm2/W for a concentration of 13 mg/L with an increasing the incident peak intensity from 12.7 to 22.2 GW/cm2, respectively. The maximum refractive index was found to be at a concentration of 13 mg/L. This is because a higher concentration leads to more ZnONPs, which in turn causes more particles to become excited and enhance the nonlinear response.
The CA Z-scan was performed at constant peak intensity of 15.8 GW/cm2 and at different excitation wavelengths of 740 nm, 760, 780, 800 nm, and 820 nm to study the dependance of the nonlinear refractive index on the excitation wavelength for the ZnONPs colloids, as shown in Figure 12a–e.
Figure 13 shows a linear dependence of the nonlinear refractive index on the excitation wavelength. As the wavelength increases from 740 to 820 nm, the nonlinear refractive index n2 increases from 35 × 10−16 cm2/W to 83 × 10−16 cm2/W for 5 mg/L, and increases from 71 × 10−16 cm2/W to 127 × 10−16 cm2/W for 13 mg/L. This is because the increase in wavelength is accompanied by an increase in nonlinear absorption; as previously stated, nonlinear refraction is caused by absorptive processes.
Table 1 summarizes the effects of different laser parameters on the nonlinear optical properties of ZnONPs. This table provides a comprehensive overview of the behaviors of ZnONPs of various sizes under the influence of different excitation laser sources.

4. Conclusions

In the present work, the ZnONPs colloids were prepared at different concentrations using the second harmonic of a Nd:YAG laser source. The ZnONPs colloids samples were prepared at different ablation times, which affected their bandgaps, sizes, and concentrations. The linear optical properties of the ZnONPs colloids were determined using transmission electron microscopy and an ultraviolet-visible spectrophotometer. The nonlinear optical properties of the ZnONPs colloids were investigated using the Z-scan technique by 100 fs laser pulses at an excitation wavelength range from 740 to 820 nm, with a peak intensity that varied from 12.7 to 22.2 GW/cm2. The ZnONPs colloid samples exhibited RSA behavior and three-photon absorption (3PA) at various excitation wavelengths, excitation powers, and concentrations. The closed aperture measurements reveal that the ZnONPs colloid samples exhibited self-defocusing behavior and a negative refractive index. With an increasing laser power, excitation wavelength, and ZnONPs colloids concentration, the 3PA coefficient and nonlinear refractive index increased.

Author Contributions

Conceptualization, methodology, and preparation, T.M., A.F., M.A., H.A. and S.M.; software, investigation, formal analysis, data curation, and writing—original draft, S.M., T.M., M.A. and A.F.; supervision, project administration, and funding acquisition, R.S. and T.M.; writing—review and editing, T.M., M.A., A.F., S.M. and R.S. All authors have read and agreed to the published version of the manuscript.

Funding

Science and Technology Development Fund (STDF), Basic Sciences Research Program, (30147), Egypt.

Data Availability Statement

Data underlying the results presented in this paper are not publicly available at this time but may be obtained from the authors upon reasonable request.

Conflicts of Interest

The authors declare no conflict of interest.

References

  1. Auston, D.H. Ultrafast Optoelectronics. In Ultrashort Laser Pulses and Applications; Kaiser, W., Ed.; Springer: Berlin/Heidelberg, Germany, 1988; Volume 60, pp. 183–233. [Google Scholar] [CrossRef]
  2. Barbara, P.F.; Knox, W.H.; Mourou, G.A.; Zewail, A.H. Ultrafast Phenomena IX. In Proceedings of the 9th International Conference, Manchester, UK, 5–7 September 1994; Volume 60, ISBN 978-3-642-85178-0. [Google Scholar]
  3. Mukamel, S. Principles of Nonlinear Optical Spectroscopy; Oxford University Press on Demand: Oxford, UK, 1999; ISBN 0195092783. [Google Scholar]
  4. Shen, Y.R. A few selected applications of surface nonlinear optical spectroscopy. Proc. Natl. Acad. Sci. USA 1996, 93, 12104–12111. [Google Scholar] [CrossRef] [PubMed] [Green Version]
  5. Lee, J.Y.; Yin, L.; Agrawal, G.P.; Fauchet, P.M. Ultrafast optical switching based on nonlinear polarization rotation in silicon waveguides. Opt. Express 2010, 18, 11514–11523. [Google Scholar] [CrossRef] [PubMed]
  6. Wei, J.; Liu, S.; Geng, Y.; Wang, Y.; Li, X.; Wu, Y.; Dun, A. Nano-optical information storage induced by the nonlinear saturable absorption effect. Nanoscale 2011, 3, 3233–3237. [Google Scholar] [CrossRef]
  7. Adur, J.; Carvalho, H.F.; Cesar, C.L.; Casco, V.H. Nonlinear Microscopy Techniques: Principles and Biomedical Applications; Intech: Rijeka, Croatia, 2016. [Google Scholar] [CrossRef] [Green Version]
  8. Giner-Casares, J.J.; Henriksen-Lacey, M.; Coronado-Puchau, M.; Liz-Marzán, L.M. Inorganic nanoparticles for biomedicine: Where materials scientists meet medical research. Mater. Today 2016, 19, 19–28. [Google Scholar] [CrossRef]
  9. Chung, I.; Kanatzidis, M.G. Metal Chalcogenides: A Rich Source of Nonlinear Optical Materials. Chem. Mater. 2014, 26, 849–869. [Google Scholar] [CrossRef]
  10. Isaenko, L.I.; Yelisseyev, A.P. Recent studies of nonlinear chalcogenide crystals for the mid-IR. Semicond. Sci. Technol. 2016, 31, 123001. [Google Scholar] [CrossRef]
  11. Kowalevicz, A.M.; Sharma, V.; Ippen, E.P.; Fujimoto, J.G.; Minoshima, K. Three-dimensional photonic devices fabricated in glass by use of a femtosecond laser oscillator. Opt. Lett. 2005, 30, 1060–1062. [Google Scholar] [CrossRef] [PubMed]
  12. Karthikeyan, B.; Sandeep, C.S.S.; Philip, R.; Baesso, M.L. Study of optical properties and effective three-photon absorption in Bi-doped ZnO nanoparticles. J. Appl. Phys. 2009, 106, 114304. [Google Scholar] [CrossRef]
  13. Chopra, K.L.; Major, S.; Pandya, D.K. Transparent conductors—A status review. Thin Solid Film. 1983, 102, 1–46. [Google Scholar] [CrossRef]
  14. Hamberg, I.; Granqvist, C.G. Evaporated Sn-doped In2O3 films: Basic optical properties and applications to energy-efficient windows. J. Appl. Phys. 1986, 60, R123–R160. [Google Scholar] [CrossRef]
  15. Karaagac, H.; Yengel, E.; Islam, M.S. Physical properties and heterojunction device demonstration of aluminum-doped ZnO thin films synthesized at room ambient via sol–gel method. J. Alloy. Compd. 2012, 521, 155–162. [Google Scholar] [CrossRef]
  16. Li, C.; Shi, G.; Xu, H.; Guang, S.; Yin, R.; Song, Y. Nonlinear optical properties of the PbS nanorods synthesized via surfactant-assisted hydrolysis. Mater. Lett. 2007, 61, 1809–1811. [Google Scholar] [CrossRef]
  17. Zhong, X.; Xie, R.; Zhang, Y.; Basché, T.; Knoll, W. High-Quality Violet- to Red-Emitting ZnSe/CdSe Core/Shell Nanocrystals. Chem. Mater. 2005, 17, 4038–4042. [Google Scholar] [CrossRef]
  18. Mahmood, K.; Park, S.B. Atmospheric pressure based electrostatic spray deposition of transparent conductive ZnO and Al-doped ZnO (AZO) thin films: Effects of Al doping and annealing treatment. Electron. Mater. Lett. 2013, 9, 161–170. [Google Scholar] [CrossRef]
  19. Ponnusamy, R.; Sivasubramanian, D.; Sreekanth, P.; Gandhiraj, V.; Philip, R.; Bhalerao, G.M. Nonlinear optical interactions of Co: ZnO nanoparticles in continuous and pulsed mode of operations. RSC Adv. 2015, 5, 80756–80765. [Google Scholar] [CrossRef]
  20. Chen, J.; Qiu, Y.; Yang, D.; She, J.; Wang, Z. Improved piezoelectric performance of two-dimensional ZnO nanodisks-based flexible nanogengerators via ZnO/Spiro-MeOTAD PN junction. J. Mater. Sci. Mater. Electron. 2020, 31, 5584–5590. [Google Scholar] [CrossRef]
  21. Jiang, J.; Pi, J.; Cai, J. The Advancing of Zinc Oxide Nanoparticles for Biomedical Applications. Bioinorg. Chem. Appl. 2018, 2018, 1062562. [Google Scholar] [CrossRef]
  22. Serrà, A.; Gómez, E.; Philippe, L. Bioinspired ZnO-based solar photocatalysts for the efficient decontamination of persistent organic pollutants and hexavalent chromium in wastewater. Catalysts 2019, 9, 974. [Google Scholar] [CrossRef]
  23. Kaushik, V.; Rajput, S.; Kumar, M. Broadband optical modulation in a zinc-oxide-based heterojunction via optical lifting. Opt. Lett. 2020, 45, 363. [Google Scholar] [CrossRef]
  24. Torres-Torres, C.; García-Cruz, M.; Castañeda, L.; Rojo, R.R.; Tamayo-Rivera, L.; Maldonado, A.; Avendaño-Alejo, M.; Torres-Martínez, R. Photoconductivity, photoluminescence and optical Kerr nonlinear effects in zinc oxide films containing chromium nanoclusters. J. Lumin. 2012, 132, 1083–1088. [Google Scholar] [CrossRef]
  25. Torres-Torres, C.; Uc, B.A.C.; Rangel-Rojo, R.; Castañeda, L.; Torres-Martínez, R.; Gil, C.G.; Khomenko, A.V. Optical Kerr phase shift in a nanostructured nickel-doped zinc oxide thin solid film. Opt. Express 2013, 21, 21357–21364. [Google Scholar] [CrossRef] [PubMed]
  26. Kachynski, A.V.; Kuzmin, A.N.; Nyk, M.; Roy, I.; Prasad, P.N. Zinc Oxide Nanocrystals for Nonresonant Nonlinear Optical Microscopy in Biology and Medicine. J. Phys. Chem. C 2008, 112, 10721–10724. [Google Scholar] [CrossRef] [PubMed] [Green Version]
  27. Chan, S.W.; Barille, R.; Nunzi, J.M.; Tam, K.H.; Leung, Y.H.; Chan, W.K.; Djurišić, A. Second harmonic generation in zinc oxide nanorods. Appl. Phys. B 2006, 84, 351–355. [Google Scholar] [CrossRef]
  28. Johnson, J.C.; Yan, H.; Schaller, R.D.; Petersen, P.B.; Yang, A.P.; Saykally, R.J. Near-Field Imaging of Nonlinear Optical Mixing in Single Zinc Oxide Nanowires. Nano Lett. 2002, 2, 279–283. [Google Scholar] [CrossRef]
  29. Jurablu, S.; Farahmandjou, M.; Firoozabadi, T.P. Sol-Gel Synthesis of Zinc Oxide (ZnO) Nanoparticles: Study of Structural and Optical Properties. J. Sci. Islam. Repub. Iran 2015, 26, 281–285. [Google Scholar] [CrossRef]
  30. Ko, T.S.; Yang, S.; Hsu, H.C.; Chu, C.P.; Lin, H.F.; Liao, S.C.; Wang, S.C. ZnO nanopowders fabricated by dc thermal plasma synthesis. Mater. Sci. Eng. B 2006, 134, 54–58. [Google Scholar] [CrossRef]
  31. Aneesh, P.M.; Vanaja, K.A.; Jayaraj, M.K. Synthesis of ZnO nanoparticles by hydrothermal method. In Nanophotonic materials IV; SPIE: Bellingham, WA, USA, 2007; Volume 6639, pp. 47–55. [Google Scholar] [CrossRef]
  32. Huang, H.; Lai, J.; Lu, J.; Li, Z. Pulsed laser ablation of bulk target and particle products in liquid for nanomaterial fabrication. AIP Adv. 2019, 9, 015307. [Google Scholar] [CrossRef]
  33. Tri, P.N.; Ouellet-Plamondon, C.; Rtimi, S.; Assadi, A.A.; Nguyen, T.A. Methods for synthesis of hybrid nanoparticles. In Noble Metal-Metal Oxide Hybrid Nanoparticles; Woodhead Publishing: Sawston, UK, 2019; pp. 51–63. [Google Scholar]
  34. Singh, S.; Gopal, R. Synthesis of colloidal zinc oxide nanoparticles by pulsed laser ablation in aqueous media. Phys. E Low-Dimens. Syst. Nanostructures 2008, 40, 724–730. [Google Scholar] [CrossRef]
  35. Dell’Aglio, M.; Gaudiuso, R.; De Pascale, O.; De Giacomo, A. Mechanisms and processes of pulsed laser ablation in liquids during nanoparticle production. Appl. Surf. Sci. 2015, 348, 4–9. [Google Scholar] [CrossRef]
  36. Tsuji, T.; Iryo, K.; Nishimura, Y.; Tsuji, M. Preparation of metal colloids by a laser ablation technique in solution: Influence of laser wavelength on the ablation efficiency (II). J. Photochem. Photobiol. A Chem. 2001, 145, 201–207. [Google Scholar] [CrossRef]
  37. Batani, D.; Vinci, T.; Bleiner, D. Laser-ablation and induced nanoparticle synthesis. Laser Part. Beams 2014, 32, 1–7. [Google Scholar] [CrossRef] [Green Version]
  38. de Araújo, C.B.; Gomes, A.S.L.; Boudebs, G. Techniques for nonlinear optical characterization of materials: A review. Rep. Prog. Phys. 2016, 79, 036401. [Google Scholar] [CrossRef] [Green Version]
  39. Antoine, R.; Bonačić-Koutecký, V. Measurement Techniques of Optical Nonlinearities—Two-Photon Absorption/Fluorescence and Hyper-Rayleigh Scattering. In Liganded Silver and Gold Quantum Clusters. Towards a New Class of Nonlinear Optical Nanomaterials; Springer: Berlin/Heidelberg, Germany, 2018; pp. 49–62. [Google Scholar] [CrossRef]
  40. Sheik-Bahae, M.; Said, A.; Wei, T.-H.; Hagan, D.; Van Stryland, E. Sensitive measurement of optical nonlinearities using a single beam. IEEE J. Quantum Electron. 1990, 26, 760–769. [Google Scholar] [CrossRef] [Green Version]
  41. Gómez, S.L.; Cuppo, F.L.S.; Neto, A.M.F.; Kosa, T.; Muramatsu, M.; Horowicz, R.J. Z-scan measurement of the nonlinear refractive indices of micellar lyotropic liquid crystals with and without the ferrofluid doping. Phys. Rev. E 1999, 59, 3059–3063. [Google Scholar] [CrossRef]
  42. Sheik-Bahae, M.; Hutchings, D.; Hagan, D.; Van Stryland, E. Dispersion of bound electron nonlinear refraction in solids. IEEE J. Quantum Electron. 1991, 27, 1296–1309. [Google Scholar] [CrossRef]
  43. DeSalvo, R.; Said, A.A.; Hagan, D.J.; Van Stryland, E.W.; Sheik-Bahae, M. Infrared to ultraviolet measurements of two-photon absorption and n2 in wide bandgap solids. IEEE J. Quantum Electron. 1996, 32, 1324–1333. [Google Scholar] [CrossRef]
  44. Bindra, K.; Oak, S.; Rustagi, K. Intensity dependence of Z-scan in semiconductor-doped glasses for separation of third and fifth order contributions in the below band gap region. Opt. Commun. 1999, 168, 219–225. [Google Scholar] [CrossRef]
  45. Nagaraja, K.; Pramodini, S.; Kumar, A.S.; Nagaraja, H.; Poornesh, P.; Kekuda, D. Third-order nonlinear optical properties of Mn doped ZnO thin films under cw laser illumination. Opt. Mater. 2013, 35, 431–439. [Google Scholar] [CrossRef]
  46. Sony, T.; Zaker, T.A.; Zakar, A.T.; Mohammed, H.N. Nonlinear Optical Properties of ZnO Thin Film at Low Laser Intensity Using Z-Scan Technique. Rafidain J. Sci. 2021, 30, 32–38. [Google Scholar] [CrossRef]
  47. Kepceoğlu, A.; Gezgin, S.Y.; Gündoğdu, Y.; Küçükçelebi, H.; Kılıç, H. Nonlinear Optical Properties of Zinc Oxide Thin Films Produced by Pulsed Laser Deposition. Mater. Today: Proc. 2019, 18, 1819–1825. [Google Scholar] [CrossRef]
  48. Xu, Y.; Lu, Y.; Zuo, Y.; Xu, F.; Zuo, D. Z-scan measurements of nonlinear refraction and absorption for aluminum-doped zinc oxide thin film. Appl. Opt. 2019, 58, 6112–6117. [Google Scholar] [CrossRef]
  49. Wen, X.; Han, Y.; Yao, C.; Zhang, K.; Li, J.; Sun, W.; Wu, J.D. The photoluminescence, ultrafast nonlinear optical properties and carrier dynamics of 1D In-doped ZnO nanostructures: Experiment and mechanism. Opt. Mater. 2018, 77, 67–76. [Google Scholar] [CrossRef]
  50. Lee, H.; Lee, K.; Lee, S.; Koh, K.; Park, J.-Y.; Kim, K.; Rotermund, F. Ultrafast third-order optical nonlinearities of vertically-aligned ZnO nanorods. Chem. Phys. Lett. 2007, 447, 86–90. [Google Scholar] [CrossRef]
  51. Raied, K.J.; Mohammed, T.H.; Abdulla, M. Three-Photon Absorption in ZnO Film Using Ultra Short Pulse Laser. J. Mod. Phys. 2012, 3, 856–864. [Google Scholar]
  52. Chang, Q.; Zhang, D.; Gao, M.; Zhen, S. Effects of Laser Pulse Width and Solvent on the Optical Nonlinearities of ZnO Nanoparticles. In Machinery, Materials Science and Energy Engineering (ICMMSEE), Proceedings of the 3rd International Conference, Wuhan, China, 18 –19 July 2015; World Scientific Publishing Company: Singapore; pp. 512–520.
  53. Kavitha, M.K.; Haripadmam, P.; Gopinath, P.; Krishnan, B.; John, H. Effect of morphology and solvent on two-photon absorption of nano zinc oxide. Mater. Res. Bull. 2013, 48, 1967–1971. [Google Scholar] [CrossRef]
  54. Ahmed, H.; Mahmoud, A.; Mobarak, M.; El-Salam, H.M.A.; Mohamed, T. Using femtosecond laser pulses to study the nonlinear optical properties of rhodamine 6G dissolved in water. J. Mol. Liq. 2021, 340, 117199. [Google Scholar] [CrossRef]
  55. Farrukh, M.A. (Ed.) Atomic Absorption Spectroscopy; ACS Publications: Washington, DC, USA, 2012; ISBN 978-953-307-817-5. [Google Scholar]
  56. Coulter, J.B.; Birnie, D.P., III. Assessing Tauc plot slope quantification: ZnO thin films as a model system. Phys. Status Solidi B 2018, 255, 1700393. [Google Scholar] [CrossRef]
  57. Zeng, H.; Du, X.-W.; Singh, S.C.; Kulinich, S.A.; Yang, S.; He, J.; Cai, W. Nanomaterials via Laser Ablation/Irradiation in Liquid: A Review. Adv. Funct. Mater. 2012, 22, 1333–1353. [Google Scholar] [CrossRef]
  58. Barcikowski, S.; Devesa, F.; Moldenhauer, K. Impact and structure of literature on nanoparticle generation by laser ablation in liquids. J. Nanoparticle Res. 2009, 11, 1883–1893. [Google Scholar] [CrossRef]
  59. Van Overschelde, O.; Guisbiers, G. Photo-fragmentation of selenium powder by Excimer laser ablation in liquids. Opt. Laser Technol. 2015, 73, 156–161. [Google Scholar] [CrossRef]
  60. Mamdouh, S.; Mahmoud, A.; Samir, A.; Mobarak, M.; Mohamed, T. Using femtosecond laser pulses to investigate the nonlinear optical properties of silver nanoparticles colloids in distilled water synthesized by laser ablation. Phys. B Condens. Matter 2022, 631, 413727. [Google Scholar] [CrossRef]
  61. Ashour, M.; GFaris, H.; Ahmed, H.; Mamdouh, S.; Thambiratnam, K.; Mohamed, T. Using Femtosecond Laser Pulses to Explore the Nonlinear Optical Properties of Au NP Colloids That Were Synthesized by Laser Ablation. Nanomaterials 2022, 12, 2980. [Google Scholar] [CrossRef]
  62. Aghdam, H.D.; Azadi, H.; Esmaeilzadeh, M.; Bellah, S.M.; Malekfar, R. Ablation time and laser fluence impacts on the composition, morphology and optical properties of copper oxide nanoparticles. Opt. Mater. 2019, 91, 433–438. [Google Scholar] [CrossRef]
  63. Rao, A.S.; Sethuraman, G.; Ghosh, O.S.N.; Sharan, A.; Viswanath, A.K. Third order nonlinear study of ZnO nano particles under femto-second laser illumination. arXiv 2018, arXiv:1806.09404. [Google Scholar]
  64. Saad, N.A.; Dar, M.H.; Ramya, E.; Naraharisetty, S.R.G.; Rao, D.N. Saturable and reverse saturable absorption of a Cu2O–Ag nanoheterostructure. J. Mater. Sci. 2019, 54, 188–199. [Google Scholar] [CrossRef]
  65. Falconieri, M. Thermo-optical effects in Z -scan measurements using high-repetition-rate lasers. J. Opt. A: Pure Appl. Opt. 1999, 1, 662–667. [Google Scholar] [CrossRef]
  66. Shehata, A.; Mohamed, T. Method for an accurate measurement of nonlinear refractive index in the case of high-repetition-rate femtosecond laser pulses. JOSA B 2019, 36, 1246–1251. [Google Scholar] [CrossRef]
  67. Kwak, C.H.; Lee, Y.L.; Kim, S.G. Analysis of asymmetric Z-scan measurement for large optical nonlinearities in an amorphous As2S3 thin film. JOSA B 1999, 16, 600–604. [Google Scholar] [CrossRef]
  68. Severiano-Carrillo, I.; Alvarado-Méndez, E.; Trejo-Durán, M.; Méndez-Otero, M. Improved Z-scan adjustment to thermal nonlinearities by including nonlinear absorption. Opt. Commun. 2017, 397, 140–146. [Google Scholar] [CrossRef]
  69. Sheik-Bahae, M. Relation between N2 and two-photon absorption. In Laser-Induced Damage in Optical Materials 1989; SPIE: Bellingham, WA, USA, 1990; Volume 1438, pp. 613–619. [Google Scholar]
  70. Sheik-Bahae, M.; Hagan, D.J.; Said, A.A.; Young, J.; Wei, T.-H.; Van Stryland, E.W. Kramers-Kronig relation between n2 and two-photon absorption . In Proceedings of the Electro-Optical Materials for Switches, Coatings, Sensor Optics, and Detectors, Orlando, FL, USA, 16–20 April 1990; pp. 395–400. [Google Scholar] [CrossRef]
  71. Walden, S.L.; Fernando, J.F.S.; Shortell, M.P.; Waclawik, E.R.; Jaatinen, E.A. Nonlinear Absorption and Fluorescence in ZnO and ZnO–Au Nanostructures. Adv. Opt. Mater. 2016, 4, 2133–2138. [Google Scholar] [CrossRef] [Green Version]
  72. Abrinaei, F.; Molahasani, N. Effects of Mn doping on the structural, linear, and nonlinear optical properties of ZnO nanoparticles. J. Opt. Soc. Am. B 2018, 35, 2015–2022. [Google Scholar] [CrossRef]
  73. Solati, E.; Dorranian, D. Nonlinear optical properties of the mixture of ZnO nanoparticles and graphene nanosheets. Appl. Phys. A 2016, 122, 76. [Google Scholar] [CrossRef]
  74. Zhang, S.; Lu, H.; Rui, G.; Lv, C.; He, J.; Cui, Y.; Gu, B. Preparation of Ag@ZnO core–shell nanostructures by liquid-phase laser ablation and investigation of their femtosecond nonlinear optical properties. Appl. Phys. B 2020, 126, 1–9. [Google Scholar] [CrossRef]
  75. Rout, A.; Boltaev, G.S.; Ganeev, R.A.; Rao, K.S.; Fu, D.; Rakhimov, R.Y.; Guo, C. Low-and high-order nonlinear optical studies of ZnO nanocrystals, nanoparticles, and nanorods. Eur. Phys. J. D 2019, 73, 1–8. [Google Scholar] [CrossRef]
Figure 1. Experimental setup of laser ablation for preparing ZnONPs colloids using 532 nm pulsed Nd: YAG laser.
Nanomaterials 12 04220 g001
Figure 2. Schematic diagram of Z-scan setup.
Nanomaterials 12 04220 g002
Figure 3. The transmission spectrums of ZnONPs at concentrations of 5 and 13 mɡ/L at 5- and 10-min ablation time.
Nanomaterials 12 04220 g003
Figure 4. The energy bandgaps of ZnONPs colloids using Tauc’s equation.
Nanomaterials 12 04220 g004
Figure 5. Histogram of the size-distribution of ZnONPs colloids synthesized by laser ablation in distilled water at a constant laser pulse energy of 20 mJ and at different ablation times of (a) 5 min (5 mg/L) (b) 10 min (13 mg/L), respectively. TEM images of colloidal ZnONPs are included as an inset.
Nanomaterials 12 04220 g005
Figure 6. The OA Z–scan transmission of ZnONPs colloids prepared at different concentrations of 5 and 13 mg/L, irradiated by 800 nm, and at different incident peak intensities (a) 12.7, (b) 15.8, (c) 19, and (d) 22.2 GW/cm2. The points indicate the experimental results, and the solid lines indicate the fits.
Nanomaterials 12 04220 g006
Figure 7. The 3PA coefficient of ZnONPs colloids as a function of the incident peak intensity at a constant excitation wavelength of 800 nm.
Nanomaterials 12 04220 g007
Figure 8. OA Z-scan measurements for the ZnONPs colloids at different excitation wavelengths ranging from 740 to 820 nm at a constant peak intensity of 15.8 GW/cm2 (ae). The dots indicate the experimental results, and the solid lines indicate the theoretical fitting.
Nanomaterials 12 04220 g008aNanomaterials 12 04220 g008b
Figure 9. The 3PA coefficient of ZnONPs colloids as a function of excitation wavelength at a constant incident peak intensity of 15.8 GW/cm2.
Nanomaterials 12 04220 g009
Figure 10. The CA Z–scan transmission of ZnONPs colloids prepared at different concentrations of 5 and 13 mg/L, irradiated by 800 nm, and at different incident peak intensities of (a) 12.7, (b) 15.8, (c) 19, and (d) 22.2 GW/cm2. The dots indicate the experimental results, and the solid lines indicate the theoretical fitting.
Nanomaterials 12 04220 g010
Figure 11. The nonlinear refractive index of ZnONPs colloids as a function of the incident peak intensity at a constant excitation wavelength of 800 nm.
Nanomaterials 12 04220 g011
Figure 12. CA Z-scan measurements for the ZnONPs colloids at different excitation wavelengths ranging from 740 to 820 nm and at a constant peak intensity of 15.8 GW/cm2 (ae). The dots indicate the experimental results, and the solid lines indicate the theoretical fitting.
Nanomaterials 12 04220 g012aNanomaterials 12 04220 g012b
Figure 13. The nonlinear refractive index of ZnONPs colloids as a function of excitation wavelength at a constant incident peak intensity of 15.8 GW/cm2.
Nanomaterials 12 04220 g013
Table 1. Comparison of the nonlinear optical properties of ZnONPs obtained in previous studies and those obtained in this study.
Laser Parameters.ZnONPs Avg. Size (nm)n2
( cm 2 / W )
βRef.
λ   ( nm ) Pulse
Duration
Repetition   Rate   ( Hz )
5325 ns10100---- 2.3 × 10 11 cm / W [71]
53210 ns20041 1.2 × 10 12 6.6 × 10 8   cm / W [72]
5327ns529.5 1.183 × 10 9 5.7 × 10 3   cm / W [73]
800170 fs100065 1.66 × 10 15
----[74]
400
800
40 fs100080
40
4.3 × 10 15
1.6 × 10 15
8.4 × 10 11   cm / W
4.6 × 10 11 cm / W
[75]
800100 fs 80 × 10 6 19.5
16.2
55 × 10 16
65 × 10 16
289 × 10 22   c m 3 / W 2
497 × 10 22   c m 3 / W 2
Current work
Publisher’s Note: MDPI stays neutral with regard to jurisdictional claims in published maps and institutional affiliations.

