
Long-Term Aging of Concentrated Aqueous Graphene Oxide Suspensions Seen by Rheology and Raman Spectroscopy


 , ,
, , 
Abstract
:1. Introduction
2. Materials and Methods
2.1. Sample Preparation
2.2. Characterization Methods
3. Results and Discussion
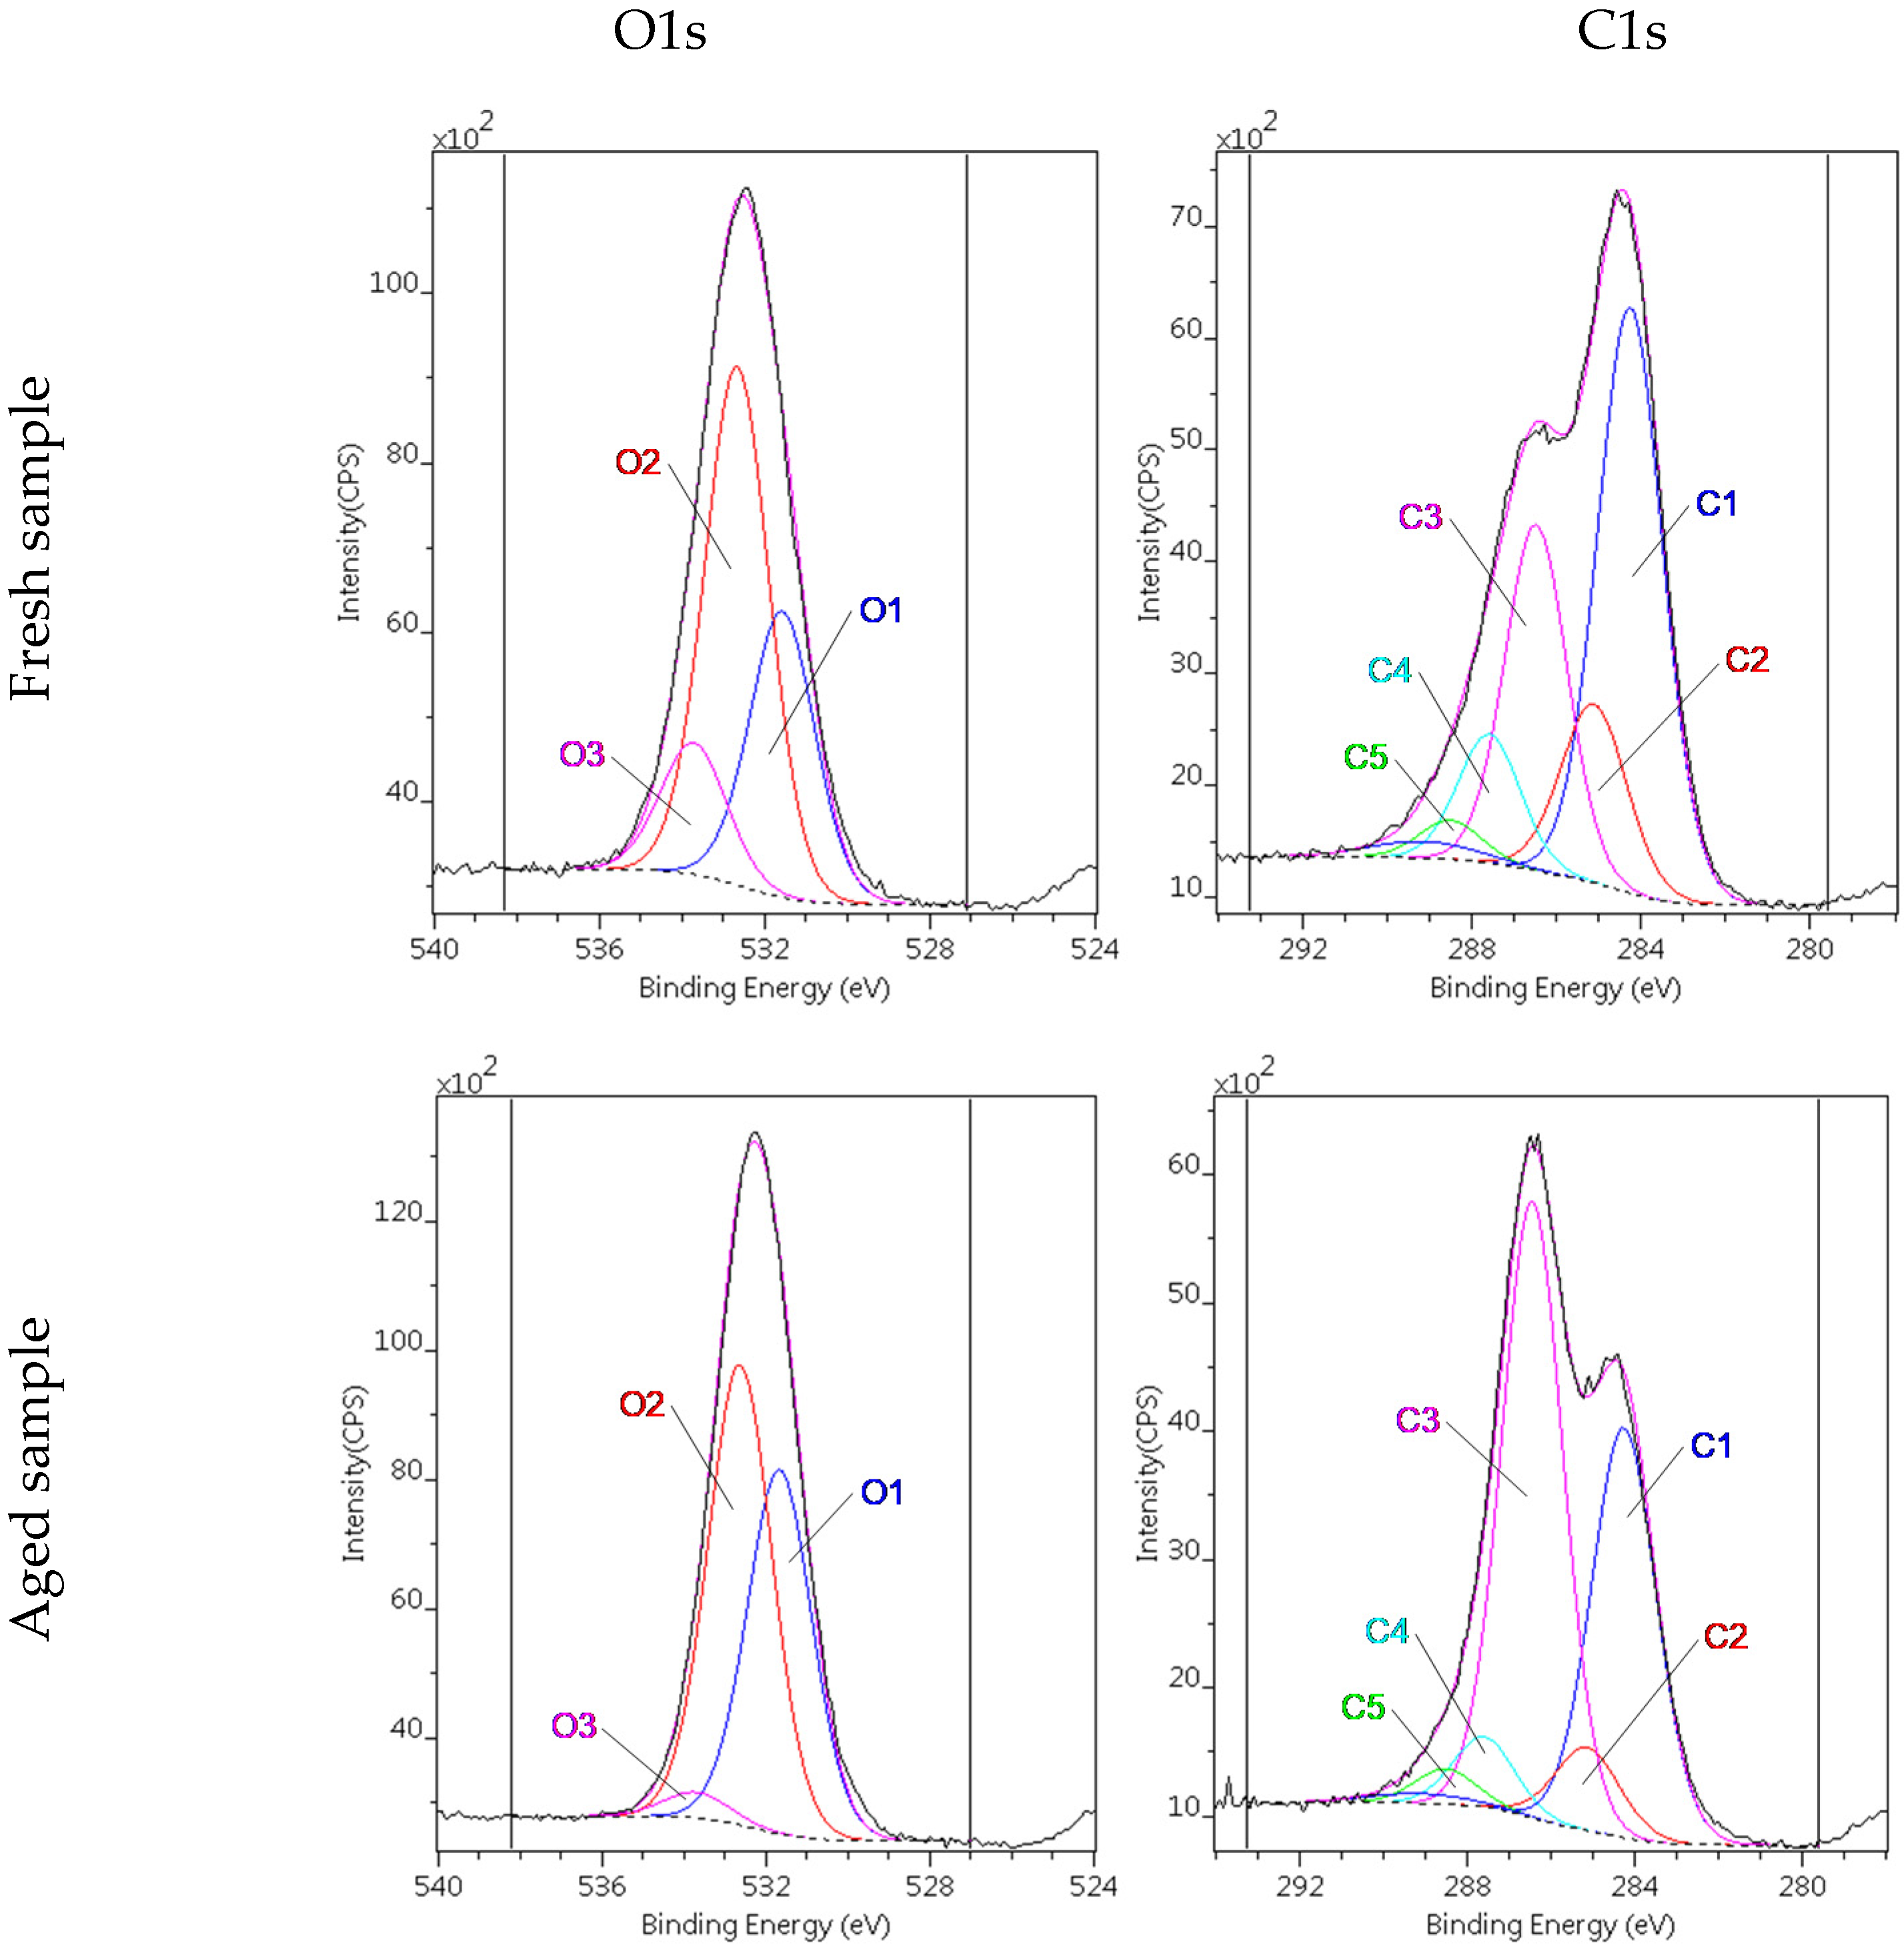
3.1. Characterization of the Fresh Sample
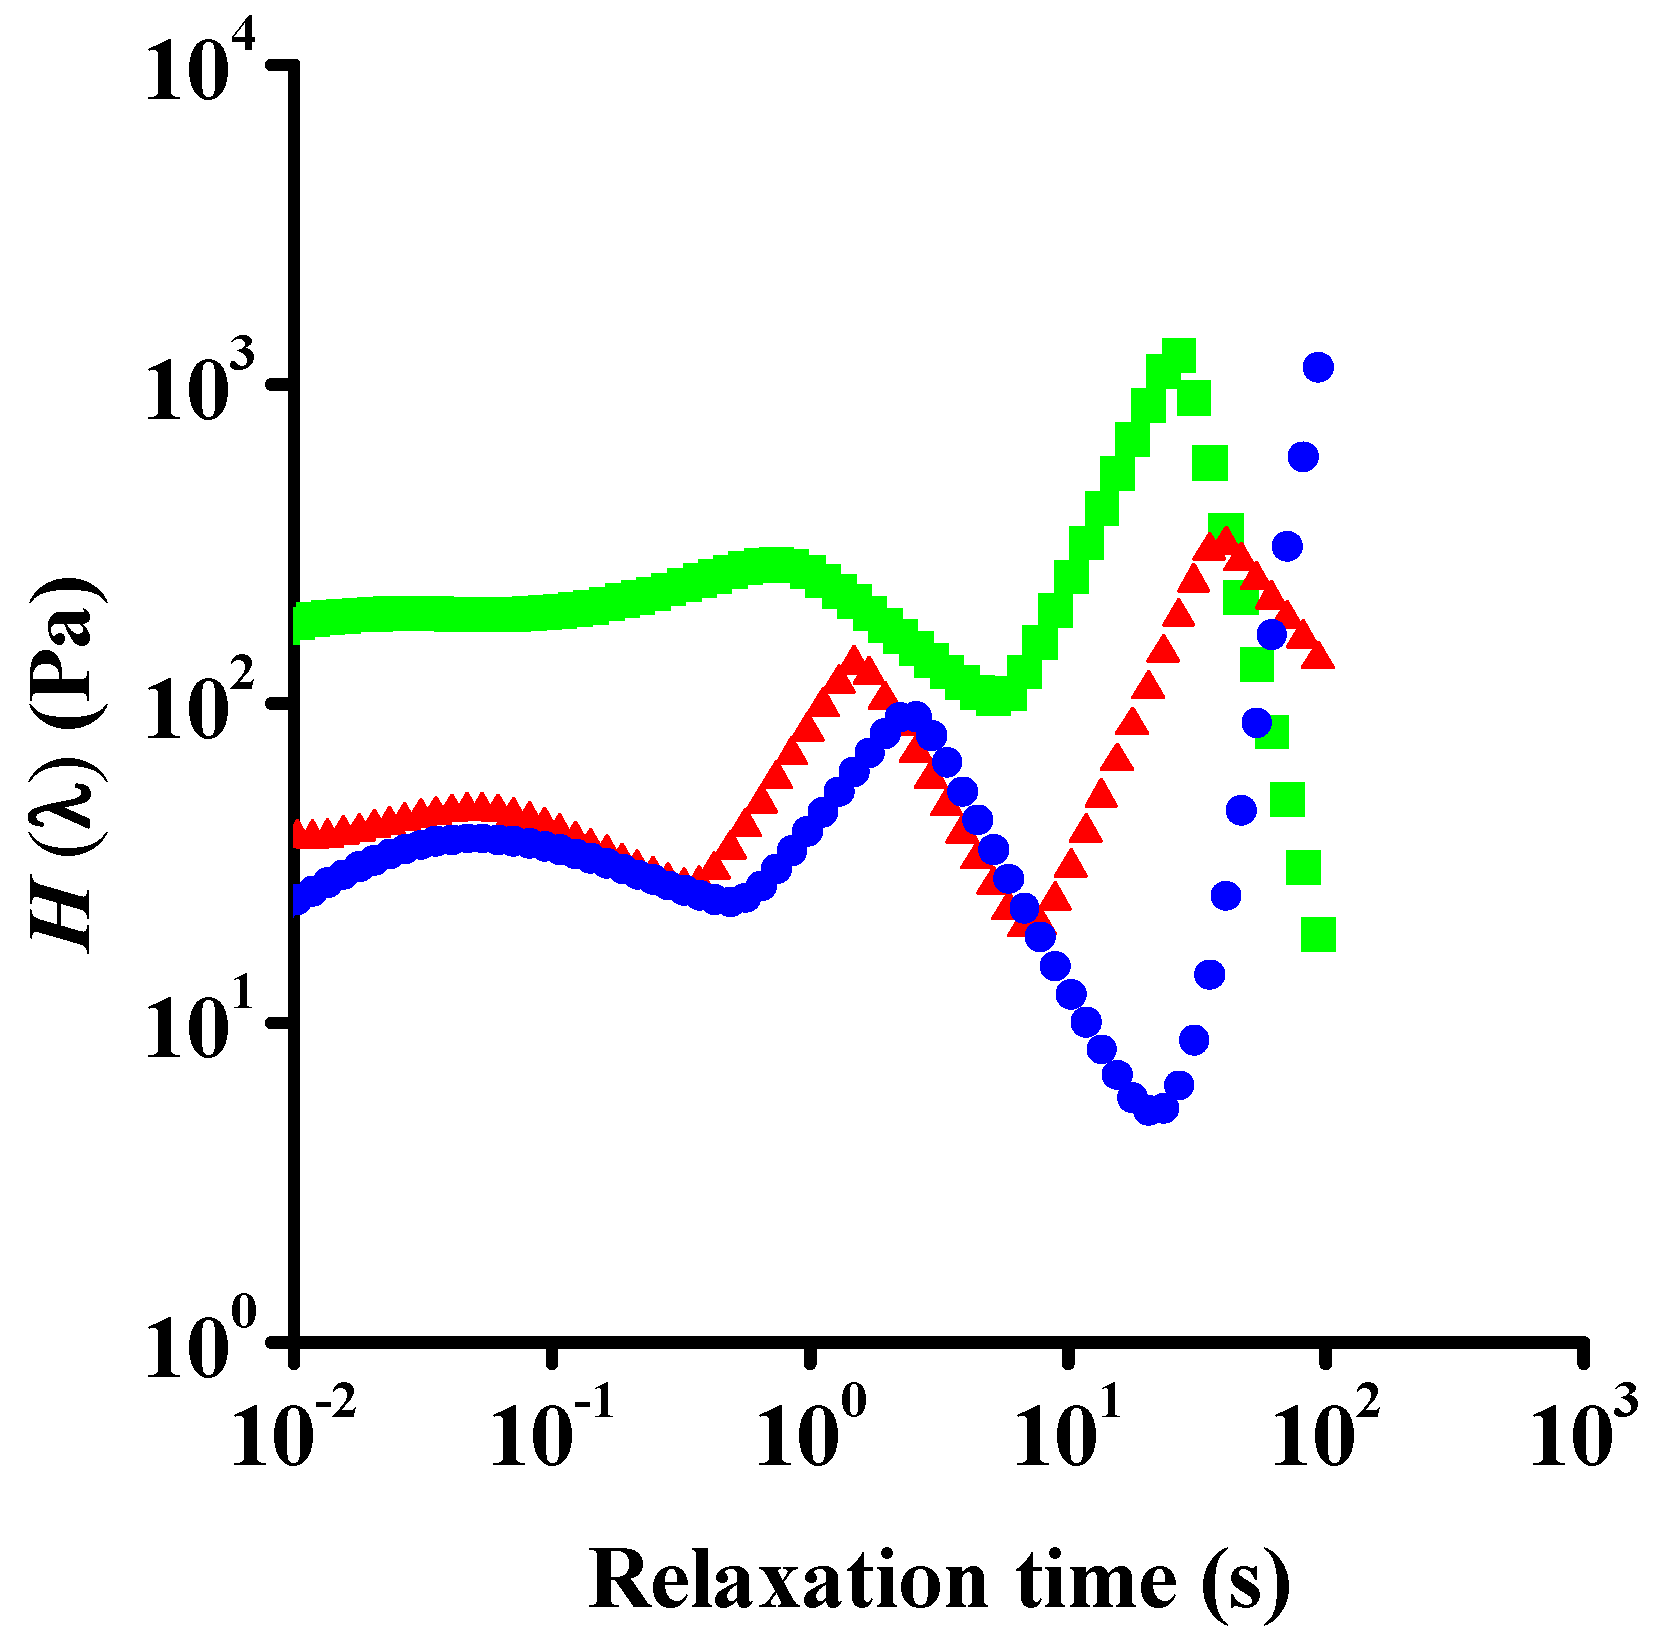
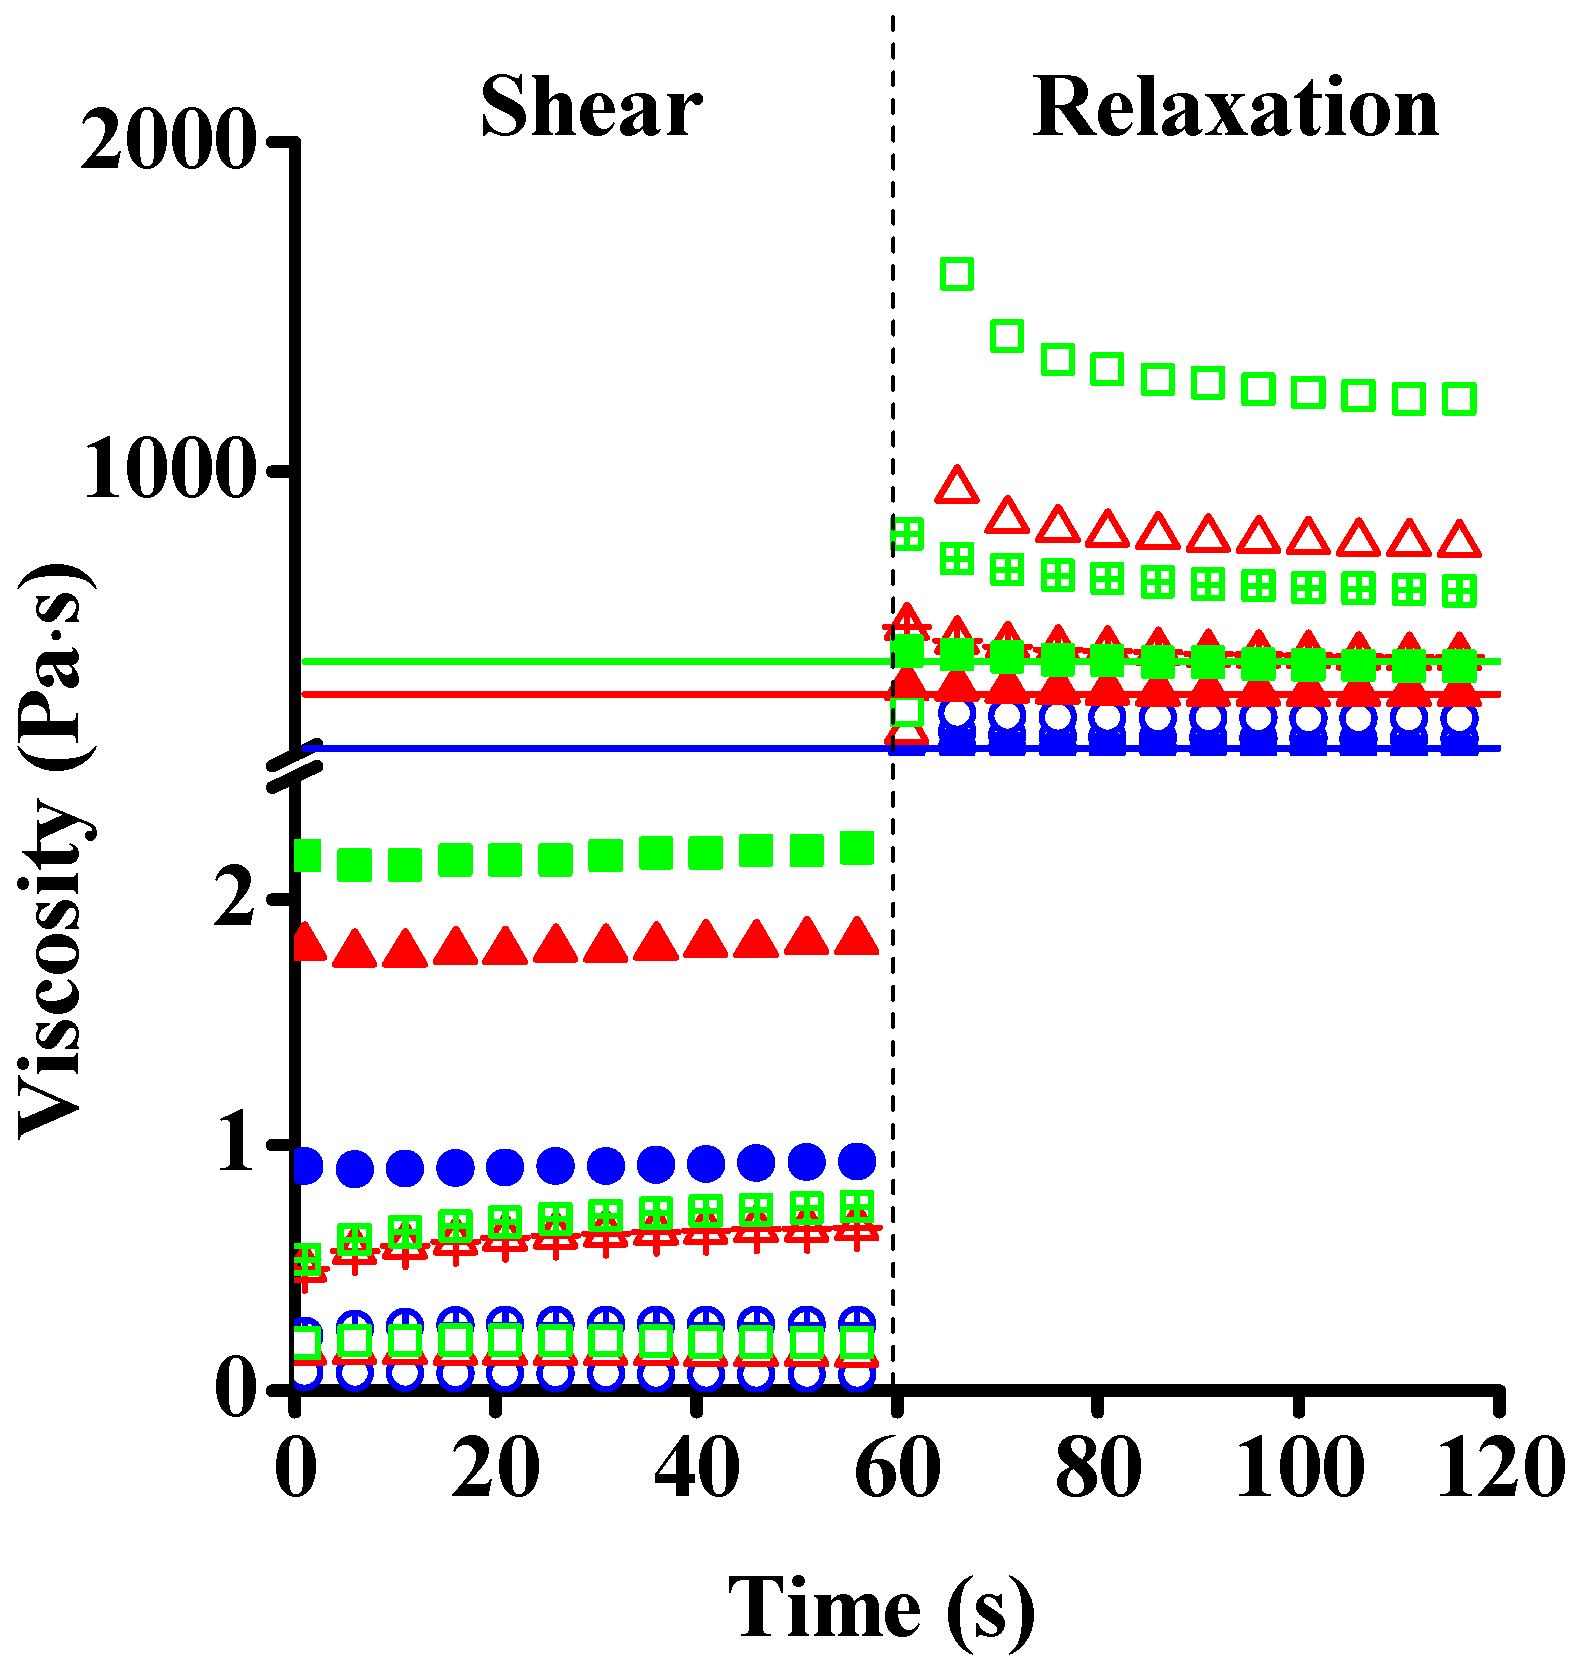
3.2. Rheology
3.3. Aging
4. Conclusions
Supplementary Materials
Author Contributions
Funding
Institutional Review Board Statement
Informed Consent Statement
Data Availability Statement
Acknowledgments
Conflicts of Interest
References
- Sasikala, S.P.; Lim, J.; Kim, I.H.; Jung, H.J.; Yun, T.; Han, T.H.; Kim, S.O. Graphene oxide liquid crystals: A frontier 2D soft material for graphene-based functional materials. Chem. Soc. Rev. 2018, 47, 6013–6045. [Google Scholar] [CrossRef] [PubMed]
- Lin, F.; Tong, X.; Wang, Y.; Bao, J.; Wang, Z.M. Graphene oxide liquid crystals: Synthesis, phase transition, rheological property, and applications in optoelectronics and display. Nanoscale Res. Lett. 2015, 10, 435. [Google Scholar] [CrossRef] [PubMed] [Green Version]
- Corker, A.; Ng, H.C.-H.; Poole, R.J.; García-Tuñón, E. 3D printing with 2D colloids: Designing rheology protocols to predict ‘printability’ of soft-materials. Soft Matter 2019, 15, 1444–1456. [Google Scholar] [CrossRef] [Green Version]
- García-Tuñón, E.; Feilden, E.; Zheng, H.; D’Elia, E.; Leong, A.; Saiz, E. Graphene oxide: An all-in-one processing additive for 3D printing. ACS Appl. Mater. Interfaces 2017, 9, 32977–32989. [Google Scholar] [CrossRef] [Green Version]
- Rocha, V.G.; Garcia-Tunon, E.; Botas, C.; Markoulidis, F.; Feilden, E.; D’Elia, E.; Ni, N.; Shaffer, M.; Saiz, E. Multimaterial 3D printing of graphene-based electrodes for electrochemical energy storage using thermoresponsive inks. ACS Appl. Mater. Interfaces 2017, 9, 37136–37145. [Google Scholar] [CrossRef] [PubMed]
- Brodie, B.C. On the atomic weight of graphite. Philos. Trans. R. Soc. Lond. 1859, 149, 249–259. [Google Scholar] [CrossRef] [Green Version]
- Botas, C.; Álvarez, P.; Blanco, C.; Santamaría, R.; Granda, M.; Ares, P.; Rodríguez-Reinoso, F.; Menendez, R. The effect of the parent graphite on the structure of graphene oxide. Carbon 2012, 50, 275–282. [Google Scholar] [CrossRef] [Green Version]
- Shojaeenezhad, S.S.; Farbod, M.; Kazeminezhad, I. Effects of initial graphite particle size and shape on oxidation time in graphene oxide prepared by Hummers’ method. J. Sci. Adv. Mater. Devices 2017, 2, 470–475. [Google Scholar] [CrossRef]
- Staudenmaier, L. Verfahren zur Darstellung der Graphitsäure. Ber. Dtsch. Chem. Ges. 1898, 31, 1481–1487. [Google Scholar] [CrossRef] [Green Version]
- Eigler, S.; Enzelberger-Heim, M.; Grimm, S.; Hofmann, P.; Kroener, W.; Geworski, A.; Dotzer, C.; Rockert, M.; Xiao, J.; Papp, C.; et al. Wet chemical synthesis of graphene. Adv. Mater. 2013, 25, 3583–3587. [Google Scholar] [CrossRef]
- Hummers, W.S., Jr.; Offeman, R.E. Preparation of graphitic oxide. J. Am. Chem. Soc. 1958, 80, 1339. [Google Scholar] [CrossRef]
- Marcano, D.C.; Kosynkin, D.V.; Berlin, J.M.; Sinitskii, A.; Sun, Z.; Slesarev, A.; Alemany, L.B.; Lu, W.; Tour, J.M. Improved synthesis of graphene oxide. ACS Nano 2010, 4, 4806–4814. [Google Scholar] [CrossRef] [PubMed]
- Xu, Y.; Bai, H.; Lu, G.; Li, C.; Shi, G. Flexible Graphene Films via the Filtration of Water-Soluble Noncovalent Functionalized Graphene Sheets. J. Am. Chem. Soc. 2008, 130, 5856–5857. [Google Scholar] [CrossRef] [PubMed]
- Yang, X.; Ma, L.; Wang, S.; Li, Y.; Tu, Y.; Zhu, X. “Clicking” graphite oxide sheets with well-defined polystyrenes: A new strategy to control the layer thickness. Polymer 2011, 52, 3046–3052. [Google Scholar] [CrossRef]
- Ma, L.; Yang, X.; Gao, L.; Lu, M.; Guo, C.; Li, Y.; Tu, Y.; Zhu, X. Synthesis and characterization of polymer grafted graphene oxide sheets using a Ce(IV)/HNO3 redox system in an aqueous solution. Carbon 2012, 53, 269–276. [Google Scholar] [CrossRef]
- Rourke, J.P.; Pandey, P.A.; Moore, J.J.; Bates, M.; Kinloch, I.A.; Young, R.J.; Wilson, N.R. The real graphene oxide revealed: Stripping the oxidative debris from the graphene-like sheets. Angew. Chem. 2011, 123, 3231–3235. [Google Scholar] [CrossRef] [Green Version]
- Kim, J.E.; Han, T.H.; Lee, S.H.; Kim, J.Y.; Ahn, C.W.; Yun, J.M.; Kim, S.O. Graphene oxide liquid crystals. Angew. Chem. 2011, 123, 3099–3103. [Google Scholar] [CrossRef]
- Chen, C.; Yang, Q.H.; Yang, Y.; Lv, W.; Wen, Y.; Hou, P.X.; Wang, M.; Cheng, H.-M. Self assembled free-standing graphite oxide membrane. Adv. Mater. 2009, 21, 3007–3011. [Google Scholar] [CrossRef]
- Chua, C.K.; Sofer, Z.; Pumera, M. Graphite oxides: Effects of permanganate and chlorate oxidants on the oxygen composition. Chem. Eur. J. 2012, 18, 13453–13459. [Google Scholar] [CrossRef]
- Szabó, T.; Berkesi, O.; Forgó, P.; Josepovits, K.; Sanakis, Y.; Petridis, D.; Dékány, I. Evolution of surface functional groups in a series of progressively oxidized graphite oxides. Chem. Mater. 2006, 18, 2740–2749. [Google Scholar] [CrossRef]
- Konkena, B.; Vasudevan, S. Glass, gel, and liquid crystals: Arrested states of graphene oxide aqueous dispersions. J. Phys. Chem. C 2014, 118, 21706–21713. [Google Scholar] [CrossRef]
- Bai, H.; Li, C.; Wang, X.; Shi, G. On the gelation of graphene oxide. J. Phys. Chem. C 2011, 115, 5545–5551. [Google Scholar] [CrossRef]
- Naficy, S.; Jalili, R.; Aboutalebi, S.H.; Gorkin, R.A., III; Konstantinov, K.; Innis, P.C.; Spinks, G.M.; Poulin, P.; Wallace, G.G. Graphene oxide dispersions: Tuning rheology to enable fabrication. Mater. Horiz. 2014, 1, 326–331. [Google Scholar] [CrossRef] [Green Version]
- Tesfai, W.; Singh, P.; Shatilla, Y.; Iqbal, M.Z.; Abdala, A.A. Rheology and microstructure of dilute graphene oxide suspension. J. Nanopart. Res. 2013, 15, 1989. [Google Scholar] [CrossRef]
- Vasu, K.S.; Krishnaswamy, R.; Sampath, S.; Sood, A.K. Yield stress, thixotropy and shear banding in a dilute aqueous suspension of few layer graphene oxide platelets. Soft Matter 2013, 9, 5874–5882. [Google Scholar] [CrossRef]
- Giudice, F.D.; Cunning, B.V.; Ruoff, R.S.; Shen, A.Q. Filling the gap between transient and steady shear rheology of aqueous graphene oxide dispersions. Rheol. Acta 2018, 57, 293–306. [Google Scholar] [CrossRef]
- Liu, Y.; Chen, C.; Liu, L.; Zhu, G.; Kong, Q.; Hao, R.; Tan, W. Rheological behavior of high concentrated dispersions of graphite oxide. Soft Mater. 2015, 13, 167–175. [Google Scholar] [CrossRef]
- Xu, Z.; Gao, C. Graphene chiral liquid crystals and macroscopic assembled fibres. Nat. Commun. 2011, 2, 571. [Google Scholar] [CrossRef] [Green Version]
- Ojhaa, A.; Tharejab, P. Electrolyte induced rheological modulation of graphene oxide suspensions and its applications in adsorption. Appl. Surf. Sci. 2018, 435, 786–798. [Google Scholar] [CrossRef]
- Whitby, R.L.; Korobeinyk, A.; Gun’Ko, V.M.; Busquets, R.; Cundy, A.B.; Laszlo, K.; Skubiszewska-Zieba, J.; Leboda, R.; Tombacz, E.; Toth, I.Y.; et al. pH-driven physicochemical conformational changes of single-layer graphene oxide. Chem. Commun. 2011, 47, 9645–9647. [Google Scholar] [CrossRef]
- Xu, Z.; Gao, C. Aqueous liquid crystals of graphene oxide. ACS Nano 2011, 5, 2908–2915. [Google Scholar] [CrossRef] [PubMed]
- Godfrin, M.P.; Guo, F.; Chakraborty, I.; Heeder, N.; Shukla, A.; Bose, A.; Hurt, R.H.; Tripathi, A. Shear-directed assembly of graphene oxide in aqueous dispersions into ordered arrays. Langmuir 2013, 29, 13162–13167. [Google Scholar] [CrossRef] [PubMed]
- García-Tuñon, E.; Barg, S.; Franco, J.; Bell, R.; Eslava, S.; D’Elia, E.; Maher, R.C.; Guitian, F.; Saiz, E. Printing in Three Dimensions with Graphene. Adv. Mater. 2015, 27, 1688–1693. [Google Scholar] [CrossRef] [Green Version]
- Jalili, R.; Aboutalebi, S.H.; Esrafilzadeh, D.; Konstantinov, K.; Razal, J.M.; Moulton, S.E.; Wallace, G.G. Formation and processability of liquid crystalline dispersions of graphene oxide. Mater. Horiz. 2014, 1, 87–91. [Google Scholar] [CrossRef]
- Aboutalebi, S.H.; Chidembo, A.T.; Salari, M.; Konstantinov, K.; Wexler, D.; Liu, H.K.; Dou, S.X. Comparison of GO, GO/MWCNTs composite and MWCNTs as potential electrode materials for supercapacitors. Energy Environ. Sci. 2011, 4, 1855–1865. [Google Scholar] [CrossRef] [Green Version]
- Aboutalebi, S.H.; Gudarzi, M.M.; Zheng, Q.B.; Kim, J.-K. Spontaneous Formation of Liquid Crystals in Ultralarge Graphene Oxide Dispersions. Adv. Funct. Mater. 2011, 21, 2978–2988. [Google Scholar] [CrossRef]
- Singh, V.K.; Cura, M.E.; Liu, X.; Johansson, L.S.; Ge, Y.; Hannula, S.P. Tuning the mechanical and adsorption properties of silica with graphene oxide. Chem. Plus. Chem. 2014, 79, 1512–1522. [Google Scholar] [CrossRef]
- Kumar, P.; Maiti, U.N.; Lee, K.E.; Kim, S.O. Rheological properties of graphene oxide liquid crystal. Carbon 2014, 80, 453–461. [Google Scholar] [CrossRef]
- Vallés, C.; Young, R.J.; Lomax, D.J.; Kinloch, I.A. The rheological behavior of concentrated dispersions of graphene oxide. J. Mater. Sci. 2014, 49, 6311–6320. [Google Scholar] [CrossRef] [Green Version]
- Segal, M. Selling graphene by the ton. Nat. Nanotechnol. 2009, 4, 611–613. [Google Scholar] [CrossRef]
- Yang, X.; Guo, C.; Ji, L.; Li, Y.; Tu, Y. Liquid crystalline and shear-induced properties of an aqueous solution of graphene oxide sheets. Langmuir 2013, 29, 8103–8107. [Google Scholar] [CrossRef] [PubMed]
- Akbari, A.; Sheath, P.; Martin, S.T.; Shinde, D.B.; Shaibani, M.; Banerjee, P.C.; Tkacz, R.; Bhattacharyya, D.; Majumder, M. Large-area graphene-based nanofiltration membranes by shear alignment of discotic nematic liquid crystals of graphene oxide. Nat. Commun. 2016, 7, 10891. [Google Scholar] [CrossRef]
- Ling, S.; Kang, W.; Tao, S.; Zhang, C. Highly concentrated graphene oxide ink for facile 3D printing of supercapacitors. Nano Mater. Sci. 2019, 1, 142–148. [Google Scholar] [CrossRef]
- Kim, S.; Zhou, S.; Hu, Y.; Acik, M.; Chabal, Y.J.; Berger, C.; de Heer, W.; Bongiorno, A.; Riedo, E. Room-temperature metastability of multilayer graphene oxide films. Nat. Mater. 2012, 11, 544–549. [Google Scholar] [CrossRef]
- Li, C.; Lu, Y.; Yan, J.; Yu, W.; Zhao, R.; Du, S.; Niu, K. Effect of long-term ageing on graphene oxide: Structure and thermal decomposition. R. Soc. Open Sci. 2021, 8, 202309. [Google Scholar] [CrossRef] [PubMed]
- Titelman, G.I.; Gelman, V.; Bron, S.; Khalfin, R.L.; Cohen, Y.; Bianco-Peled, H. Characteristics and microstructure of aqueous colloidal dispersions of graphite oxide. Carbon 2005, 43, 641–649. [Google Scholar] [CrossRef]
- Dimiev, A.M.; Alemany, L.B.; Tour, J.M. Graphene Oxide. Origin of Acidity, Its Instability in Water, and a New Dynamic Structural Model. ACS Nano 2013, 7, 576–588. [Google Scholar] [CrossRef]
- Du, W.; Wu, M.; Zhang, M.; Xu, G.; Gao, T.; Qian, L.; Yu, X.; Chi, F.; Li, C.; Shi, G. Organic dispersions of graphene oxide with arbitrary concentrations and improved chemical stability. Chem. Commun. 2017, 53, 11005–11007. [Google Scholar] [CrossRef] [Green Version]
- Chlanda, A.; Kowiorski, K.; Małek, M.; Kijeńska-Gawrońska, E.; Bil, M.; Djas, M.; Strachowski, T.; Swieszkowski, W.; Lipińska, L. Morphology and Chemical Purity of Water Suspension of Graphene Oxide FLAKES Aged for 14 Months in Ambient Conditions. A Preliminary Study. Materials 2021, 14, 4108. [Google Scholar] [CrossRef]
- Giudice, F.D.; Shen, A.Q. Shear rheology of GO dispersion. Curr. Opin. Chem. Eng. 2017, 16, 23–30. [Google Scholar] [CrossRef]
- Cançado, L.G.; Takai, K.; Enoki, T. General equation for the determination of the crystallite size La of nanographite by Raman spectroscopy. Appl. Phys. Lett. 2006, 88, 163106. [Google Scholar] [CrossRef]
- Ewoldt, R.H.; Johnston, M.T.; Caretta, L.M. Experimental Challenges of Shear Rheology: How to Avoid Bad Data. In Complex Fluids in Biological Systems: Experiment, Theory, and Computation; Spagnolie, S.E., Ed.; Springer: New York, NY, USA, 2015; pp. 207–241. [Google Scholar]
- Iakunkov, A.; Sun, J.; Rebrikova, A.; Korobov, M.; Klechikov, A.; Vorobiev, A.; Boulanger, N.; Talyzin, A.V. Swelling of graphene oxide membranes in alcohols: Effects of molecule size and air ageing. J. Mater. Chem. A 2019, 7, 11331–11337. [Google Scholar] [CrossRef] [Green Version]
- Paudics, A.; Farah, S.; Bertóti, I.; Farkas, A.; László, K.; Mohai, M.; Safran, G.; Szilagyi, A.; Kubinyi, M. Fluorescence probing of binding sites on graphene oxide nanosheets with Oxazine 1 dye. Appl. Surf. Sci. 2021, 541, 148451. [Google Scholar] [CrossRef]
- Cuesta, A.; Dhamelincourt, P.; Laureyns, J.; Martínez-Alonso, A.; Tascón, J.M.D. Raman microprobe studies on carbon materials. Carbon 1994, 32, 1523–1532. [Google Scholar] [CrossRef]
- Claramunt, S.; Varea, A.; López-Díaz, D.; Velázquez, M.M.; Cornet, A.; Cirera, A. The importance of interbands on the interpretation of the Raman spectrum of graphene oxide. J. Phys. Chem. C 2015, 119, 10123–10129. [Google Scholar] [CrossRef]
- Vollebregt, S.; Ishihara, R.; Tichelaar, F.D.; Hou, Y.; Beenakker, C.I.M. Influence of the growth temperature on the first and second-order Raman band ratios and widths of carbon nanotubes and fibers. Carbon 2012, 50, 3542–3554. [Google Scholar] [CrossRef]
- Akhavan, O. Bacteriorhodopsin as a superior substitute for hydrazine in chemical reduction of single-layer graphene oxide sheets. Carbon 2015, 81, 158–166. [Google Scholar] [CrossRef]
- Tkacz, R.; Oldenbourg, R.; Mehta, S.B.; Miansari, M.; Verma, A.; Majumder, M. pH dependent isotropic to nematic phase transitions in graphene oxide dispersions reveal droplet liquid crystalline phases. Chem. Commun. 2014, 50, 6668–6671. [Google Scholar] [CrossRef] [Green Version]
- Mewis, J.; Wagner, N.J. Colloidal Suspension Rheology; Cambridge University Press: Cambridge, UK, 2012. [Google Scholar]
- Bonn, D.; Tanase, S.; Abou, B.; Tanaka, H.; Meunier, J. Laponite: Aging and shear rejuvenation of a colloidal glass. Phys. Rev. Lett. 2002, 89, 015701. [Google Scholar] [CrossRef]
- Talyzin, A.V.; Hausmaninger, T.; You, S.; Szabó, T. The structure of graphene oxide membranes in liquid water, ethanol and water–ethanol mixtures. Nanoscale 2014, 6, 272–281. [Google Scholar] [CrossRef] [Green Version]
- Angelini, R.; Zaccarelli, E.; de Melo Marques, F.A.; Sztucki, M.; Fluerasu, A.; Ruocco, G.; Ruzicka, B. Glass–glass transition during aging of a colloidal clay. Nat. Commun. 2014, 5, 4049. [Google Scholar] [CrossRef] [PubMed] [Green Version]
- Shahin, A.; Joshi, Y.M. Physicochemical Effects in Aging Aqueous Laponite Suspensions. Langmuir 2012, 28, 5674. [Google Scholar] [CrossRef] [PubMed]
- López-Diaz, D.; Hidalgo, M.L.; Garcia-Fierro, J.L.; Velázques, M.M. Evolution of the Raman spectrum with the chemical composition of graphene oxide. J. Phys. Chem. C 2011, 121, 20489–20497. [Google Scholar] [CrossRef]
- Beny-Bassez, C.; Rouzaud, J.N. Characterization of carbonaceous materials by correlated electron and optical microscopy and Raman microspectroscopy. Scanning Electron. Microsc. 1985, 1, 119–132. [Google Scholar]
- Cuesta, A.; Dhamelincourt, P.; Laureyns, J.; Martinez-Alonso, A.; Tascon, J.M.D. Comparative performance of X-ray diffraction and Raman microprobe. J. Mater. Chem. 1998, 8, 2875–2879. [Google Scholar] [CrossRef]
- Bertóti, I.; Mohai, M.; László, K. Surface modification of graphene and HOPG by nitrogen plasma: Quantitative XPS analysis of chemical state alterations. Carbon 2015, 84, 185–196. [Google Scholar] [CrossRef] [Green Version]


| Dataset | τ0 | k | n | R2 |
|---|---|---|---|---|
| (Pa) | (Pa·s) | |||
| 1 | 14 ± 1 | 8 ± 0 | 0.49 ± 0.01 | 0.9996 |
| 2 | 19 ± 0 | 8 ± 0 | 0.50 ± 0.00 | 0.9999 |
| 3 | 20 ± 0 | 9 ± 0 | 0.49 ± 0.00 | 0.9999 |
| Peak Position | FWHM | d | Lc | Nc | |
|---|---|---|---|---|---|
| (001) | (001) | ||||
| (Degree) | (nm) | ||||
| Before shearing | 11.5 | 0.65 | 0.77 | 12.8 | 17 |
| After shearing | 10.7 | 1.07 | 0.83 | 7.7 | 9 |
| Age of Sample | Parameters of HB Model * | Dynamic Flow Stress | |||
|---|---|---|---|---|---|
| τ0 | k | n | R2 | ||
| (y) | (Pa) | (Pa·s) | Pa | ||
| 0 | 14 ± 1 | 8 ± 0 | 0.49 ± 0.01 | 0.9996 | 50.4 |
| 19 ± 0 | 8 ± 0 | 0.50 ± 0.00 | 0.9999 | 42.1 | |
| 20 ± 0 | 9 ± 0 | 0.49 ± 0.00 | 0.9999 | 46.6 | |
| 1 | 32 ± 1 | 22 ± 0 | 0.49 ± 0.00 | 0.9998 | 57.9 |
| 33 ± 0 | 14 ± 0 | 0.50 ± 0.00 | 0.9997 | 68.5 | |
| 39 ± 1 | 15 ± 1 | 0.51 ± 0.01 | 0.9986 | 74.5 | |
| 2 | 27 ± 1 | 16 ± 1 | 0.43 ± 0.01 | 0.9993 | 93.7 |
| 35 ± 1 | 20 ± 0 | 0.47 ± 0.00 | 0.9997 | 115 | |
| 38 ± 1 | 18 ± 1 | 0.48 ± 0.01 | 0.9996 | 103 | |
| Age of Sample | k |
|---|---|
| (y) | (Pa·s) |
| 0 | 11 ± 0 |
| 14 ± 1 | |
| 15 ± 1 | |
| 1 | 35 ± 1 |
| 24 ± 1 | |
| 27 ± 1 | |
| 2 | 26 ± 1 |
| 34 ± 1 | |
| 30 ± 0 |
| Characteristics | Unit | Before | After | |||||
|---|---|---|---|---|---|---|---|---|
| Shearing | ||||||||
| 0 y | 1 y | 2 y | 0 y | 1 y | 2 y | |||
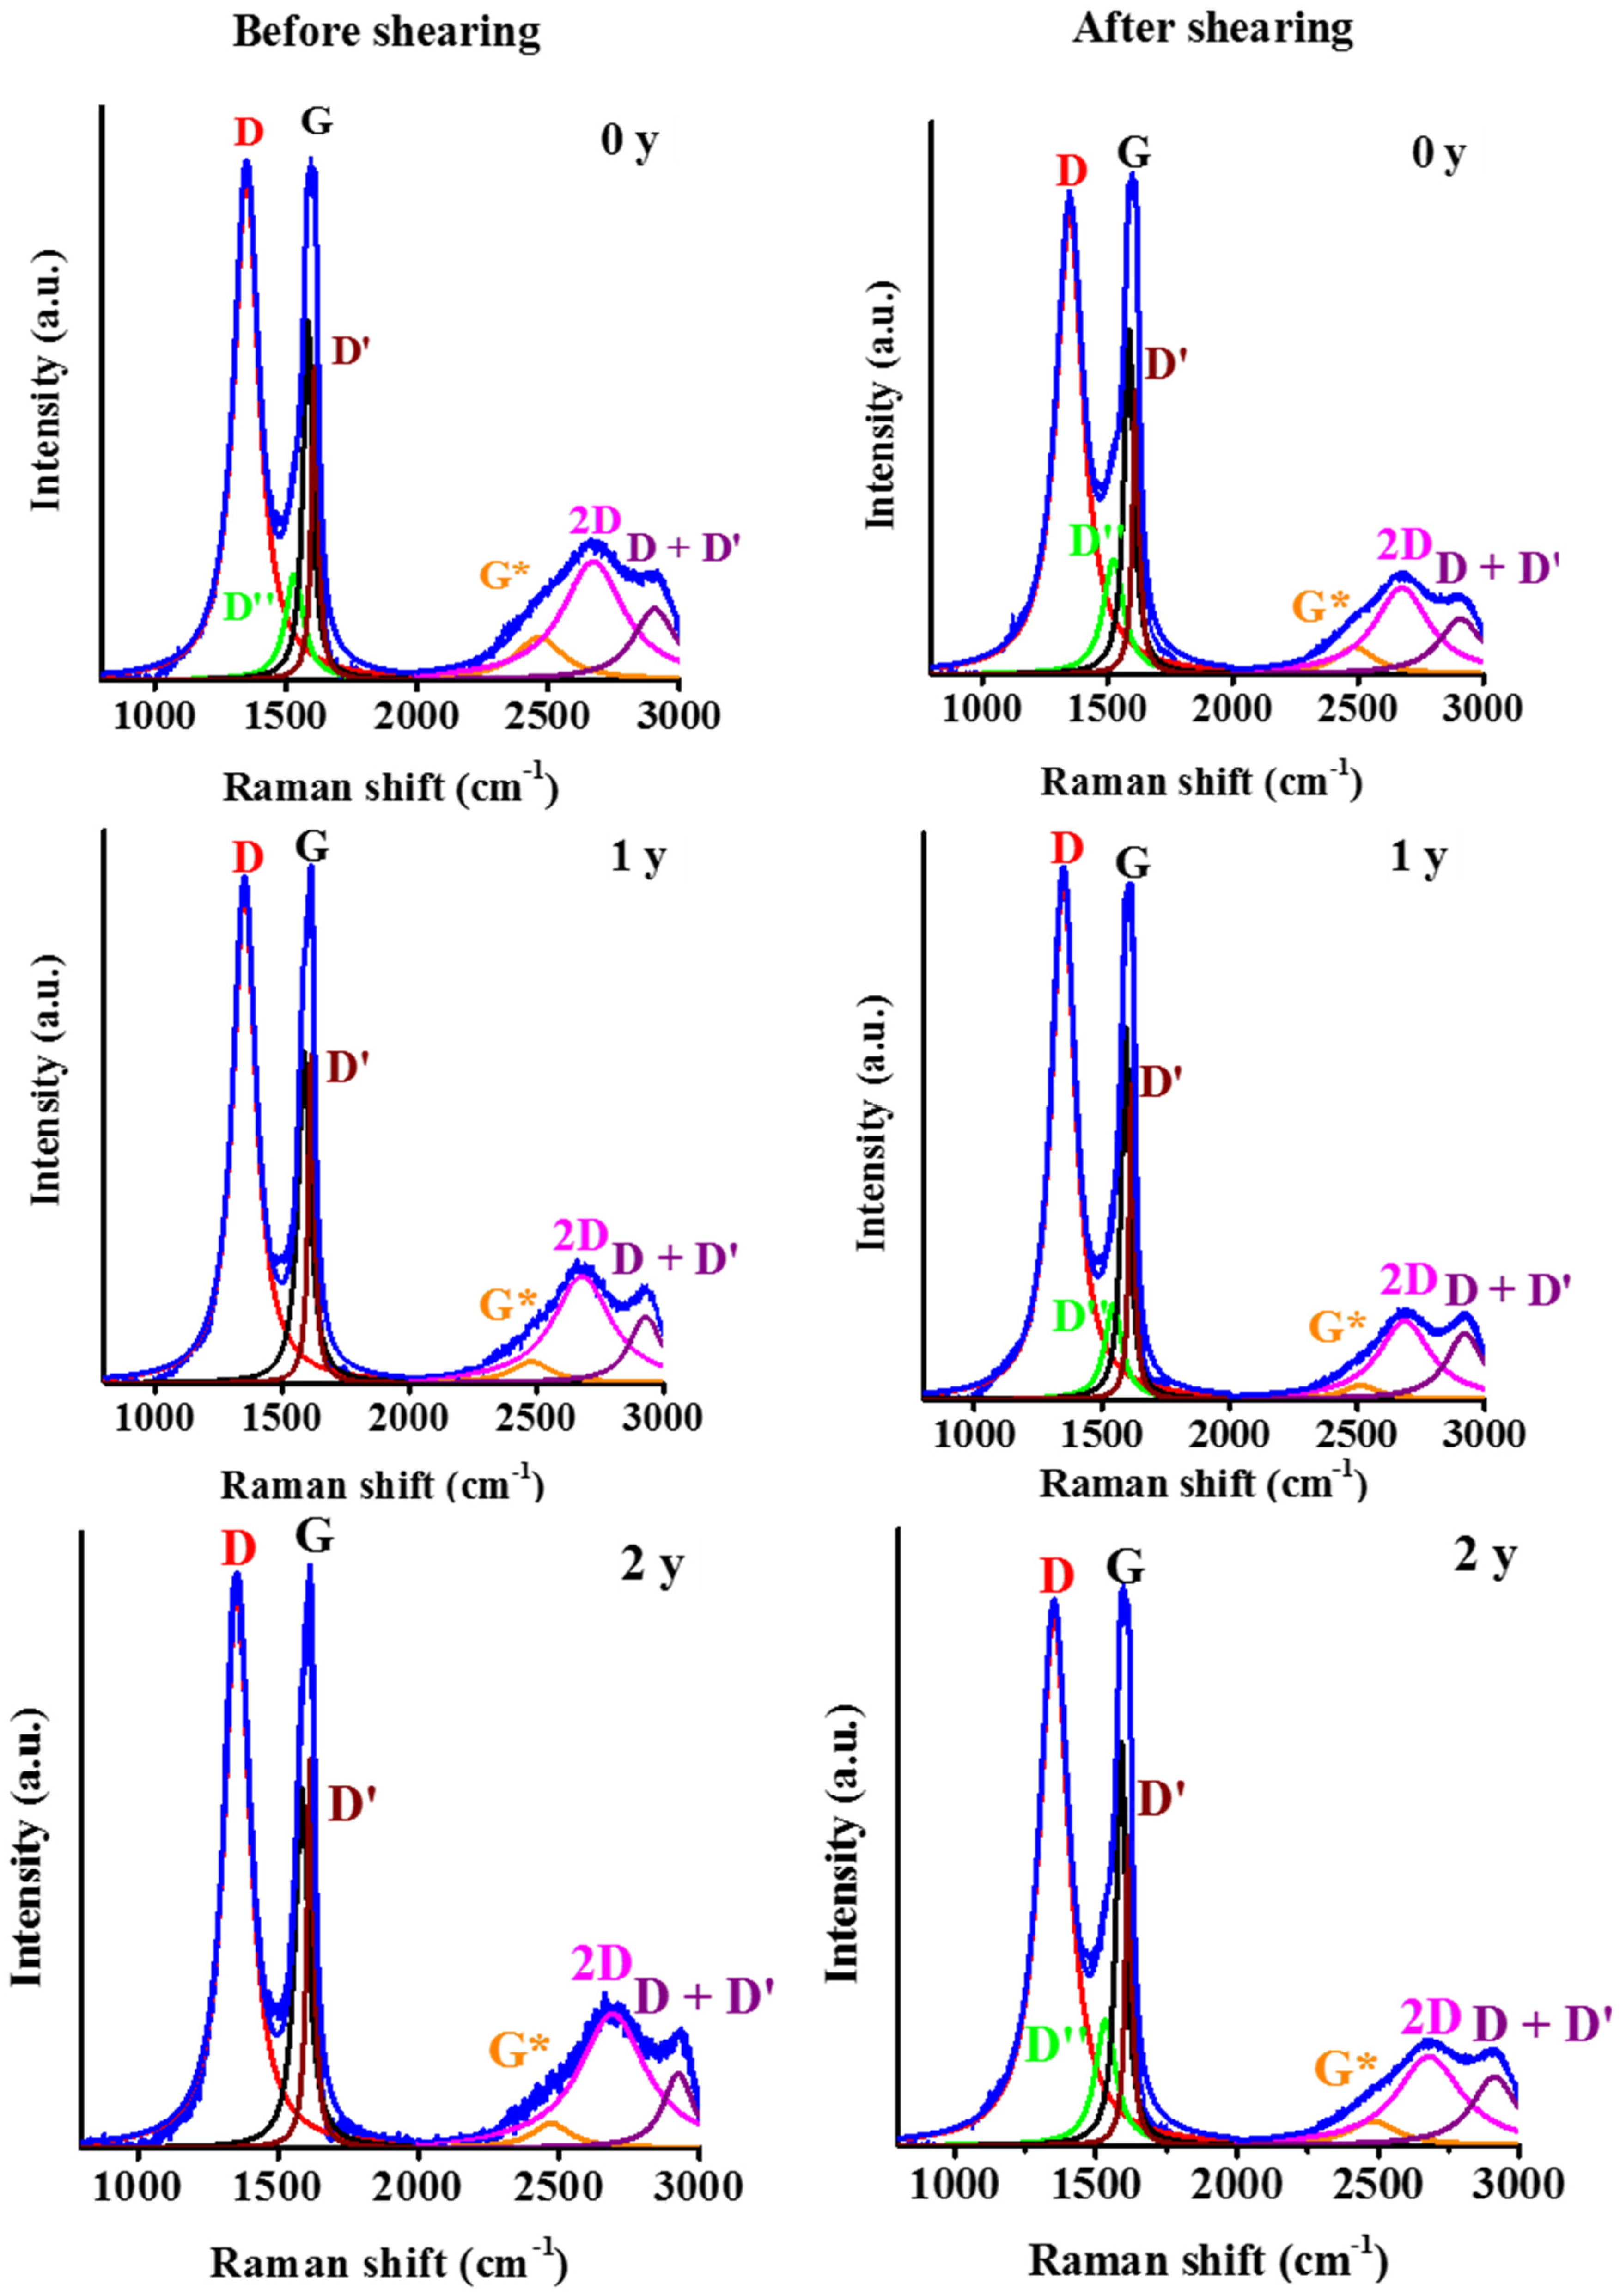
| Position | D | cm−1 | 1350 ± 1 | 1351 ± 0 | 1354 ± 0 | 1350 ± 1 | 1348 ± 0 | 1350 ± 1 |
| D″ | 1538 ± 1 | - | - | 1528 ± 2 | 1541 ± 2 | 1535 ± 0 | ||
| G | 1585 ± 0 | 1585 ± 1 | 1584 ± 1 | 1587 ± 1 | 1592 ± 0 | 1589 ± 1 | ||
| D′ | 1611 ± 0 | 1615 ± 0 | 1615 ± 0 | 1616 ± 1 | 1617 ± 0 | 1616 ± 1 | ||
| G * | 2465 ± 1 | 2486 ± 9 | 2473 ± 6 | 2475 ± 18 | 2519 ± 18 | 2486 ± 12 | ||
| 2D | 2671 ± 1 | 2680 ± 1 | 2688 ± 4 | 2673 ± 2 | 2686 ± 4 | 2681 ± 2 | ||
| D + D′ | 2905 ± 1 | 2929 ± 3 | 2921 ± 3 | 2911 ± 2 | 2921 ± 2 | 2911 ± 2 | ||
| ID/IG | - | 1.40 ± 0.00 | 1.53 ± 0.02 | 1.57 ± 0.02 | 1.35 ± 0.07 | 1.42 ± 0.02 | 1.33 ± 0.03 | |
| ID″/IG | - | 0.30 ± 0.00 | - | - | 0.30 ± 0.00 | 0.25 ± 0.02 | 0.32 ± 0.02 | |
| I2D/IG | - | 0.31 ± 0.03 | 0.30 ± 0.03 | 0.41 ± 0.04 | 0.23 ± 0.03 | 0.19 ± 0.02 | 0.22 ± 0.02 | |
| La * | nm | 13.7 ± 0.00 | 12.6 ± 0.1 | 12.2 ± 0.2 | 14.3 ± 0.8 | 13.6 ± 0.2 | 14.5 ± 0.3 | |
Publisher’s Note: MDPI stays neutral with regard to jurisdictional claims in published maps and institutional affiliations. |
© 2022 by the authors. Licensee MDPI, Basel, Switzerland. This article is an open access article distributed under the terms and conditions of the Creative Commons Attribution (CC BY) license (https://creativecommons.org/licenses/by/4.0/).
Share and Cite
Gyarmati, B.; Farah, S.; Farkas, A.; Sáfrán, G.; Voelker-Pop, L.M.; László, K. Long-Term Aging of Concentrated Aqueous Graphene Oxide Suspensions Seen by Rheology and Raman Spectroscopy. Nanomaterials 2022, 12, 916. https://doi.org/10.3390/nano12060916
Gyarmati B, Farah S, Farkas A, Sáfrán G, Voelker-Pop LM, László K. Long-Term Aging of Concentrated Aqueous Graphene Oxide Suspensions Seen by Rheology and Raman Spectroscopy. Nanomaterials. 2022; 12(6):916. https://doi.org/10.3390/nano12060916
Chicago/Turabian StyleGyarmati, Benjámin, Shereen Farah, Attila Farkas, György Sáfrán, Loredana Mirela Voelker-Pop, and Krisztina László. 2022. "Long-Term Aging of Concentrated Aqueous Graphene Oxide Suspensions Seen by Rheology and Raman Spectroscopy" Nanomaterials 12, no. 6: 916. https://doi.org/10.3390/nano12060916
APA StyleGyarmati, B., Farah, S., Farkas, A., Sáfrán, G., Voelker-Pop, L. M., & László, K. (2022). Long-Term Aging of Concentrated Aqueous Graphene Oxide Suspensions Seen by Rheology and Raman Spectroscopy. Nanomaterials, 12(6), 916. https://doi.org/10.3390/nano12060916