Figure 1.
Synthesis process schematic representation. Each procedure is being separately described below.
Figure 1.
Synthesis process schematic representation. Each procedure is being separately described below.
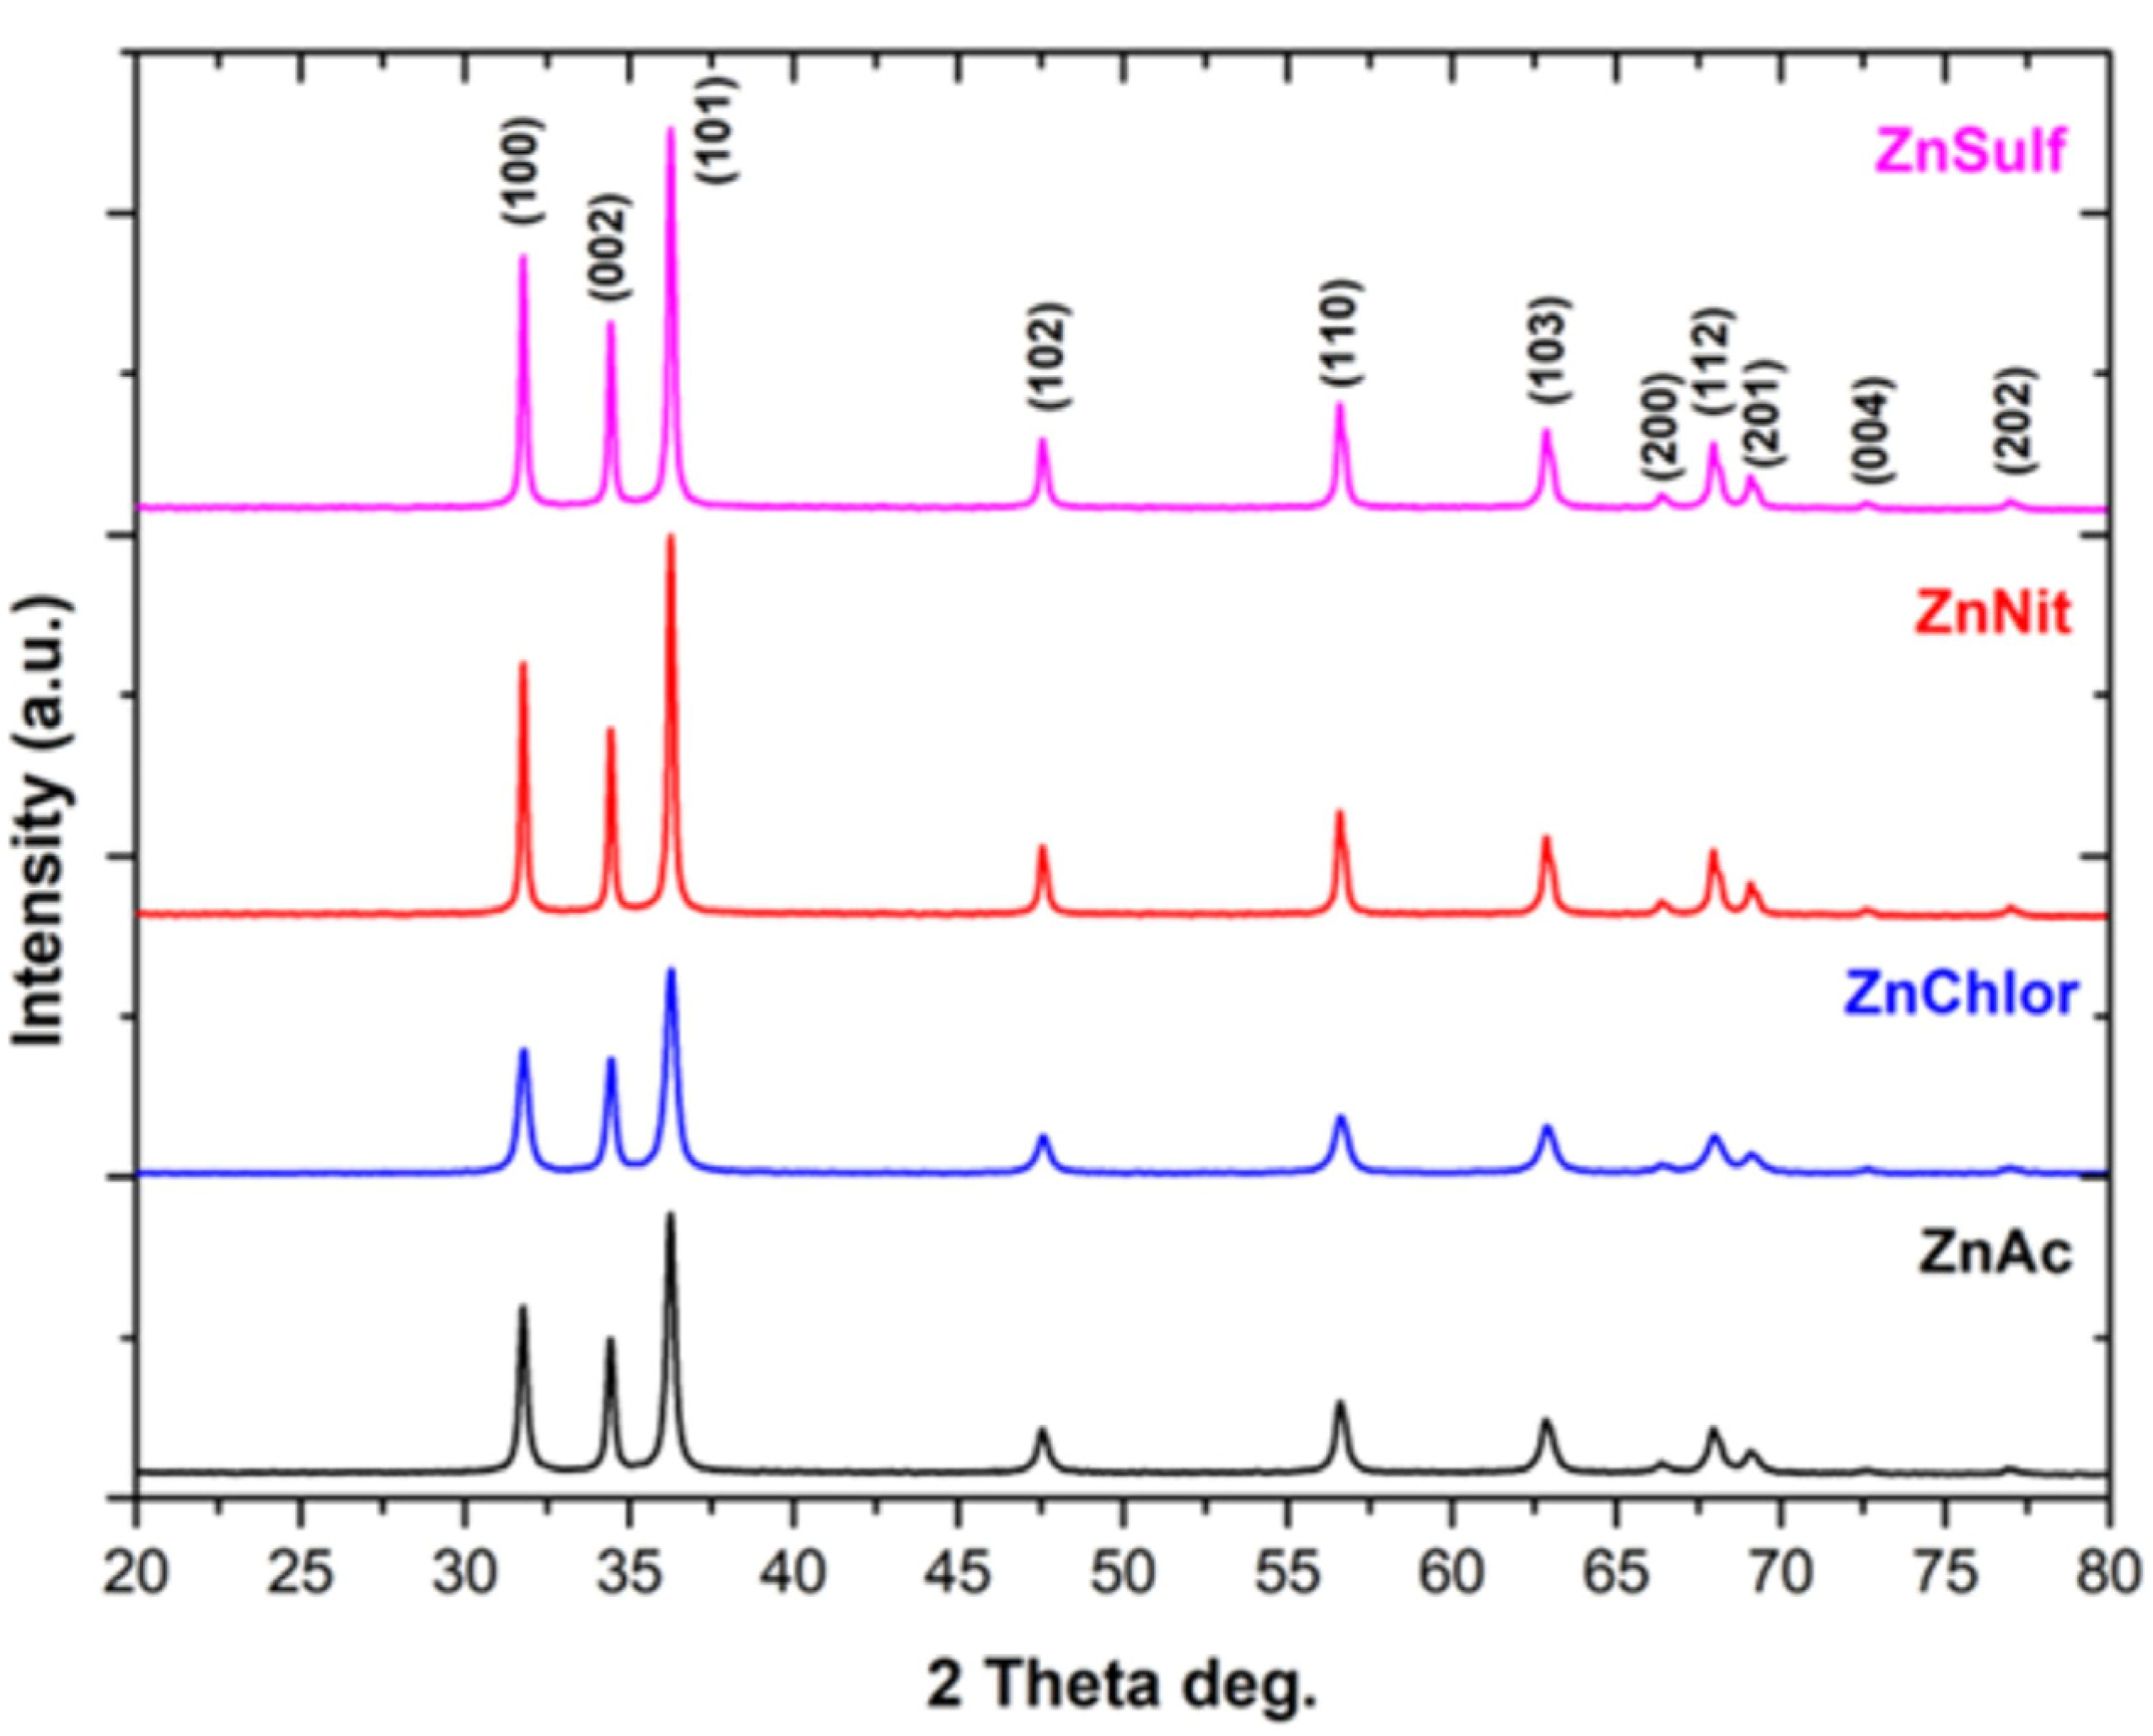
Figure 2.
XRD diffractograms of ZnO nanoparticles, synthesized using as precursor zinc acetate dehydrate (in black) (ZnAc), zinc chloride (in blue) (ZnChlor), zinc nitrate hexahydrate (in red) (ZnNit), and zinc sulphate heptahydrate (in purple) (ZnSulf).
Figure 2.
XRD diffractograms of ZnO nanoparticles, synthesized using as precursor zinc acetate dehydrate (in black) (ZnAc), zinc chloride (in blue) (ZnChlor), zinc nitrate hexahydrate (in red) (ZnNit), and zinc sulphate heptahydrate (in purple) (ZnSulf).
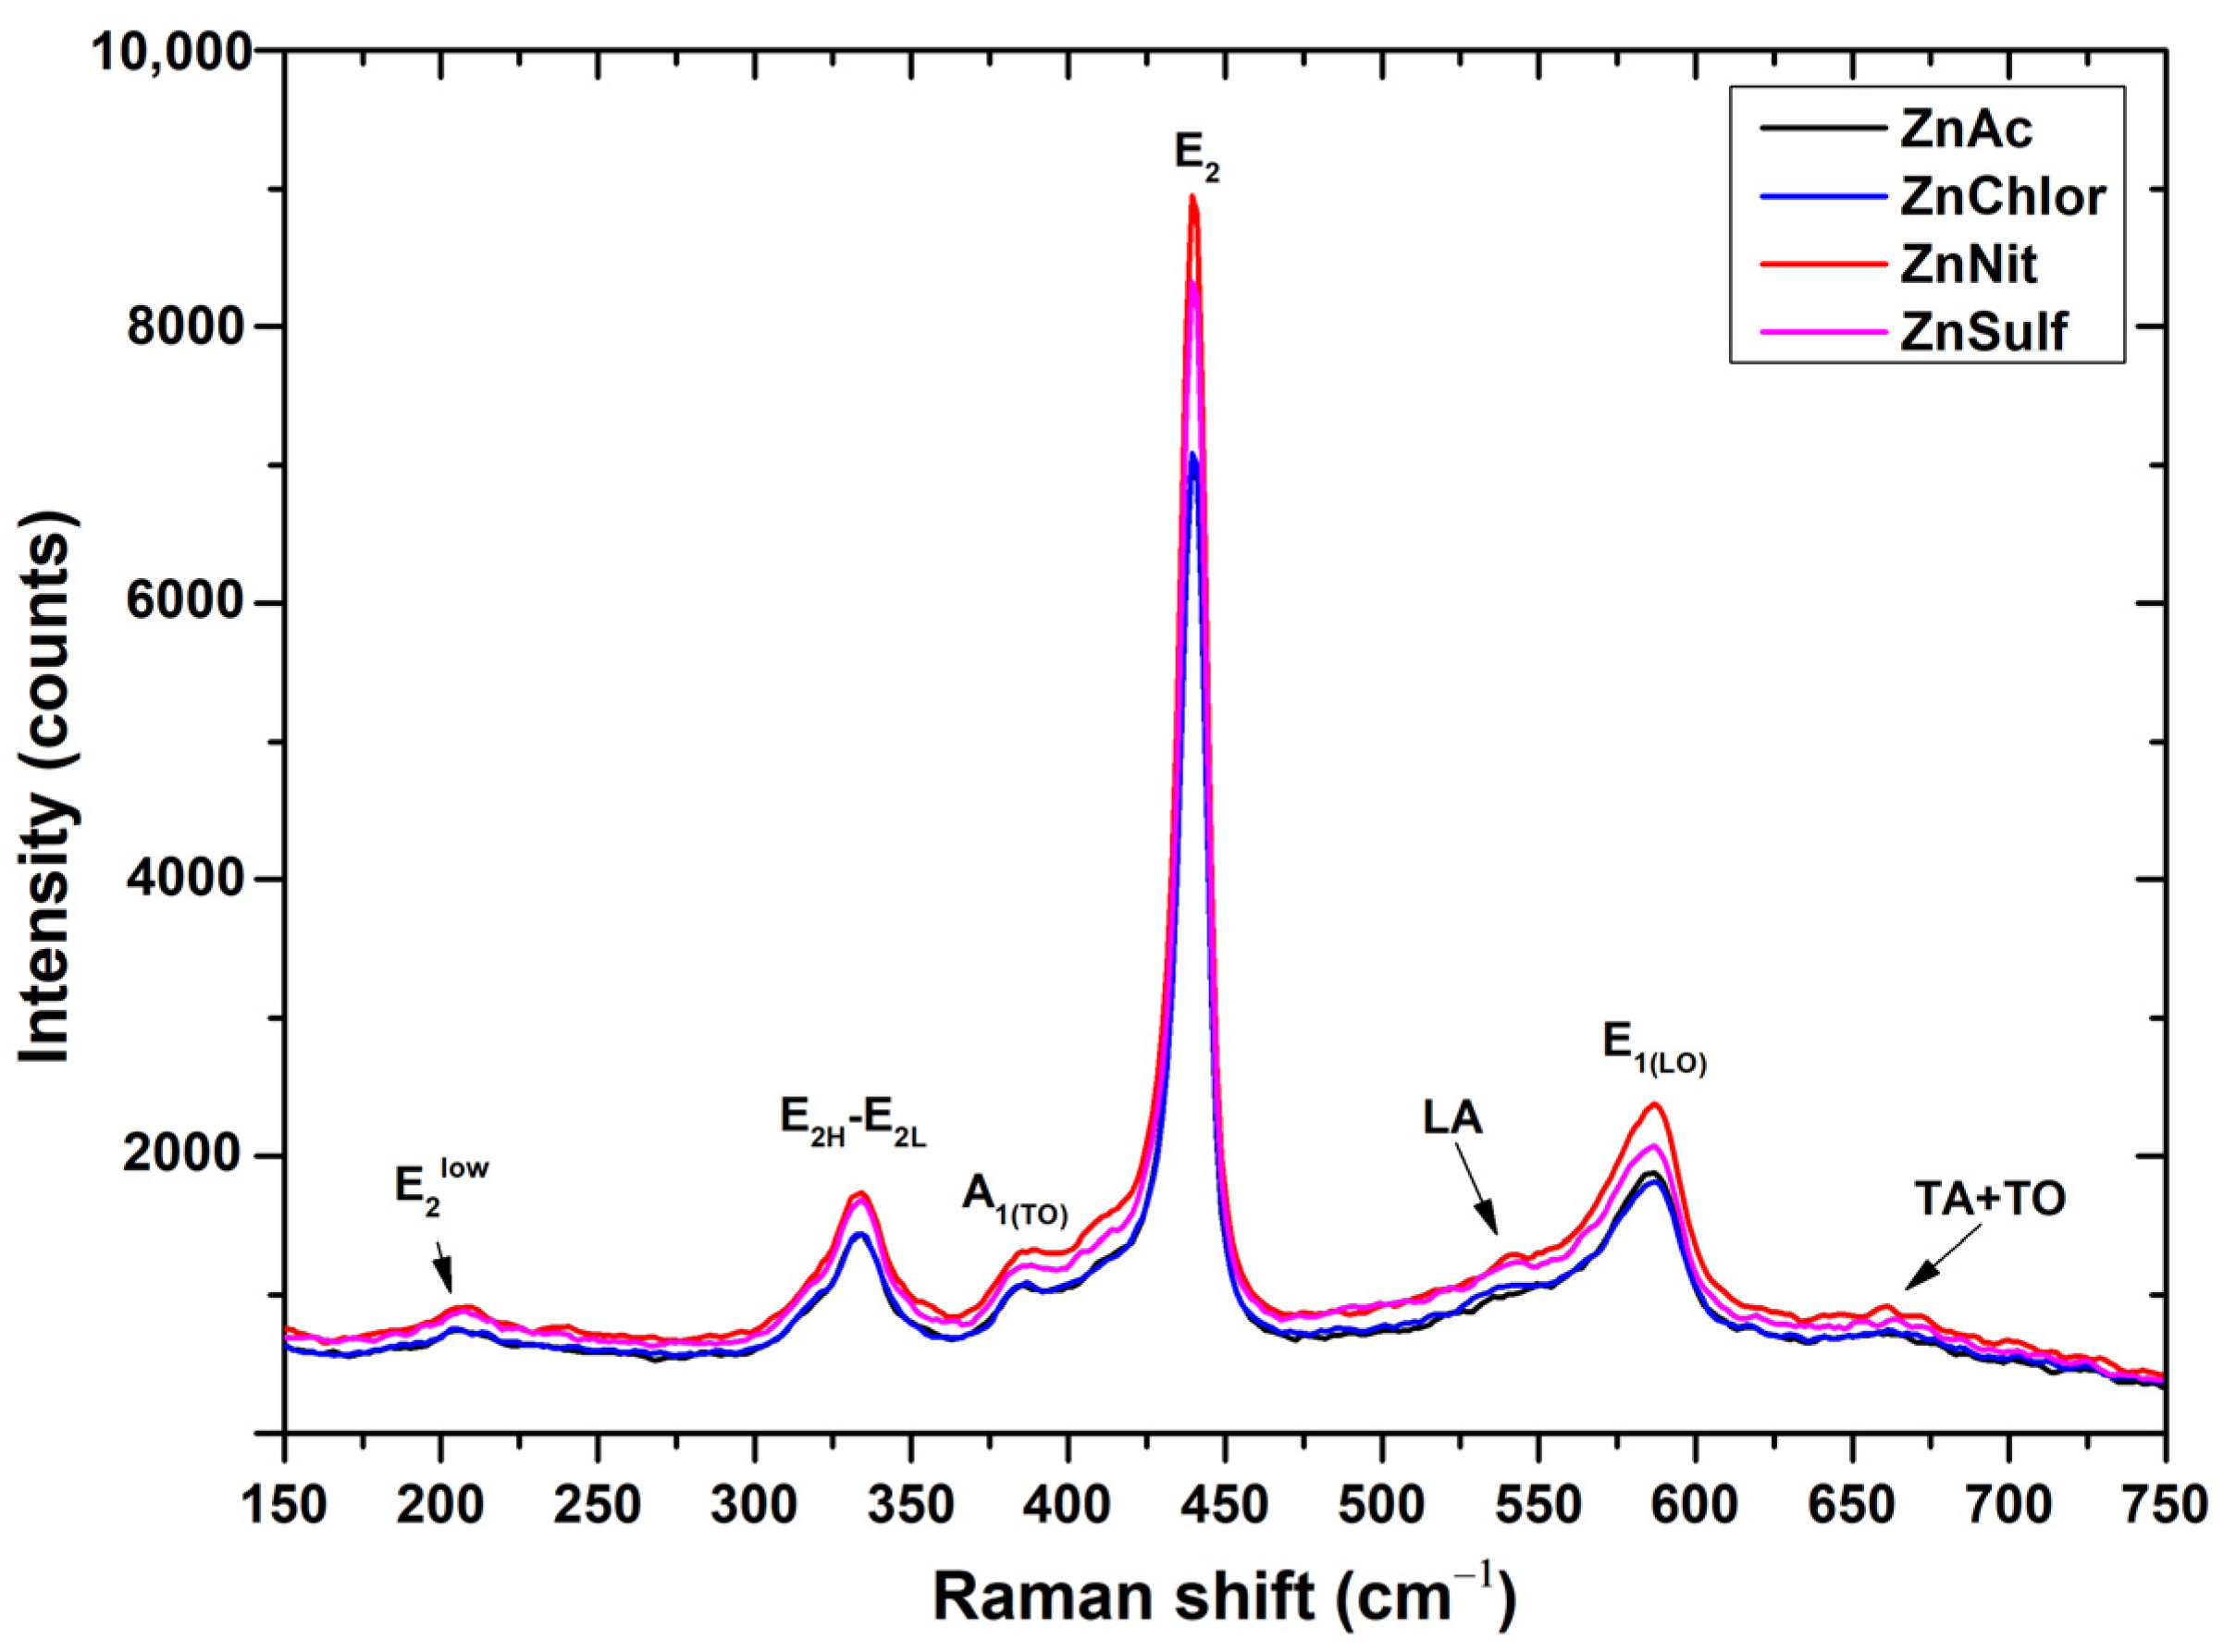
Figure 3.
Raman spectra of ZnO nanoparticles, synthesized using as precursor zinc acetate dehydrate (in black) (ZnAc), zinc chloride (in blue) (ZnChlor), zinc nitrate hexahydrate (in red) (ZnNit), and zinc sulphate heptahydrate (in purple) (ZnSulf).
Figure 3.
Raman spectra of ZnO nanoparticles, synthesized using as precursor zinc acetate dehydrate (in black) (ZnAc), zinc chloride (in blue) (ZnChlor), zinc nitrate hexahydrate (in red) (ZnNit), and zinc sulphate heptahydrate (in purple) (ZnSulf).
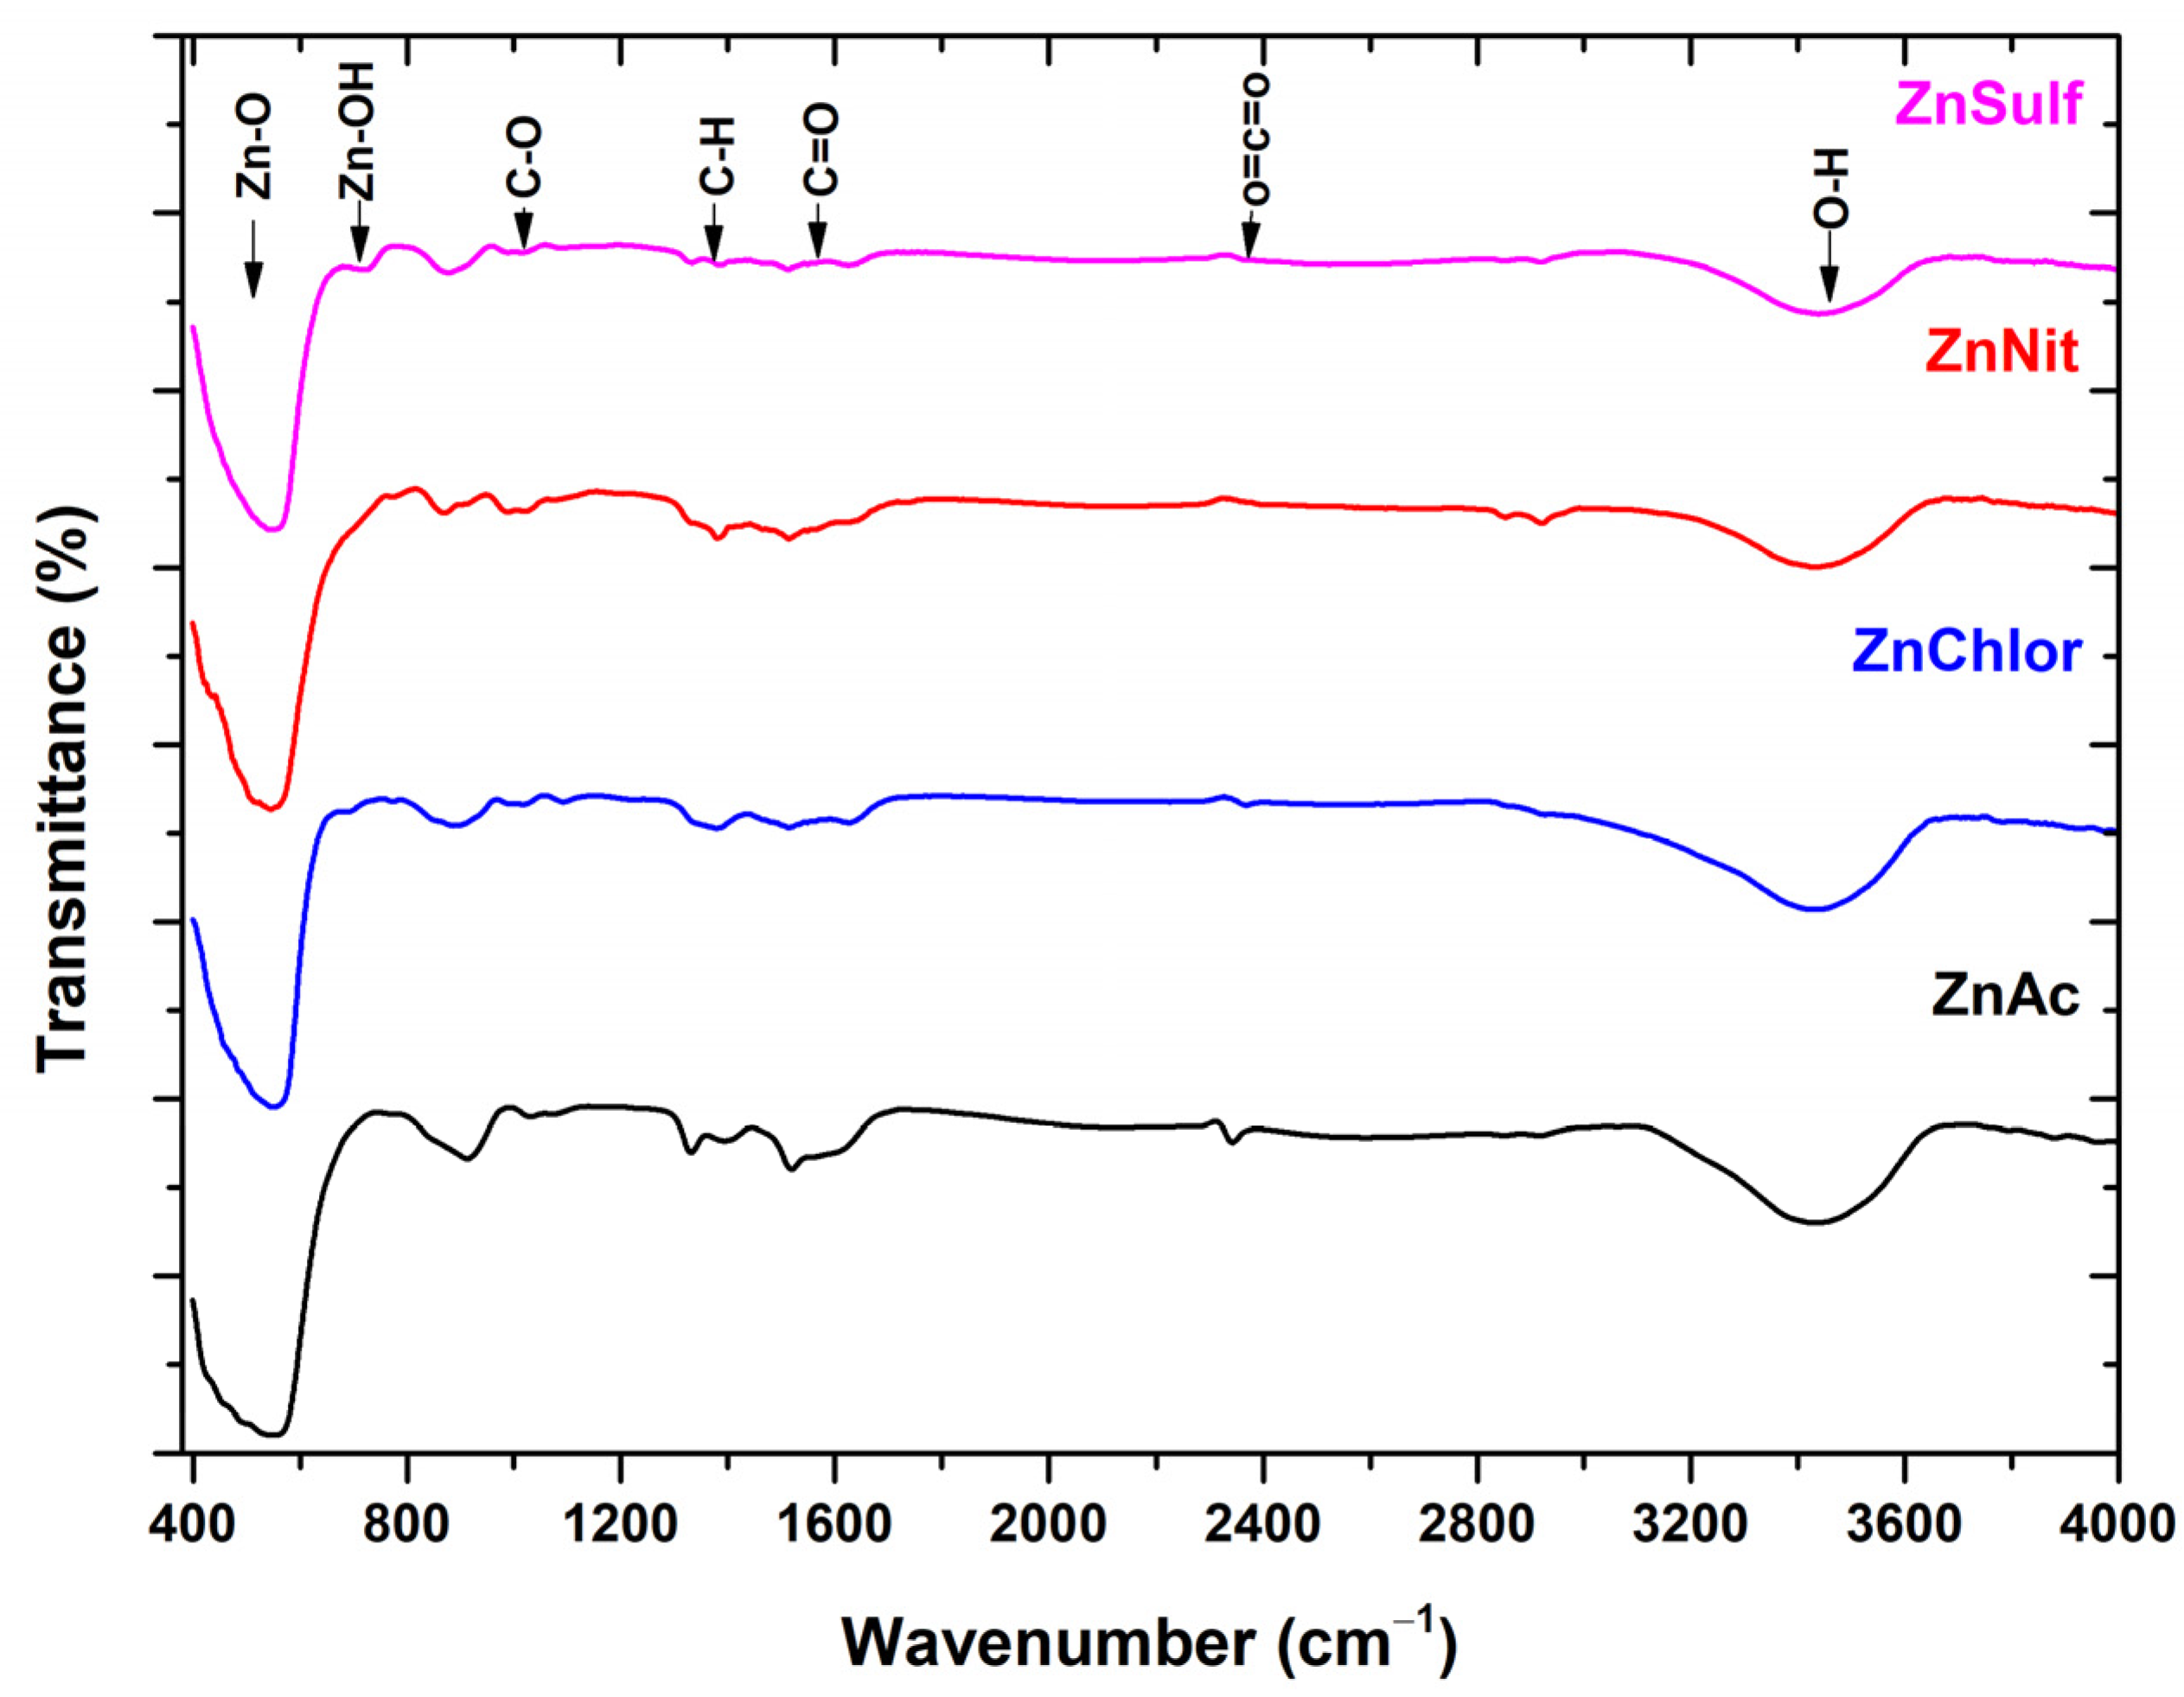
Figure 4.
FT-IR spectra of ZnO nanoparticles, synthesized using as precursor zinc acetate dehydrate (ZnAc) (in black), zinc nitrate hexahydrate (ZnNit) (in red), zinc chloride (ZnChlor) (in blue), zinc sulphate heptahydrate (ZnSulf) (in purple).
Figure 4.
FT-IR spectra of ZnO nanoparticles, synthesized using as precursor zinc acetate dehydrate (ZnAc) (in black), zinc nitrate hexahydrate (ZnNit) (in red), zinc chloride (ZnChlor) (in blue), zinc sulphate heptahydrate (ZnSulf) (in purple).
Figure 5.
N2-isotherms for the ZnO nanoparticles, structured from all four precursors: (a) zinc acetate dehydrate (ZnAc), (b) zinc nitrate hexahydrate (ZnNit), (c) zinc chloride (ZnChlor), and (d) zinc sulphate heptahydrate (ZnSulf).
Figure 5.
N2-isotherms for the ZnO nanoparticles, structured from all four precursors: (a) zinc acetate dehydrate (ZnAc), (b) zinc nitrate hexahydrate (ZnNit), (c) zinc chloride (ZnChlor), and (d) zinc sulphate heptahydrate (ZnSulf).
Figure 6.
Size distribution diagram for the sample prepared from: (a) zinc acetate, (b) zinc nitrate, (c) zinc chloride, (d) zinc sulfate.
Figure 6.
Size distribution diagram for the sample prepared from: (a) zinc acetate, (b) zinc nitrate, (c) zinc chloride, (d) zinc sulfate.
Figure 7.
(a) F(R) reflectance as a function of the wavelength for the ZnO nanoparticles, structured from all four precursors (zinc acetate dehydrate (ZnAc), zinc nitrate hexahydrate (ZnNit), zinc chloride (ZnChlor), zinc sulphate heptahydrate (ZnSulf)). (b) Energy band gap of the same samples.
Figure 7.
(a) F(R) reflectance as a function of the wavelength for the ZnO nanoparticles, structured from all four precursors (zinc acetate dehydrate (ZnAc), zinc nitrate hexahydrate (ZnNit), zinc chloride (ZnChlor), zinc sulphate heptahydrate (ZnSulf)). (b) Energy band gap of the same samples.
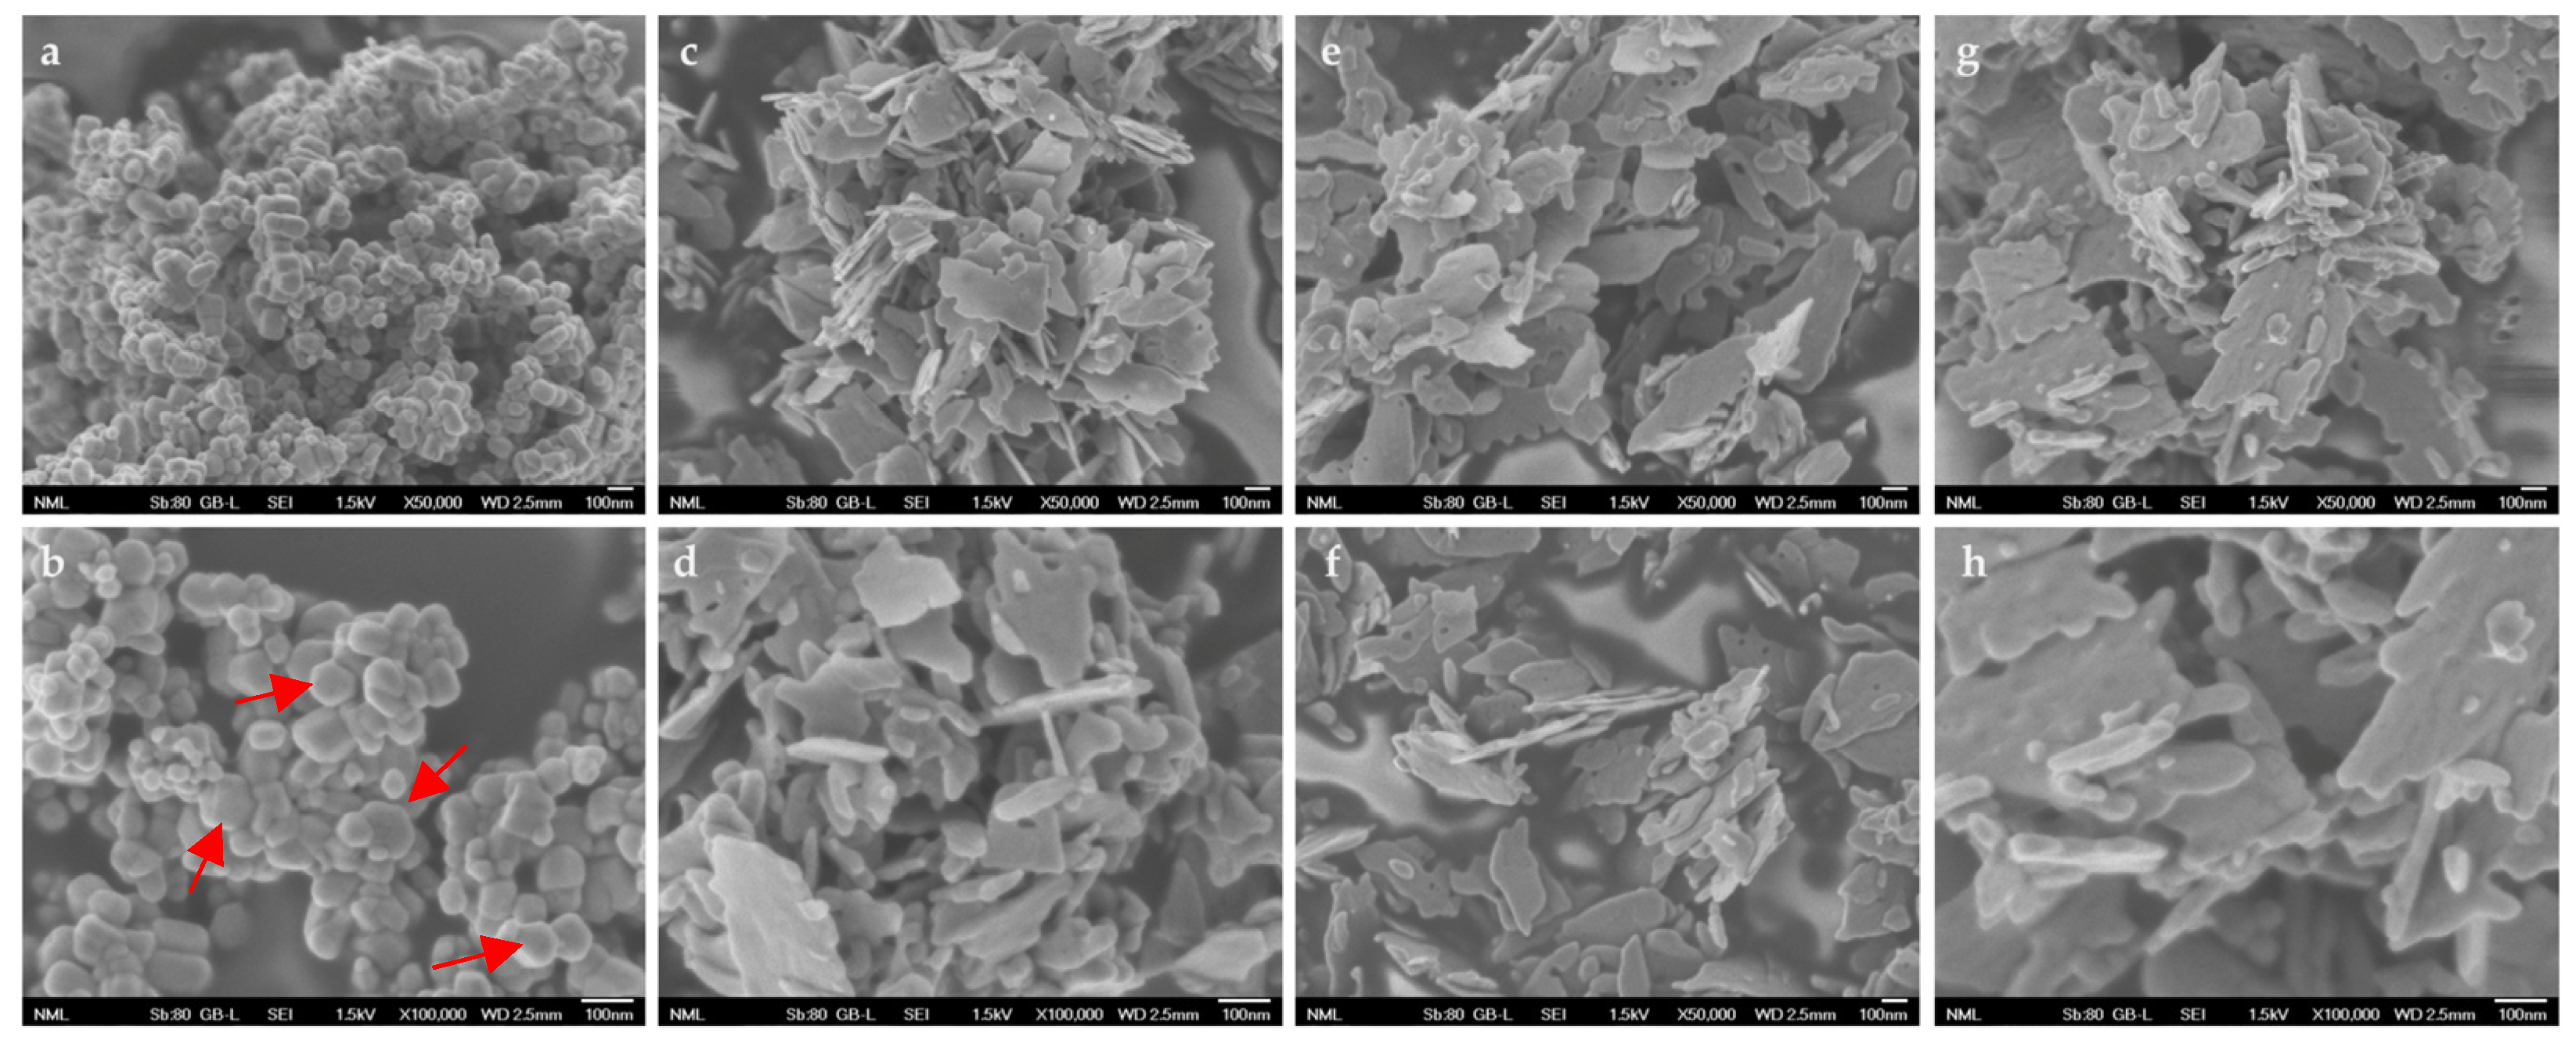
Figure 8.
Representative FESEM images of produced ΖnO type particles prepared from: (a) zinc acetate (×50,000), (b) zinc acetate (×100,000), (c) zinc chloride (×50,000), (d) zinc chloride (×100,000), (e) zinc nitrate (×50,000), (f) zinc nitrate (×100,000), (g) zinc sulfate (×50,000), and (h) zinc sulfate (×100,000). Red arrows are used in order to point out some of the hexagonal-shaped particles in the case of ZnAc.
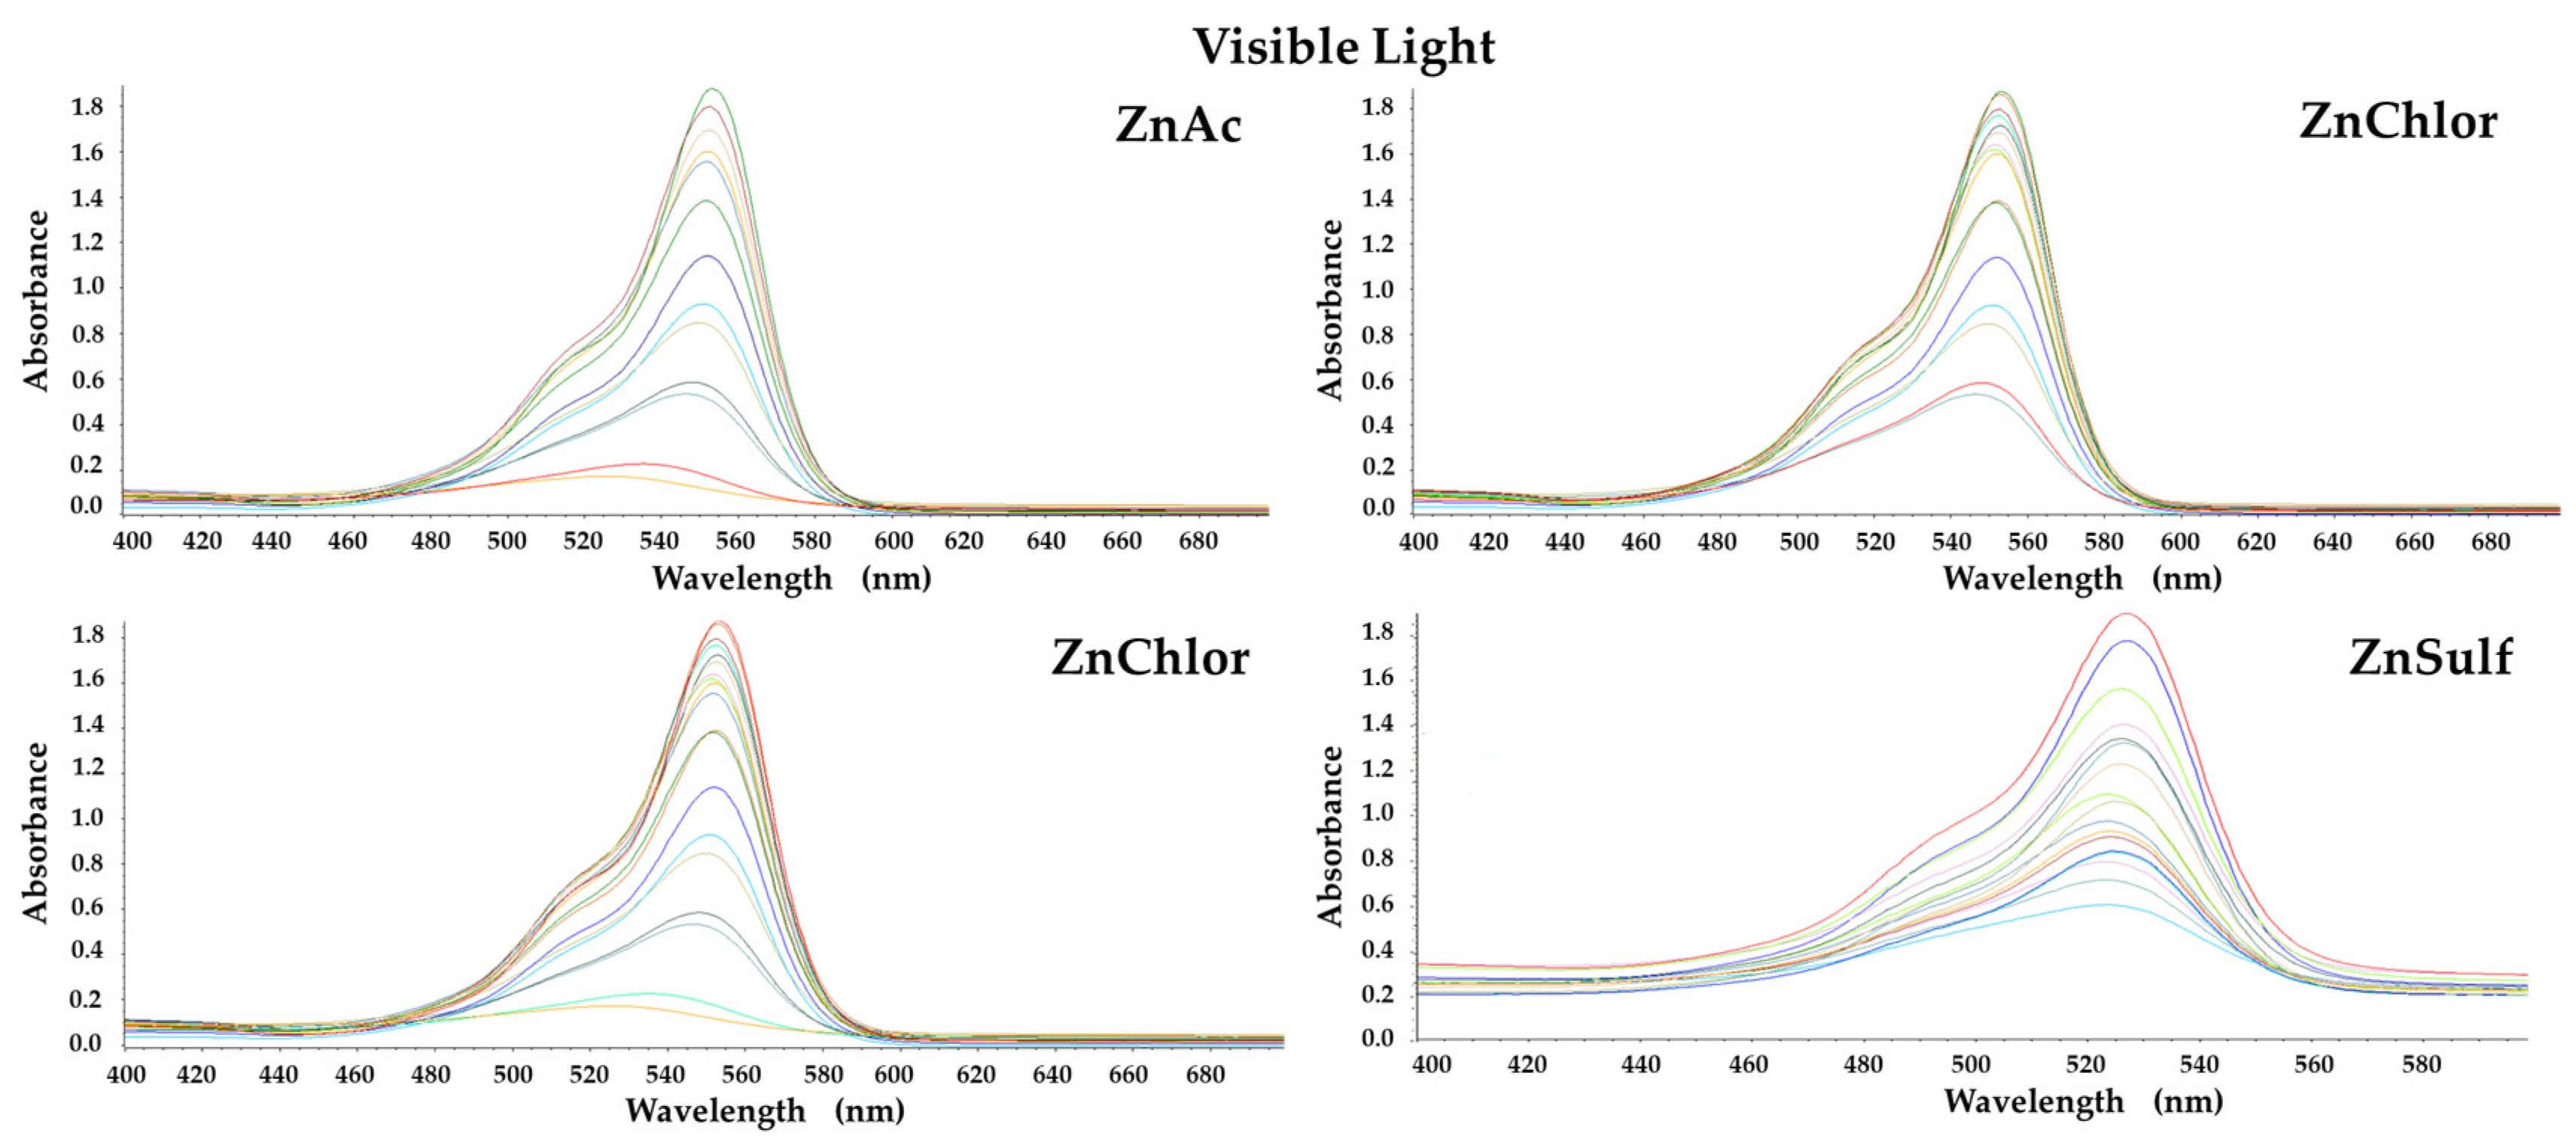
Figure 9.
Real time UV–Visible spectra under visible light photocatalytic degradation of Rhodamine B, by the four ZnO powders, produced by different precursors.
Figure 9.
Real time UV–Visible spectra under visible light photocatalytic degradation of Rhodamine B, by the four ZnO powders, produced by different precursors.
Figure 10.
Real time UV–Visible spectra under UV photocatalytic degradation of Rhodamine B, by the four ZnO powders, produced by different precursors.
Figure 10.
Real time UV–Visible spectra under UV photocatalytic degradation of Rhodamine B, by the four ZnO powders, produced by different precursors.
Figure 11.
Degradation of Rhodamine B under visible light irradiation, by the four different ZnO powders, produced by different precursors.
Figure 11.
Degradation of Rhodamine B under visible light irradiation, by the four different ZnO powders, produced by different precursors.
Figure 12.
Degradation of Rhodamine B under UV irradiation, by the four different ZnO powders, produced by different precursors.
Figure 12.
Degradation of Rhodamine B under UV irradiation, by the four different ZnO powders, produced by different precursors.
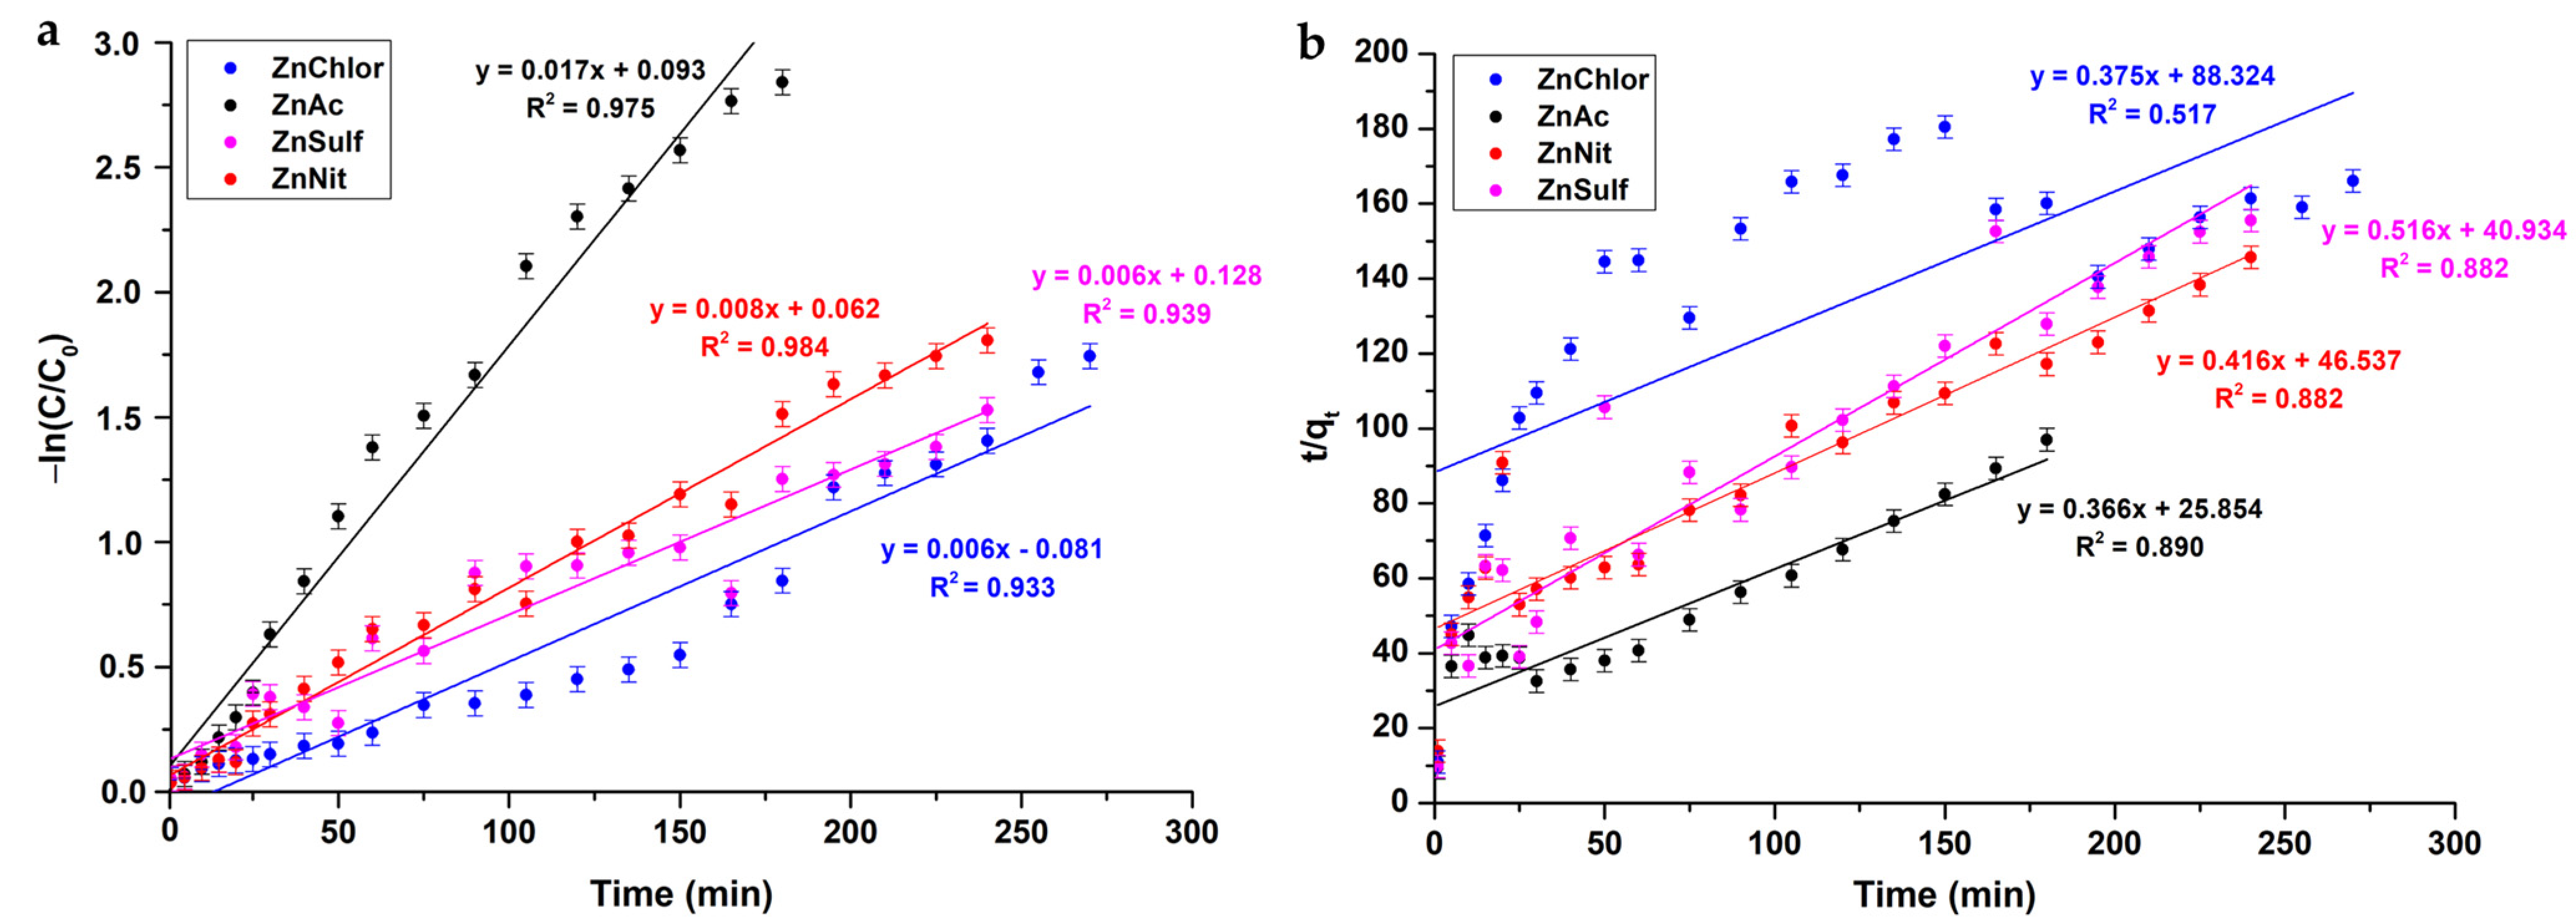
Figure 13.
Photocatalytic kinetic model studies for the four different ZnO powders, produced by different precursors, following (a) a pseudo-first order model and (b) a pseudo-second order model, upon visible light photocatalysis.
Figure 13.
Photocatalytic kinetic model studies for the four different ZnO powders, produced by different precursors, following (a) a pseudo-first order model and (b) a pseudo-second order model, upon visible light photocatalysis.
Figure 14.
Photocatalytic kinetic model studies for the four different ZnO powders, produced by different precursors, following (a) a pseudo-first order model and (b) a pseudo-second order model, upon UV light photocatalysis.
Figure 14.
Photocatalytic kinetic model studies for the four different ZnO powders, produced by different precursors, following (a) a pseudo-first order model and (b) a pseudo-second order model, upon UV light photocatalysis.
Figure 15.
Mineralization (%) of each ZnO sample, obtained through TOC analysis, after the photocatalytic procedure under (a) visible light and (b) UV light.
Figure 15.
Mineralization (%) of each ZnO sample, obtained through TOC analysis, after the photocatalytic procedure under (a) visible light and (b) UV light.
Figure 16.
The main steps of the heterogeneous photocatalytic degradation of RhB by ZnO.
Figure 16.
The main steps of the heterogeneous photocatalytic degradation of RhB by ZnO.
Figure 17.
Photocatalytic degradation of RhB (chemical reactions).
Figure 17.
Photocatalytic degradation of RhB (chemical reactions).
Figure 18.
Representation of the photocatalytic process on the surface of ZnO.
Figure 18.
Representation of the photocatalytic process on the surface of ZnO.
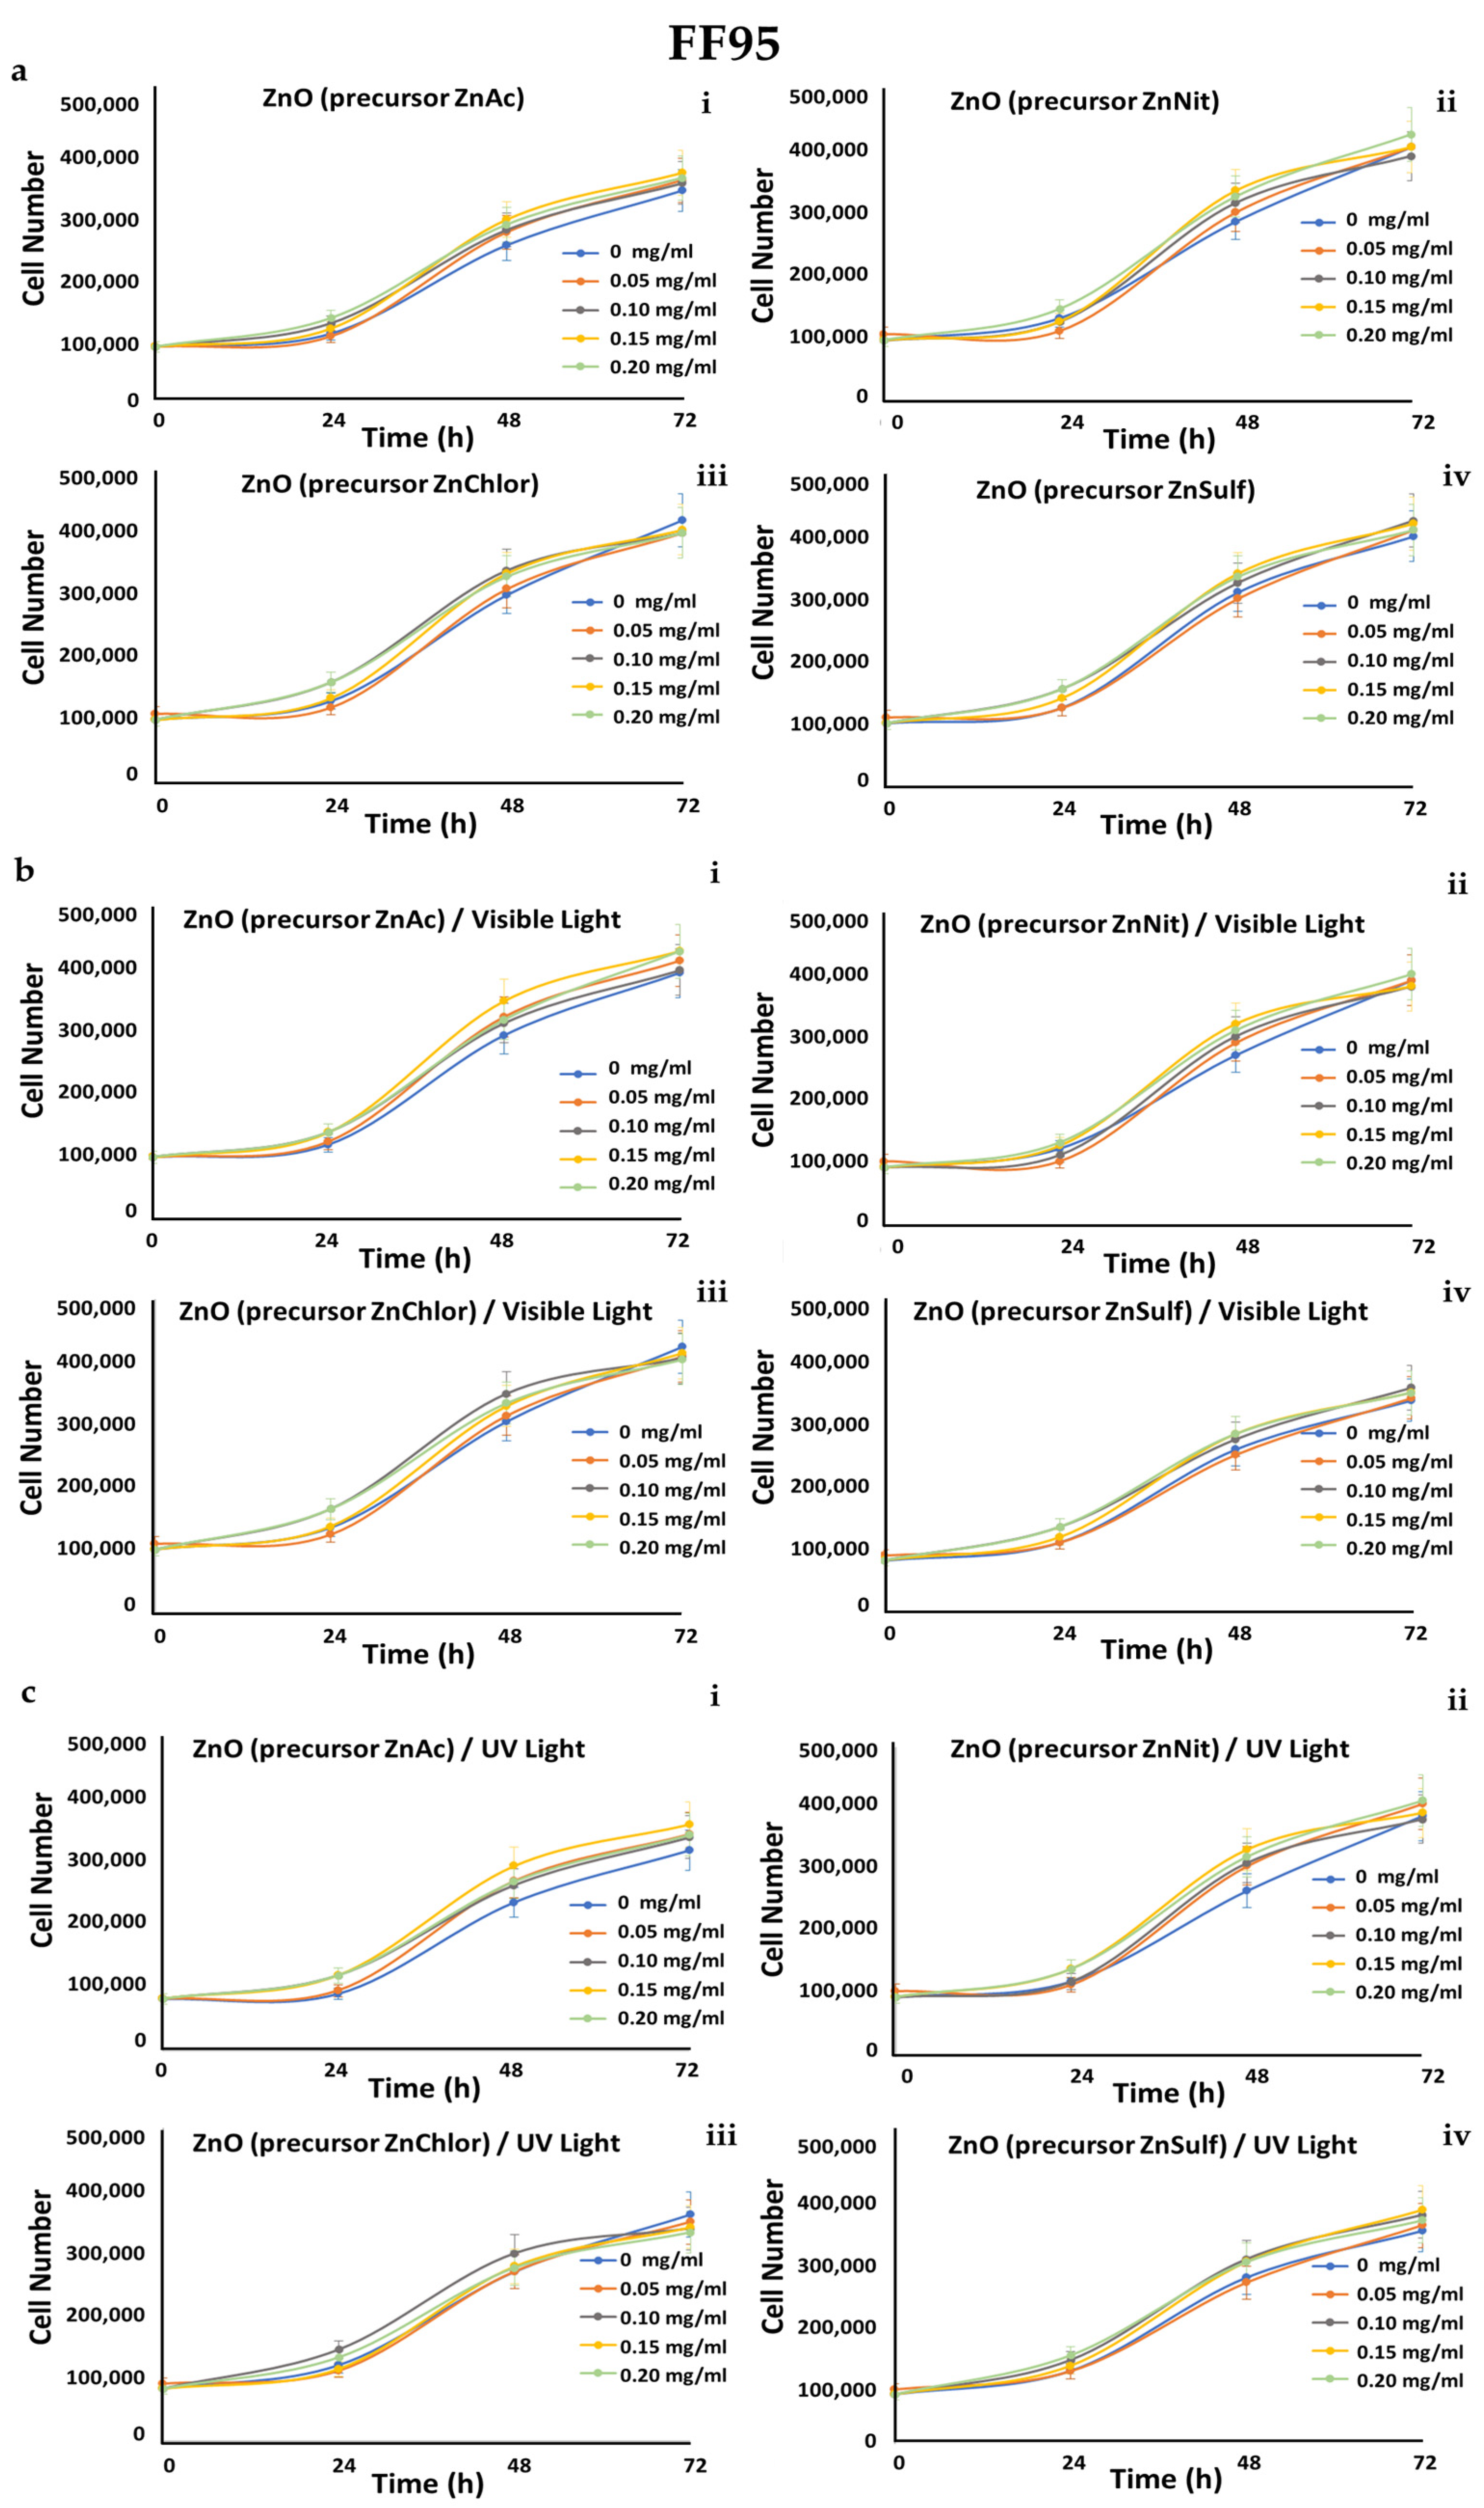
Figure 19.
Growth rates of FF95 cell line in the presence of (a) zinc acetate dehydrate (ZnAc), zinc nitrate hexahydrate (ZnNit), zinc chloride (ZnChlor), zinc sulphate heptahydrate (ZnSulf). (b) Photo-activated with visible light ZnAc, ZnNit, ZnChlor, and ZnSulf. (c) Photo-activated with UV light ZnAc, ZnNit, ZnChlor, and ZnSulf. There is not any significant effect on cell proliferation. p < 0.05 was considered statistically significant.
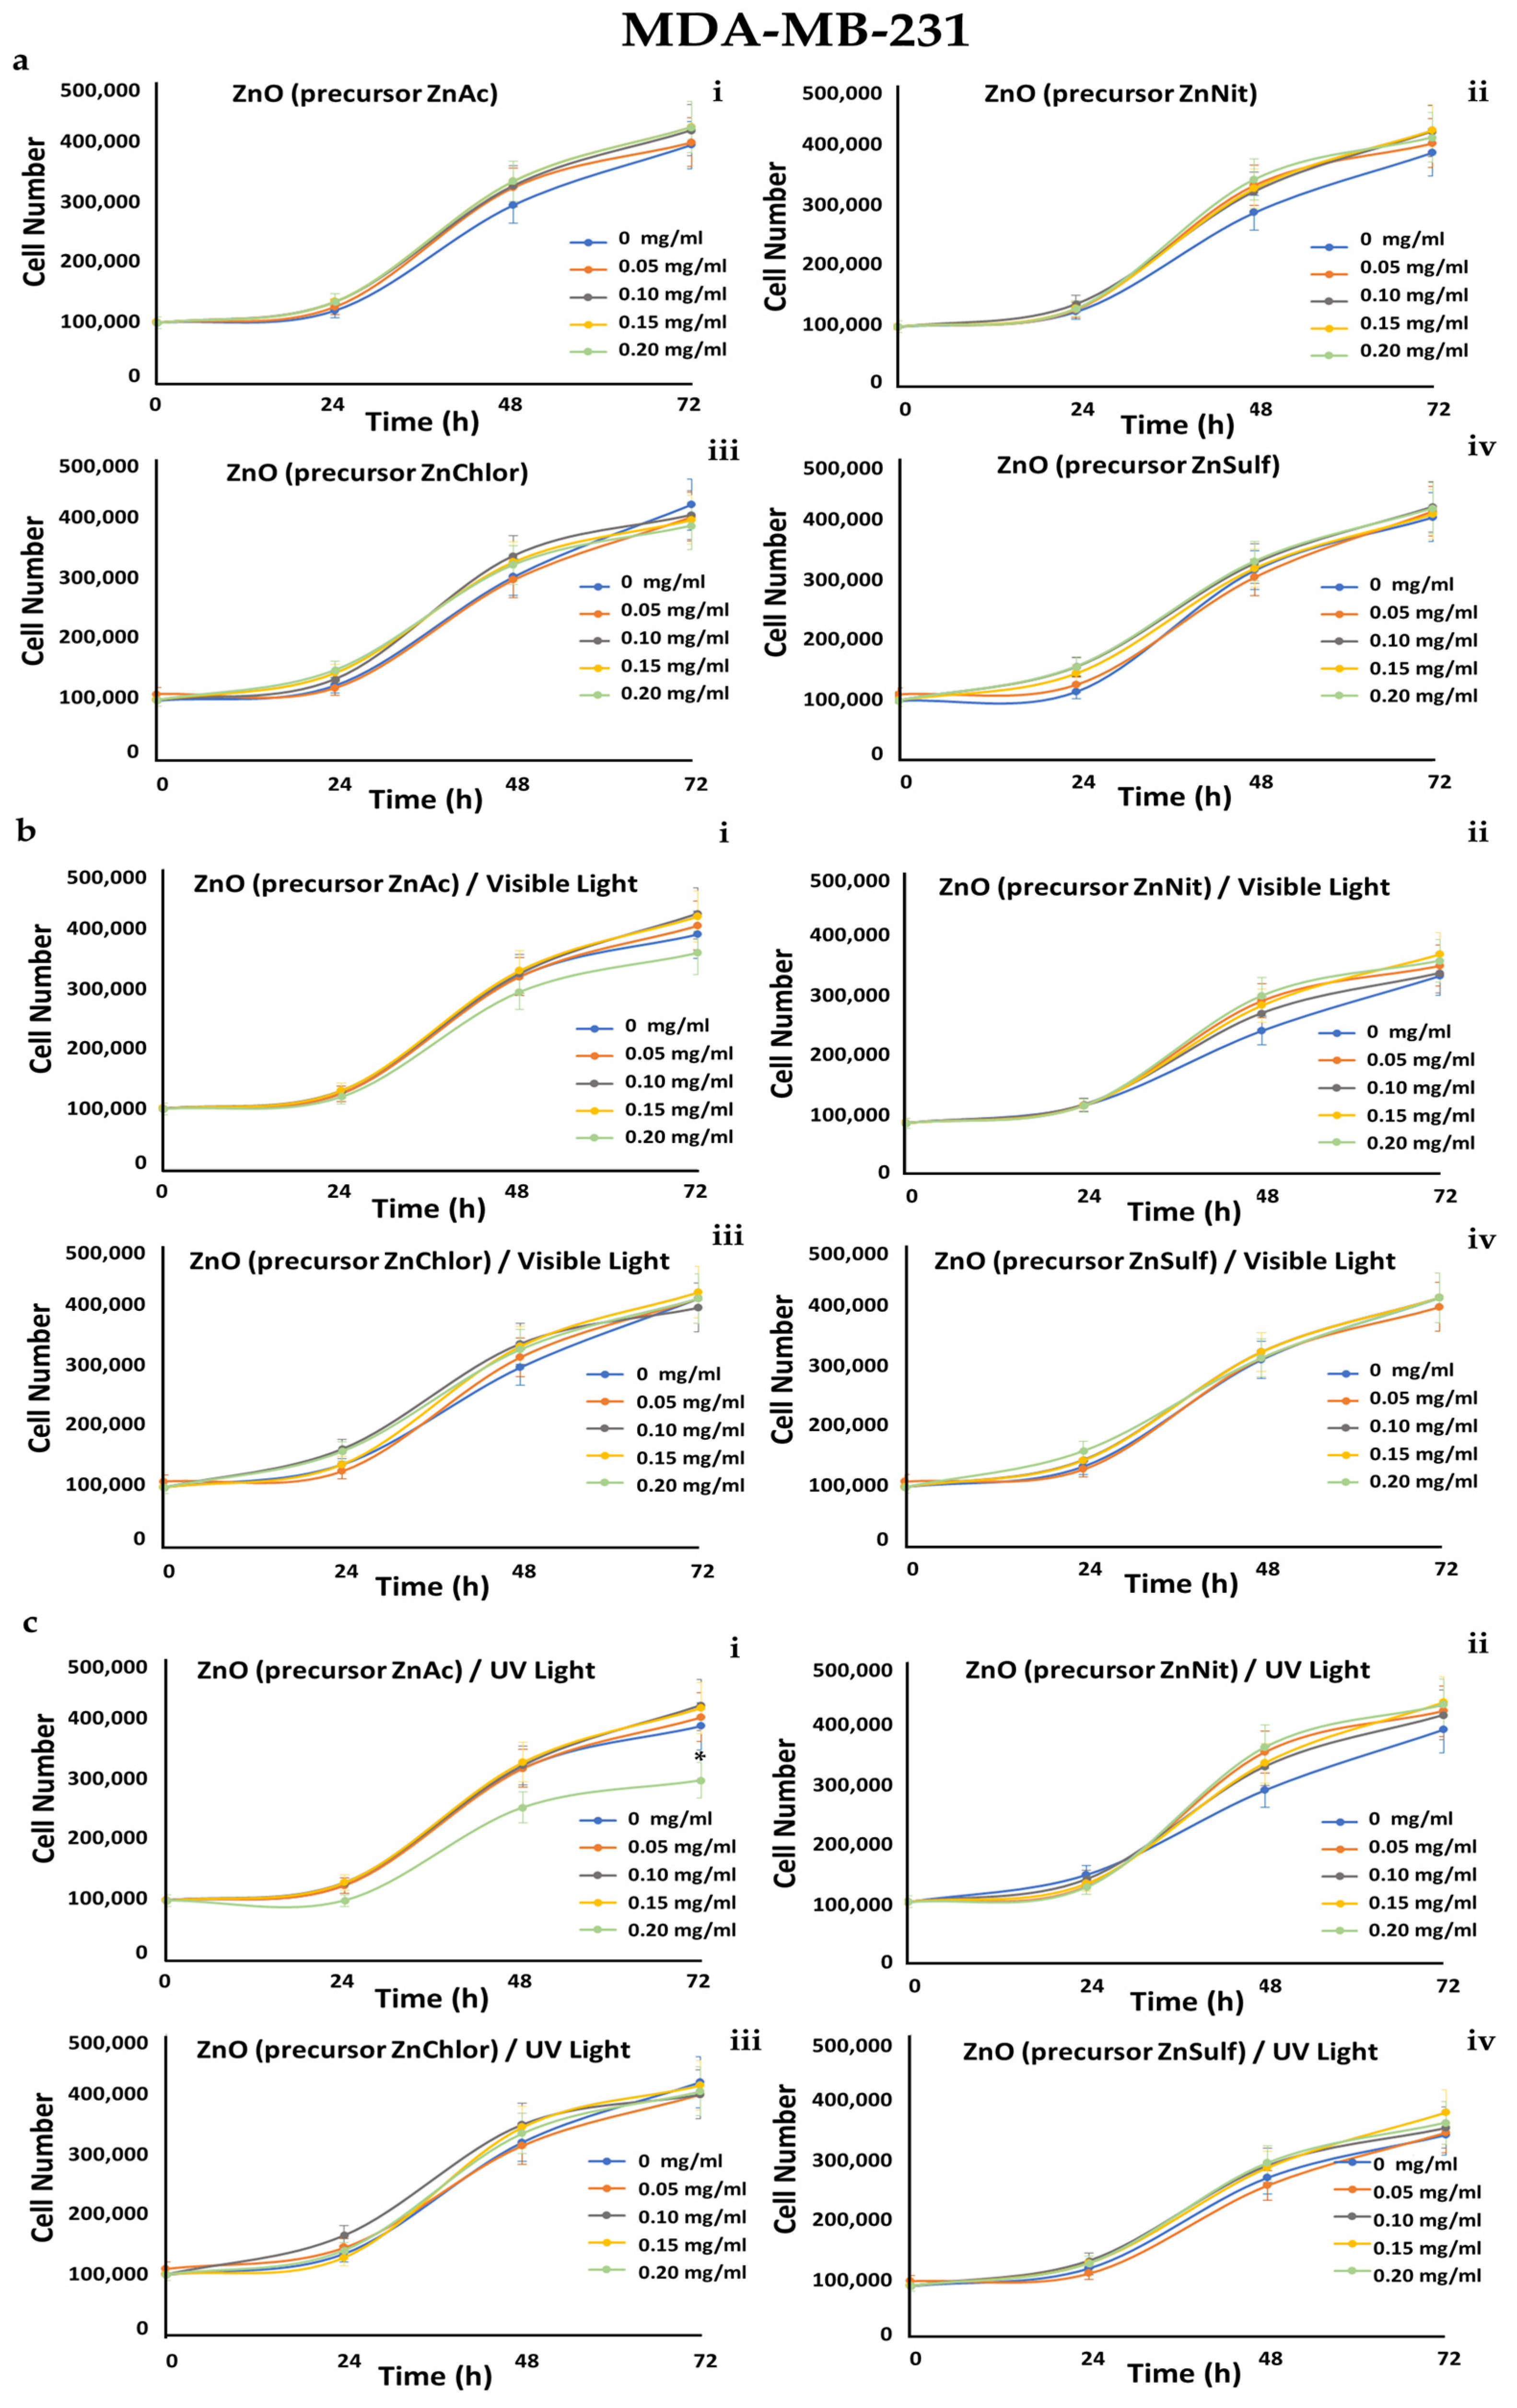
Figure 20.
Growth rates of MDA-MB-231 cell line in the presence of (a) zinc acetate dehydrate (ZnAc), zinc nitrate hexahydrate (ZnNit), zinc chloride (ZnChlor), zinc sulphate heptahydrate (ZnSulf). (b) Photo-activated with visible light ZnAc, ZnNit, ZnChlor, and ZnSulf. (c) Photo-activated with UV light ZnAc, ZnNit, ZnChlor, and ZnSulf. There is not any significant effect on cell proliferation except from the photo-activated with UV light ZnAc that decreased the cell population by 25% at the concentration of 0.2 mg/mL. p < 0.05 was considered statistically significant.
Figure 21.
Growth rates of A549 cell line in the presence of (a) zinc acetate dehydrate (ZnAc), zinc nitrate hexahydrate (ZnNit), zinc chloride (ZnChlor), zinc sulphate heptahydrate (ZnSulf). (b) Photo-activated with visible light ZnAc, ZnNit, ZnChlor, and ZnSulf. (c) Photo-activated with UV light ZnAc, ZnNit, ZnChlor, and ZnSulf. ZnNit slightly decreased the cell population after photo-activation with UV, but this effect is not statistically significant. ZnAc has an important effect, reducing the cell number by 100,000 cells, at the concentration of 0.2 mg/mL. Photo-activation with visible light led to a further decrease of 0.15 and 0.2 mg/mL and even earlier (at 48 h) the UV-photoactivation allowed a significant decrease at the same concentrations. p < 0.05 was considered statistically significant.
Figure 22.
Effect of ZnO nanoparticles, synthesized using as precursor: (a) zinc acetate dehydrate (ZnAc), (b) zinc nitrate hexahydrate (in purple) (ZnNit), (c) zinc chloride (ZnChlor), and (d) zinc sulphate heptahydrate (ZnSulf) on FF95, MDA-MB-231, and A549 cells. There is not any significant decrease in cell population of any of the three cell lines because of the addition of ZnNit, ZnChlor, and ZnSulf, while ZnAc decreased the cell viability of A549 cells by ~20% at a concentration of 0.2 mg/mL. * p < 0.05 was considered as statistically significant.
Figure 23.
Effect of photo-activated with visible-light ZnO nanoparticles, synthesized using as precursor: (a) zinc acetate dehydrate (ZnAc), (b) zinc nitrate hexahydrate (ZnNit), (c) zinc chloride (ZnChlor), and (d) zinc sulphate heptahydrate (ZnSulf) on FF95, MDA-MB-231, and A549 cells. There is not any significant decrease in cell population of any of the three cell lines as a result of the addition of the photo-excitement of ZnNit, ZnChlor, and ZnSulf. Photo-activated ZnAc decreased the cell viability of A549 cells by ~30%, and 20% that of MDA-MB-23 at a concentration of 0.2 mg/mL. Furthermore, the cell viability of A549 was finally 85% after being treated with 0.15 mg/mL of ZnAc. * p < 0.05 was considered as statistically significant.
Figure 24.
Effect of photo-activated with UV light ZnO nanoparticles, synthesized using as precursor: (a) zinc acetate dehydrate (ZnAc), (b) zinc nitrate hexahydrate (ZnNit), (c) zinc chloride (ZnChlor), and (d) zinc sulphate heptahydrate (ZnSulf) on FF95, MDA-MB-231, and A549 cells. There is not any significant decrease of cell population in any of the three cell lines as a result of the addition of the photo-excitement of ZnChlor and ZnSulf. A minor decrease in cell viability of A549 cells was observed with the addition of 0.2 mg/mL ZnNit. The same concentration of 0.2 mg/mL photo-activated ZnAc decreased the cell viability of A549 cells by ~42%, and MDA-MB-231 by 30%. Additionally, 0.1 and 0.15 mg/mL of photo-excited ZnNit could reduce the cell viability of A549 slightly. * p < 0.05 was considered as statistically significant.
Table 1.
Crystal lattice indices, average crystallite size, FWHM and crystallinity of the produced ZnO powders.
Table 1.
Crystal lattice indices, average crystallite size, FWHM and crystallinity of the produced ZnO powders.
| Sample ID | Crystal Lattice Index
(a = b ≠ c) | Average Crystallite Size (nm) * | Full Width at Half Maximum (FWHM) | Crystallinity (%) |
|---|
| a | b | c |
| ZnAc | 2.8137 | 2.8137 | 5.2087 | 4.270 ± 7.26·10−3 | 0.4215 | 81.99 |
| ZnChlor | 2.8149 | 2.8149 | 5.2105 | 5.470 ± 7.26·10−3 | 0.3291 | 76.05 |
| ZnNit | 2.8199 | 2.8199 | 5.2196 | 8.200 ± 7.26·10−3 | 0.2194 | 80.31 |
| ZnSulf | 2.8141 | 2.8141 | 5.2087 | 7.850 ± 7.26·10−3 | 0.2293 | 74.59 |
Table 2.
d-spacing calculations for ZnAc powder.
Table 2.
d-spacing calculations for ZnAc powder.
| Bragg’s Angle | dhkl (Å) | dhkl (nm) | hkl |
|---|
|
2θ | θ |
|---|
| 31.78 | 15.89 | 2.8137 | 0.28137 | 100 |
| 34.44 | 17.22 | 2.6023 | 0.26023 | 002 |
| 36.26 | 18.13 | 2.4754 | 0.24754 | 101 |
| 47.57 | 23.78 | 1.9101 | 0.19101 | 102 |
| 56.63 | 28.31 | 1.6241 | 0.16241 | 110 |
| 62.90 | 31.45 | 1.4763 | 0.14763 | 103 |
| 66.54 | 33.27 | 1.4042 | 0.14042 | 200 |
| 68.00 | 34.00 | 1.3776 | 0.13776 | 112 |
| 69.12 | 34.56 | 1.3580 | 0.13580 | 201 |
| 72.64 | 36.32 | 1.3005 | 0.13005 | 202 |
| 76.99 | 38.49 | 1.2376 | 0.12376 | 004 |
Table 3.
d-spacing calculations for ZnChlor powder.
Table 3.
d-spacing calculations for ZnChlor powder.
| Bragg’s Angle | dhkl (Å) | dhkl (nm) | hkl |
|---|
|
2θ | θ |
|---|
| 31.76 | 15.88 | 2.8149 | 0.28149 | 100 |
| 34.42 | 17.21 | 2.6032 | 0.26032 | 002 |
| 36.25 | 18.12 | 2.4762 | 0.24762 | 101 |
| 47.55 | 23.78 | 1.9106 | 0.19106 | 102 |
| 56.62 | 28.31 | 1.6243 | 0.16243 | 110 |
| 62.89 | 31.45 | 1.4766 | 0.14766 | 103 |
| 66.43 | 33.21 | 1.4063 | 0.14063 | 200 |
| 67.98 | 33.99 | 1.3778 | 0.13778 | 112 |
| 69.10 | 34.55 | 1.3583 | 0.13583 | 201 |
| 72.59 | 36.30 | 1.3012 | 0.13012 | 202 |
| 75.66 | 37.83 | 1.2559 | 0.12559 | 004 |
Table 4.
d-spacing calculations for ZnNit powder.
Table 4.
d-spacing calculations for ZnNit powder.
| Bragg’s Angle | dhkl (Å) | dhkl (nm) | hkl |
|---|
|
2θ | θ |
|---|
| 31.70 | 15.85 | 2.8199 | 0.28199 | 100 |
| 34.36 | 17.18 | 2.6078 | 0.26078 | 002 |
| 36.19 | 18.10 | 2.4799 | 0.24799 | 101 |
| 47.49 | 23.74 | 1.9131 | 0.19131 | 102 |
| 56.55 | 28.28 | 1.6260 | 0.16260 | 110 |
| 62.82 | 31.41 | 1.4781 | 0.14781 | 103 |
| 66.35 | 33.17 | 1.4077 | 0.14077 | 200 |
| 67.92 | 33.96 | 1.3790 | 0.13790 | 112 |
| 69.05 | 34.53 | 1.3591 | 0.13591 | 201 |
| 69.05 | 34.53 | 1.3591 | 0.13591 | 202 |
| 76.86 | 38.43 | 1.2394 | 0.12394 | 004 |
Table 5.
d-spacing calculations for ZnSulf powder.
Table 5.
d-spacing calculations for ZnSulf powder.
| Bragg’s Angle | dhkl (Å) | dhkl (nm) | hkl |
|---|
|
2θ | θ |
|---|
| 31.77 | 15.89 | 2.8141 | 0.28141 | 100 |
| 34.44 | 17.22 | 2.6023 | 0.26023 | 002 |
| 36.26 | 18.13 | 2.4753 | 0.24753 | 101 |
| 47.57 | 23.78 | 1.9101 | 0.19101 | 102 |
| 56.62 | 28.31 | 1.6242 | 0.16242 | 110 |
| 62.91 | 31.45 | 1.4762 | 0.14762 | 103 |
| 66.42 | 33.21 | 1.4065 | 0.14065 | 200 |
| 67.99 | 34.00 | 1.3777 | 0.13777 | 112 |
| 69.12 | 34.56 | 1.3579 | 0.13579 | 201 |
| 71.76 | 35.88 | 1.3144 | 0.13144 | 202 |
| 76.00 | 38.00 | 1.2512 | 0.12512 | 004 |
Table 6.
Results of the BET method. (a) Micropore surface area via t-plot analysis, according to the Harkins and Jura model. (b) Cumulative volume of pores between 1.7 and 300 nm from N2-sorption data and the BJH desorption method. (c) Average pore diameter, calculated by the 4 V/σ method; V was set equal to the maximum volume of N2 adsorbed along the isotherm as P/Po → 1.0.
| Sample ID | BET Surface Area (m2 g–1) | Micropore Surfuce Area (m2 g–1) | Cumulative Volume (1.7–300 nm)
(cm3 g–1) | Average Pore Diameter
(nm) |
|---|
| ZnAc | 11 | 1 | 0.05 | 19 |
| ZnChlor | 9 | 2 | 0.07 | 29 |
| ZnNit | 8 | 2 | 0.02 | 13 |
| ZnSulf | 6 | 5 | 0.07 | 50 |
Table 7.
Results from DLS.
Table 7.
Results from DLS.
| Sample ID | Hydrodynamic Diameter (Dh) | PdI |
|---|
| ZnAc | 25.9 ± 10.5 | 0.219 |
| ZnChlor | 41.3 ± 16.3 | 0.293 |
| ZnNit | 27.43 ± 1.19 | 0.177 |
| ZnSulf | 27.0 ± 10.7 | 0.157 |
Table 8.
Kinetic parameters of the ZnO powders under visible light photocatalysis.
Table 8.
Kinetic parameters of the ZnO powders under visible light photocatalysis.
| Sample ID | Pseudo-First Order Kinetic Model | Pseudo-Second Order Kinetic Model |
|---|
| K1 (min−1) | R2 | K2 (g·mg−1·min−1) | R2 |
|---|
| ZnAc | 0.017 | 0.975 | 0.366 | 0.890 |
| ZnChlor | 0.006 | 0.933 | 0.375 | 0.517 |
| ZnNit | 0.008 | 0.984 | 0.416 | 0.882 |
| ZnSulf | 0.006 | 0.939 | 0.516 | 0.882 |
Table 9.
Kinetic parameters of the ZnO powders under UV light photocatalysis.
Table 9.
Kinetic parameters of the ZnO powders under UV light photocatalysis.
| Sample ID | Pseudo-First Order Kinetic Model | Pseudo-Second Order Kinetic Model |
|---|
| K1 (min−1) | R2 | K2 (g·mg−1·min−1) | R2 |
|---|
| ZnAc | 0.018 | 0.976 | 0.380 | 0.884 |
| ZnChlor | 0.006 | 0.920 | 0.433 | 0.599 |
| ZnNit | 0.008 | 0.970 | 0.413 | 0.807 |
| ZnSulf | 0.006 | 0.972 | 0.514 | 0.893 |


 and
and 


