Article

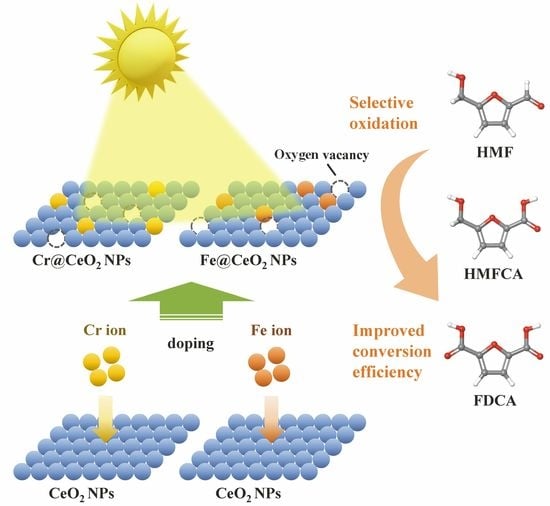
Photocatalysis of Cr- and Fe-Doped CeO2 Nanoparticles to Selective Oxidation of 5-Hydroxymethylfurfural

1
Department of Chemistry, Yeungnam University, Daehak-ro 280, Gyeongsan, Gyeongbuk 38541, Republic of Korea
2
Department of Chemistry, Sookmyung Women’s University, Seoul 04310, Republic of Korea
3
School of Chemistry and Energy, Sungshin Women’s University, 55, Dobong-ro 76 ga-gil, Gangbuk-gu, Seoul 01133, Republic of Korea
*
Authors to whom correspondence should be addressed.
These authors contributed equally to this work.
Nanomaterials 2023, 13(1), 44; https://doi.org/10.3390/nano13010044
Submission received: 5 December 2022 / Revised: 20 December 2022 / Accepted: 21 December 2022 / Published: 22 December 2022
(This article belongs to the Special Issue Nanomaterials for Energy Conversion and Catalytic Applications)

Abstract

:
Oxygen vacancies (Vo) present in CeO2 nanoparticles (NPs) can effectively boost their photocatalytic activity under ultraviolet (UV) light. To improve photocatalytic performance, Cr- and Fe-doped CeO2 NPs with increased Vo were prepared using a simple method of doping Cr and Fe ions into CeO2 NPs, which was confirmed by an in-depth analysis of the structural and electronic changes. Through photocatalytic degradation (PCD) experiments with 5-hydroxymethylfurfural (HMF), we found that the PCD rates of the two doped CeO2 NPs were faster than that of the CeO2 NPs. In addition, the conversion of HMF to 2,5-furandicarboxylic acid (FDCA) using the doped CeO2 NPs occurred only through the mechanism of the selective oxidation to 5-hydroxymethyl-2-furancarboxylic acid (HMFCA), exhibiting better efficiency than using CeO2 NPs.

Graphical Abstract

1. Introduction

Over the last few decades, metal oxides, such as CeO2, ZnO, and TiO2, have been studied for applications in various commercial fields [1,2,3]. Among metal oxides, CeO2 is considerably attractive because it has the unique characteristics of a reversible valence change between Ce4+ and Ce3+ and oxygen vacancies (Vo) [4], leading to the engineering of Vo to improve its photocatalytic performance [5,6,7]. With the tunable photocatalytic properties of CeO2, photocatalysis by its action has been highlighted as a promising method for solving energy issues with plentiful sunlight [8,9].
Among various energy problems, the depletion of petroleum-based fuels is primary tasks to be solved because they directly affect the welfare of humanity. In this regard, cheap and abundant biomass is being considered as a potential alternative to petroleum-based fuels. The effective utilization of biomass can play a crucial role in solving the current energy crisis [10,11]. To this end, a facile strategy involves the oxidation of biomass and its derivatives using CeO2 nanoparticles (NPs) as photocatalysts, and numerous efforts have been made to understand the mechanism of such reactions for various practical applications [12,13,14]. One of the most widely explored molecules as a biomass platform compound is 5-hydroxymethylfurfural (HMF), which is capable of being selectively oxidized through its two different functional groups: an aldehyde and alcohol [15,16]. To be precise, HMF can be converted to 2,5-furandicarboxylic acid (FDCA) through the production of 5-formyl-2-furancarboxylic acid (FFCA) by two distinct pathways; one is through 5-hydroxymethyl-2-furancarboxylic acid (HMFCA) by the preferential oxidation of the aldehyde group of HMF and the other is via 2,5-diformethylfuran (DFF) by that of its alcohol group (Scheme 1) [12,17,18]. HMFCA and FDCA produced by HMF are considered suitable replacements of furanic polyester and phthalic acid obtained from fossil resources, respectively [19,20,21]. In particular, FDCA is recognized by the U.S. Department of Energy as one of the top 12 bio-based chemicals [22,23]. Therefore, the selective production of HMFCA and FDCA from HMF and the increase in conversion efficiency using CeO2 NPs as photocatalysts have become a research hotspot [24].
In pursuit of highly selective and efficient production of HMFCA/FDCA, we introduced simple transition metal (TM)-ion doping into CeO2 NPs. It is known that the amount of Vo in CeO2 NPs increases with the modification of the CeO2 surface from Cr- and Fe-ion doping [9,25]. Therefore, we explored the photocatalytic activity of three distinct CeO2, Cr-doped CeO2 (Cr@CeO2), and Fe-doped CeO2 (Fe@CeO2) NPs through photocatalytic experiments with HMF. In addition, the structural and electronic changes between CeO2 and the doped CeO2 NPs were thoroughly analyzed using a combination of high-resolution transmission electron microscopy (HRTEM), scanning transmission electron microscopy with energy dispersive X-ray spectroscopy (STEM-EDS), X-ray diffraction (XRD), Raman spectroscopy, ultraviolet-visible diffuse reflectance spectroscopy (UV-Vis DRS), and X-ray absorption spectroscopy (XAS).

2. Materials and Methods

2.1. Chemicals and NP Preparation

CeO2 NPs were synthesized using a modified thermal method [26]. CeCl3∙7H2O (0.2 g; Sigma-Aldrich, St. Louis, MO, USA, 99.9%) and PVP (0.3 g; Sigma-Aldrich) were dissolved in 40 mL of deionized water under vigorous magnetic stirring. Then, 1 mL of formamide (Sigma-Aldrich, 99.9%) and 0.2 mL of H2O2 (Sigma-Aldrich) were added to the solution under continuous stirring at 90 rpm for 1 h. The as-formed yellow solution was treated by adding KOH (Sigma-Aldrich) until the pH was 13.0 and then held at that pH for 3 h. Next, the solution was transferred into a Teflon-lined autoclave and heated for 9 h at 220 °C. The resulting CeO2 NPs were filtered and washed with double-distilled water (DDW) to remove any impurities. The products (CeO2 NPs) were then washed with absolute ethanol and dried for 48 h at 95 °C. After fabricating the CeO2 NPs [26,27], two different TM ions (TM nitrate n-hydrate: Cr(NO3)3∙9H2O and Fe(NO3)3∙6H2O, Sigma-Aldrich, 99%) were added to the CeO2 NPs at 90 °C with moderate stirring until a homogeneous and transparent mixture was formed (approximately 3 h). The obtained solution was then heated at 220 °C for 9 h. The resulting TM@CeO2 NPs were filtered and washed with DDW to remove any impurities, resulting in TM@CeO2 NPs with 5 wt% Cr3+ or Fe3+ ions. The photocatalytic properties of CeO2, Cr@CeO2, and Fe@CeO2 NPs were determined using HMF (Sigma-Aldrich, 99%).

2.2. Characterization

The morphology of CeO2, Cr@CeO2, and Fe@CeO2 NPs was analyzed by HRTEM (JEM-ARM200CF, JEOL Ltd., Tokyo, Japan) using an accelerating voltage of 200 kV. In addition, the distribution of the constituent elements within the NPs at the nanoscale was mapped using STEM-EDS (JED-2300T, JEOL Ltd., Japan). The XRD data were recorded in the range 20–100° in a scanning step of 0.02° for 0.3 s using a MiniFlex600 system (Rigaku, Tokyo, Japan) with Cu Kα radiation operated at 15 mA and 40 kV. Crystallite sizes and lattice parameters were calculated by Pawley refinement of the corresponding diffraction patterns using TOPAS software (Version 4.2, Bruker, Rheinstetten, Germany). Raman spectra were obtained using an XploRA Raman spectrometer (HORIBA, Kyoto, Japan) with a diode-pumped solid-state laser of 532 nm wavelength operating at 10 mW. The UV-Vis DRS experiments were performed on a UV-2600i UV-Vis spectrophotometer (Shimadzu, Kyoto, Japan) equipped with integrated spheres. To compare the electronic structure of CeO2 and TM@CeO2 NPs, we obtained Ce M-edge, O K-edge, Cr L-edge, and Fe L-edge spectra using XAS in the 8A1 beamline at the Pohang Accelerator Laboratory with a PHI-3057 electron analyzer (Physical Electronics, Chanhassen, MN, USA) under the base pressure of 2.0 × 10⁻⁹ Torr.

2.3. Photocatalytic Experiments

To evaluate the photocatalytic degradation (PCD) activity, suspensions of CeO2, Cr@CeO2, and Fe@CeO2 NPs (0.5 g/L) containing HMF (25 mM) were stirred in the dark for 2 h until adsorption equilibrium was attained. A 30 mL volume reactor with a solution containing each NP was placed in front of a blue light-emitting diode (LED) (λ = 365 nm, output power = 6 W; Thorlabs, Newton, NJ, USA) at a distance of 10 cm and magnetically stirred at 80 rpm with and without 5,5-dimethyl-1-pyrroline N-oxide (DMPO; 50 mM). At the distance of 10 cm from the blue LED along the irradiation axis, the light intensity was determined as 10 ± 0.7 mW/cm2. The HMF oxidation products were analyzed using high-performance liquid chromatography-mass spectrometry (HPLC-MS; ULTIMATE 3000 RSLC SYSTEM, Thermo Fisher Scientific and Q-EXACTIVE ORBITRAP PLUS MS, Thermo Fisher Scientific, Waltham, MA, USA).

3. Results

3.1. Characterization of TM@CeO2 NPs

HRTEM images of CeO2, Cr@CeO2, and Fe@CeO2 NPs are shown in Figure 1a–c and Figure S1. As shown in the HRTEM images and the inserted fast Fourier transform (FFT) forms, there is no principal structural change between the three NPs (Figure 1a–c). In addition, on the basis of the STEM images and elemental distribution in the STEM-EDS data (Figure S2), we confirm that the TM ions are homogeneously distributed in the TM@CeO2 NPs. To obtain additional structural information on the particle regions by closer inspection, the line profiles were analyzed at regular intervals on the sub-nanometer scale for the three NPs, as shown in Figure 1d. Compared with CeO2 NPs, Cr@CeO2 and Fe@CeO2 NPs exhibited a decrease of 10.8 and 9.8 pm per lattice fringe in the interlayer d-spacing of the [111] plane, respectively. In general, compared to CeO2 NPs, the smaller interlayer d-spacing in TM@CeO2 NPs reflects the higher density of Vo [25,28], suggesting the successful fabrication of highly defective TM@CeO2 NPs by Cr and Fe ion doping. Therefore, we can predict from the interlayer d-spacing values that the photocatalytic properties of the TM@CeO2 NPs will be better than those of the CeO2 NPs.
Next, XRD experiments were performed to investigate the changes in crystal structure of the TM@CeO2 NPs by doping. In addition, the crystallite sizes and lattice parameters were determined through Pawley refinement of the obtained XRD spectra. As shown in Figure 1e, all the XRD spectra correspond to the diffraction patterns associated with the cubic fluorite CeO2 crystal structure with the space group Fm-3m, indicating that no principal structural change occurred by TM ion doping, in accordance with the HRTEM results. Moreover, peak broadening for TM@CeO2 NPs compared to CeO2 NPs is not clearly recognized in the XRD spectra, which indicates that their grain sizes are similar [9]. The grains in nanoparticles are known to consist of crystallites [29]. Therefore, if we estimate the crystallite size from the XRD data, we can infer the grain size from the crystallite size, which is defined as the coherent diffraction domain. As shown in Table 1, we can clearly confirm that the crystallite sizes of the TM@CeO2 NPs are similar to those of the CeO2 NPs within an error range, indicating that the effect of the size of the NPs does not need to be considered in our results. Furthermore, the a-axis lattice parameter of the cubic fluorite CeO2 crystal structure for TM@CeO2 NPs is slightly smaller than that for CeO2 NPs, showing a trend similar to the results of the line profiles measured from the HRTEM images shown in Figure 1d. It can be inferred that the shrinkage of the lattice constant for TM@CeO2 NPs is due to the introduction of dopants into CeO2 NPs, leading to an increase in Vo, as reported in the literature [30]. Therefore, we expect that the photocatalytic abilities of the TM@CeO2 NPs will be superior to those of the CeO2 NPs, in agreement with the HRTEM data.
Figure 1f shows the Raman spectra of CeO2, Cr@CeO2, and Fe@CeO2 NPs, where a strong band (F2g) appears at approximately 467 cm−1 due to the symmetric breathing mode of the oxygen ions coordinated with each Ce4+ ion in the cubic fluorite CeO2 structure [31]. Through the Raman profiles, we also confirm that TM ion doping into the CeO2 NPs barely influences the CeO2 structure. In addition to the F2g peak, two weak bands related to the transverse acoustic mode and the non-degenerate longitudinal optical mode are observed at approximately 250 and 600 cm−1 in Figure 1f, respectively [32,33]. These two peaks for the TM@CeO2 NPs are stronger than those for the CeO2 NPs. According to the literature, these bands can be attributed to the presence of defects dominantly created by Vo [32,33]. In particular, the peak at approximately 600 cm−1 arises from Vo caused by the reduced Ce3+ ions [34]. Hence, we anticipate that TM@CeO2 NPs will have better photocatalytic properties than those of CeO2 NPs, owing to the increase in the number of defects attributed to Vo.

3.2. Electronic Properties of TM@CeO2 NPs

The doping of CeO2 NPs with Cr or Fe ions changes the properties of the material at the nanoscale. To understand the implication of this process on the photocatalytic activity, a deeper understanding of the effect of the dopants on the change in electronic properties within the material is necessary. To investigate it, we performed UV-Vis DRS experiments to measure the band gap of the CeO2, Cr@CeO2, and Fe@CeO2 NPs. As shown in Figure S3, the band gap of CeO2 NPs was determined to be 3.26 eV, which is almost identical to the reported value of 3.25 eV [35]. Glancing the change in band gap by the dopants, the band gap of Cr@CeO2 and Fe@CeO2 NPs slightly increases to 3.32 and 3.34 eV, respectively, suggesting the modulation of the band gap of the CeO2 NPs by the dopants. To obtain information on the electronic structure of the unoccupied state at the NP surface, we acquired the XAS profiles of the Ce M-edge, O K-edge, Cr L-edge, and Fe L-edge for the CeO2, Cr@CeO2, and Fe@CeO2 NPs, as shown in Figure 2, where the spectra are normalized and overlaid vertically to identify changes in the electronic structure. In Figure 2a, the peaks corresponding to M5 (marked as B) and M4 (marked as C) are clearly observed, and additional satellite peaks are also found at higher photon energies for all NPs [36]. The B/C intensity ratio for the two TM@CeO2 NPs is slightly higher than that of the CeO2 NPs. This indicates that more Ce3+ states generated by the oxygen defect structure exist in TM@CeO2 NPs [37,38]. In addition, the pre-edge peak (marked as A) is directly related to the defect structure. As can be seen from the Ce M-edge spectra, the intensity of peak A for the two TM@CeO2 NPs is slightly higher than that for the CeO2 NPs. Therefore, the photocatalytic effects of the TM@CeO2 NPs containing more defects are expected to be better than that of CeO2 NPs. The peaks marked as D, E, and F in the O K-edge spectra (Figure 2b) correspond to transition-induced O 2p-Ce 4f, Ce 5d-eg, and Ce 5d-t2g states, respectively [7,39]. Focusing on the relative intensity between peaks D and E, it can be seen that the D/E intensity ratio of the two TM@CeO2 NPs is lower than that of the CeO2 NPs. This indicates that the number of defects in TM@CeO2 NPs is greater than in the CeO2 NPs [40,41,42,43]. To confirm the oxidation state and electronic structure of the TMs formed on the surface of the TM@CeO2 NPs, we measured the Cr L-edge spectrum for Cr@CeO2 NPs and the Fe L-edge spectrum for Fe@CeO2 NPs (Figure 2c–d). From these spectra, we confirm that the Cr and Fe L-edge profiles show the shapes of typical Cr2O3 and Fe2O3 composition, respectively [44,45,46,47]. From the XAS data, we envision that the formation of chromium or iron oxides on the surface of the TM@CeO2 NPs can give rise to oxygen deficiencies, leading to the promotion of conversion of Ce4+ to Ce3+ ions to compensate for the charge valence. As a result, we propose that the concentration of Vo in the TM@CeO2 NPs is higher than that in the CeO2 NPs, resulting in an increase in photocatalytic performance.

3.3. Selective Production of HMFCA and High Conversion Efficiency to FDCA by Photolysis of HMF in the Presence of TM@CeO2 NPs

Maximizing the amount of Vo by doping without altering the principal structure of CeO2 NPs is one of the easiest and most effective strategies for improving the efficiency of the photocatalyst. To verify this, we investigated the photocatalytic activity of CeO2, Cr@CeO2, and Fe@CeO2 NPs in the PCD reaction of HMF. As shown in Figure 3a, the PCD reaction rates of HMF in the presence of the two TM@CeO2 NPs are higher than that of the CeO2 NPs. Table 2 presents the photocatalytic efficiency of the three NPs for the PCD reaction of HMF for 24 h, and the PCD rates with the TM@CeO2 NPs are approximately 1.6 times faster than that with CeO2 NPs. We speculate that this is due to the enhanced photocatalytic performance of the TM@CeO2 NPs compared to that of the CeO2 NPs. As mentioned above, HMF, which contains aldehyde and alcohol groups, is converted to FDCA via pathways that produce HMFCA and/or DFF (Scheme 1). To trace the exact reaction mechanism of the photolysis of HMF, we performed a quantitative analysis of the HMFCA, DFF, and FDCA products formed over time using HPLC-MS during the photolysis of HMF with CeO2, Cr@CeO2, and Fe@CeO2 NPs, dividing it into two distinct phases as a function of the reaction time (Figure 3b). As shown, in Phase A (0–6 h) only HMFCA is produced from the selective oxidation of HMF in all three NPs. Interestingly, DFF is not produced, which clearly suggests that only the aldehyde functional group within HMF is preferentially oxidized to the carboxyl functional group. From these results, we confirmed that only HMFCA, a suitable alternative to furanic polyesters obtained from fossil resources [19,20,21], is selectively produced from HMF. In Phase B (6–24 h), FDCA starts to form gradually over time with simultaneous decreases in the concentrations of HMF and HMFCA. This definitely demonstrates that the conversion reaction from HMF to FDCA occurs only through the formation of HMFCA and not through that of DFF, suggesting that selective extraction of HMFCA from HMF is possible. Furthermore, from the initial concentration of 25 mM HMF, 9.8 and 10.1 mM FDCA were obtained over 24 h for Cr@CeO2 and Fe@CeO2 NPs, respectively, which corresponds to approximately a 40% conversion yield, approximately 3.7 times better efficiency than the CeO2 NPs (Table 2). We also conducted the repeated PCD experiments to check photocatalytic reusability (Figure S4). As shown in Figure S4, the photocatalytic activity of the NPs was sustained for five consecutive cycles, indicating that they are robust even with repetitive use. As a result, we found that FDCA, a sustainable replacement for petrochemicals [19,20,21], is produced from HMF with a high conversion yield in TM@CeO2 NPs prepared by the simple method of doping Cr and Fe ions into CeO2 NPs.

4. Conclusions

Cr@CeO2 and Fe@CeO2 NPs were developed by introducing a simple method of doping Cr and Fe ions into CeO2 NPs. Based on a thorough analysis of the structural and electronic variation in CeO2, Cr@CeO2, and Fe@CeO2 NPs, we confirmed that the density of Vo in the two TM@CeO2 NPs was greater than that in the CeO2 NPs, suggesting an improvement in their photocatalytic performance. To prove this, we demonstrated the photocatalytic activity of CeO2, Cr@CeO2, and Fe@CeO2 NPs toward HMF oxidation. As expected, the PCD rates of HMF with TM@CeO2 NPs were approximately 1.6 times faster than that with CeO2 NPs. More importantly, a high conversion efficiency of 40% to FDCA through a selective pathway to produce HMFCA was achieved from the photolysis of HMF in the presence of TM@CeO2 NPs, where HMFCA and FDCA are known to be possible starting materials for the production of sustainable alternatives to petrochemical substances.

Supplementary Materials

The following supporting information can be downloaded at: https://www.mdpi.com/article/10.3390/nano13010044/s1, Figure S1: HRTEM images of (a) CeO2, (b) Cr@CeO2, and (c) Fe@CeO2 NPs.; Figure S2: STEM-EDS data of (a) CeO2, (b) Cr@CeO2, and (c) Fe@CeO2 NPs.; Figure S3: UV-Vis DRS spectra of CeO2, Cr@CeO2, and Fe@CeO2 NPs.; Figure S4: Repeated PCD results for the change in the relative amount of HMF under UV irradiation of 365 nm wavelength in the presence of CeO2, Cr@CeO2, and Fe@CeO2 NPs.

Author Contributions

Conceptualization, M.S., H.L. and Y.-S.Y.; validation, M.S. and H.L.; formal analysis, J.-W.N. and V.N.P.; investigation, J.-W.N., V.N.P. and J.M.H.; resources, H.L. and Y.-S.Y.; writing—original draft preparation, H.L. and Y.-S.Y.; writing—review and editing, H.L. and Y.-S.Y.; visualization, J.-W.N. and V.N.P.; supervision, H.L. and Y.-S.Y. All authors have read and agreed to the published version of the manuscript.

Funding

This research was supported by the National Research Foundation of Korea (NRF) funded by the Korean government (MSIP) (Grant Nos. 2021R1A2C2007992 and 2021R1G1A1093361). This work was supported by the 2022 Yeungnam University Research Grant.

Data Availability Statement

Not applicable.

Conflicts of Interest

The authors declare no conflict of interest.

References

  1. Ma, Y.; Wang, X.; Jia, Y.; Chen, X.; Han, H.; Li, C. Titanium Dioxide-Based Nanomaterials for Photocatalytic Fuel Generations. Chem. Rev. 2014, 114, 9987–10043. [Google Scholar] [CrossRef] [PubMed]
  2. Ong, C.B.; Ng, L.Y.; Mohammad, A.W. A review of ZnO nanoparticles as solar photocatalysts: Synthesis, mechanisms and applications. Renew. Sustain. Energ. Rev. 2018, 81, 536–551. [Google Scholar] [CrossRef]
  3. Li, Q.; Song, L.; Liang, Z.; Sun, M.; Wu, T.; Huang, B.; Luo, F.; Du, Y.; Yan, C.-H. A Review on CeO2-Based Electrocatalyst and Photocatalyst in Energy Conversion. Adv. Energy Sustain. Res. 2021, 2, 2000063. [Google Scholar] [CrossRef]
  4. Wang, F.; Wei, M.; Evans, D.G.; Duan, X. CeO2-based heterogeneous catalysts toward catalytic conversion of CO2. J. Mater. Chem. A 2016, 4, 5773–5783. [Google Scholar] [CrossRef]
  5. Esch, F.; Fabris, S.; Zhou, L.; Montini, T.; Africh, C.; Fornasiero, P.; Comelli, G.; Rosei, R. Electron Localization Determines Defect Formation on Ceria Substrates. Science 2005, 309, 752–755. [Google Scholar] [CrossRef]
  6. Campbell, C.T.; Peden, C.H.F. Oxygen Vacancies and Catalysis on Ceria Surfaces. Science 2005, 309, 713–714. [Google Scholar] [CrossRef]
  7. Bui, H.T.; Weon, S.; Bae, J.W.; Kim, E.-J.; Kim, B.; Ahn, Y.-Y.; Kim, K.; Lee, H.; Kim, W. Oxygen vacancy engineering of cerium oxide for the selective photocatalytic oxidation of aromatic pollutants. J. Hazard. Mater. 2021, 404, 123976. [Google Scholar] [CrossRef]
  8. Huang, Y.; Long, B.; Tang, M.; Rui, Z.; Balogun, M.-S.; Tong, Y.; Ji, H. Bifunctional catalytic material: An ultrastable and high-performance surface defect CeO2 nanosheets for formaldehyde thermal oxidation and photocatalytic oxidation. Appl. Catal. B 2016, 181, 779–787. [Google Scholar] [CrossRef]
  9. Sahoo, T.R.; Armandi, M.; Arletti, R.; Piumetti, M.; Bensaid, S.; Manzoli, M.; Panda, S.R.; Bonelli, B. Pure and Fe-doped CeO2 nanoparticles obtained by microwave assisted combustion synthesis: Physico-chemical properties ruling their catalytic activity towards CO oxidation and soot combustion. Appl. Catal. B 2017, 211, 31–45. [Google Scholar] [CrossRef]
  10. Lanzafame, P.; Centi, G.; Perathoner, S. Catalysis for biomass and CO2 use through solar energy: Opening new scenarios for a sustainable and low-carbon chemical production. Chem. Soc. Rev. 2014, 43, 7562–7580. [Google Scholar] [CrossRef]
  11. Zou, Y.; Hu, Y.; Uhrich, A.; Shen, Z.; Peng, B.; Ji, Z.; Muhler, M.; Zhao, G.; Wang, X.; Xu, X. Steering accessible oxygen vacancies for alcohol oxidation over defective Nb2O5 under visible light illumination. Appl. Catal. B 2021, 298, 120584. [Google Scholar] [CrossRef]
  12. Ventura, M.; Aresta , M.; Dibenedetto, A. Selective Aerobic Oxidation of 5-(Hydroxymethyl)furfural to 5-Formyl-2-furancarboxylic Acid in Water. ChemSusChem 2016, 9, 1096–1100. [Google Scholar] [CrossRef] [PubMed]
  13. Nocito, F.; Ventura, M.; Aresta, M.; Dibenedetto, A. Selective Oxidation of 5-(Hydroxymethyl)furfural to DFF Using Water as Solvent and Oxygen as Oxidant with Earth-Crust-Abundant Mixed Oxides. ACS Omega 2018, 3, 18724–18729. [Google Scholar] [CrossRef] [PubMed]
  14. Tran, D.P.H.; Pham, M.-T.; Bui, X.-T.; Wang, Y.-F.; You, S.-J. CeO2 as a photocatalytic material for CO2 conversion: A review. Sol. Energy 2022, 240, 443–466. [Google Scholar] [CrossRef]
  15. Ilanidis, D.; Wu, G.; Stagge, S.; Martín, C.; Jönsson, L.J. Effects of redox environment on hydrothermal pretreatment of lignocellulosic biomass under acidic conditions. Bioresour. Technol. 2021, 319, 124211. [Google Scholar] [CrossRef]
  16. Su, T.; Liu, Q.; Lü, H.; Ali Alasmary, F.; Zhao, D.; Len, C. Selective oxidation of 5-hydroxymethylfurfural to 5-hydroxymethyl-2-furancarboxylic acid using silver oxide supported on calcium carbonate. Mol. Catal. 2021, 502, 111374. [Google Scholar] [CrossRef]
  17. Zhang, M.; Li, Z.; Xin, X.; Zhang, J.; Feng, Y.; Lv, H. Selective Valorization of 5-Hydroxymethylfurfural to 2,5-Diformylfuran Using Atmospheric O2 and MAPbBr3 Perovskite under Visible Light. ACS Catal. 2020, 10, 14793–14800. [Google Scholar] [CrossRef]
  18. Zhao, D.; Su, T.; Wang, Y.; Varma, R.S.; Len, C. Recent advances in catalytic oxidation of 5-hydroxymethylfurfural. Molecular Catalysis 2020, 495, 111133. [Google Scholar] [CrossRef]
  19. de Jong, E.; Dam, M.A.; Sipos, L.; Gruter, G.J.M. Furandicarboxylic Acid (FDCA), A Versatile Building Block for a Very Interesting Class of Polyesters. In Biobased Monomers, Polymers, and Materials; American Chemical Society: Washington, DC, USA, 2012; Volume 1105, pp. 1–13. [Google Scholar]
  20. Zhao, D.; Rodriguez-Padron, D.; Luque, R.; Len, C. Insights into the Selective Oxidation of 5-Hydroxymethylfurfural to 5-Hydroxymethyl-2-furancarboxylic Acid Using Silver Oxide. ACS Sustain. Chem. Eng. 2020, 8, 8486–8495. [Google Scholar] [CrossRef]
  21. Li, Q.; Wang, H.; Tian, Z.; Weng, Y.; Wang, C.; Ma, J.; Zhu, C.; Li, W.; Liu, Q.; Ma, L. Selective oxidation of 5-hydroxymethylfurfural to 2,5-furandicarboxylic acid over Au/CeO2 catalysts: The morphology effect of CeO2. Catal. Sci. Technol. 2019, 9, 1570–1580. [Google Scholar] [CrossRef]
  22. Bozell, J.J.; Petersen, G.R. Technology development for the production of biobased products from biorefinery carbohydrates—The US Department of Energy’s “Top 10” revisited. Green Chem. 2010, 12, 539–554. [Google Scholar] [CrossRef]
  23. Yan, C.; Song, H.; Zhang, Y.; Wei, Y.; Wang, K.; Li, B.; Yuan, S.; Yan, Y. Selective Oxidation of 5-Hydroxymethylfurfural to 2,5-Furandicarboxylic Acid over MnOx-CeO2 Supported Palladium Nanocatalyst under Aqueous Conditions. ChemistrySelect 2020, 5, 10156–10162. [Google Scholar] [CrossRef]
  24. Yan, Y.; Li, K.; Zhao, J.; Cai, W.; Yang, Y.; Lee, J.-M. Nanobelt-arrayed vanadium oxide hierarchical microspheres as catalysts for selective oxidation of 5-hydroxymethylfurfural toward 2,5-diformylfuran. Appl. Catal. B 2017, 207, 358–365. [Google Scholar] [CrossRef]
  25. Venkataswamy, P.; Damma, D.; Jampaiah, D.; Mukherjee, D.; Vithal, M.; Reddy, B.M. Cr-Doped CeO2 Nanorods for CO Oxidation: Insights into Promotional Effect of Cr on Structure and Catalytic Performance. Catal. Lett. 2020, 150, 948–962. [Google Scholar] [CrossRef]
  26. Goharshadi, E.K.; Samiee, S.; Nancarrow, P. Fabrication of cerium oxide nanoparticles: Characterization and optical properties. J. Colloid Interface Sci. 2011, 356, 473–480. [Google Scholar] [CrossRef]
  27. Sreeremya, T.S.; Krishnan, A.; Peer Mohamed, A.; Hareesh, U.S.; Ghosh, S. Synthesis and characterization of cerium oxide based nanofluids: An efficient coolant in heat transport applications. Chem. Eng. J. 2014, 255, 282–289. [Google Scholar] [CrossRef]
  28. Wang, W.; Zhu, Q.; Qin, F.; Dai, Q.; Wang, X. Fe doped CeO2 nanosheets as Fenton-like heterogeneous catalysts for degradation of salicylic acid. Chem. Eng. J. 2018, 333, 226–239. [Google Scholar] [CrossRef]
  29. Ares, J.R.; Pascual, A.; Ferrer, I.J.; Sánchez, C. Grain and crystallite size in polycrystalline pyrite thin films. Thin Solid Films 2005, 480–481, 477–481. [Google Scholar] [CrossRef]
  30. Phokha, S.; Prabhakaran, D.; Boothroyd, A.; Pinitsoontorn, S.; Maensiri, S. Ferromagnetic induced in Cr-doped CeO2 particles. Microelectron. Eng. 2014, 126, 93–98. [Google Scholar] [CrossRef]
  31. Schmitt, R.; Nenning, A.; Kraynis, O.; Korobko, R.; Frenkel, A.I.; Lubomirsky, I.; Haile, S.M.; Rupp, J.L.M. A review of defect structure and chemistry in ceria and its solid solutions. Chem. Soc. Rev. 2020, 49, 554–592. [Google Scholar] [CrossRef]
  32. Laguna, O.H.; Centeno, M.A.; Boutonnet, M.; Odriozola, J.A. Fe-doped ceria solids synthesized by the microemulsion method for CO oxidation reactions. Appl. Catal. B 2011, 106, 621–629. [Google Scholar] [CrossRef] [Green Version]
  33. Verma, R.; Samdarshi, S.K.; Bojja, S.; Paul, S.; Choudhury, B. A novel thermophotocatalyst of mixed-phase cerium oxide (CeO2/Ce2O3) homocomposite nanostructure: Role of interface and oxygen vacancies. Sol. Energy Mater. Sol. Cells 2015, 141, 414–422. [Google Scholar] [CrossRef]
  34. Agarwal, S.; Lefferts, L.; Mojet, B.L. Ceria Nanocatalysts: Shape Dependent Reactivity and Formation of OH. ChemCatChem 2013, 5, 479–489. [Google Scholar] [CrossRef]
  35. Agarwal, S.; Zhu, X.; Hensen, E.J.M.; Mojet, B.L.; Lefferts, L. Surface-Dependence of Defect Chemistry of Nanostructured Ceria. J. Phys. Chem. C 2015, 119, 12423–12433. [Google Scholar] [CrossRef]
  36. Paidi, V.K.; Brewe, D.L.; Freeland, J.W.; Roberts, C.A.; van Lierop, J. Role of Ce 4f hybridization in the origin of magnetism in nanoceria. Phys. Rev. B 2019, 99, 180403. [Google Scholar] [CrossRef] [Green Version]
  37. Wu, L.; Wiesmann, H.J.; Moodenbaugh, A.R.; Klie, R.F.; Zhu, Y.; Welch, D.O.; Suenaga, M. Oxidation state and lattice expansion of CeO2-x nanoparticles as a function of particle size. Phys. Rev. B 2004, 69, 125415. [Google Scholar] [CrossRef]
  38. Song, K.; Schmid, H.; Srot, V.; Gilardi, E.; Gregori, G.; Du, K.; Maier, J.; van Aken, P.A. Cerium reduction at the interface between ceria and yttria-stabilised zirconia and implications for interfacial oxygen non-stoichiometry. APL Mater. 2014, 2, 032104. [Google Scholar] [CrossRef]
  39. Chen, S.-Y.; Chen, R.-J.; Lee, W.; Dong, C.-L.; Gloter, A. Spectromicroscopic evidence of interstitial and substitutional dopants in association with oxygen vacancies in Sm-doped ceria nanoparticles. Phys. Chem. Chem. Phys. 2014, 16, 3274–3281. [Google Scholar] [CrossRef]
  40. Rodriguez, J.A.; Hanson, J.C.; Kim, J.-Y.; Liu, G.; Iglesias-Juez, A.; Fernández-García, M. Properties of CeO2 and Ce1-xZrxO2 Nanoparticles:  X-ray Absorption Near-Edge Spectroscopy, Density Functional, and Time-Resolved X-ray Diffraction Studies. J. Phys. Chem. B 2003, 107, 3535–3543. [Google Scholar] [CrossRef]
  41. Lee, W.; Chen, S.-Y.; Chen, Y.-S.; Dong, C.-L.; Lin, H.-J.; Chen, C.-T.; Gloter, A. Defect Structure Guided Room Temperature Ferromagnetism of Y-Doped CeO2 Nanoparticles. J. Phys. Chem. C 2014, 118, 26359–26367. [Google Scholar] [CrossRef]
  42. D’Angelo, A.M.; Chaffee, A.L. Correlations between Oxygen Uptake and Vacancy Concentration in Pr-Doped CeO2. ACS Omega 2017, 2, 2544–2551. [Google Scholar] [CrossRef] [Green Version]
  43. Choi, J.H.; Hong, J.-A.; Son, Y.R.; Wang, J.; Kim, H.S.; Lee, H.; Lee, H. Comparison of Enhanced Photocatalytic Degradation Efficiency and Toxicity Evaluations of CeO2 Nanoparticles Synthesized through Double-Modulation. Nanomaterials 2020, 10, 1543. [Google Scholar] [CrossRef]
  44. Drozd, V.; Liu, G.Q.; Liu, R.S.; Kuo, H.T.; Shen, C.H.; Shy, D.S.; Xing, X.K. Synthesis, electrochemical properties, and characterization of LiFePO4/C composite by a two-source method. J. Alloys Compd. 2009, 487, 58–63. [Google Scholar] [CrossRef]
  45. Yitamben, E.N.; Lovejoy, T.C.; Pakhomov, A.B.; Heald, S.M.; Negusse, E.; Arena, D.; Ohuchi, F.S.; Olmstead, M.A. Correlation between morphology, chemical environment, and ferromagnetism in the intrinsic-vacancy dilute magnetic semiconductor Cr-doped Ga2Se3/Si(001). Phys. Rev. B 2011, 83, 045203. [Google Scholar] [CrossRef] [Green Version]
  46. Katayama, T.; Yasui, S.; Osakabe, T.; Hamasaki, Y.; Itoh, M. Ferrimagnetism and Ferroelectricity in Cr-Substituted GaFeO3 Epitaxial Films. Chem. Mater. 2018, 30, 1436–1441. [Google Scholar] [CrossRef]
  47. Mohamed, A.Y.; Park, W.G.; Cho, D.-Y. Chemical Structure and Magnetism of FeOx/Fe2O3 Interface Studied by X-ray Absorption Spectroscopy. Magnetochemistry 2020, 6, 33. [Google Scholar] [CrossRef]
Scheme 1. Two reaction pathways for the conversion from HMF to FDCA.
Nanomaterials 13 00044 sch001
Figure 1. HRTEM images of (a) CeO2, (b) Cr@CeO2, and (c) Fe@CeO2 NPs. Insets: The corresponding FFT data. (d) Line profile of the red line shown in (ac) for the corresponding NPs. The decrease in the interlayer d-spacings of the [111] plane for Cr@CeO2 and Fe@CeO2 NPs is measured as 65 and 59 pm on the six lattice fringes compared to that for CeO2 NPs, indicating 10.8 and 9.8 pm less per lattice fringe, respectively. (e) XRD and (f) Raman spectra of CeO2, Cr@CeO2, and Fe@CeO2 NPs. Bottom panel in (e): Diffraction pattern of cubic fluorite CeO2 (PDF#34-0394) with Miller indices extracted from the PDF-2 database.
Nanomaterials 13 00044 g001
Figure 2. XAS profiles of (a) Ce M-edge, (b) O K-edge, (c) Cr L-edge, and (d) Fe L-edge for CeO2, Cr@CeO2, and Fe@CeO2 NPs.
Nanomaterials 13 00044 g002
Figure 3. (a) PCD data with and without DMPO as a radical scavenger for the change in the relative amount of HMF and (b) quantitative analysis of products by photolysis of HMF under UV irradiation of 365 nm wavelength in the presence of CeO2, Cr@CeO2, and Fe@CeO2 NPs. C0 and C indicate the initial concentration and post-reaction concentration of HMF, respectively.
Nanomaterials 13 00044 g003
Table 1. Crystallite sizes and lattice constants of the cubic fluorite CeO2 crystal structure estimated through Pawley refinement for XRD spectra acquired from CeO2, Cr@CeO2, and Fe@CeO2 NPs. The error rates indicate the 95% confidence interval.
Type of NPsCrystallite Size (nm)a-Axis Lattice Parameter (Å)
CeO219.1 ± 1.05.4150 ± 0.0008
Cr@CeO218.3 ± 1.15.4123 ± 0.0004
Fe@CeO219.2 ± 0.55.4136 ± 0.0008
Table 2. PCD performance and FDCA conversion yields determined through the photolysis of 25 mM HMF for 24 h under UV irradiation of 365 nm wavelength in the presence of CeO2, Cr@CeO2, and Fe@CeO2 NPs; these are the data at 24 h in Figure 3.
Type of NPsPCD Efficiency of HMF (C/C0)Conversion Efficiency from HMF to FDCA (%)
CeO20.41 ± 0.0510.8 ± 0.51
Cr@CeO20.08 ± 0.0139.2 ± 0.78
Fe@CeO20.03 ± 0.0140.4 ± 0.82
Disclaimer/Publisher’s Note: The statements, opinions and data contained in all publications are solely those of the individual author(s) and contributor(s) and not of MDPI and/or the editor(s). MDPI and/or the editor(s) disclaim responsibility for any injury to people or property resulting from any ideas, methods, instructions or products referred to in the content.

