Article

Constructing Randomly Lamellar HKUST–1@Clinoptilolite through Polyethylene Glycol—Assisted Hydrothermal Method and Coordinated Complexation for Enhanced Adsorptive Separation for CO2 and CH4

Beijing Key Laboratory for Green Catalysis and Separation, Department of Chemical Engineering, Beijing University of Technology, Beijing 100124, China
*
Authors to whom correspondence should be addressed.
Nanomaterials 2023, 13(12), 1860; https://doi.org/10.3390/nano13121860
Submission received: 14 March 2023 / Revised: 16 April 2023 / Accepted: 24 April 2023 / Published: 14 June 2023
(This article belongs to the Section Nanocomposite Materials)

Abstract

:
Clinoptilolite (CP) was successfully synthesized via a hydrothermal route in the presence of polyethylene glycol (PEG), and it was then delaminated by washing using Zn2+ containing acid. HKUST-1, as one kind of the Cu-based MOFs, showed a high CO2 adsorption capacity owing to its large pore volume and specific surface area. In the present work, we selected one of the most efficient ways for preparing the HKUST-1@CP compounds via coordination between exchanged Cu2+ and ligand (trimesic acid). Their structural and textural properties were characterized by XRD, SAXS, N2 sorption isotherms, SEM, and TG-DSC profiles. Particularly, the effect of the additive PEG (average molecular weight of 600) on the induction (nucleation) periods and growth behaviors were detailed and investigated in the hydrothermal crystallization procedures of synthetic CPs. The corresponding activation energies of induction (En) and growth (Eg) periods during crystallization intervals were calculated. Meanwhile, the pore size of the inter-particles of HKUST-1@CP was 14.16 nm, and the BET specific area and pore volume were 55.2 m2/g and 0.20 cm3/g, respectively. Their CO2 and CH4 adsorption capacities and selectivity were preliminarily explored, showing 0.93 mmol/g for HKUST-1@CP at 298 K with the highest selective factor of 5.87 for CO2/CH4, and the dynamic separation performance was evaluated in column breakthrough experiments. These results suggested an efficient way of preparing zeolites and MOFs composites that is conducive to being a promising adsorbent for applications in gas separation.

1. Introduction

Clinoptilolite (CP), as one of the heulandite (HEU) zeolites [1], is widely used for gas adsorption, industrial catalysis, and environmental treatment [2,3,4,5,6] due to its adjustable acidity, thermal stability, and unique micropore networks. It consists of channel A (0.44 × 0.72 nm) with 10-member rings, and channel B (0.40 × 0.55 nm) with 8-member rings that is parallel to channel A, as well as C (0.41 × 0.47 nm) with 10–member rings that intersect with both channel A and B. CP is widely applied in CO2 and CH4 separation because of its low cost, high productivity, large adsorption, and easy purification [7].
The synthesized CPs with the HEU structures presented the layered accumulations containing the ordered and expandable lamellar structures [8], which are conducive to not only improving the mass transport efficiency for the guest molecules but also for providing the more accessible surfaces adsorption sites for functional assembly. However, the steric hindrances of their HEU structures, caused by small interlayer spaces, strongly limit their wider applications. In this regard, we proposed a synthesis method of adding a variety of surfactants to the synthesis system for facilitating the realization of layered structure expansions and the lamellar disorder arrangements of the synthesized CPs [9,10]. As reported by Iwakai et al. [11], the silicate-1 with smaller particle size (about 40~60 nm) could be synthesized by the addition of polyoxyethylene polyether in the conventional hydrothermal system, while the particle size of conventional silicate–1 was larger than 500 nm. Silva et al. [12] provided a synthesis method of zeolite Y by adding surfactant cetyltrimethylammonium bromide in the hydrothermal system. Compared with commercialized USY zeolite, their products showed the same structure characteristics with relative lower crystallinity (about 33% of USY zeolite) but a much higher external surface area (661 cm3/g) than that of USY zeolite (208 cm3/g). Koohsaryan and Anbia proposed an efficient way of synthesizing zeolite 13X via additive polyethylene glycol (PEG), which was beneficial to synthesize the well-developed zeolite crystals that have a mesopore size (around 2–10 nm) with a shorter growth period and a relative greater crystallinity [13]. Therefore, we believe that the polymer polyols are beneficial to the layered expansion of synthetic CPs, owing to their good water solubility and greater amount of hydrogen bonds in aqueous solution.
The traditional method of zeolite delamination is usually carried out under ultrasonic conditions. Corma et al. [14] reported an exfoliated method for layered ITQ-2 by cetyltrimethylammonium bromide and tetrapropyl ammonium hydroxide under ultrasonic condition. After exfoliation, the sheets of the zeolite became a random arrangement with an external surface area of about 700 m2/g, almost twice as much as the raw ITQ-2. However, the high energy cost of the ultrasonic process of zeolites is one shortcoming. Gorgojo et al. [15] achieved a direct exfoliation method by cetyltrimethylammonium ion without ultrasonic treatment, and the exfoliated Nu-6 presented the larger surface areas of around 300 m2/g, six times that of raw Nu-6. As demonstrated by Okrut et al. [16], the layered silicate magadiite was delaminated via Zn2+ modification and acid treatment without ultrasound under mild conditions, resulting in that its external surface area enlarging from 10 to 25 m2/g.
The delamination process usually follows the synthesis process, so combining two processes may improve the delamination performance. Roth et al. [17] proposed a delamination method by calcinations based on the as-synthesized MCM-22 with additive hexamethylenediamine, showing larger c-axis distance from around 0.25 nm to larger than 0.50 nm. However, rare reports proposed delamination methods regarding the abovementioned CP. Hopefully, the delamination of the synthetic CPs can not only open the lamellar structures from one direction of the crystal planes but also improve the adsorption capacity and the catalytic performance of the gases.
As is well known, the metal-organic frameworks (MOFs), as kinds of multi–dimensional structure materials with high specific surface areas and abundant functional sites [18], have recently presented strong potential applications in adsorption, separation, and catalysis. HKUST-1, consisting of two channels, namely, a 0.9 nm cage and a 0.35 nm pore [19], exhibited a high CO2 adsorption capacity (up to 4.20 mmol/g at 27 °C and 1 bar) owing to its large pore volume (0.69 cm3/g) and specific surface area (1615 m2/g) [20], but large-scale production and industrial application are difficult to achieve due to its low productivity, poor hydrothermal stability, and higher cost. In order to avoid these disadvantages, at least to some extent, one of the most efficient methods is the preparation of the composites of zeolites and MOFs. The composites are usually prepared by such a method that the MOFs are synthesized from the precursor solution with the addition of certain amounts of the synthesized zeolites. For example, the core-shell structured Zeolite-5A@MOF-74 was obtained from the MOF-74(Ni) precursor solution with the addition of Zeolite-5A, showing higher thermal stability [21]. The CO2/H2, CO/H2, CH4/H2, and N2/H2 selectivity was 8659, 2375, 114, and 45, respectively, at 25 °C and 1 bar, higher than that of Zeolite–5A or MOF-74. Using a similar method, MIL-100 (Fe)@SBA-15 was successfully synthesized by Mahmoudia et al. [22], and the adsorption efficiency for methylene blue, rhodamine B, methyl orange, and alizarin yellow R dye solutions was higher than that of pure MIL-100 (Fe), due to the generations of the pore structures in the MIL-100 (Fe). As demonstrated by Tari et al. [23], the MCM-41/Cu(BDC) was prepared via the same method mentioned above, showing a higher CO2/CH4 selectivity (the separation factor of around 4.9 at 303 K and 4 bar) as compared with pure MCM-41. In addition, transition metal cations can be introduced onto CP through ion exchange, which can not only balance the anions of the aluminosilicate frameworks but also provide the central ions for preparing MOFs. However, the composites between CP and MOFs are rarely reported. More recently, we proposed a novel constructed strategy of the disorderly layered UiO-66-on-clinoptilolite heterostructures through the assistance of PEG and polyvinylpyrrolidone, and the prepared hybrid materials exhibited an excellent adsorption selective performance for CO2 and CH4 [9].
Herein, we developed a preparation method of the composites of CP and HKUST-1 via delamination, ion exchange, and coordination. On the basis of the abovementioned PEG-assisted hydrothermal method [9] and using alkali, aluminum, and silicon sources as raw materials, the synthesized CP was delaminated in the Zn-containing HNO3 solutions, and then Cu2+-exchanged after ammonization. Finally, the obtained Cu–CP was coordinated with trimesic acid ligand to form HKUST-1@CP composite without additional metal sources. Meanwhile, X-ray diffraction (XRD), Fourier transform infrared (FT-IR) spectra, thermogravimetric (TG) analysis, N2 sorption isotherms, and scanning electron microscopic (SEM) images were used to elucidate the structure features and physicochemical performances of the resultant HKUST-1@CP composites. Meanwhile, the application of the composites in the CO2/CH4 adsorptive separation and the column breakthrough performance were preliminarily explored. The novelty and contribution of the present work are the successful preparation of HKUST-1@CP composites by stratification, ion exchange, and coordination, especially the addition of PEG in the hydrothermal synthesis system being conducive to the layered expansion of CPs. The other contribution is that the exchanged Cu2+ located in the exchange position of CP can be used not only as cations to balance the negative charge of CP skeleton but, also, as central ions to complex with the ligands. As an effective adsorbent, hopefully, the CO2/CH4 adsorptive separation and the column breakthrough performance could be enhanced.

2. Experimental Methods

2.1. Materials

NaOH (99.0 wt%), KOH (85.0 wt%), Al(OH)3 (99.0 wt%), NH4Cl (99.5 wt%), CuCl2·2H2O (99.0 wt%), Zn(NO3)2·6H2O (99.0 wt%), HNO3 (68.0 wt%), and triethylamine (99.5 wt%) were obtained from Fuchen Chemical Reagent Co., Tianjin, China. Aqueous colloidal silica sol (Ludox JN–30 1.2 g/cm3 30 wt% SiO2) was provided by Qingdao Ocean Chemical Reagent Co., Shandong, Qingdao, China. PEG (average molecular weight of 600), ethanol (99.7 wt%), and trimesic acid (98.0 wt%) were purchased from Shanghai Aladdin Biotechnology Co., Shanghai, China. All of these chemicals were analytical grade. Natural CP was sieved in 400 meshes as seed crystals. Deionized water (resistivity of 18.25 MΩ·cm, 298 K) was supplied by Zhiang–Best Water Purifier, Shanghai, China.

2.2. Synthesis of CP

Firstly, NaOH, KOH Al(OH)3 and deionized water were mixed and transferred into a Teflon-lined stainless steel autoclave, and then stirred at 150 °C for 3 h to get an alumina sol. Subsequently, silica sol, deionized water, 3 wt% of seed, and 7 wt% of PEG were mixed and added into the alumina sol. The molar ratios were as follows: 1.38 Na2O: 1.38 K2O: 11.18 SiO2: Al2O3: 294 H2O. The mixture solution was stirred at room temperature for 2 h and continually transferred into a Teflon-lined stainless steel autoclave at 150 °C for 72 h to crystallize. Afterwards, the products were washed with enormous amounts of deionized water and dried at 120 °C overnight, and named CP–X, where X is the crystallization time (h). In comparison, pure CP was synthesized without any additive PEG.

2.3. Delamination, Ammonization and Ion Exchange of CP-X

Firstly, 0.5 g of the synthesized CP-X was added into 30 mL of 0.5 mol/L Zn(NO3)2 solution, and after stirring for 2 h at room temperature, 15 mL of 2 mol/L HNO3 solution was added and then stirred for 1 h continually.
After being washed with deionized water and dried at 120 °C for 12 h, the obtained products were delaminated, and named CP-X-E. Next, the delaminated CP-X-E was added into 1 mol/L NH4Cl solution and stirred at 80 °C for 2 h, following: 1 g CP-X-E: 100 mL NH4Cl solution. After being washed with deionized water and then dried at 120 °C overnight, this procedure was repeated 10 times, and the final product was named Ammonized CP-X-E.
The ammonized CP-X-E was then added into CuCl2 solution with a concentration of 0.0005, 0.003, and 0.06 mol/L, and then stirred at 80 °C for 2 h, following: 1 g ammonized CP-X-E: 200 mL CuCl2 solution. After being washed with deionized water and dried at 120 °C overnight, this procedure was repeated 1–10 times, and the final product was named Cu-CP-X-E-Y, where Y represents the Cu content (wt%) in the samples. For example, when the X (the crystalline time) equals 72 h, the Y equals 7.3, and the corresponding sample was named Cu-CP-72-E-7.3. Various Cu-CPs and their copper contents are summarized in Table S1 of the Electronic Supplementary Information (ESI) section.

2.4. Synthesis of HKUST-1

HKUST-1 was synthesized on the basis of the reported procedure [24] as follows: 1.539 g CuCl2·2H2O and 1.26 g trimesic acid were dissolved into 75 mL deionized water and 75 mL ethanol for stirring at 50 °C, and, after that, 2.5 mL triethylamine was added into the above solution and stirred for 3 h continually. The powder was cooled down and washed with ethanol to remove unreacted reactant, and it then was centrifuged and dried at 120 °C overnight.

2.5. Synthesis of HKUST-1@CP Composites

A total of 0.3 g Cu-CP was added into 15 mL deionized water and sonicated for 30 min. Meanwhile, the desired amount (according to the Cu contents in Cu-CP at the same molar ratio of synthesis of HKUST-1) of trimesic acid was dissolved into 15 mL ethanol and continually stirred at 50 °C for 30 min. The desired amount of triethylamine was then added into the solution and stirred at 50 °C for 3 h. Finally, the HKUST-1@CP composites were obtained after cooling down, washing, centrifuging, and drying at 120 °C overnight, and named HKUST-1@CP-X-E-Y, correspondingly.
The amounts of the used ligands and the triethylamine were summarized in Table S2, and the schematic diagram for CP preparation was shown in Figure S1 of the ESI section.

2.6. Characterizations

XRD patterns were recorded using the Beijing Purknje General Instrument Corporation XD-6 X-Ray diffractometer with Cu Kα for 4°·min−1 in 2 θ of 5–50° at 36 kV and 20 mA. According to the relative value of the sum of ten diffractive peak intensities in the XRD patterns of the synthetic CPs, namely, indexed as (020), (200), (111), (13–1), (131), (22–2), (42–2), (350), (530), and (061), the crystallinity of the CP synthesized with the crystallized time of 72 h at 150 °C without any additive PEG and normalized as 100%. The relative crystallinity of the other samples could then be calculated on the basis of Equation [25], as follows (1):
C r y s t a l l i z a t i o n   d e g r e e   % = i = 1 10 I i j = 1 10 I j × 100 %
where i = 1 10 I i is the sum of the intensities of the ten peaks of the XRD pattern of the samples synthesized with different crystallization time and j = 1 10 I j which refers to the sum of the intensities of ten peaks of the XRD pattern of the CP. I is the intensity of each diffractive peak, and i or j is a number from 1 to 10, corresponding to diffractive peaks, indexed as (020), (200), (111), (13–1), (131), (22–2), (42–2), (350), (530), and (061), respectively.
The metal ion contents were determined using a Hitachi ZA3300 Polarized Atomic Absorption Spectrometer (AAS). The samples were dissolved in HNO3 solution as follows: 0.02 g sample was dissolved in 0.5 mL 23 mol/L HF solution, and then diluted to 10 mL with HNO3 (Volume fraction 2%). Subsequently, 1 mL of the above solution was diluted to 10 mL with HNO3 (Volume fraction 2%). The morphologies were obtained using SEM (JEOL JEM-220) images with the microscopes at 15.0 and 200 kV and the energy dispersive X-ray spectroscopy (EDS). The IR-Prestige-21 FT-IR spectrum was used to measure the functional groups of the obtained samples in the wavenumber range of 400–4000 cm−1. The TG profiles were received using Perkin–Elmer Pyris Instruments TG–DSC thermal analyzer at a heating rate of 10 °C·min−1 and a N2 flow rate of 20 mL·min−1. The N2 adsorption–desorption isotherms at 77 K as well as the CO2 and CH4 adsorption at 273 K and 298 K were both collected using a Beijing JWGB JW–BK300 gas adsorption instrument. Each sample was outgassed at 120 °C for 6 h before adsorption. The Small Angle X-ray Scattering (SAXS) patterns were performed at the 1W2A station of the Beijing Synchrotron Radiation Facility with the wavelength of the X-ray source of 0.154 nm. The distance from sample to detector was 1600 mm, which was the calibrated reference of the diffraction ring of a standard sample. The scattering vector magnitude was around 0.09 to 3.04 nm−1, and the detector readout noise (dark current) of the Mar165 CCD measured with a mask before the sample measurements was approximately 10 counts per second. The sample was sealed with Scotch tape into a sample cell with 1 mm thickness. The scattering images were collected through the single–frame mode with a “multi-read” of 2 times, and the exposure time was 5 min. The two-dimensional SAXS images were transformed to the one-dimensional data by the Fit2D software (http://www.esrf.eu/computing/scientific/FIT2D, accessed on 25 January 2016) and the S program package [26].

2.7. Breakthrough Experiments

The breakthrough experiments were tested by a BSD-MAB Multi-Component Adsorption Breakthrough Curve Analyzer containing a cylindrical quartz column, a mass flow controller, pressure-control valves, and a mass spectrograph that was used to evaluate the dynamic separation performance of HKUST-1@CPs. The two adsorbing gases had a ratio of 50/50 vol%, and they were introduced into the controlled environment with the total flow rate of 5 mL/min. The desorption gas flow was detected with a BSD-MAB multi-component mass spectrograph. The breakthrough column with the bore size of 4.0 mm containing the adsorbate sample of about 0.1 g was installed inside the ceramic oven, which was located inside the convection oven. The pressure drops across the column and in the outlet of the column were both monitored. The gas flow sent to the analysis section could be adjusted with the valve. The sample was outgassed at 393 K for 2 h under a nitrogen atmosphere with the flow rate of 20 mL/min, and it was then cooled down before the breakthrough experiment.

3. Results and Discussion

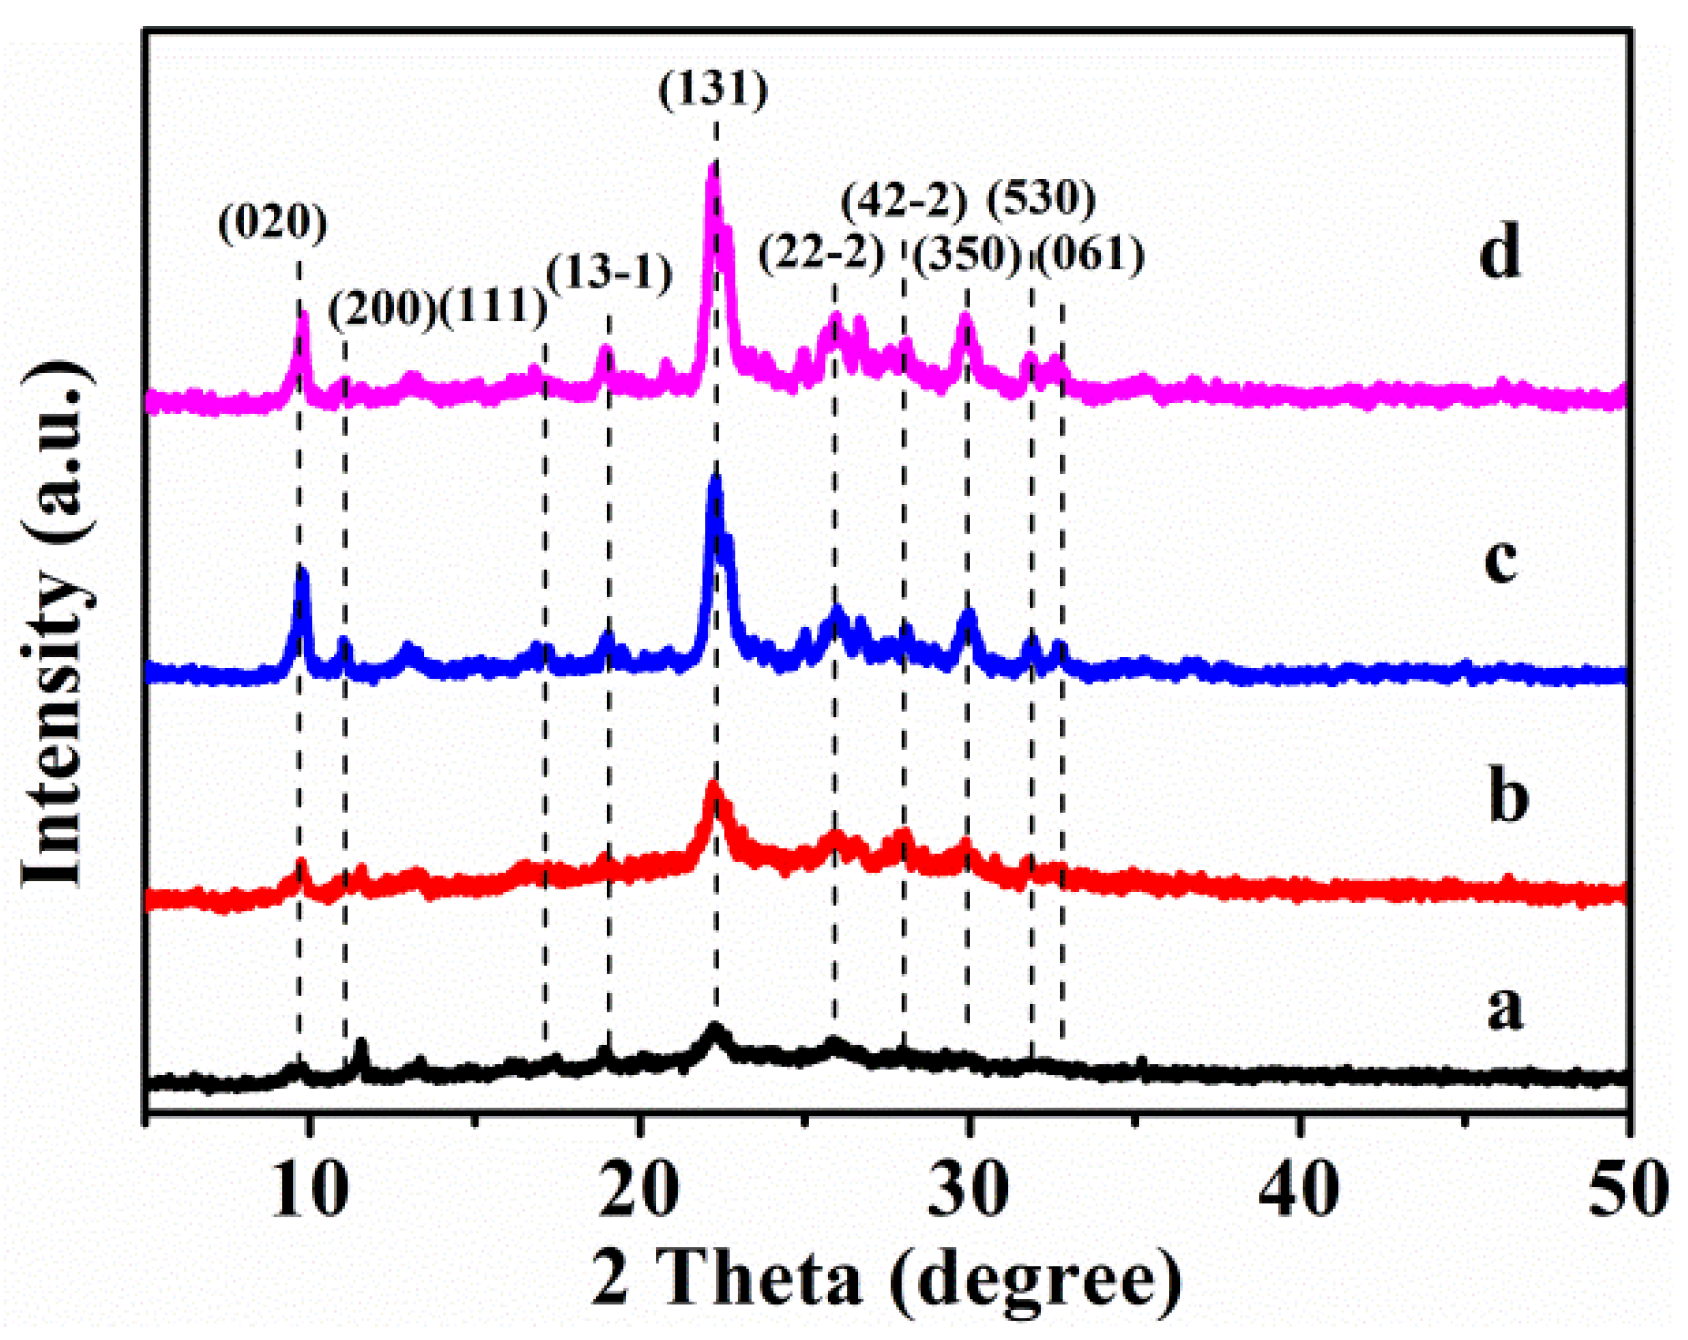
3.1. Structure Characterizations

Figure 1 shows the XRD patterns of the HKUST–1@CPs, and the synthetic CPs and Cu–CPs are shown in Figure S2. As can be seen in Figure S2(Ab,c), both the CP-0 and the CP-24 presented diffractive peaks that were not obvious when the crystallization time was less than 24 h, while Figure S2(Ad) shows that CP-72 exhibited the same intensively diffractive peaks as the conventional CP [27], namely, indexed as (020), (200), (111), (13-1), (131), (22-2), (42-2), (350), (530), and (061), which is indicative of the HEU structures [28]. However, its characteristic peaks (Figure S2(Ad)) not only slightly decreased in intensity but also shifted to a more or less high region in the 2 theta position, as compared with that of the pure CP (Figure S2(Aa)). In contrast, the weakened intensity (200) of the CP-72-E (as shown in Figure S2(Ae)) implied decreases in its long-range order, possibly due to the delamination of the HEU lamellas [29]. Meanwhile, the intensity of other diffractive peaks before and after delaminated CP-72 can be well maintained. As a result, CP lamellas would be disordered in a specific crystal plane after delamination, which would lead to the achievement of delamination. In other words, delamination obviously reduced the long-range order of the CP, and, thus, more surface cations were exposed [29], which may facilitate the formation of MOF with more ligands through coordination in the following section.
Meanwhile, the role of Zn2+ in the delamination process was similar to the principle of the reference [16], namely, the formation of ZnOx(OH)y in the interlayer of CP. Briefly, a consequence of a single Zn2+ inserted interlayer and complete exchange with two Na+ or K+. A significant amount of Zn2+ remained in CP-72-E (0.96 wt%), which is a result of Zn2+ intercalation as well as nucleation and growth of small Zn(O)x(OH)y colloids in between the layer spaces. Beyond that, the (200) diffractive peak located at around 11.17o in the XRD pattern revealed the presence of a HEU structure. After the delamination in the Zn-containing HNO3 solutions, the (200) peak position was not shifted and its corresponding d value was 0.79140 nm, indicating the Zn-containing HNO3 modification had no significant impact on (200) interplanar spacing.
As can be seen in Figure S2B, the not obvious change of the (200) peak position after ammonization and the subsequent Cu2+ exchange indicated that the ion exchange process had no significant influence on (200) interplanar spacing. The presence of the extra diffractive peaks at 2 theta of 16.10 and 15.40 suggested that the appearance of the atacamite and botallackite in Cu-CP-0-E-10.5 and Cu-CP-24-E-10.1 (Figure S2(Ba,b)) were hardly removed via washing and drying [30,31]. Table S1 shows that the Cu content was around 1.64 mmol/g for Cu-CP-0-E-10.5 and 1.58 mmol/g for Cu-CP-24-E-10.1, which is more than the exchangeable cations (equal to total of Na content and K content), meaning that the Cu cations were partially located at the skeleton outside the CP with the low crystallinity.
Regarding the Cu-CPs with different Cu contents (Figure S2(Bc,d)), the position of these diffractive peaks was not a significant change, indicating that the HEU structures of the CPs were well maintained after several ion exchanges. Compared with that of the Cu-CPs with low crystallinity (Figure S2(Ba,b)), the extra diffractive peaks of atacamite and botallackite were hardly observed in Figure S2(Bc,d). The largest Cu content was around 1.14 mmol/g for Cu-CP-72-E-7.3, which was less than that of the exchangeable cations. In addition, the crystallinity decreased with an increase in Cu contents (shown in Table S1), showing 93.3% for Cu-CP-72-E-3.4 and 87.8% for Cu-CP-72-E-7.3.
The XRD patterns of the HKUST-1@CPs with different crystallinity of the CP and different Cu contents are shown in Figure 1. As can be seen in Figure 1a,b, the XRD pattern of HKUST-1@CPs exhibited the structural features of HKUST-1 and the CPs, such as (222) for HKUST-1 and (131) for CP, in which the (222) crystal plane of HKUST-1 (as shown in Figure S2(Af)) nearly overlapped with the (200) of CP [32]. Beyond that, the disappearances of the diffractive peaks of atacamite and botallackite occurred in [email protected] and [email protected] (Figure 1a,b), compared with the corresponding Cu-CPs (Figure S2(Ba,b)). These observations suggested the formation of partial HKUST-1 mixture in the CP with low crystallinity. The diffractive peaks of HKUST-1, meanwhile, were relatively weak, and they cannot even be observed in HKUST-1@CP-72-E, which may be due to its low intensity.
As shown in Figure 1, the crystallinity of the HKUST-1@CPs presented increased tendencies with an increase in the crystallization time of the synthesized CPs, showing 33.9% for [email protected], 44.4% for [email protected], and 97.9% for [email protected], respectively. The crystallinity of [email protected], meanwhile, decreased to 93.6% compared with that of [email protected].
Herein, the formula was defined as follows:
I r = I 200 I 131                  
where I represents the intensity of the diffractive peak, and Ir is the specific value of the intensity of (200) and (131), which denotes the relative intensity of (200).
As a result, the Ir value of CP-72 was 40.0%, lower than that (50.8%) of the pure CP synthesized without additive PEG, implying that the PEG effect was somewhat beneficial to reducing the peak (200) intensity of CP. The interplanar spacing (d) value of (200) crystal plane of CP-72 was 0.7934 nm, as well, which was larger than that of the pure CP (0.7921 nm), further verifying that the PEG effect during the synthesis process of CP was conducive to enlarge the interplanar spacing of CP.
We noted that the Zn content determined by AAS was nearly zero for Cu-CP-72-E-7.3, suggesting that the generation of Zn-MOFs was well avoided on HKUST-1@CPs. The interlayer Zn2+ were fully exchanged after ammonization and Cu2+ exchange, owing to cationic sites of Zn2+ exposed to the outside layers.
The abovementioned samples were further characterized via the SAXS patterns, and their scattering curves are shown in Figure 2 and Figure S3. As can be seen, the linearity of the ln[I(q)] versus ln(q) scattering profile revealed the fractal property of the synthesized CPs [33], whereas the linear range was determined in the range of −1.90 < ln(q) < 0.00, and their corresponding slopes were between −4 and −3.
Accordingly, Figure 2 and Figure S3 indicate that all of the samples possessed surface fractal (Ds) features [34], showing an increasing Ds value from 2.14 for CP-72 (Figure S3d) to 2.33 for CP-72-E (Figure S3e) before and after delamination, but larger than that of pure CP (2.06, as shown in Figure S2a). These results implied that the surfaces of the synthetic CP-72-E became rougher with a higher surface activity [35]. Moreover, an increasing Ds value appeared from 2.07 to 2.33 with an increase in the crystallization time from 0 to 24 h (shown in Figure S3b,c), suggesting the transformation from a smooth surface to a rough and open structure for the resultant CP [10]. After that, the Ds value decreased to 2.14 when the crystallization time was prolonged to 72 h (Figure S3d). Similar results were demonstrated by Zhao et al. [36], indicating that the fractal structures were strongly related to the surface property of aluminosilicate species, which supplied active precursors or colloidal nuclei for promoting crystal growth of the CPs. Radlinski et al. [37] demonstrated that the scattering occurred predominantly between the structure of the sheets and the interlayered matters, while the scattering-derived porosity confirmed a minor contribution from micropores.
As can be seen, the Ds value increased from 2.07 for CP-0 (Figure S3b) to 2.10 for [email protected] (Figure 2a), and from 2.33 for CP-24 (Figure S3c) to 2.40 for [email protected] (Figure 2b). Meanwhile, the scattering profiles of Cu-CPs with different Cu contents are shown in Figure S3f,g. As can be seen, the Ds value increased with the increase in the Cu contents, such as 2.38 for Cu-CP-72-E-3.4 (Figure S3f) and 2.44 for Cu-CP-72-E-7.3 (Figure S3g). Obviously, these results suggested the successful Cu2+-incorporation on CP and further coordination with the ligands. The variation trend of the Ds value of HKUST-1@CPs with different Cu contents was similar to that of the Cu-CPs (as shown in Figure S3f,g), 2.53 for [email protected] (Figure 2c), and 2.60 for [email protected] (Figure 2d).
The PDDF curves of all related samples are shown in Figure 3 and Figure S4. As shown in Figure S4A, the PDDF curves of various CPs lacked the perfect symmetry, particularly that of CP-72 (Figure S4(Ad)), indicating that their particles probably had flake-like morphologies, which may be related to the thinning of the lamellar thickness [38,39]. However, the PDDF curves of the CPs with a short crystallization time of less than 24 h (as shown in Figure S4(Ab,c) had relatively poor symmetry compared with the pure CP (Figure S4(Aa)) and CP-72 (Figure S4(Ad)), possibly due to the formation of the flake-like particles.
The PDDF curves of HKUST-1@CPs with a different crystallization degree of CP and different Cu contents are shown in Figure 3. As can be seen, the symmetry of PDDF profiles of the HKUST–1@CPs were almost the same as that of the synthetic CP (as shown in Figure S4(Ab,c,e)), suggesting that the morphologies of CP were not significantly varied during the ammonization Cu2+ exchange process and even during the formation of HKUST-1.
The PDDF curves of Cu-CPs with different Cu contents, such as Cu-CP-72-E-3.4, and Cu-CP-72-E-7.3, as shown in Figure S4B, show almost the same symmetries of each sample with the same Cu content, namely, [email protected] and [email protected], as shown in Figure 3. These results indicate that the ion exchange and the coordinated process had a not obvious effect on the morphologies of the lamination but that they remarkably influenced the layered stacking mode.
The FT-IR spectra of all related samples in the scanned regions between 400 and 4000 cm−1 are shown in Figure S5. As can be seen in Figure S5c,d, the bands appeared at 1638, 1205, 1062, 793, 605, and 465 cm−1, and were attributed to the features of the synthetic CPs as follows: the band at 1638 cm−1 was due to deformation vibrations of H2O molecules [40]. The peaks around 1062 cm−1 with a shoulder at 1205 cm−1 were assigned to the asymmetric internal T-O-T (T = Si or Al) stretching vibrations of the tetrahedral [41]. The band around 465 cm−1 was associated with internal T-O bending vibrations of the tetrahedral, while the band located at 605 cm−1 was associated with an external tetrahedral double ring [42]. Meanwhile, the peak that appeared at 793 cm−1 represented the stretching vibration modes of the O–T–O groups [41], suggesting the presence of the quartz impurity. Figure S5a,b showed that no absorption peaks at 1205, 1062 and 605 cm−1 were observed within the crystallization time of 0 and 24 h, indicating the absence of the tetrahedral structures in a short crystallization time. The FT-IR spectra of CP-72-E (Figure S5d) was the same as that of CP-72 (Figure S5c), meaning that the skeletal structure of the CP was well maintained after delamination and even by acid washing.
As can be seen in Figure S5g, the HKUST-1 had obvious adsorption peaks in the ranges of 1700–1500 cm–1 and 1500–1300 cm−1, which are attributable to the asymmetric and symmetric stretching modes of the carboxylate functional groups, respectively. In particular, the band at 1451 cm−1 was related to the stretching and deformation modes of the benzene ring, while the C-H bending mode of the benzene ring appeared at around 729 cm−1 [43].
The [email protected] (Figure S5f) had the additional weak signals at around 1451 and 729 cm−1, belonging to Cu-O stretching vibration, in which the oxygen atom of the ligand was coordinated with the Cu2+ [44]. As shown in Figure S5e, the Cu-CP-72-E-7.3 had no adsorption peaks around 1500 cm−1, and other signals of the CP were almost the same. However, the band at around 1400 cm−1 indicated the unexchanged NH4+ of the CP [45]. A weak adsorption peak at around 1400 cm−1 of Cu-CP-72-E-7.3 (Figure S5e) still appeared, as compared with that the CP-72 (Figure S5c). These observations implied that a fraction of NH4+ can hardly be exchanged, although the Cu2+ exchange reached the maximum exchange capacity. On the basis of the abovementioned descriptions, the HKUST-1@CP composites were successfully synthesized.
The N2 adsorption-desorption isotherms of all the related samples are shown in Figure S6. As can be seen, the isotherms of all the CPs exhibited the characteristic type-I curves with an H3-type hysteresis loop at 0.80 < P/P0 < 0.98, indicating the appearances of the silt–shaped mesopores, probably originating from the lamellar accumulation of the CPs [46,47]. Meanwhile, the specific surface area of CP-72 (Figure S6(Ad)) was around 33.9 m2/g, lower than that (42.0 m2/g) of pure CP (Figure S6(Aa)), but almost same as that (35.9 m2/g) of CP-72-E (Figure S6(Ae)) because the introduction of the additive PEG in the synthesis system was beneficial to expanding the lamellar structures of the synthesized CP, while the effect of the delamination process was unobvious. As can be seen in Figure S6(Af,g), all of the Cu-CPs presented almost same the isotherm profiles as CP-72-E (shown in Figure S6(Ae)). The HKUST-1 (shown in Figure S6(Ba)) showed the adsorption capacity plateau close to zero, indicating the non–porous nature of the sample. The adsorption equilibrium was reached at low pressure, and the hysteresis loop did not occur at high pressure [48], indicating type I isotherm.
As can be seen in Figure S6(Be), the [email protected] showed the same features as Cu-CP-72-E-7.3 (shown in Figure S6(Ag)), indicating that the nanopore structures of CP in the composite were well maintained. The BET surface area and the porosity properties of the samples are collected in Table S3, demonstrating that [email protected] and [email protected] (Figure S6(Bb,c)) showed a higher specific surface area and pore volume than [email protected] (Figure S6(Be)). Similarly, the specific surface area and pore volume of [email protected] were lower than [email protected]. Meanwhile, the HKUST-1 presented a higher surface area (516.1 m2/g) and total pore volume (0.28 cm3/g) [49]. Comparably, the surface area of the [email protected] was about 55.2 m2/g, higher than that (39.5 m2/g) of Cu-CP-72-E-7.3 due to the incorporation of HKUST-1 onto CP [50,51]. However, Table S3 shows that the surface area of [email protected] was lower than that of Cu-CP-72-E-3.4, and the possible reason for this is the formation of the sub-units of HKUST-1 as well as the blockage of the micropores in the CP.

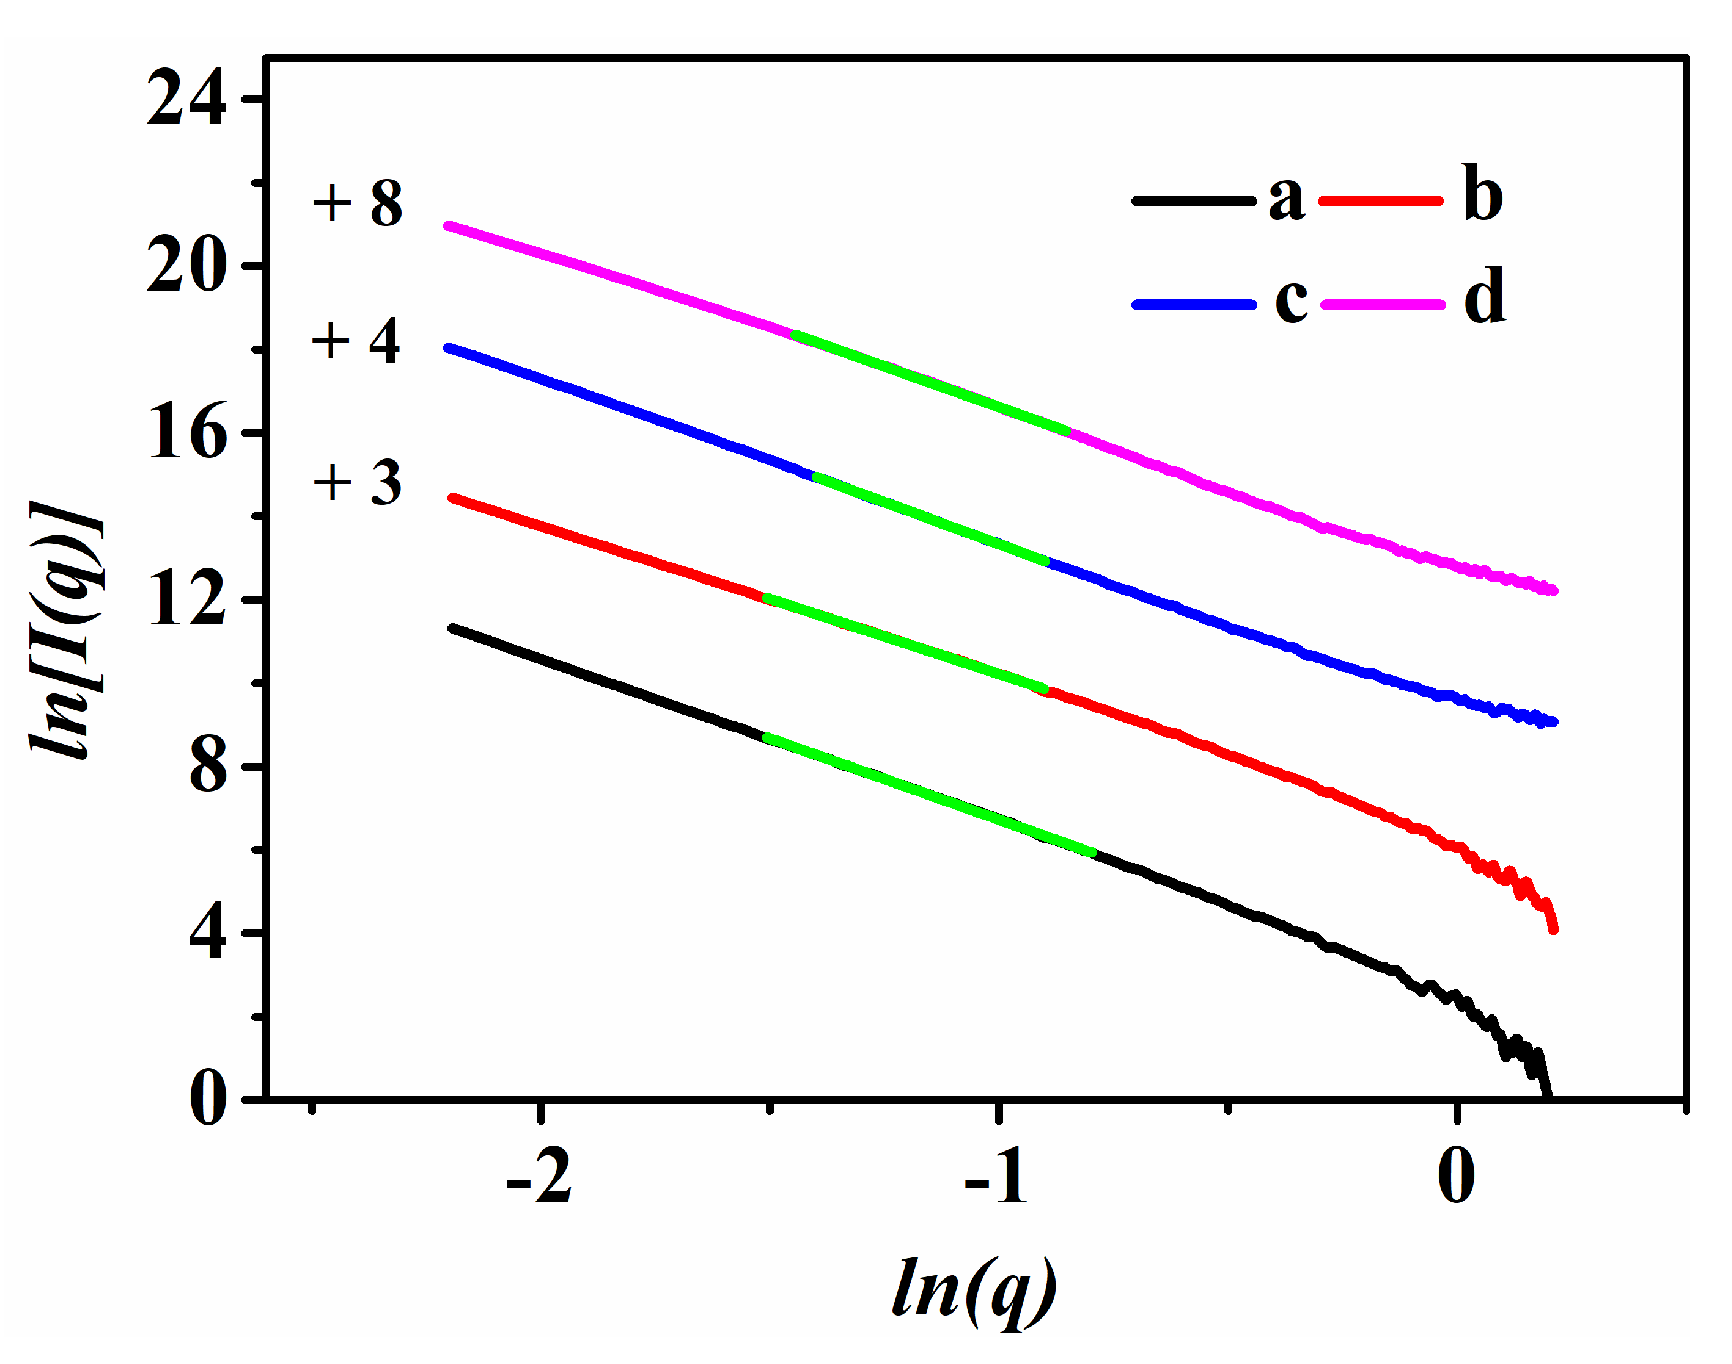
3.2. Crystallization Kinetics of the Synthesized CP with the Additive PEG

In order to explore the role of the additive PEG in the synthesis of the CPs in detail, the effects of the crystallization temperature and the time on the crystalline phase are further elucidated via crystallization kinetics. On the basis of the crystallinity of the CP synthesized with and without additive PEG at different temperatures, the crystallization kinetics performances of the related samples synthesized at 140, 150, and 160 °C are shown in Figure S7. As can be seen, there were three distinct regions in the crystallization kinetics curves, namely: (a) an induction period including the nucleation phase, (b) a growth period involving the rapid growth of crystallites, and (c) a stable period comprising the deceleration of the growth process, similar to the reported demonstration [52]. Herein, the induction time (t0) is defined as the crystallization time that has elapsed in order to achieve the crystallization degree of about 15% [53], as summarized in Table S4. It should be noted that a crystallinity of 15% was taken into account when determining the induction period [54]. Accordingly, the t0 value of the synthesized CP with additive PEG gradually decreased with the enhanced temperature from 50 h at 140 °C (Figure S7(Ba)) to 24 h at 150 °C (Figure S7(Bb)), and 12 h at 160 °C (Figure S7(Bc)). Similar phenomena were also observed in the crystallization kinetics of CP synthesized without PEG (Figure S7(Aa–c)).
Based on the Arrhenius equation, the activation energy (E) during the induction and growth processes was calculated to clarify the crystallization mechanism. The E values and frequency factor (lnAn) for the induction stage (En) values are determined from the nucleation rate (1/t0) and calculated using Equation (3):
l n 1 t 0 = l n A n E n R T
where R is the ideal gas constant, T is the absolute temperature (K), and An is the frequency factor for the induced stage [55]. The growth period (Eg) values are also obtained via Arrhenius Equation (4):
l n k m a x = l n A g E g R T
where Ag is the frequency factor for the growth stage and the growth rate (kmax) is taken as the steepest slope of crystallization curves.
As shown in Table S4, the En values of the synthetic CPs were all larger than their Eg values, suggesting that the nucleation process was a controlled step during the hydrothermal crystallization procedure. Meanwhile, the En value of CP-72 synthesized with additive PEG was 106.2 kJ/mol, higher than that (63.0 kJ/mol) of pure CP obtained without PEG, and we can conclude that there is a restraining effect of the PEG on the formation of the crystal nucleus, possibly due to the PEG encapsulation for silicate and aluminate species hindering their polycondensations. Meanwhile, the Eg value was 31.3 kJ/mol for CP-72, less than that for pure CP (59.8 kJ/mol), indicating the promoting effect of the PEG on the growth procedure of the CP.

3.3. Morphologies and Thermal Analysis

The morphologies of the related samples are shown in Figure 4. As can be seen in Figure 4b, the dispersive CP precursor solution exhibited the colloidal particles with irregular shapes that had a size of around 70 nm can be assigned to the nanoaluminosilicate species [56]. Subsequently, the particle sizes of CP-24 were increased to 3 μm, besides the appearances of the almost flake-like morphology (Figure 4c). When the crystallization time was further prolonged to 72 h, the random and lamellar accumulations of CP-72 were present with a flower-like morphology in sizes of around 5 μm (Figure 4d), which is a noticeable difference from that of pure CP (Figure 4a).
CP-72 (Figure 4d), meanwhile, had an irregularly lamellar structure in length of 1.5 μm and width of 1.1 μm, which was smaller than that (length of 3.0 μm and width of 2.0 μm) of pure CP (Figure 4a). These results suggested that the PEG effect was useful to shrinking the lamellar size of the CP. Additionally, the lamellar size of CP-72-E (Figure 4e) was 1.2 μm in length and 0.8 μm in width, smaller than that of CP-72 (Figure 4d). The possible reason for this is that the acidity of the Zn-containing HNO3 solution caused the dissolutions of the lamellas of the synthetic CPs. Additionally, Figure 4j shows the agglomerated particles of HKUST-1 of a size around 0.5 μm, similar to the result reported by Majano et al. [57]. As can be seen in Figure 4f,g, HKUST-1@CPs presented an obvious HKUST-1 and the amorphous particles, which again confirms demonstrations of XRD patterns (as shown in Figure 1a,b).
The lamellas of CP-72-E (Figure 4e), Cu-CP-72-E-7.3 (Figure 4i), and [email protected] (Figure 4h) were almost the same size, around 1.0–2.0 μm in length and 0.5–1.5 μm in width. By contrast, unobvious HKUST-1 particles (Figure 4j) appeared in both [email protected] (Figure 4g) and [email protected] (Figure 4j). Therefore, we speculated that HKUST-1 may grow mainly along the highly dispersed lamellar surfaces of the CP, which depend on the Cu2+ location distributed in CP.
As described in the Experimental section, after each ion exchange process between the CPs and Cu2+ was finished, an enormous amount of deionized water was used to wash the obtained solids so as to remove the excess Cu2+ cations adsorbed on the CP surfaces. However, the adsorbed Cu2+ ions on the low crystallinity CP were still not completely removed, leading to the generations of HKUST-1 deriving from coordination between the ligands and part of Cu2+ ions in HKUST-1@CPs (as shown in peak (222) of Figure S8(Aa,b)), besides the appearances of atacamite and botallackite in the Cu2+-exchanged CPs (as shown in peak (011) of Figure S8(Ba) and peak (100) of Figure S8(Bb)) [30,31].
However, HKUST-1 in the HKUST-1@CPs with a high crystallization degree was difficult to observe in the XRD patterns and SEM measurements, and one of the main reasons was the fact that the exchanged Cu2+ ions, as the central ion, were located in the equilibrium cation position of the CP, and, therefore, the particle size of the synthesized HKUST-1 was very small. A similar report was made by Wu et al. [58], who synthesized the MOFs@zeolites (NaY and HZSM-5) via coordination between the exchanged Zn2+ and the ligands (2-methylimidazole and its derivatives), though the sub-units of the MOFs distributed in Zn-exchanged Zeolites were difficult to observe via XRD patterns, SEM, and TEM measurements.
As described in the Introduction, the delamination process usually follows the synthesis process, which improves the delamination performance. In the present work, the layered structure expansions and the lamellar disorder arrangements of the synthesized CPs were firstly prepared via adding PEG in the hydrothermal synthesis system, and then the delamination process was performed via Zn-containing acid washing under mild conditions.
As can be seen in Figure S9, the weight loss profiles could be divided into three stages: the first one occurred when the temperature was up to 300–500 K, which was attributed to desorption of the physisorbed water, and the second happened during the temperature range of from 500–800 K, which was assigned to the chemisorbed water and possible decompositions of the ligands of HKUST-1 [59]. The weight loss of pure CP (Figure S9a), CP-72 (Figure S9b), CP-72-E (Figure S9c), and Cu-CP-72-E-7.3 (Figure S9d) at 300–500 K was 9.1, 8.1, 8.8, and 7.7%, respectively. Those at 500–800 K were 0.6, 0.8, 2.0, and 2.3%, respectively. The last one of nearly 1% at 800–1000 K was due to dihydroxylation and decomposition of the residual ligands of HKUST-1 [60]. These observations suggested that the impacts of the Cu2+ exchange and post-treatment (delamination and acid washing) on the thermal stability of the CP were not obvious [61].
The TG curve of HKUST-1, meanwhile, as shown in Figure S9f (insert), showed that the first weight-loss stage appeared between 300 and 400 K was 21.8%, due to desorption of the physisorbed water. The second one between 400 and 550 K belonged to the dehydration of hydrated copper cations and the physical desorption of the solvent [60]. The weight loss in the temperature range of around 550–700 K was attributed to decompositions of the ligands of HKUST-1 [59]. In particular, it was found that the weight loss of CP-72, HKUST-1, and [email protected] at 500–800 K was increased from 0.6% to 2.3%, while that of the first stage (300–500 K) was nearly unexchanged, compared with that of CP-72. Similarly, the weight loss of [email protected] (Figure S9e) at 300–500 K was approximately 8%, almost the same as that of pure CP (Figure S9a), and its weight loss of around 2.3% at 500–600 K was ascribed to the dehydration of hydrated copper cations and the physical desorption of the solvent. The weight loss of around 5.5% at 600–1000 K belonged to the decompositions of the ligands of HKUST-1. It is actually difficult for us to verify that the thermal stability of HKUST-1 located on the CP was improved.
As in the abovementioned demonstrations, the crystal size of the synthesized HKUST-1 was very small, resulting in its amount being difficult to quantify. In this regard, the amount of the synthesized HKUST-1 was estimated on the basis of the TG data of Cu-CP-72-E-7.3 (Figure S9d), HKUST-1 (Figure S9f), and [email protected] (Figure S9e), and the HKUST-1 amount in [email protected] was estimated to be about 8.3%, much lower than the theoretical value (about 23%, assuming that all of the Cu2+ ions distributed on CP were coordinated with ligands). The probable reason for this is that the steric hindrance effect strongly limited the coordination of most of Cu2+ ions on CP with the ligands, even though the CP lamellas were disordered after delamination.
The effective mechanism of PEG essentially restrained the formation of the crystal nucleus but promoted the growth procedure of the CPs, leading to the reduction of their peak (200) intensity and the decrease in the lamellar size of the synthesized CP.

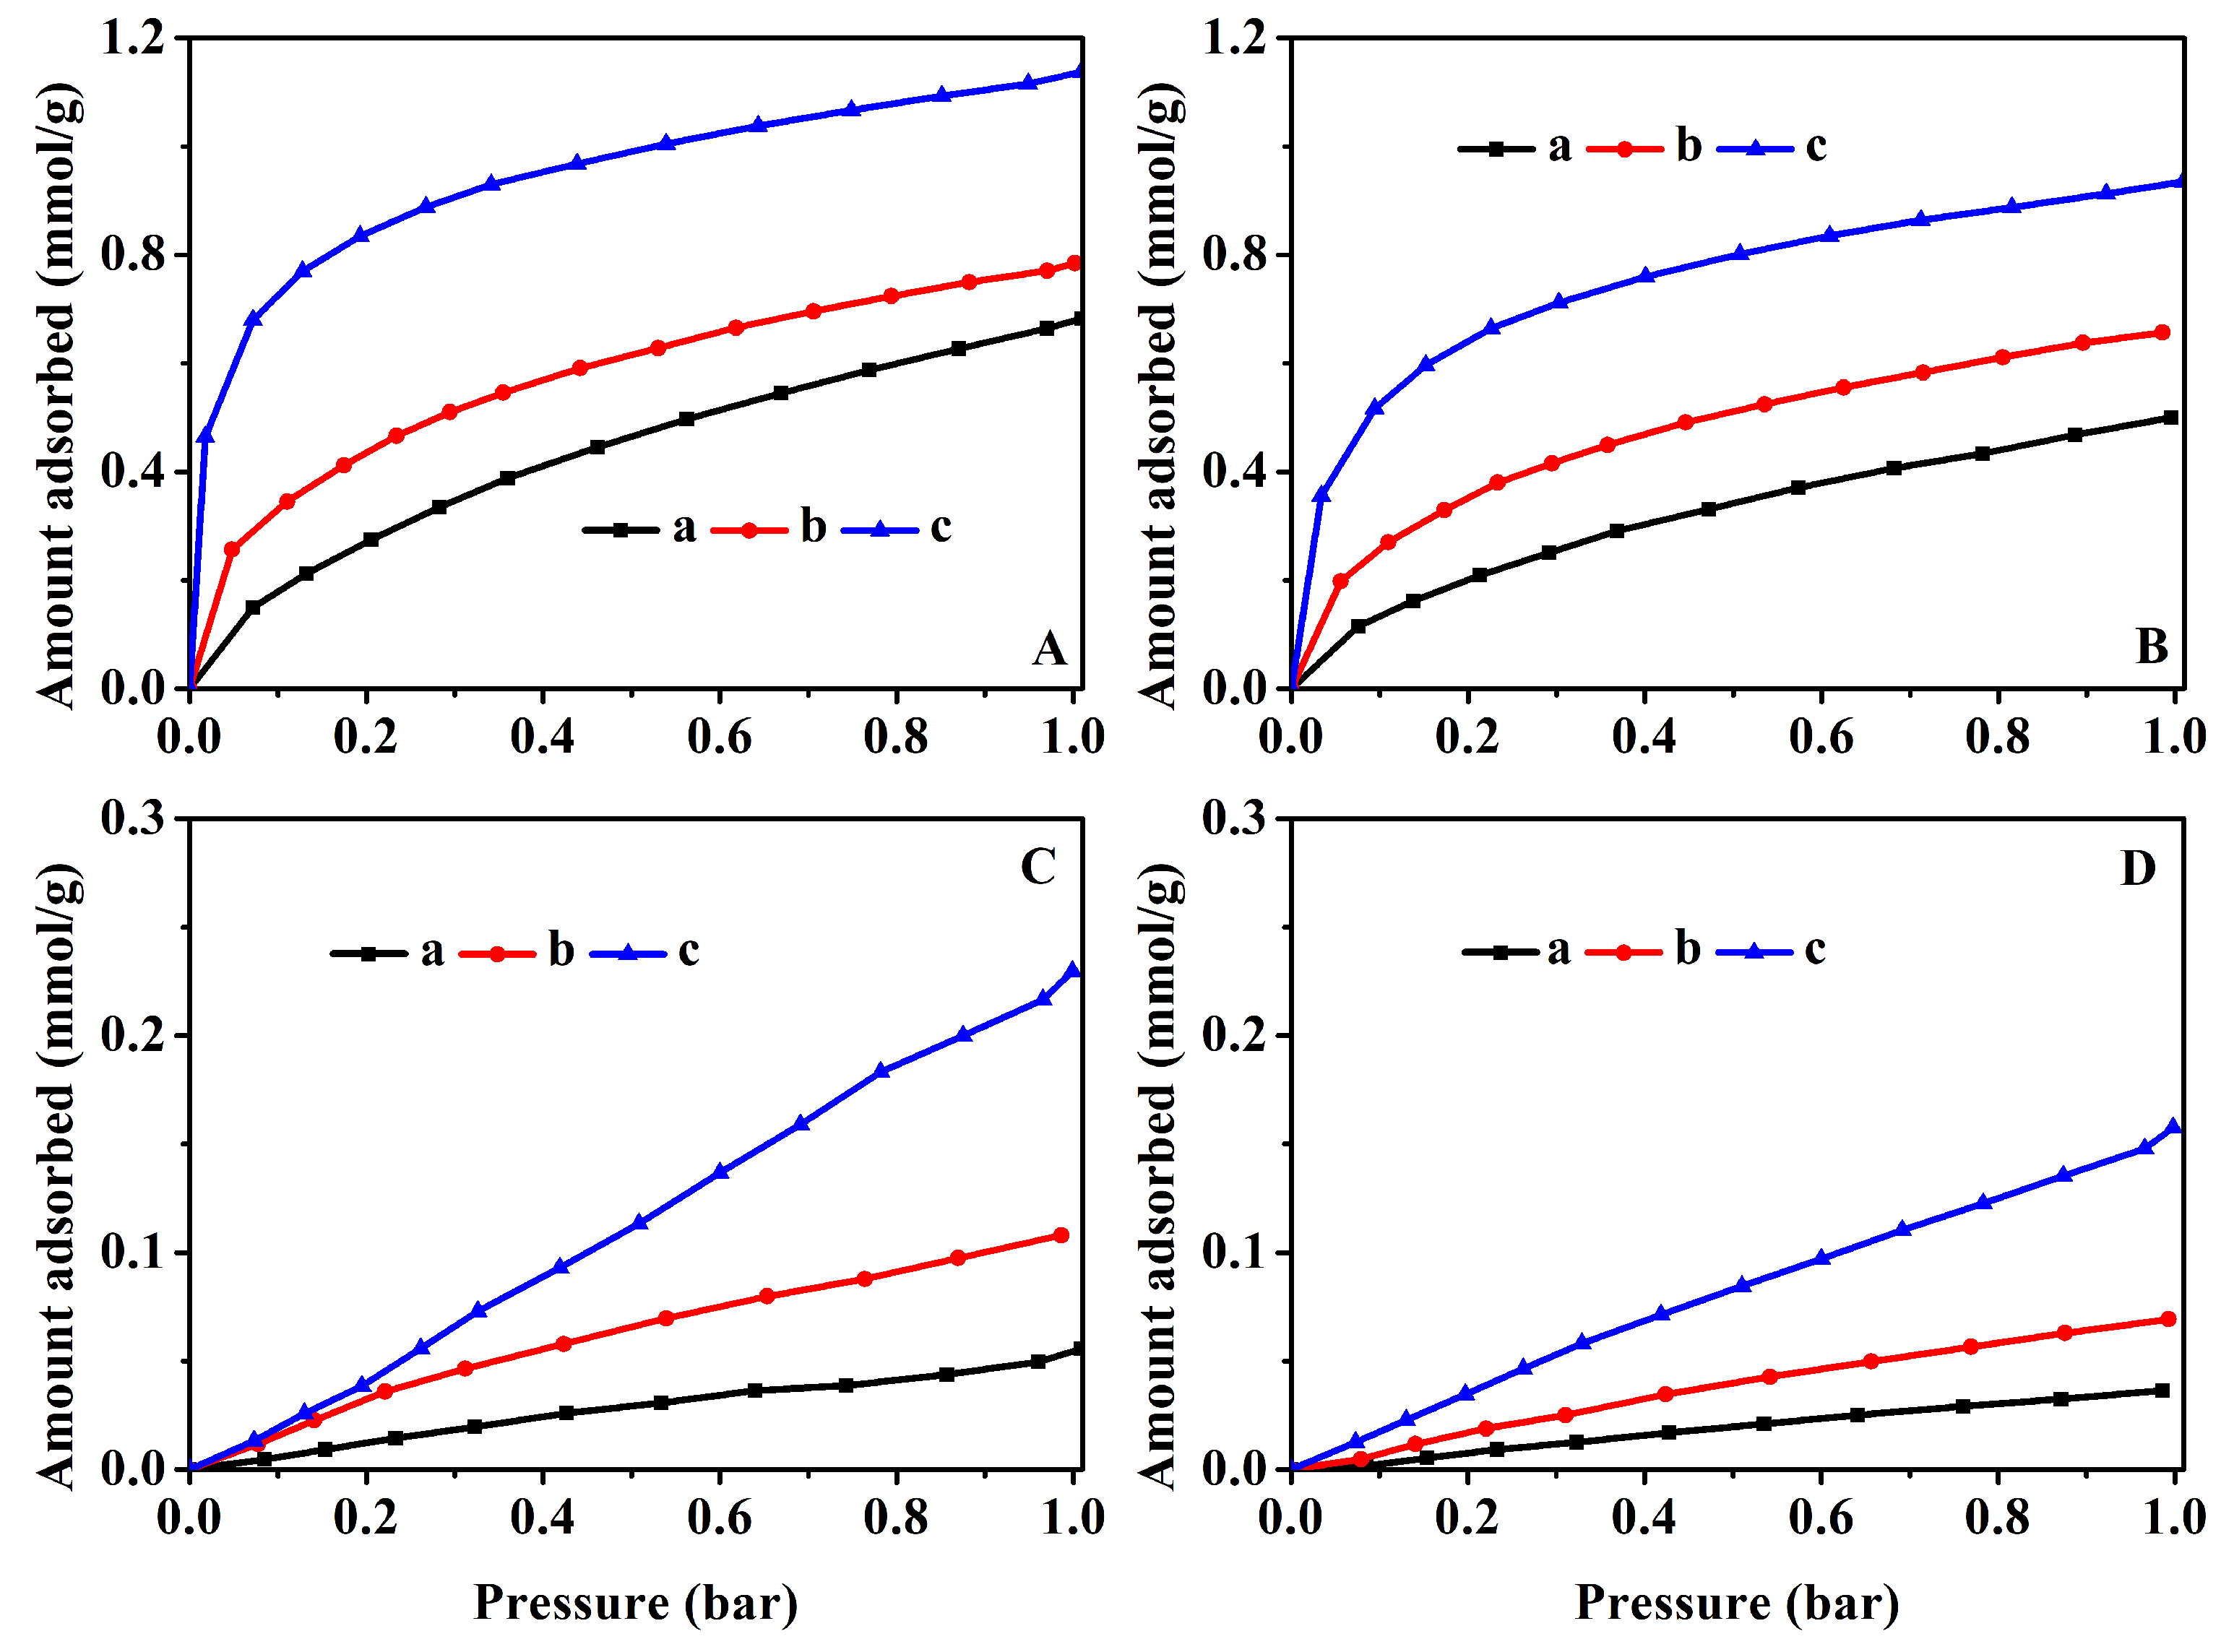
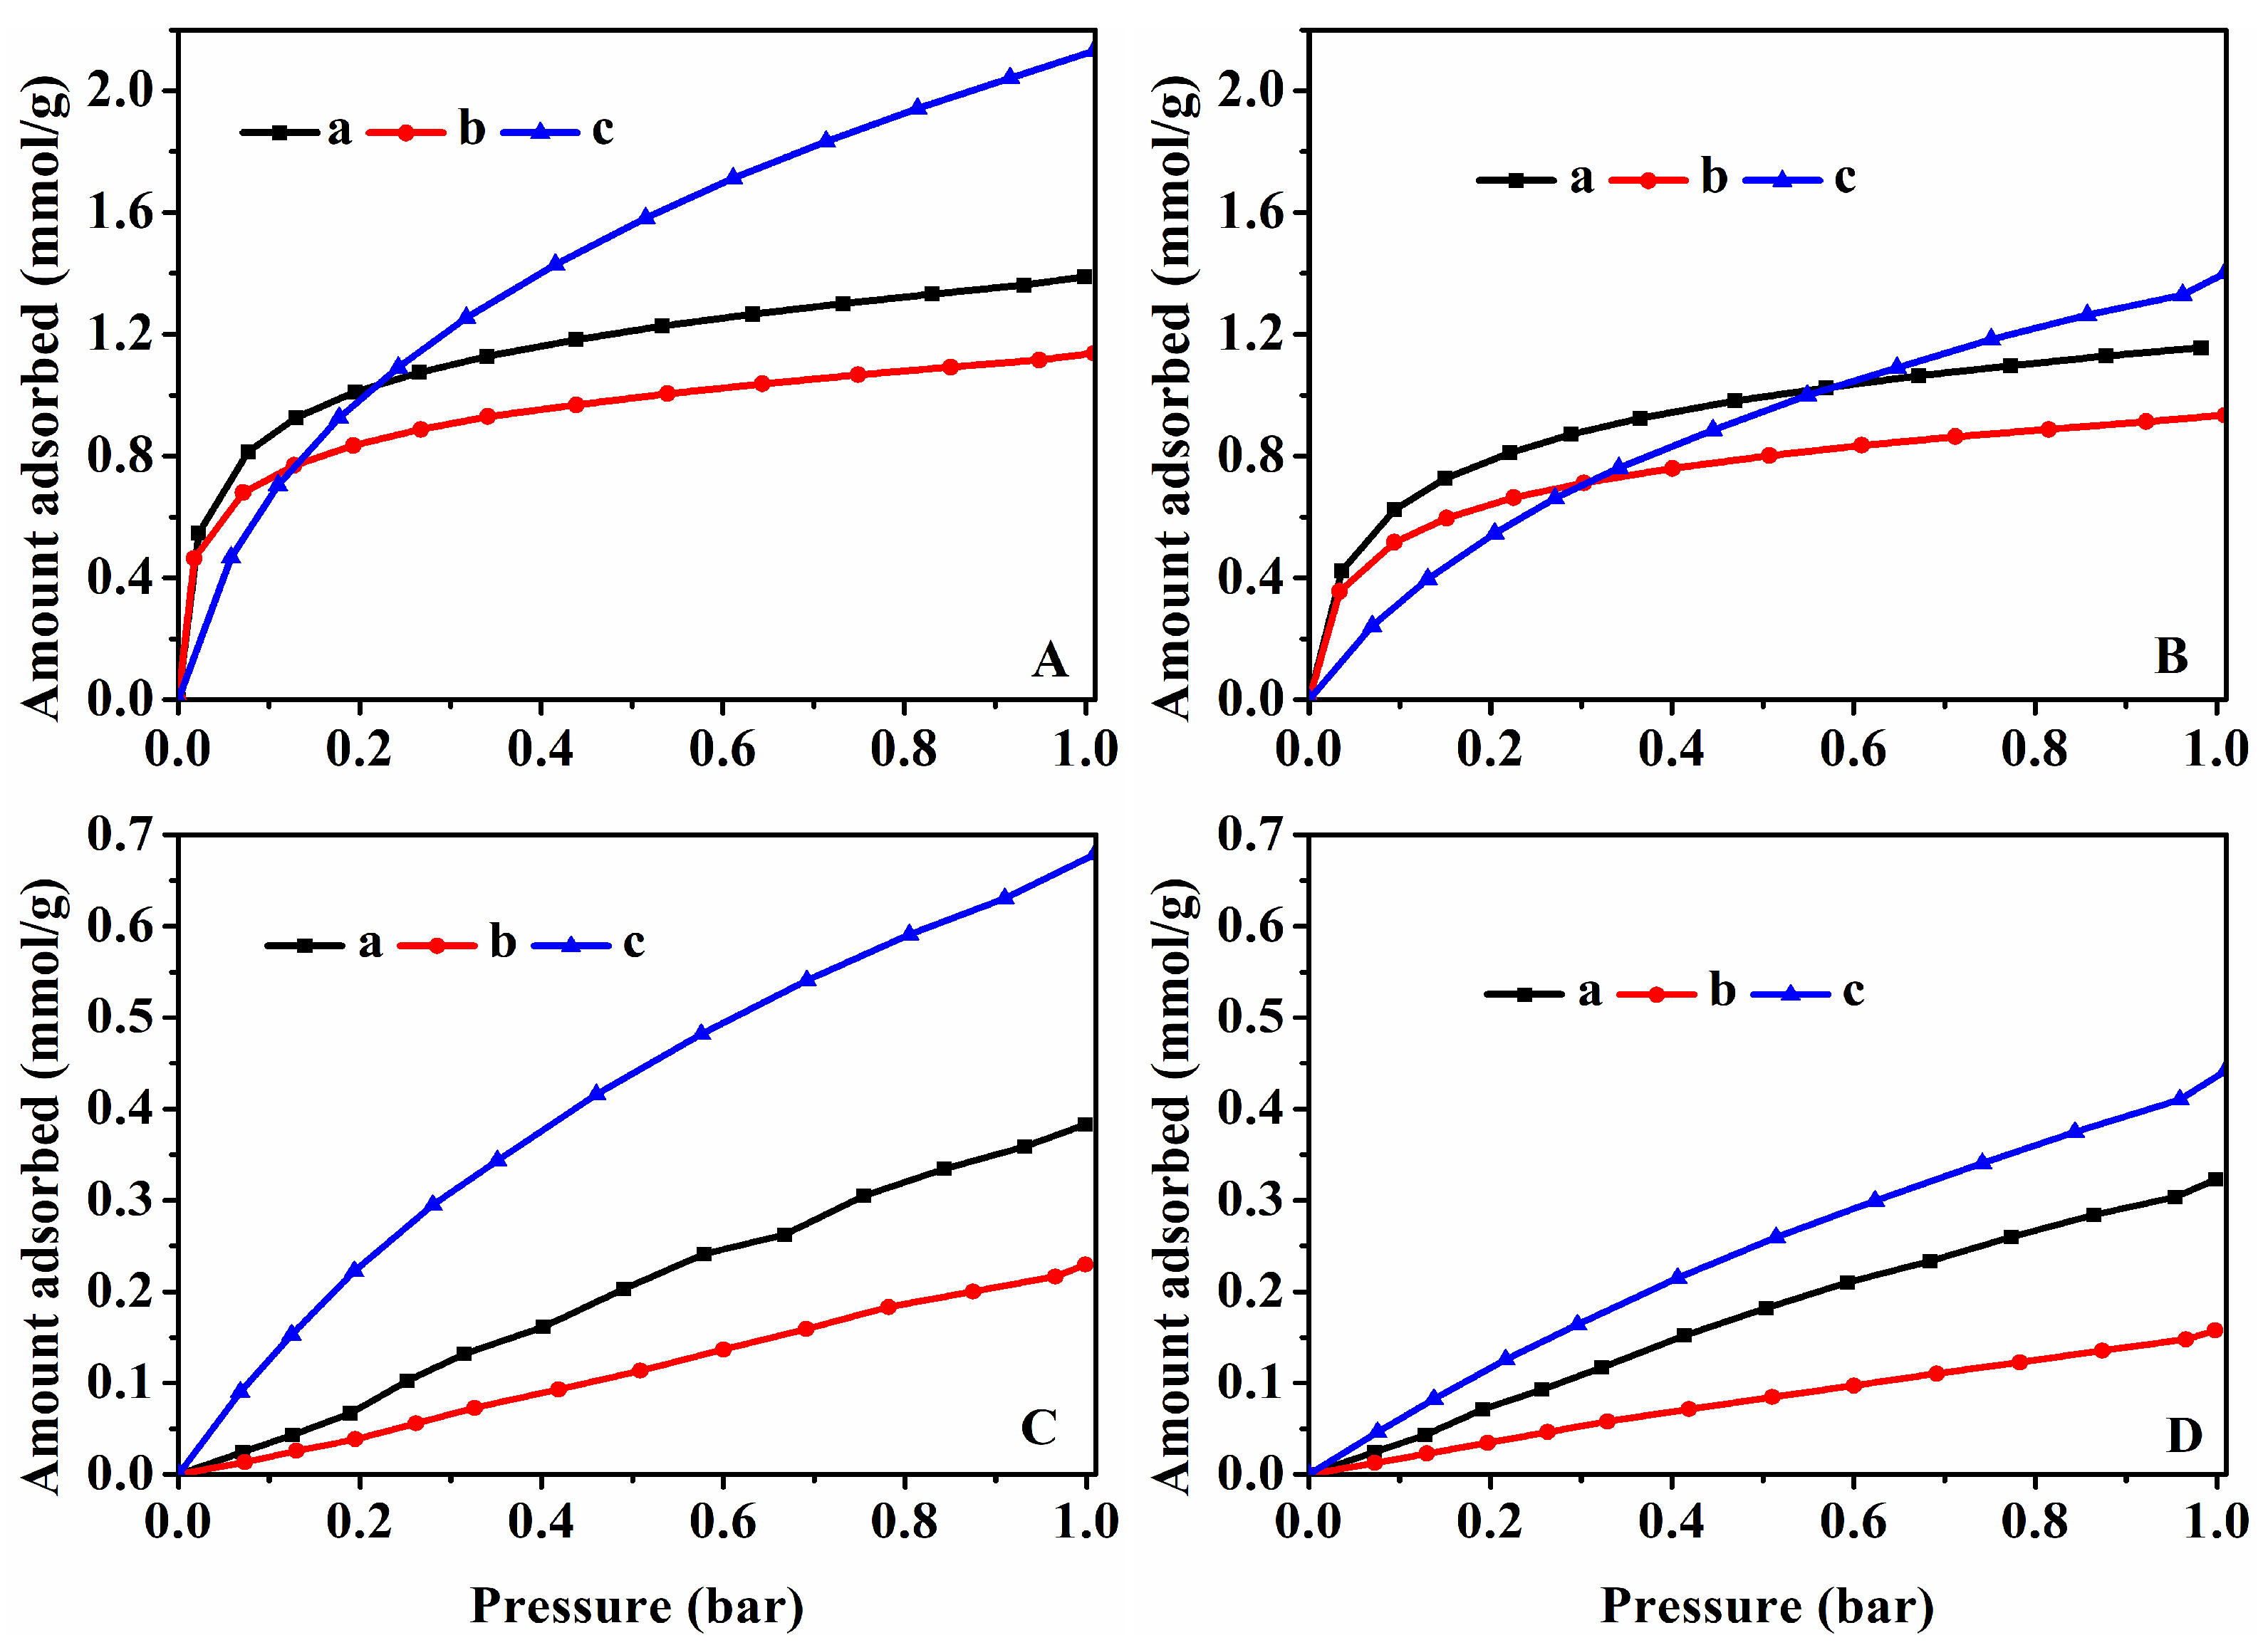
3.4. CO2 and CH4 Adsorption Performances

Figure 5, Figure 6, and Figure S10 all show the CO2 and CH4 equilibrium adsorption capacities and isotherms of the related samples. As can be seen in Figure 5A,C, the CO2 and CH4 adsorption capacity of the HKUST-1@CPs increased gradually with the increase in the crystallinity of the CP, namely, [email protected] < [email protected] < [email protected], showing 0.68, 0.78, and 1.14 mmol/g for CO2 at 273 K (Figure 5(Aa–c)) and 0.06, 0.11, and 0.23 mmol/g for CH4 at 273 K (Figure 5(Ca–c)), respectively, which is the same phenomena at 298 K as the one shown in Figure 5B,D.
Figure S10A,C presented the CO2 and CH4 adsorption capacity of the CPs synthesized at 273 K, showing the enhanced tendencies with the increased crystallinity, from 0.80 and 0.02 mmol/g for CP-0 to 1.39 and 0.31 mmol/g for CP-72, respectively. The similar phenomena at 298 K were also shown in Figure S10B,D. Meanwhile, as shown in Figure S10A–D, we noticed that the CO2 and CH4 adsorption capacity at 1 bar at both 273 K and 298 K was decreased in the following order: pure CP > CP-72 > CP-72-E, suggesting that the effects of the disordered lamellar morphologies of the synthetic CPs on the CO2 and CH4 adsorption performances were not obvious.
However, as shown in Figure 6A,C, the CO2 and CH4 adsorption capacity of [email protected] presented 1.39 and 0.38 mmol/g at 273 K, more than that (1.14 and 0.23 mmol/g) of [email protected]. The similar results at 298 K were also shown in Figure 6B,D. Meanwhile, Figure S10E,G showed that the CO2 and CH4 adsorption capacity of Cu-CP-72-E-3.4 at 273 K were 1.25 and 0.28 mmol/g, lower than that (0.84 and 0.21 mmol/g) of Cu-CP-72-E-7.3, respectively. The similar observations at 298 K were also shown in Figure S10F,H.
As is well known, the dynamic diameter is 0.38 nm for CO2 and 0.33 nm for CH4, besides their almost same polarizability. However, the quadrupole of CO2 is 4.30 × 10⁻²⁶ cm2, while the quadrupole of CH4 is almost zero. Obviously, the interaction force of CO2 with the synthesized CPs is stronger than that of CH4, which is conducive to the enhancements of its adsorption capacity and the improvement of its adsorption selectivity [62]. Meanwhile, Xin et al. proposed the possible CO2 adsorption mechanism on HKUST-1 [63], suggesting the appearance of two adsorption sites: one is the small pore cages composed of a ring of six metal dimers and six trimesate groups, and the other is the open Cu ions. Spanopoulos et al. further elucidated that the adsorption performances of CO2 mainly occurred at the two sites stated above, while that of CH4 only occurred at the open Cu structures [64].
Koyama et al. proposed four kinds of the exchangeable cation positions, namely, M(l), M(2), M(3), and M(4), which are distributed in different channels [65]. In detail, M(l) is located in channel A and is coordinated by oxygen atoms of two frameworks and five water molecules. M(2) appeared in channel B and is adjacent to the oxygen atoms of three frameworks and five water molecules. M(3) centered on channel C is nearly the center of its eight-member ring. Similar to M(l), M(4) appeared in channel A at a center of inversion, and can be coordinated with six water molecules occupying the vertices of an octahedron. The M(4) position may accommodate these excess atoms [65,66,67]. As reported by Garcia-Basabe et al. [68], most of the Cu2+ on CP were located in the center of channel A and channel B of two extra framework sites, indicating that the Cu2+ presence was mainly distributed at M(1) and M(4). They further demonstrated that an additional new site was found in channel A at distances of 0.145 and 0.165 nm from the M(1) and M(4) sites, originating from the Cu2+ coordination with water molecules.
In the present work, our results seem to be related to the Cu2+ positions distributed on the synthetic CPs and the adsorption sites, depending on the crystallization of the synthetic CPs and the possibilities of the coordinated HKUST-1.
Additionally, the CO2 and CH4 adsorption capacities of Cu-CP-72-E-7.3 at 273 K and 298 K (shown in Figure S10(Eb,Fb,Gb,Hb)) were even lower than that of CP-72-E (shown in Figure S10(Ae,Be,Ce,De)). These phenomena were mainly because of the hydrochloric acid generation deriving from the Cu2+ hydrolysis leading to the destruction of the adsorption sites, which is consistent with the decrease in CP crystallinity that occurs with the increase in Cu content (as shown in Table S1).
On the basis of the abovementioned results, the CO2 and CH4 isosteric adsorption heat of all related samples was calculated via the Clausius–Clapeyron equation, seen here in Equation (5):
l n P 1 P 2 = Δ H v a p R 1 T 1 1 T 2
where P1 and P2 represent the pressure under the temperatures of T1 and T2, ΔHvap represents the isosteric adsorption heat of CO2, and R represents the gas constant (8.314 J·mol−1·K−1) [69]. The Freundlich–Langmuir (F-L) equation, which is Equation (6) below, was used to fit the relationship between adsorbed amounts and relative pressure under the same adsorbed amounts:
Q = q s K C n 1 + K C n
where Q is the adsorbed amount under different relative pressure (mmol/g), qs is the molar adsorption capacity of the system when the Q is nearly equal with an increase in relative pressure (mmol/g), K and n are F-L constants, and C is the relative pressure.
The isosteric heat of CO2 and CH4 adsorption for various samples is shown in Figure 7. As can be seen there, the isosteric heats of CO2 and CH4 adsorption were less than zero, indicating that the CO2 and CH4 adsorption belonged to an exothermic process [70]. In detail, the CO2 adsorption heats of [email protected] (Figure 7(Aa)) and [email protected] (Figure 7(Ab)) with low crystallinity of the CP were much higher than that of [email protected] with the high crystallinity (Figure 7(Ad)), while the CH4 adsorption heats of [email protected] (Figure 7(Ba)) and [email protected] (Figure 7(Bb)) with low crystallinity of the CP were lower than that of [email protected] with the high crystallinity (Figure 7(Bd)).
The absolute value of the CO2 isosteric heat of [email protected] and [email protected] (shown in Figure 7(Ac,d,Bc,d)) with different Cu contents was higher than that of CH4, indicating a stronger CO2 adsorption. Obviously, these results suggest that the CO2 adsorption is preferential compared with that of CH4. Meanwhile, the absolute values of the isosteric heat of all samples were less than 40 kJ/mol, indicating that the behaviors of the CO2 or CH4 adsorption belonged to the physical adsorption [71].
To further verify the separation performance of CO2/CH4 of the samples, the selectivity at 273 K and 298 K was shown in Figure 8. As can be seen in Figure 8A, [email protected] and [email protected] with low crystallinity of CP (Figure 8(Aa,b)) showed higher selectivity owing to their low CH4 adsorption capacity, but their low CO2 adsorption capacity may limit their applications in CO2 and CH4 separation. The similar results of their CO2/CH4 selectivity at 298 K were also shown in Figure 8(Ba,b).
Meanwhile, the effect of the coordination of HKUST-1 with Cu-CPs on the separation performance of CO2/CH4 and the corresponding selectivity at 273 K and 298 K was evaluated. As shown in Figure 8(Ac–e,Bc–e), the selectivity of [email protected] was lower than that of [email protected] but higher than that of the prepared HKUST-1 at both 273 K and 298 K. Obviously, one of the main reasons for this is due to the generation of HKUST-1 in the HKUST-1@CPs, with an increase in the Cu content. The CO2/CH4 selectivity of various samples at different temperatures under the pressure of 1 bar was collected in Table 1. Comparably, the reported selectivity of HKUST-1 depended on the prepared methods [24,59,72].

3.5. Breakthrough Performance

Taking [email protected] as an example, Figure 9 showed the breakthrough profiles of the binary mixtures (CO2 and CH4) at 50% CO2 concentration (by volume) through the fixed bed packed with the sample pellets at 298 K. As can be seen, the relationships between C/C0 versus time, where C and C0 were the volumetric concentration of CO2 or CH4 in the outlet and inlet stream, showed that the purified CH4 was detected in the outlet gas flow but that CO2 was still trapped in the column when the mixture of CO2 and CH4 flowed into all of the column, thereby showing the highly adsorbed CO2 performance of the prepared HKUST-1@CP as well as the adsorptive separation properties between the CH4 and CO2 [73,74].

4. Conclusions

The HKUST-1@CPs with randomly lamellar morphologies were successfully synthesized via the PEG-additive hydrothermal route and the Cu2+ coordinated routes with trimesic acid. Various characterizations demonstrated that the additive PEG had a strong hindering effect on the formation of the crystal nucleus of CPs but a promoting effect on their growth, although their nucleation process was a controlled step in the crystallization duration. HKUST-1@CP with various Cu2+ contents or different crystallizations presented the enhancements of the adsorptive separation for CO2 and CH4 as compared with Cu2+ exchanged CPs and synthesized HKUST-1. In particular, the higher CO2/CH4 selectivity and better breakthrough performances demonstrated that the obtained HKUST-1@CPs may be a good candidate for further study on potential applications in gas separation.

Supplementary Materials

The following supporting information can be downloaded at: https://www.mdpi.com/article/10.3390/nano13121860/s1. Figure S1. Schematic of the PEG-assisted synthesis of CP via crystallization and delamination process. Figure S2. XRD patterns of (A): (a) pure CP, (b) CP-0, (c) CP-24, (d) CP-72, (e) CP-72-E, and (f) HKUST-1 and (B): (a) Cu-CP-0-E-10.5, (b) Cu-CP-24-E-10.1, (c) Cu-CP-72-E-3.4, and (d) Cu-CP-72-E-7.3. Figure S3. SAXS patterns of (a) pure CP, (b) CP-0, (c) CP-24, (d) CP-72, (e) CP-72-E, (f) Cu-CP-72-E-3.4, and (g) Cu-CP-72-E-7.3. Figure S4. The pair distance distribution function (P(r)~r) profiles of (A): (a) pure CP, (b) CP-0, (c) CP-24, (d) CP-72, and (e) CP-72-E, and (B): (a) Cu-CP-72-E-3.4, and (b) Cu-CP-72-E-7.3. Figure S5. FT-IR spectra of (a) CP-0, (b) CP-24, (c) CP-72, (d) CP-72-E, (e) Cu-CP-72-E-7.3, (f) [email protected], and (g) HKUST-1. Figure S6. N2 adsorption-desorption isotherms of (A): (a) pure CP, (b) CP-0, (c) CP-24, (d) CP-72, (e) CP-72-E, (f) Cu-CP-72–E-3.4, and (g) Cu-CP-72-E-7.3 and (B): (a) HKUST-1, (b) [email protected], (c) [email protected], (d) [email protected], and (e) [email protected]. Figure S7. Crystallization kinetic profiles of the pure CP (A) and CP-X (B) at different temperatures: (a) 140 °C, (b) 150 °C, and (c) 160 °C. Figure S8. XRD patterns of A: (a) [email protected], (b) [email protected], (c) [email protected], and (d) [email protected]. B: (a) Cu-CP-0-E-10.5, (b) Cu-CP-24-E-10.1, (c) Cu-CP-72-E-3.4 and (d) Cu-CP-72-E-7.3. Figure S9. TG curves of (a) pure CP, (b) CP-72, (c) CP-72-E, (d) Cu-CP-72-E-7.3, (e) [email protected], and (f) HKUST-1. Figure S10. Equilibrium adsorbed isotherms of the samples using CO2 as adsorbate at 273 K (A) and 298 K (B), respectively; CH4 as adsorbate at 273 K (C) and 298 K (D), respectively: (a) pure CP, (b) CP-0, (c) CP-24, (d) CP-72, and (e) CP-72-E; CO2 as adsorbate at 273 K (E) and 298 K (F), respectively; CH4 as adsorbate at 273 K (G) and 298 K (H), respectively: (a) Cu-CP-72-E-3.4, and (b) Cu-CP-72-E-7.3. Table S1. Summaries of the prepared conditions and various parameters of the obtained Cu-CPs. Table S2. Summaries of the amounts of the used ligand and triethylamine. Table S3. Summaries of the textural parameters of the related samples. Table S4. Summaries of various kinetic parameters during CP crystallization.

Author Contributions

Conceptualization, X.W. and J.S.; Methodology, X.W. and J.S.; Formal analysis, X.W. and J.S.; Investigation, M.Z., C.W., M.L. and J.Z.; Data curation, X.W.; Writing—Original draft preparation, M.Z., C.W., M.L. and J.Z.; Visualization, X.W.; Supervision, J.S. All authors have read and agreed to the published version of the manuscript.

Funding

This research was funded by the National Natural Science Foundation of China (21878006).

Data Availability Statement

The data presented during the study is available on request from the corresponding author.

Acknowledgments

We gratefully acknowledge Zhihong Li, working at the Beijing Synchrotron Radiation Facility, for a fruitful discussion on SAXS measurements and fractal dimension.

Conflicts of Interest

The authors declare no conflict of interest.

References

  1. Cakicioglu-Ozkan, F.; Ulku, S. The effect of HCl treatment on water vapor adsorption characteristics of clinoptilolite rich natural zeolite. Microporous Mesoporous Mater. 2005, 77, 47–53. [Google Scholar] [CrossRef] [Green Version]
  2. Leggom, P.J.; Ledésert, B.A.; Day, J. Organo-zeolitic treatment of mine waste to enhance the growth of vegetation. Eur. J. Miner. 2010, 22, 813–822. [Google Scholar] [CrossRef]
  3. Zaremotlagh, S.; Hezarkhani, A. Removal of textile dyes from aqueous solution by conducting polymer modified clinoptilolite. Environ. Earth Sci. 2014, 71, 2999–3006. [Google Scholar] [CrossRef]
  4. Kouvelos, E.; Kesore, K.; Steriotis, T.; Grigoropoulou, H.; Bouloubasi, D.; Theophilou, N.; Tzintzos, S.; Kanelopoulos, N. High pressure N2/CH4 adsorption measurements in clinoptilolites. Microporous Mesoporous Mater. 2007, 99, 106–111. [Google Scholar] [CrossRef]
  5. Wang, Y.; Lin, F.; Pang, W. Ion exchange of ammonium in natural and synthesized zeolites. J. Hazard. Mater. 2008, 160, 371–375. [Google Scholar] [CrossRef]
  6. Du, Q.; Liu, S.; Cao, Z.; Wang, Y. Ammonia removal from aqueous solution using natural Chinese clinoptilolite. Sep. Purif. Technol. 2005, 44, 229–234. [Google Scholar] [CrossRef]
  7. Aguilar-Armenta, G.; Hernandez-Ramirez, G.; Flores-Loyola, E.; Ugarte-Castaneda, A.; Silva-Gonzalez, R.; Tabares-Munoz, C.; Jimenez-Lopez, A.; Rodriguez-Castellon, E. Adsorption kinetics of CO2, O2, N2, and CH4 in cation-exchanged clinoptilolite. J. Phys. Chem. B 2001, 105, 1313–1319. [Google Scholar] [CrossRef]
  8. Wang, Y.; Sun, J.; Munir, T.; Jia, B.; Gul, A. Various morphologies of clinoptilolites synthesized in alcohol-solvent hydrothermal system and their selective adsorption of CH4 and N2. Microporous Mesoporous Mater. 2021, 323, 111235. [Google Scholar] [CrossRef]
  9. Jia, B.; Sun, J.; Bing, L.; Bai, S. Nonionic surfactant-assisted strategy towards disorderly layered UiO-66-on-clinoptilolites heterostructure as efficient adsorbent for selective adsorption of CO2 and CH4. Mater. Lett. 2022, 328, 133147. [Google Scholar] [CrossRef]
  10. Jia, B.; Xu, B.; Bing, L.; Sun, J.; Bai, S. Cationic surfactant-assisted delamination of disorderly layered clinoptilolites for selective adsorption of CO2 and CH4. J. Environ. Chem. Eng. 2022, 10, 108033. [Google Scholar] [CrossRef]
  11. Iwakai, K.; Tago, T.; Konno, H.; Nakasaka, Y.; Masuda, T. Preparation of nano-crystalline MFI zeolite via hydrothermal synthesis in water/surfactant/organic solvent using fumed silica as the Si source. Microporous Mesoporous Mater. 2011, 141, 167–174. [Google Scholar] [CrossRef] [Green Version]
  12. Silva, J.F.; Ferracine, E.D.; Cardoso, D. Effects of different variables on the formation of mesopores in Y zeolite by the action of CTA+ surfactant. Appl. Sci. 2018, 8, 1299. [Google Scholar] [CrossRef] [Green Version]
  13. Koohsaryan, E.; Anbia, M. Facile and rapid synthesis of highly crystalline mesoporous zeolite FAU. Mater. Lett. 2019, 236, 390–393. [Google Scholar] [CrossRef]
  14. Corma, A.; Fornés, V.; Pergher, S.B.; Maesen, T.L.M.; Bugless, J.G. Delaminated zeolite precursors as selective acidic catalysts. Nature 1998, 396, 353–356. [Google Scholar] [CrossRef]
  15. Gorgojo, P.; Galve, A.; Uriel, S.; Téllez, C.; Coronas, J. Direct exfoliation of layered zeolite Nu-6 (1). Microporous Mesoporous Mater. 2011, 142, 122–129. [Google Scholar] [CrossRef]
  16. Okrut, A.; Grosso-Giordano, N.A.; Schttle, C.; Zones, S.; Katz, A. Understanding the role of Zn2+ in surfactant-free layered silicate delamination: Exfoliation of magadiite. Microporous Mesoporous Mater. 2019, 283, 55–63. [Google Scholar] [CrossRef]
  17. Roth, W.J. MCM-22 zeolite family and the delaminated zeolite MCM-56 obtained in one-step synthesis. Stud. Surf. Sci. Catal. 2005, 158, 19–26. [Google Scholar]
  18. Zhang, Z.; Zhao, Y.; Gong, Q.; Zhong, L.; Li, J. MOFs for CO2 capture and separation from flue gas mixtures: The effect of multifunctional sites on their adsorption capacity and selectivity. Chem. Commun. 2013, 49, 653–661. [Google Scholar] [CrossRef]
  19. Chui, S.S.Y.; Lo, S.M.F.; Charmant, J.P.H.; Orpen, A.G.; Williams, I.D. A chemically functionalizable nanoporous material [Cu3(TMA)2(H2O)3]n. Science 1999, 283, 1148–1150. [Google Scholar] [CrossRef]
  20. Chen, Y.; Mu, X.; Lester, E.; Wu, T. High efficiency synthesis of HKUST–1 under mild conditions with high BET surface area and CO2 uptake capacity. Prog. Nat. Sci. Mater. Int. 2018, 28, 584–589. [Google Scholar] [CrossRef]
  21. Al-Naddaf, Q.; Thakkar, H.; Rezaei, F. Novel zeolite-5A@MOF–74 composite adsorbents with core-shell structure for H2 purification. ACS Appl. Mater. Interfaces 2018, 10, 29656–29666. [Google Scholar] [CrossRef] [PubMed]
  22. Mahmoudi, F.; Amini, M.M.; Sillanpää, M. Hydrothermal synthesis of novel MIL–100(Fe)@SBA–15 composite material with high adsorption efficiency towards dye pollutants for wastewater remediation. J. Taiwan Inst. Chem. Eng. 2020, 116, 303–313. [Google Scholar] [CrossRef]
  23. Tari, N.E.; Tadjarodi, A.; Tamnanloo, J.; Fatemi, S. Synthesis and property modification of MCM-41 composited with Cu(BDC) MOF for improvement of CO2 adsorption Selectivity. J. CO2 Util. 2016, 14, 126–134. [Google Scholar] [CrossRef]
  24. Mu, X.; Chen, Y.; Lester, E.; Wu, T. Optimized synthesis of nano-scale high quality HKUST-1 under mild conditions and its application in CO2 capture. Microporous Mesoporous Mater. 2018, 270, 249–257. [Google Scholar] [CrossRef] [Green Version]
  25. Moradi, M.; Karimzadeha, R.; Moosavib, E.S. Modified and ion exchanged clinoptilolite for the adsorptive removal of sulfur compounds in a model fuel: New adsorbents for desulfurization. Fuel 2018, 217, 467–477. [Google Scholar] [CrossRef]
  26. Li, Z. A program for SAXS data processing and analysis. Chin. Phys. C 2013, 37, 108002. [Google Scholar] [CrossRef] [Green Version]
  27. Yang, S.; Lach-hab, M.; Blaisten-Barojas, E.; Li, X.; Karen, V.L. Machine learning study of the heulandite family of zeolites. Microporous Mesoporous Mater. 2010, 130, 309–313. [Google Scholar] [CrossRef]
  28. Uzcátegui, D.; González, G. Study of the kinetics of crystallization of zeolite MEL. Catal. Today 2005, 107, 901–905. [Google Scholar] [CrossRef]
  29. Corma, A.; Fornés, V.; Martínez-Triguero, J.; Pergher, S.B. Delaminated zeolites: Combining the benefits of zeolites and mesoporous materials for catalytic uses. J. Catal. 1999, 186, 57–63. [Google Scholar] [CrossRef]
  30. Alvarez-Puebla, R.A.; Aisa, C.; Blasco, J.; Echeverría, J.C.; Mosquera, B.; Garrido, J.J. Copper heterogeneous nucleation on a palygorskitic clay: An XRD, EXAFS and molecular modeling study. Appl. Clay Sci. 2004, 25, 103–110. [Google Scholar] [CrossRef]
  31. Zheng, X.G.; Xu, C.N. Antiferromagnetic transition in botallackite Cu2Cl(OH)3. Solid State Commun. 2004, 131, 509–511. [Google Scholar] [CrossRef]
  32. Lin, K.S.; Adhikari, A.K.; Ku, C.N.; Chiang, C.L.; Kuo, H. Synthesis and characterization of porous HKUST-1 metal organic frameworks for hydrogen storage. Int. J. Hydrogen Energy 2012, 37, 13865–13871. [Google Scholar] [CrossRef]
  33. Moor, P.E.A.D.; Beelen, T.P.M.; Santen, R.A.V.; Beck, L.W.; Davis, M.E. Si-MFI crystallization using a “Dimer” and “Trimer” of TPA studied with small-angle X-ray scattering. J. Phys. Chem. B 2000, 104, 7600–7611. [Google Scholar] [CrossRef]
  34. Glatter, O. A new method for the evaluation of small-angle scattering data. J. Appl. Crystallogr. 1977, 10, 415–421. [Google Scholar] [CrossRef]
  35. Boukari, H.; Lin, J.S.; Harris, M.T. Small-angle X-ray scattering study of the formation of colloidal silica particles from alkoxides: Primary particles or not? J. Colloid Interf. Sci. 1997, 194, 311–318. [Google Scholar] [CrossRef]
  36. Zhao, X.; Liu, R.; Zhang, H.; Shang, Y.; Song, Y.; Liu, C.; Wang, T.; Gong, Y.; Li, Z. Structure evolution of aluminosilicate sol and its structure-directing effect on the synthesis of NaY zeolite. J. Appl. Crystallogr. 2017, 50, 231–239. [Google Scholar] [CrossRef]
  37. Radlinski, A.P.; Mastalerz, M.; Hinde, A.L.; Hainbuchner, M.; Rauch, H.; Baron, M.; Lin, J.S.; Fan, L.; Thiyagarajan, P. Application of SAXS and SANS in evaluation of porosity, pore size distribution and surface area of coal. Int. J. Coal Geol. 2004, 59, 245–271. [Google Scholar] [CrossRef]
  38. Svergun, D.I.; Koch, M.H.J. Small-angle scattering studies of biological macromolecules in solution. Rep. Prog. Phys. 2003, 66, 1735. [Google Scholar] [CrossRef]
  39. Xu, Y.; Koga, Y.; Strausz, O.P. Characterization of Athabasca asphaltenes by small-angle X-ray scattering. Fuel 1995, 74, 960–964. [Google Scholar] [CrossRef]
  40. Corral-Capulin, N.G.; Vilchis-Nestor, A.R.; Gutiérrez-Segura, E.; Solache Ríos, M. The influence of chemical and thermal treatments on the fluoride removal from water by three mineral structures and their characterization. J. Fluor. Chem. 2018, 213, 42–50. [Google Scholar] [CrossRef]
  41. Rakitskaya, T.L.; Kiose, T.A.; Golubchik, K.O.; Ennan, A.A.; Volkova, V.Y. Acid-modified clinoptilolite as a support for palladium-copper complexes catalyzing carbon monoxide oxidation with air oxygen. Chem. Cent. J. 2017, 11, 28. [Google Scholar] [CrossRef] [PubMed] [Green Version]
  42. Garcia-Basabe, Y.; Rodriguez-Iznaga, I.; de Menorval, L.; Llewellyn, P.; Maurin, G.; Lewis, D.W.; Binions, R.; Autie, M.; Ruiz-Salvador, A.R. Step-wise dealumination of natural clinoptilolite: Structural and physicochemical characterization. Microporous Mesoporous Mater. 2010, 135, 187–196. [Google Scholar] [CrossRef]
  43. Maia, R.A.; Louis, B.; Baudron, S.A. HKUST-1 MOF in reline deep eutectic solvent: Synthesis and phase transformation. Dalton T. 2021, 50, 4145–4151. [Google Scholar] [CrossRef]
  44. Lin, S.; Song, Z.; Che, G.; Ren, A.; Li, P.; Liu, C.; Zhang, J. Adsorption behavior of metal-organic frameworks for methylene blue from aqueous solution. Microporous Mesoporous Mater. 2014, 193, 27–34. [Google Scholar] [CrossRef]
  45. Hunger, B.; Miessner, H.; Szombathely, M.; Geidel, E. Heterogeneity of Si-OH-Al groups in HNaY zeolites. J. Chem. Soc. Faraday Trans. 1996, 92, 499–504. [Google Scholar] [CrossRef]
  46. Kaneko, K. Determination of pore size and pore size distribution: 1. Adsorbents and catalysts. J. Membr. Sci. 1994, 96, 59–89. [Google Scholar] [CrossRef]
  47. Leofanti, G.; Padovan, M.; Tozzola, G.; Venturelli, B. Surface area and pore texture of catalysts. Catal. Today 1998, 41, 207–219. [Google Scholar] [CrossRef]
  48. Majchrzak-Kucęba, I.; Bukalak-Gaik, D. Regeneration performance of metal-organic frameworks. J. Therm. Anal. Calorim. 2016, 125, 1461–1466. [Google Scholar] [CrossRef] [Green Version]
  49. Lee, Y.; Kim, J.; Ahn, W. Synthesis of metal-organic frameworks: A mini review. Korean J. Chem. Eng. 2013, 30, 1667–1680. [Google Scholar] [CrossRef]
  50. Klimakow, M.; Klobes, P.; Rademann, K.; Emmerling, F. Characterization of mechanochemically synthesized MOFs. Microporous Mesoporous Mater. 2012, 154, 113–118. [Google Scholar] [CrossRef]
  51. Omri, A.; Lamber, S.D.; Geen, J.; Bennour, F.; Benzina, M. Synthesis, surface characterization and photocatalytic activity of TiO2 supported on almond shell activated carbon. J. Mater. Sci. Technol. 2014, 30, 894–902. [Google Scholar] [CrossRef]
  52. Mendoza, H.R.; Jordens, J.; Pereira, M.V.L.; Lutz, C.; Gerven, T.V. Effects of ultrasonic irradiation on crystallization kinetics, morphological and structural properties of zeolite FAU. Ultrason. Sonochem. 2020, 64, 105010. [Google Scholar] [CrossRef] [PubMed]
  53. Castillo, M.L.G.; Renzo, F.D.; Fajula, F.; Bousquet, J. Crystallization kinetics of zeolite omega, the synthetic analog of mazzite. Microporous Mesoporous Mater. 2006, 90, 221–228. [Google Scholar] [CrossRef]
  54. Jiao, J.; Sun, J.; Ullah, R.; Bai, S.; Zhai, C. One-step synthesis of hydrophobic clinoptilolite modified by silanization for the degradation of crystal violet dye in aqueous solution. RSC Adv. 2020, 10, 22809–22818. [Google Scholar] [CrossRef]
  55. Shalmani, F.M.; Halladj, R.; Askari, S. An investigation of the crystallization kinetics of zeotype SAPO-34 crystals synthesized by hydrothermal and sonochemical methods. Ultrason. Sonochem. 2016, 29, 354–362. [Google Scholar] [CrossRef] [PubMed]
  56. Amin, G.M.; Esmail, A. Application of nano silica to improve self-healing of asphalt mixes. J. Cent. South Univ. 2017, 24, 1019–1026. [Google Scholar] [CrossRef]
  57. Majano, G.; Pérez-Ramírez, J. Room Temperature Synthesis and Size Control of HKUST-1. Helv. Chim. Acta 2012, 95, 2278–2286. [Google Scholar] [CrossRef]
  58. Wu, Y.; Yuan, D.; He, D.; Xing, J.; Liu, Z. Decorated traditional zeolites with subunits of metal-organic frameworks for CH4/N2 separation. Angew. Chem. Int. Edit. 2019, 58, 10241–10244. [Google Scholar] [CrossRef]
  59. Lestari, W.W.; Adreane, M.; Purnawan, C.; Fansuri, H.; Widiastuti, N.; Rahardjo, S.B. Solvothermal and electrochemical synthetic method of HKUST-1 and its methane storage capacity. IOP Conf. Ser. Mater. Sci. Eng. 2016, 107, 012030. [Google Scholar] [CrossRef] [Green Version]
  60. Schlichte, K.; Kratzke, T.; Kaskel, S. Improved synthesis, thermal stability and catalytic properties of the metal-organic framework compound Cu3(BTC)2. Microporous Mesoporous Mater. 2004, 73, 81–88. [Google Scholar] [CrossRef]
  61. Yörükoğulları, E.; Yılmaz, G.; Dikmen, S. Thermal treatment of zeolitic tuff. J. Therm. Anal. Calorim. 2010, 100, 925–928. [Google Scholar] [CrossRef]
  62. Hao, X.; Hu, H.; Li, Z.; Wu, L.; Liu, X.; Zhang, Y. Adsorption Properties of Modified Clinoptilolite for Methane and Nitrogen. Materials 2018, 11, 2024. [Google Scholar] [CrossRef] [Green Version]
  63. Xin, C.; Zhan, H.; Huang, X.; Li, H.; Zhao, N.; Xiao, F.; Wei, W.; Sun, Y. Effect of various alkaline agents on the size and morphology of nano-sized HKUST-1 for CO2 adsorption. RSC Adv. 2015, 5, 27901–27911. [Google Scholar] [CrossRef]
  64. Spanopoulos, I.; Tsangarakis, C.; Klontzas, E.; Tylianakis, E.; Froudakis, G.; Adil, K.; Belmabkhout, Y.; Eddaoudi, M.; Trikalitis, P.N. Reticular synthesis of HKUST-like tbo MOFs with enhanced CH4 storage. J. Am. Chem. Soc. 2016, 138, 1568–1574. [Google Scholar] [CrossRef] [PubMed] [Green Version]
  65. Koyama, K.; Takéuchi, Y. Clinoptilolite: The distribution of potassium atoms and its role in thermal stability. Z. Krist-Cryst. Mater. 1977, 145, 216–239. [Google Scholar] [CrossRef]
  66. Rodríguez-Iznaga, I.; Shelyapina, M.G.; Petranovskii, V. Ion Exchange in Natural Clinoptilolite: Aspects Related to Its Structure and Applications. Minerals 2022, 12, 1628. [Google Scholar] [CrossRef]
  67. Iznaga, I.R.; Petranovskii, V.; Fuentes, G.R.; Mendoza, C.; Aguilar, A.B. Exchange and reduction of Cu2+ ions in clinoptilolitem. J. Colloid Interf. Sci. 2007, 316, 877–886. [Google Scholar] [CrossRef]
  68. Garcia-Basabe, Y.; Ruiz-Salvador, A.R.; Maurin, G.; Menorval, L.; Rodriguez-Iznaga, I.; Gomez, A. Location of extra-framework Co2+, Ni2+, Cu2+ and Zn2+ cations in natural and dealuminated clinoptilolite. Microporous Mesoporous Mater. 2012, 155, 233–239. [Google Scholar] [CrossRef]
  69. Park, J.M.; Woo, H.C.; Jhung, S.H. Effective CO2 adsorption at low pressure over nitrogen-enriched porous carbons, derived from melamine-loaded polyaniline. Chem. Eng. J. 2021, 412, 128641. [Google Scholar] [CrossRef]
  70. Kennedy, D.A.; Mujčin, M.; Abou-Zied, C.; Tezel, F.H. Cation exchange modification of clinoptilolite-thermodynamic effects on adsorption separations of carbon dioxide, methane, and nitrogen. Microporous Mesoporous Mater. 2019, 274, 327–341. [Google Scholar] [CrossRef]
  71. Zhang, K.; Meng, Z.; Liu, S. Comparisons of methane adsorption/desorption, diffusion behaviors on intact coals and deformed coals: Based on experimental analysis and isosteric heat of adsorption. Energy Fuels 2021, 35, 5975–5987. [Google Scholar] [CrossRef]
  72. Yan, X.; Komarneni, S.; Zhang, Z.; Yan, Z. Extremely enhanced CO2 uptake by HKUST-1 metal-organic framework via a simple chemical treatment. Microporous Mesoporous Mater. 2014, 183, 69–73. [Google Scholar] [CrossRef]
  73. Wu, X.; Liu, J.; He, T.; Zhang, P.; Yu, J.; Li, J. Understanding how pore surface fluorination influences light hydrocarbon separation in metal-organic frameworks. Chem. Eng. J. 2021, 407, 127183. [Google Scholar] [CrossRef]
  74. Álvarez-Gutiérrez, N.; Gil, M.V.; Rubiera, F.; Pevida, C. Kinetics of CO2 adsorption on cherry stone-based carbons in CO2/CH4 separations. Chem. Eng. J. 2017, 307, 249–257. [Google Scholar] [CrossRef] [Green Version]
Figure 1. XRD patterns of (a) [email protected], (b) [email protected], (c) [email protected], and (d) [email protected].
Nanomaterials 13 01860 g001
Figure 2. SAXS patterns of (a) [email protected], (b) [email protected], (c) [email protected], and (d) [email protected].
Nanomaterials 13 01860 g002
Figure 3. The pair distance distribution function (P(r)~r) profiles of (a) [email protected], (b) [email protected], (c) [email protected], and (d) [email protected].
Nanomaterials 13 01860 g003
Figure 4. SEM images of (a) pure CP, (b) CP-0, (c) CP-24, (d) CP-72, (e) CP-72-E, (f) [email protected], (g) [email protected], (h) [email protected], (i) Cu-CP-72-E-7.33, and (j) HKUST-1.
Nanomaterials 13 01860 g004
Figure 5. Equilibrium adsorbed isotherms of the samples using CO2 as adsorbate at 273 K (A) and 298 K (B), respectively; CH4 as adsorbate at 273 K (C) and 298 K (D), respectively: (a) [email protected], (b) [email protected], and (c) [email protected].
Nanomaterials 13 01860 g005
Figure 6. Equilibrium adsorbed isotherms of the samples using CO2 as adsorbate at 273 K (A) and 298 K (B), respectively; CH4 as adsorbate at 273 K (C) and 298 K (D), respectively: (a) [email protected], (b) [email protected], and (c) HKUST-1.
Nanomaterials 13 01860 g006
Figure 7. CO2 adsorption heat (A) and CH4 adsorption heat (B) of (a) [email protected], (b) [email protected], (c) [email protected], and (d) [email protected].
Nanomaterials 13 01860 g007
Figure 8. CO2/CH4 selectivity at 273 K (A) and 298 K (B) of (a) [email protected], (b) [email protected], (c) [email protected], (d) [email protected], and (e) HKUST-1.
Nanomaterials 13 01860 g008
Figure 9. Breakthrough curves of a flowing mixed gas of CO2/CH4 of 50: 50 vol% through a packed bed of [email protected] at 298 K.
Nanomaterials 13 01860 g009
Table 1. Summaries of CO2/CH4 selectivity of various samples at different temperatures under pressure of 1 bar.
SampleTemperatureCO2/CH4 Selectivity
HKUST−1@CP−0−E−10.5273 K
298 K
13.51
13.65
HKUST−1@CP−24−E−10.1273 K
298 K
7.23
9.48
HKUST−1@CP−72−E−3.4273 K
298 K
3.58
3.57
HKUST−1@CP−72−E−7.3273 K
298 K
4.89
5.87
HKUST−1273 K
298 K
3.13
3.12
HKUST−1 1 cited in reference [72]273 K7.19
HKUST−1 2 cited in references [24,59]273 K4.00
1 HKUST–1 synthesized by hydrothermal method. 2 HKUST–1 synthesized at room temperature.
Disclaimer/Publisher’s Note: The statements, opinions and data contained in all publications are solely those of the individual author(s) and contributor(s) and not of MDPI and/or the editor(s). MDPI and/or the editor(s) disclaim responsibility for any injury to people or property resulting from any ideas, methods, instructions or products referred to in the content.

