
The Influence of TiO2 Nanoparticles Morphologies on the Performance of Lithium-Ion Batteries


Abstract
:1. Introduction
2. Materials and Methods
2.1. Synthesis of TiO2 Nanoparticles and Aggregates
2.2. Characterization of Prepared TiO2 Nanoparticles and Aggregates
3. Results and Discussion
4. Conclusions
Author Contributions
Funding
Data Availability Statement
Acknowledgments
Conflicts of Interest
References
- Qu, J.; Ding, J.; Yuan, N. The synthesis of four morphologies of TiO2 through temperature control and their electrochemical performance. Int. J. Elecrochem. Sci. 2015, 10, 8385–8394. [Google Scholar] [CrossRef]
- Lu, J.; Chen, Z.; Pan, F.; Cui, Y.; Amine, K. High-Performance anode materials for rechargeable lithium-ion batteries. Electrochem. Energy Rev. 2018, 1, 35–53. [Google Scholar] [CrossRef]
- Zhao, Z.; Tian, J.; Sang, Y.; Cabot, A.; Liu, H. Structure, synthesis, and applications of TiO2 nanobelts. Adv. Mater. 2015, 27, 2557–2582. [Google Scholar] [CrossRef] [PubMed]
- Xiang, C.; Li, M.; Zhi, M.; Manivannan, A.; Wu, N. Reduced graphene oxide/titanium dioxide composites for supercapacitor electrodes: Shape and coupling effects. J. Mater. Chem. 2012, 22, 19161. [Google Scholar] [CrossRef]
- Liang, Y.; Zhao, C.-Z.; Yuan, H.; Chen, Y.; Zhang, W.; Huang, J.-Q.; Yu, D.; Liu, Y.; Titirici, M.-M.; Chueh, Y.-L.; et al. A review of rechargeable batteries for portable electronic devices. InfoMat 2019, 1, 6–32. [Google Scholar] [CrossRef]
- Fichtner, M.; Edstrom, K.; Ayerbe, E.; Berecibar, A.; Berecibar, M.; Bhowmik, A.; Castelli, I.E.; Clark, S.; Dominko, R.; Erakca, M.; et al. Rechargeable batteries of the future the state of the art from battery 2030+ perspective. Adv. Energy Mater. 2022, 12, 2102904. [Google Scholar] [CrossRef]
- Minakshi, M.; Bahri, P.A.; Paul, S.; Kumari, P.; Divakaran, A.M.; Manjunatha, K.N. Rational design on materials for developing next generation lithium-ion secondary battery. Prog. Solid State Chem. 2021, 62, 100298. [Google Scholar] [CrossRef]
- Manickam, M.; Singh, P.; Issa, T.B.; Thurgate, S. Electrochemical behavior of anatase TiO2 in aqueous lithium hydroxide electrolyte. J. Appl. Electrochem. 2006, 36, 599–602. [Google Scholar] [CrossRef]
- Peng, P.P.; Wu, Y.-R.; Li, X.-Z.; Zhang, J.-H.; Li, Y.-W.; Cui, P.; Yi, T.-F. Toward superior lithium/sodium storage performance: Design and construction of novel TiO2-based anode materials. Rare Met. 2021, 40, 3049–3075. [Google Scholar] [CrossRef]
- Tarascon, J.M.; Armand, M. Issues and challenges facing rechargeable lithium batteries. Nature 2001, 41, 359–367. [Google Scholar] [CrossRef]
- Scrosati, B. Challenge of portable power. Nature 1995, 373, 557–558. [Google Scholar] [CrossRef]
- Jiang, F.; Peng, P. Elucidating the Performance Limitations of Lithium-ion Batteries due to Species and Charge Transport through Five Characteristic Parameters. Sci. Rep. 2016, 6, 32639. [Google Scholar] [CrossRef] [PubMed]
- Lain, M.J.; Kendrick, E. Understanding the limitations of lithium-ion batteries at high rates. J. Power Sources 2021, 493, 229690. [Google Scholar] [CrossRef]
- Liu, Y.; Wu, X.; Du, J.; Song, Z.; Wu, G. Optimal sizing of wind-energy storage system considering battery life. Renew. Energy 2020, 147, 247–2483. [Google Scholar] [CrossRef]
- Yazami, R. Surface chemistry and lithium storage capability of the graphite lithium electrode. Electrochem. Acta 1999, 45, 87–97. [Google Scholar] [CrossRef]
- Pupus, A.; Varna, J. Modeling mechanical stress and exfoliation damage in carbon fiber electrodes subjected to cyclic intercalation/deintercalation of lithium ions. Compos. Part B 2014, 65, 69–79. [Google Scholar] [CrossRef]
- Li, X.; Zhang, X.; Li, T.; Zhong, Q.; Li, H.; Huang, J. Graphene nanoscrolls encapsulated TiO2 nanowires for lithium storage. J. Power Sources 2014, 268, 372–378. [Google Scholar] [CrossRef]
- Jin, J.; Huang, S.Z.; Liu, J.; Li, Y.; Chen, D.-S.; Wang, H.-E.; Yu, Y.; Chen, L.-H.; Su, B.-L. Design of new anode materials based on hierarchical three-dimensional ordered macro mesoporous TiO2 for high performance lithium-ion batteries. J. Mater. Chem. A 2014, 2, 9699–9708. [Google Scholar] [CrossRef]
- Ming, H.; Yan, Y.; Ming, J.; Li, X.; Zhou, G.; Huang, H.; Zheng, J. Porous TiO2 nanoribbons and TiO2 nanoribbon/carbon dot composites for enhanced Li-ion storage. RSC Adv. 2014, 4, 12971. [Google Scholar] [CrossRef]
- Deng, D.; Kim, M.; Lee, J.Y.; Cho, J. Green energy storage materials: Nanostructured TiO2 and Sn-based anodes for lithium-ion batteries. Energy Environ. Sci. 2009, 2, 818. [Google Scholar] [CrossRef]
- Lin, Z.; Zheng, M.; Zhao, B.; Wang, G.; Pu, L.; Shi, Y. Influence of the pore structure parameters of mesoporous anatase microsphereson their performance in Lithium-ion batteries. J. Solid State Electrochem. 2014, 18, 1673–1681. [Google Scholar] [CrossRef]
- Taleb, A.; Mesguich, F.; Hérissan, A.; Colbeau-Justin, C.; Xue, Y.; Dubot, P. Optimized TiO2 nanoparticle packing for DSSC photovoltaic applications. Sol. Energy Mater. Sol. Cells 2016, 148, 52–59. [Google Scholar] [CrossRef]
- Luo, W.; Blanchard, J.; Tonelli, D.; Taleb, A. Synthesis of TiO2 Nanobelt Bundles Decorated with TiO2 Nanoparticles and Aggregates and Their Use as Anode Materials for Lithium-Ion Batteries. Micromachines 2023, 14, 243. [Google Scholar] [CrossRef] [PubMed]
- Vasilyev, O.A.; Kornyshev, A.A.; Kondrat, S. Connections Matter: On the importance of pore percolation for nanoporous supercapacitors. ACS Appl. Energy Mater. 2019, 2, 5386–5390. [Google Scholar] [CrossRef]
- Vu, A.; Qian, Y.; Stein, A. Porous Electrode Materials for Lithium-Ion Batteries-How to Prepare Them and What Makes Them Special. Adv. Energy Mater. 2012, 2, 1056–1085. [Google Scholar] [CrossRef]
- Luo, W.; Taleb, A. Large-Scale Synthesis Route of TiO2 Nanomaterials with Controlled Morphologies Using Hydrothermal Method and TiO2 Aggregates as Precursor. Nanomaterials 2021, 11, 365. [Google Scholar] [CrossRef]
- Sotomayor, F.J.; Cychosz, K.C.; Thommes, M. Characterization of Micro/Mesoporous Materials by Physisorption: Concepts and Case Studies. Acc. Mater. Surf. Res. 2018, 3, 34–50. [Google Scholar]
- Lee, K.H.; Song, S.W. One-step hydrothermal synthesis of mesoporous anatase TiO2 microsphere and interfacial control for enhanced lithium storage performance. ACS Appl. Mater. Interfaces 2011, 3, 3697–3703. [Google Scholar] [CrossRef]
- Liu, D.; Yu, Q.; Liu, S.; Qian, K.; Wang, S.; Sun, W.; Yang, X.-Q.; Kang, F.; Li, B. Evolution of Solid Electrolyte Interface on TiO2 Electrodes in an Aqueous Li-Ion Battery Studied Using Scanning Electrochemical Microscopy. J. Phys. Chem. C 2019, 123, 12797–12806. [Google Scholar] [CrossRef]
- Wang, A.; Kadam, S.; Li, H.; Shi, S.; Qi, Y. Review on modeling of the anode solid electrolyte interphase (SEI) for lithium-ion batteries. NPJ Comput. Mater. 2018, 4, 15. [Google Scholar] [CrossRef]
- Kang, J.W.; Kim, D.H.; Mathew, V.; Lim, J.S.; Gim, J.H.; Kim, J. Particle size effect of anatase TiO2 nanocrystals for lithium-ion batteries. J. Electrochem. Soc. 2011, 158, A59–A62. [Google Scholar] [CrossRef]
- Paul, S.; Rahman, A.; Islam, S.; Islam, R.; Siddiqui, S. Nanostructured anatase TiO2 as anode of high performance lithium-ion batteries. Battery Energy. 2022, 1, 20220018. [Google Scholar] [CrossRef]
- Liang, S.; Wang, X.; Qi, R.; Cheng, Y.-J.; Xia, Y.; Müller-Buschbaum, P.; Hu, X. Bronze-Phase TiO2 as Anode Materials in Lithium and Sodium-Ion Batteries. Adv. Fun. Mater. 2022, 32, 2201675. [Google Scholar] [CrossRef]
- Mehraz, S.; Luo, W.; Swiatowska, J.; Bezzazi, B.; Taleb, A. Hydrothermal Synthesis of TiO2 Aggregates and Their Applications as Negative Electrodes for Lithium-ion Batteries: The Conflicting Effects of Specific Surface and Pore Size. Materials 2021, 14, 916. [Google Scholar] [CrossRef] [PubMed]
- Jiang, C.H.; Zhang, J.S. Nanoengineering Titania for High Rate Lithium Storage: A Review. J. Mater. Sci. Technol. 2013, 29, 97–122. [Google Scholar] [CrossRef]
- Wang, H.E.; Jin, J.; Cai, Y.; Xu, J.M.; Chen, D.S.; Zheng, X.F.; Deng, Z.; Li, Y.; Bello, I.; Su, B.L. Facile and fast synthesis of porous TiO2 spheres for use in lithium ion batteries. J. Colloid Interface Sci. 2014, 417, 144–151. [Google Scholar] [CrossRef]
- Charette, K.; Zhu, J.; Sally, S.O.; Ng, K.Y.; Deng, D. Gram-scale synthesis of high-temperature (900 °C) stable anatase TiO2 nanostructures assembled by tunable building subunits for safer lithium-ion batteries. RSC Adv. 2014, 4, 2557–2562. [Google Scholar] [CrossRef]
- Rai, A.K.; Anh, L.T.; Gim, J.H.; Mathew, V.; Kang, J.W.; Paul, B.B.; Song, J.J.; Kim, J. Simple synthesis and particle size effects of TiO2 nanoparticle anodes for rechargeable lithium ion batteries. Electrochim. Acta 2013, 90, 112–118. [Google Scholar] [CrossRef]
- Liu, X.; Sun, Q.; Liu, F.; Djurisic, A.B.; Ng, A.M.C.; Xie, M.; Wood, T.; Zapien, J.A.; Liao, C.; Shih, K. The influence of TiO2 nanostructure properties on the performance of TiO2-based anodes in lithium-ion battery applications. Turk. J. Phys. 2014, 38, 442–449. [Google Scholar] [CrossRef]
- Tian-Hui, Z.; Ling-Yu, P.; Su-ling, Z.; Zheng, X.; Qian, W.; Chao, K. Application of TiO2 with different structures in soar cells. Chin. Phys. B 2012, 21, 118401. [Google Scholar] [CrossRef]
- Lin, Z.; Yue, W.; Huang, D.; Hu, J.; Zhang, X.; Yuan, Z.; Yang, X. Pore length control of mesoporous Co3O4 and its influence on the capacity of porous electrodes for lithium-ion batteries. RSC Adv. 2012, 2, 1794–1797. [Google Scholar] [CrossRef]
- Pimta, K.; Autthawong, T.; Yodying, W.; Phromma, C.; Haruta, M.; Kurata, H.; Sarakonsri, T.; Chimupala, Y. Development of Bronze Phase Titanium Dioxide Nanorods for Use as Fast-Charging Anode Materials in Lithium-Ion Batteries. ACS Omega 2023, 8, 15360–15370. [Google Scholar] [CrossRef] [PubMed]
- Zhang, J.; Cao, H.; Tang, X.; Fan, W.; Peng, G.; Qu, M. Graphite graphene oxide composite as high capacity and binder-free anode material for lithium-ion batteries. J. Power Sources 2013, 241, 619–626. [Google Scholar] [CrossRef]
- Li, X.; Hu, Y.; Liu, J.; Lushington, A.; Li, R.; Sun, X. Structurally tailored graphene nanosheets as lithium-ion battery anodes: An unsight to yield exceptionally high lithium storage performance. Nanoscale 2013, 5, 12607–12615. [Google Scholar] [CrossRef]
- Spinner, N.S.; Alessandro Palmieri, A.; Beauregard, N.; Zhang, L.; Campanella, J.; Mustain, W.E. Influence of conductivity on the capacity retention of NiO anodes in Li-ion batteries. J. Power Sources 2015, 276, 46–53. [Google Scholar] [CrossRef]
- Zhang, S.; He, W.; Zhang, X.; Yang, X. Rational design of carbon-coated hollow MnO nanotubes for Li-ion batteries. J. Mater. Sci. Mater. Electron. 2015, 26, 2189–2197. [Google Scholar] [CrossRef]
- Ara, M.; Chitturi, V.R.; Salley, S.O.; Ng, K.S. Nitrogen-doped carbon-coated SnxOy (x=1 and y=0 and 2) nanoparticles for rechargeable Li-ion batteries. Electrochim. Acta 2015, 161, 269–278. [Google Scholar] [CrossRef]
- Wang, X.H.; Guan, C.; Sun, L.M.; Susantyoko, R.A.; Fan, H.J.; Zhang, Q. Highly stable and flexible Li-ion battery anodes based on TiO2 coated 3D carbon nanostructures. J. Mater. Chem. A 2015, 3, 15394–15398. [Google Scholar] [CrossRef]


| TiO2NT-200 °C | TiO2NU-100 °C | TiO2NU-150 °C | TiO2NB-200 °C | |
|---|---|---|---|---|
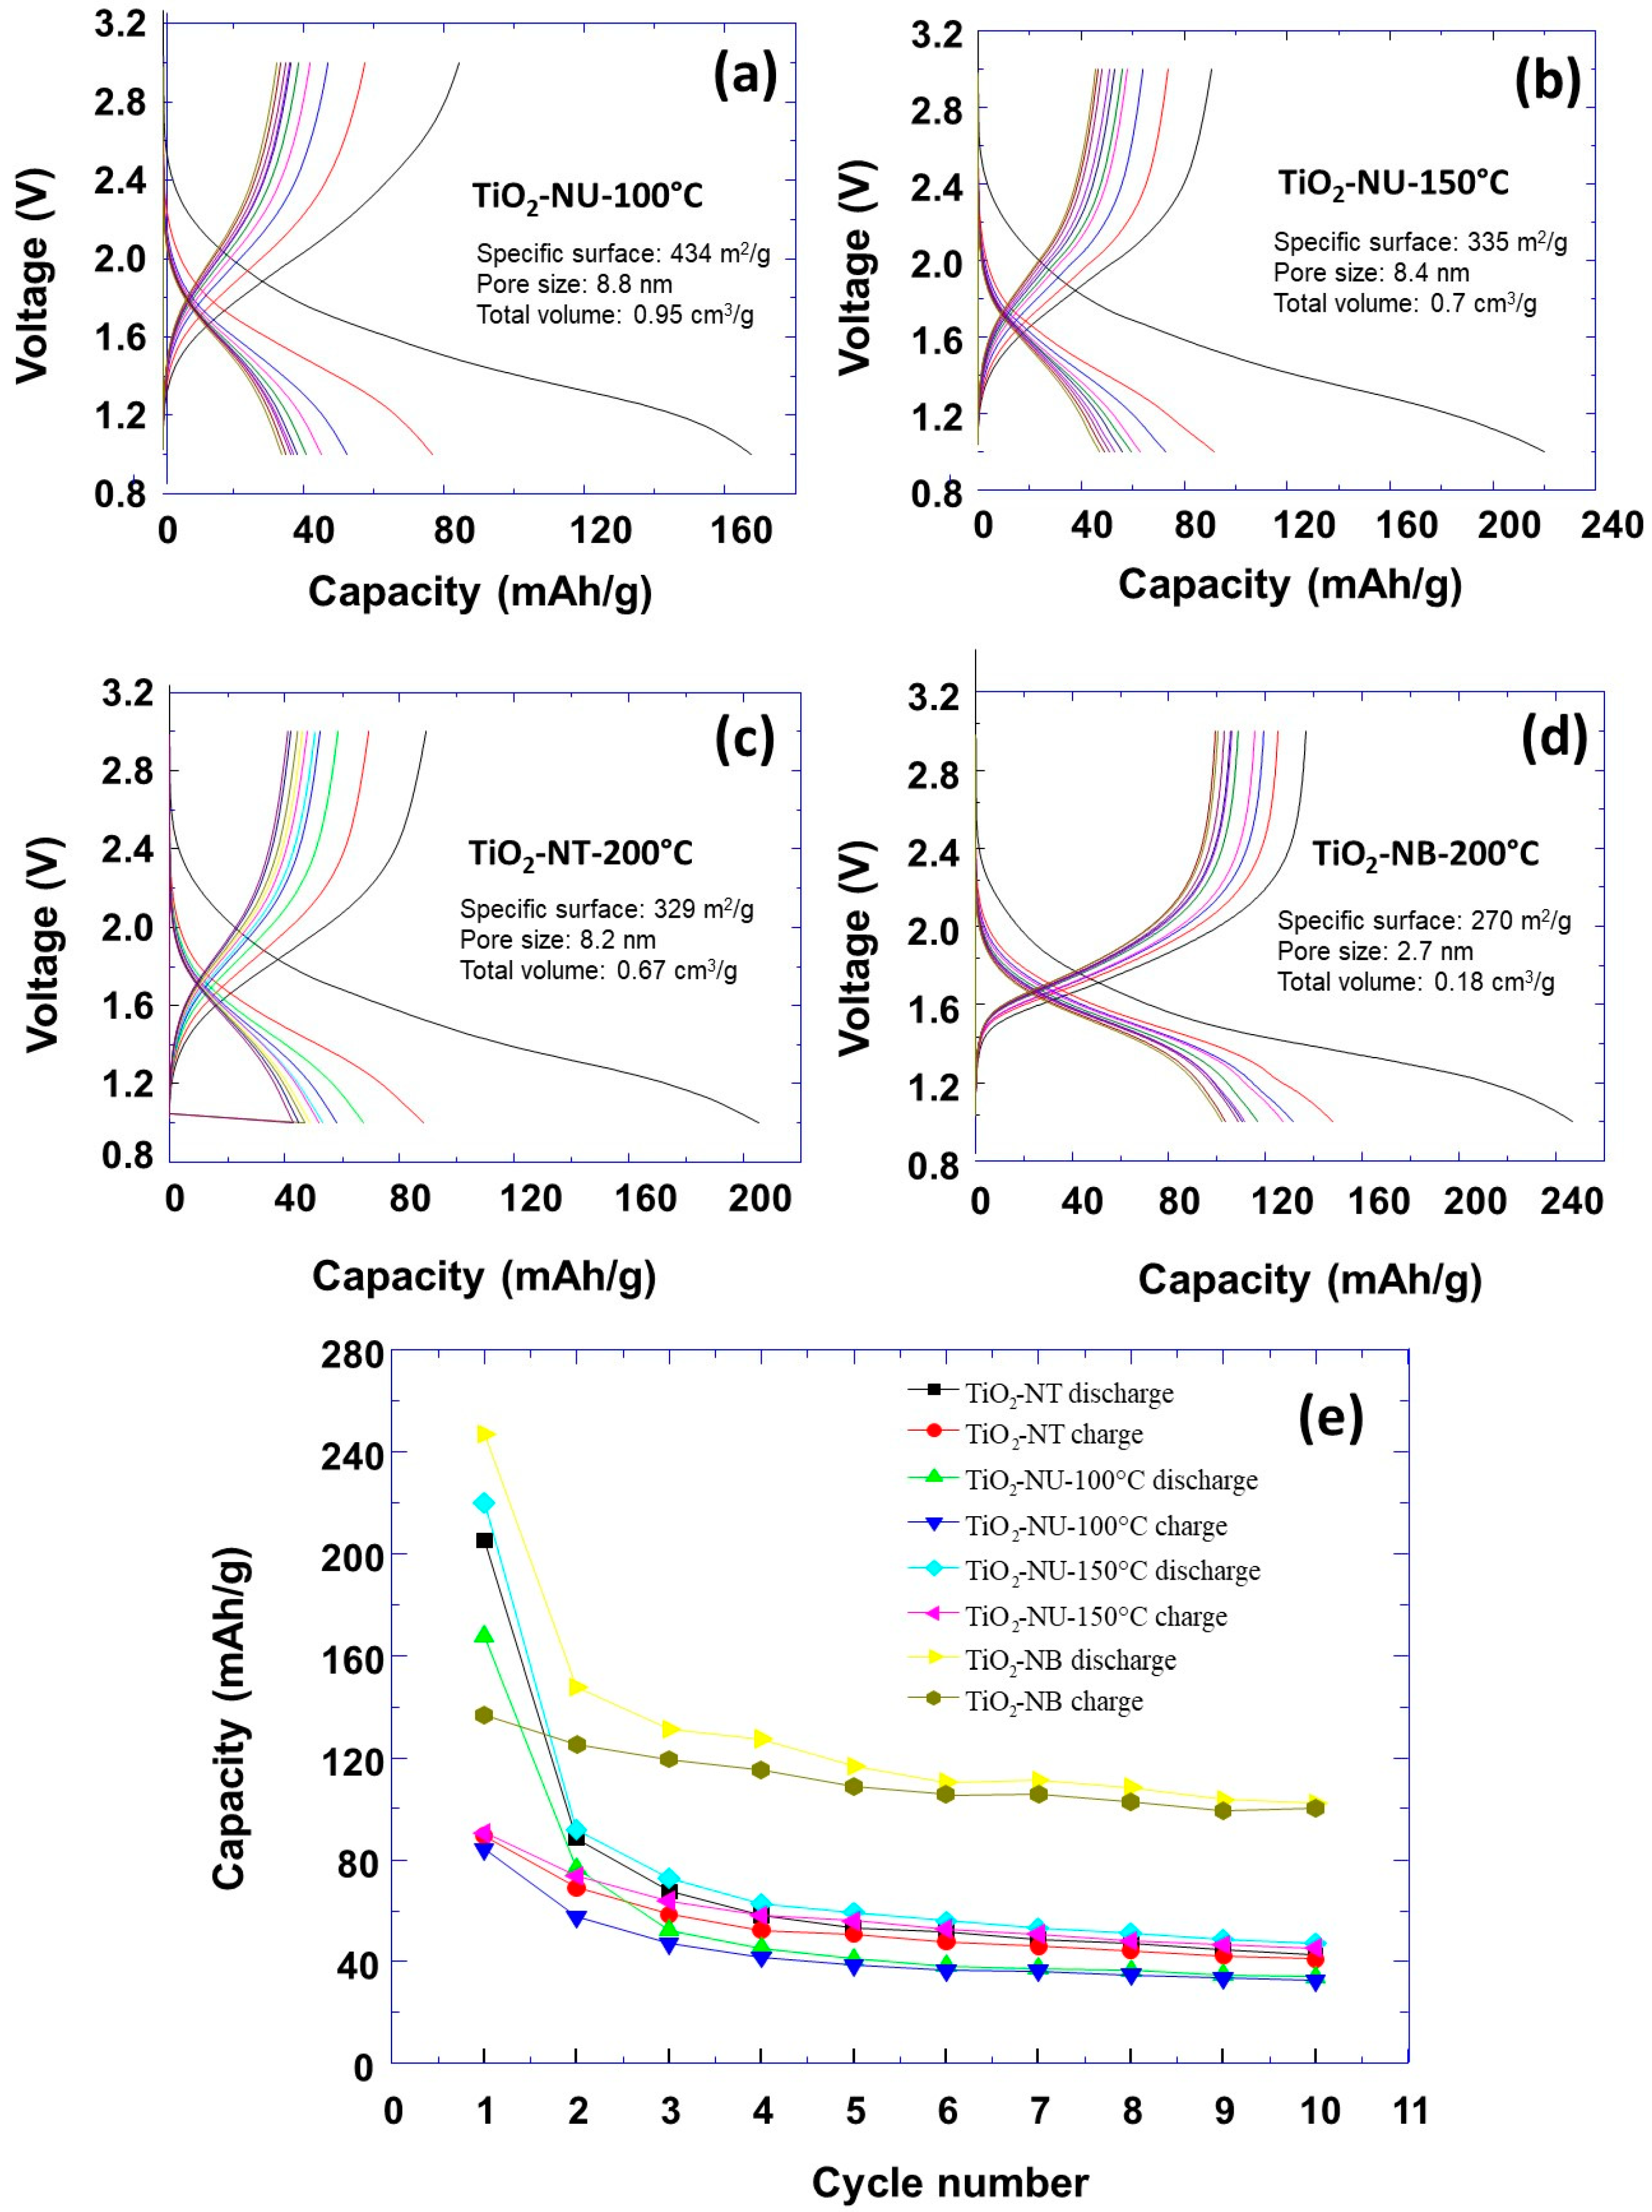
| Specific surface | 329 m2g−1 | 434 m2g−1 | 335 m2g−1 | 270 m2g−1 |
| Initial specific capacity | 210 mAh/g | 170 mAh/g | 220 mAh/g | 250 mAh/g |
| Specific capacity after 5 cycles | 60 mAh/g | 45 mAh/g | 65 mAh/g | 120 mAh/g |
| Specific capacity after 10 cycles | 45 mAh/g | 40 mAh/g | 50 mAh/g | 110 mAh/g |
| Specific capacity retention after 10 cycles | 21% | 23% | 22.72% | 44% |
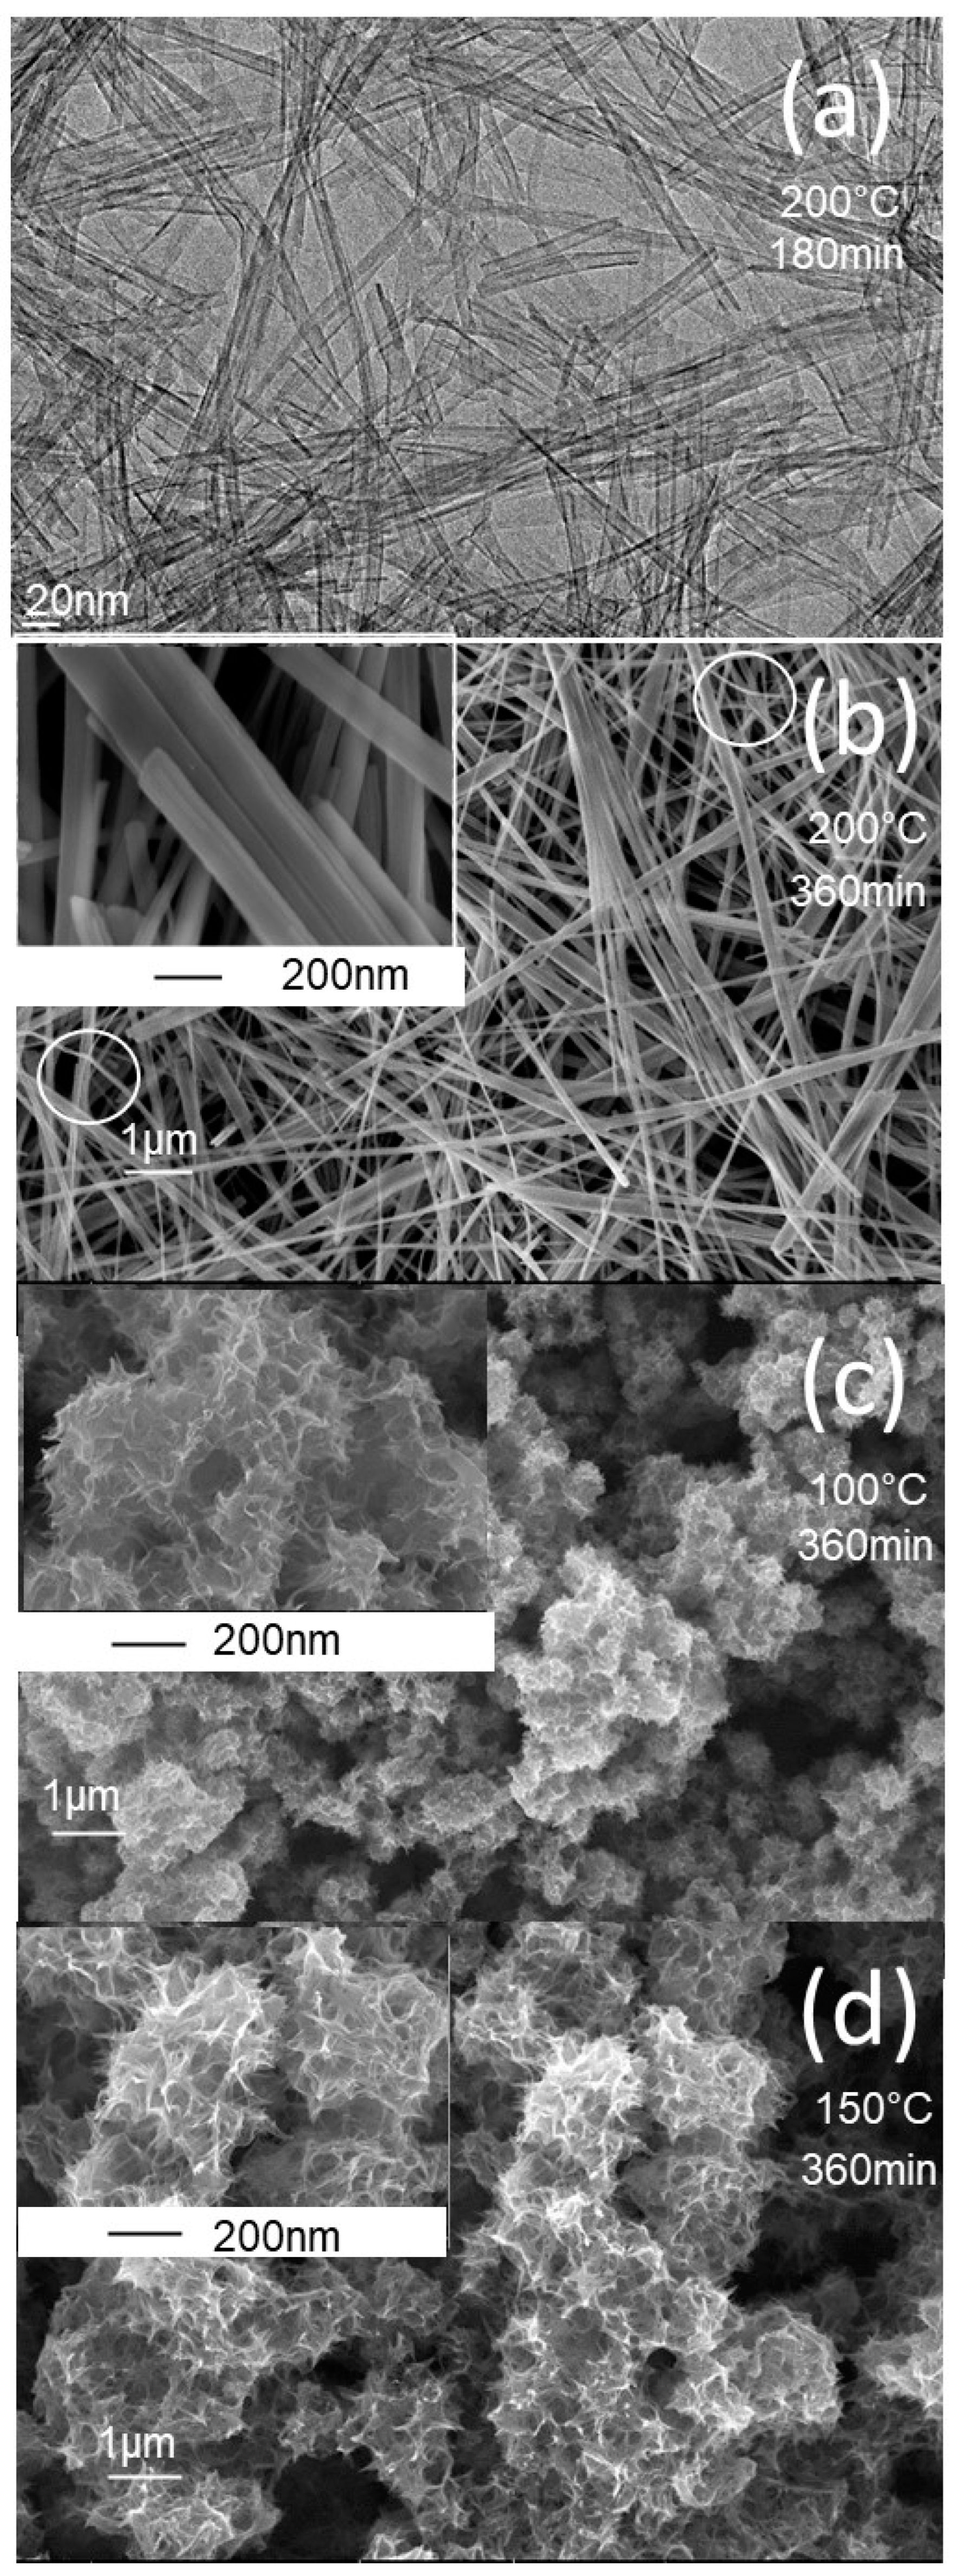
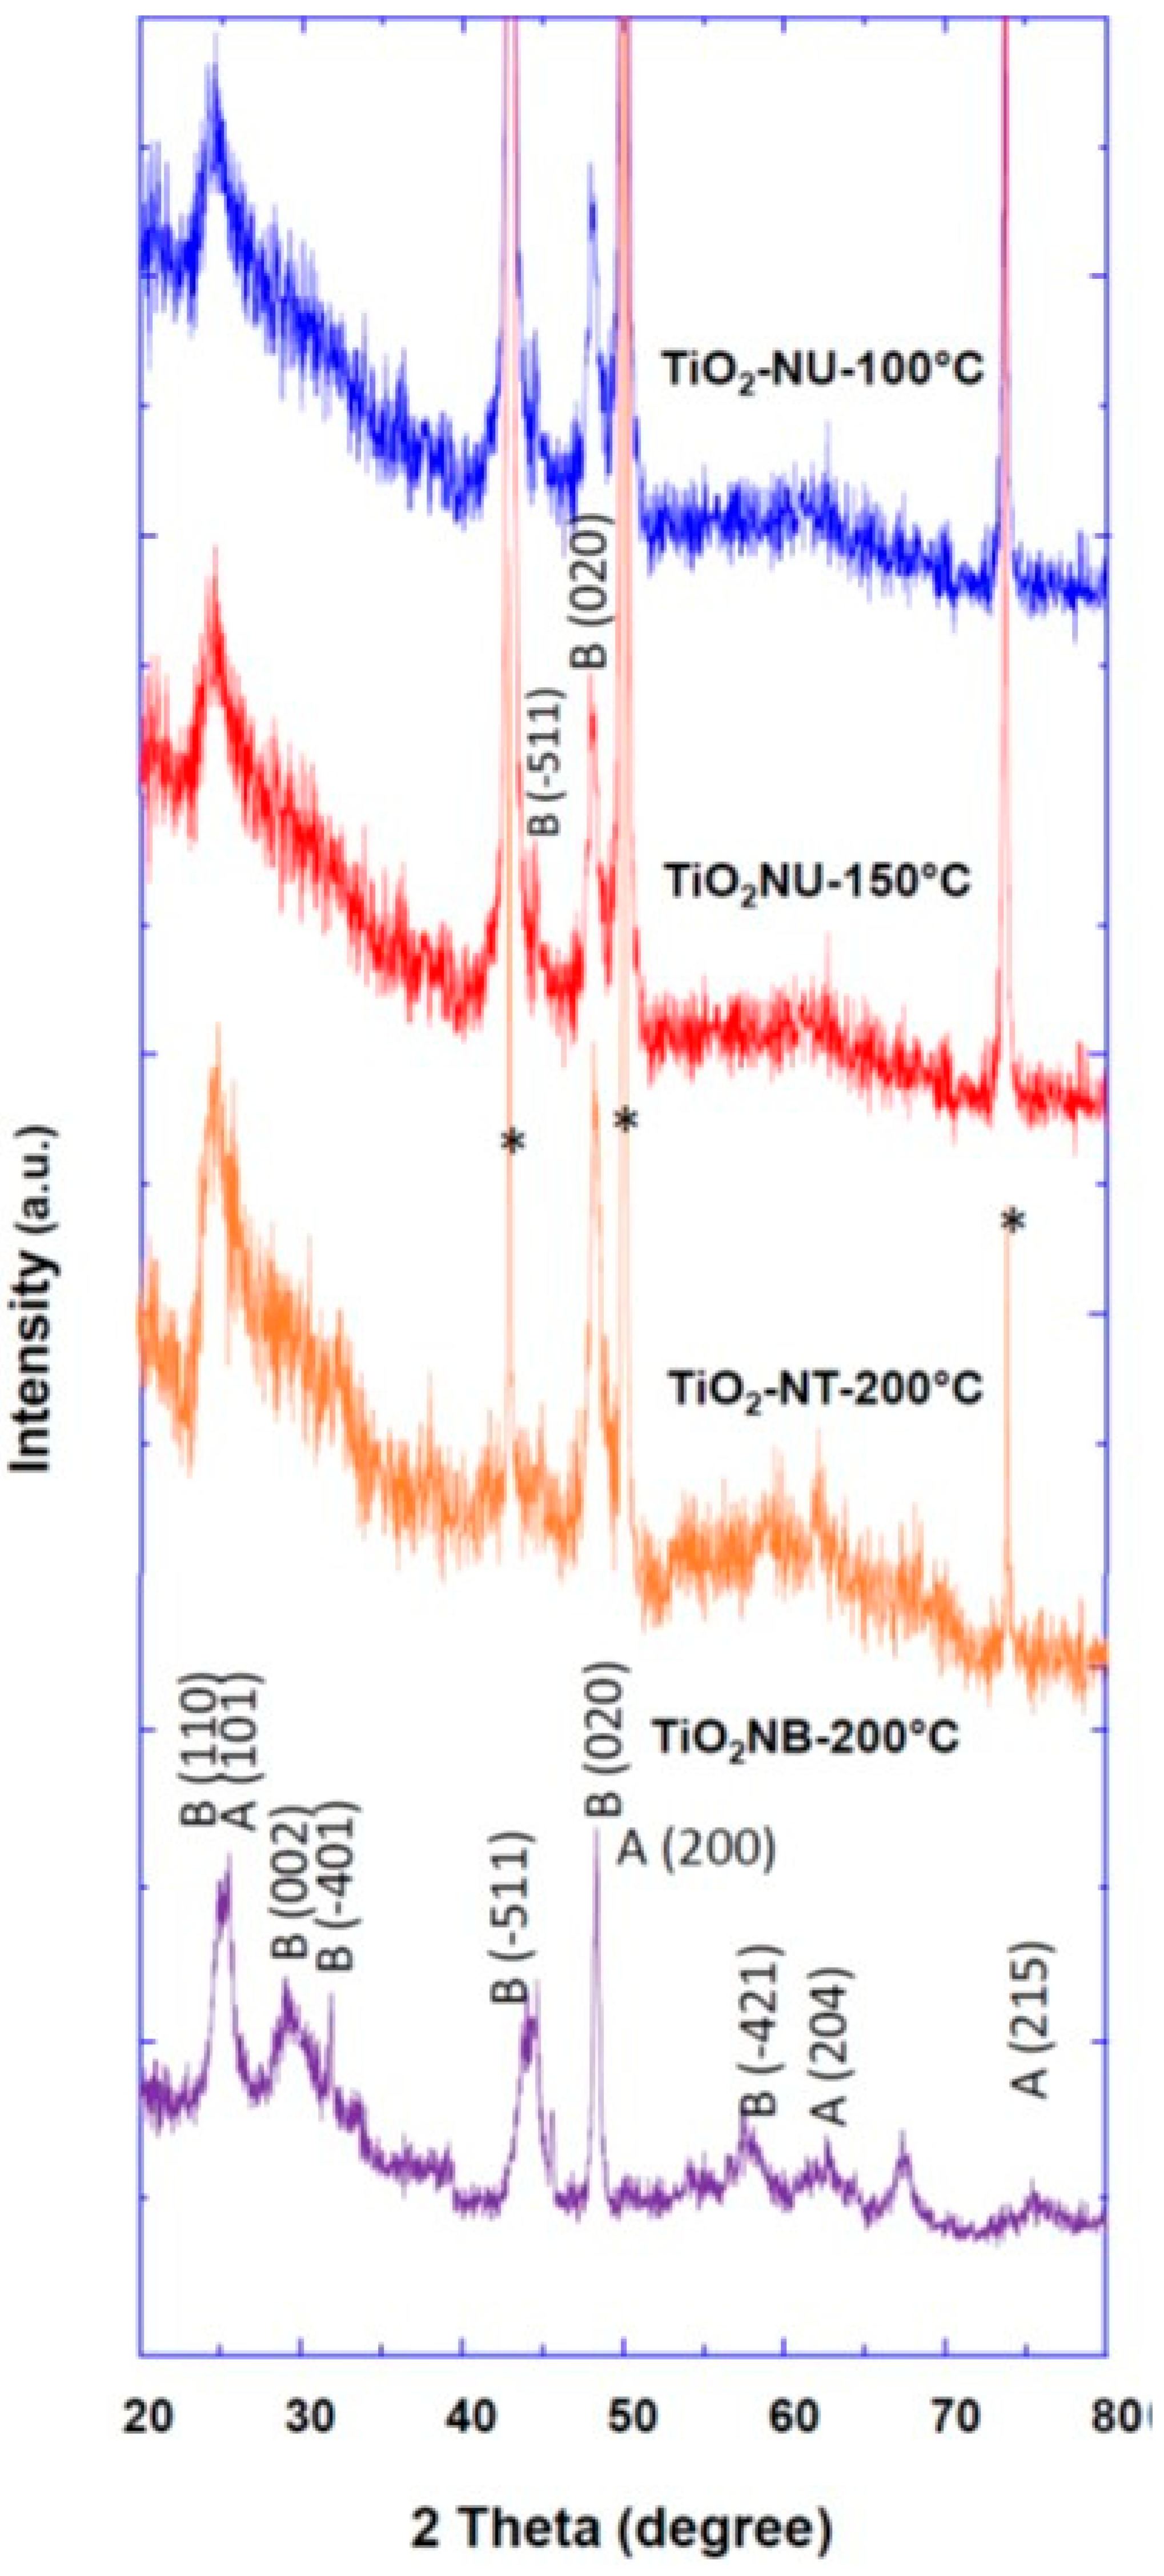
| Crystallite size after synthesis | 198.8 nm | 79.3 nm | 82.6 nm | 219.7 nm |
| Crystallite size after 10 cycles | 66.1 nm | 61.4 nm | 60.2 nm | 45.3 nm |
Disclaimer/Publisher’s Note: The statements, opinions and data contained in all publications are solely those of the individual author(s) and contributor(s) and not of MDPI and/or the editor(s). MDPI and/or the editor(s) disclaim responsibility for any injury to people or property resulting from any ideas, methods, instructions or products referred to in the content. |
© 2023 by the authors. Licensee MDPI, Basel, Switzerland. This article is an open access article distributed under the terms and conditions of the Creative Commons Attribution (CC BY) license (https://creativecommons.org/licenses/by/4.0/).
Share and Cite
Luo, W.; Blanchard, J.; Xue, Y.; Taleb, A. The Influence of TiO2 Nanoparticles Morphologies on the Performance of Lithium-Ion Batteries. Nanomaterials 2023, 13, 2636. https://doi.org/10.3390/nano13192636
Luo W, Blanchard J, Xue Y, Taleb A. The Influence of TiO2 Nanoparticles Morphologies on the Performance of Lithium-Ion Batteries. Nanomaterials. 2023; 13(19):2636. https://doi.org/10.3390/nano13192636
Chicago/Turabian StyleLuo, Wenpo, Juliette Blanchard, Yanpeng Xue, and Abdelhafed Taleb. 2023. "The Influence of TiO2 Nanoparticles Morphologies on the Performance of Lithium-Ion Batteries" Nanomaterials 13, no. 19: 2636. https://doi.org/10.3390/nano13192636