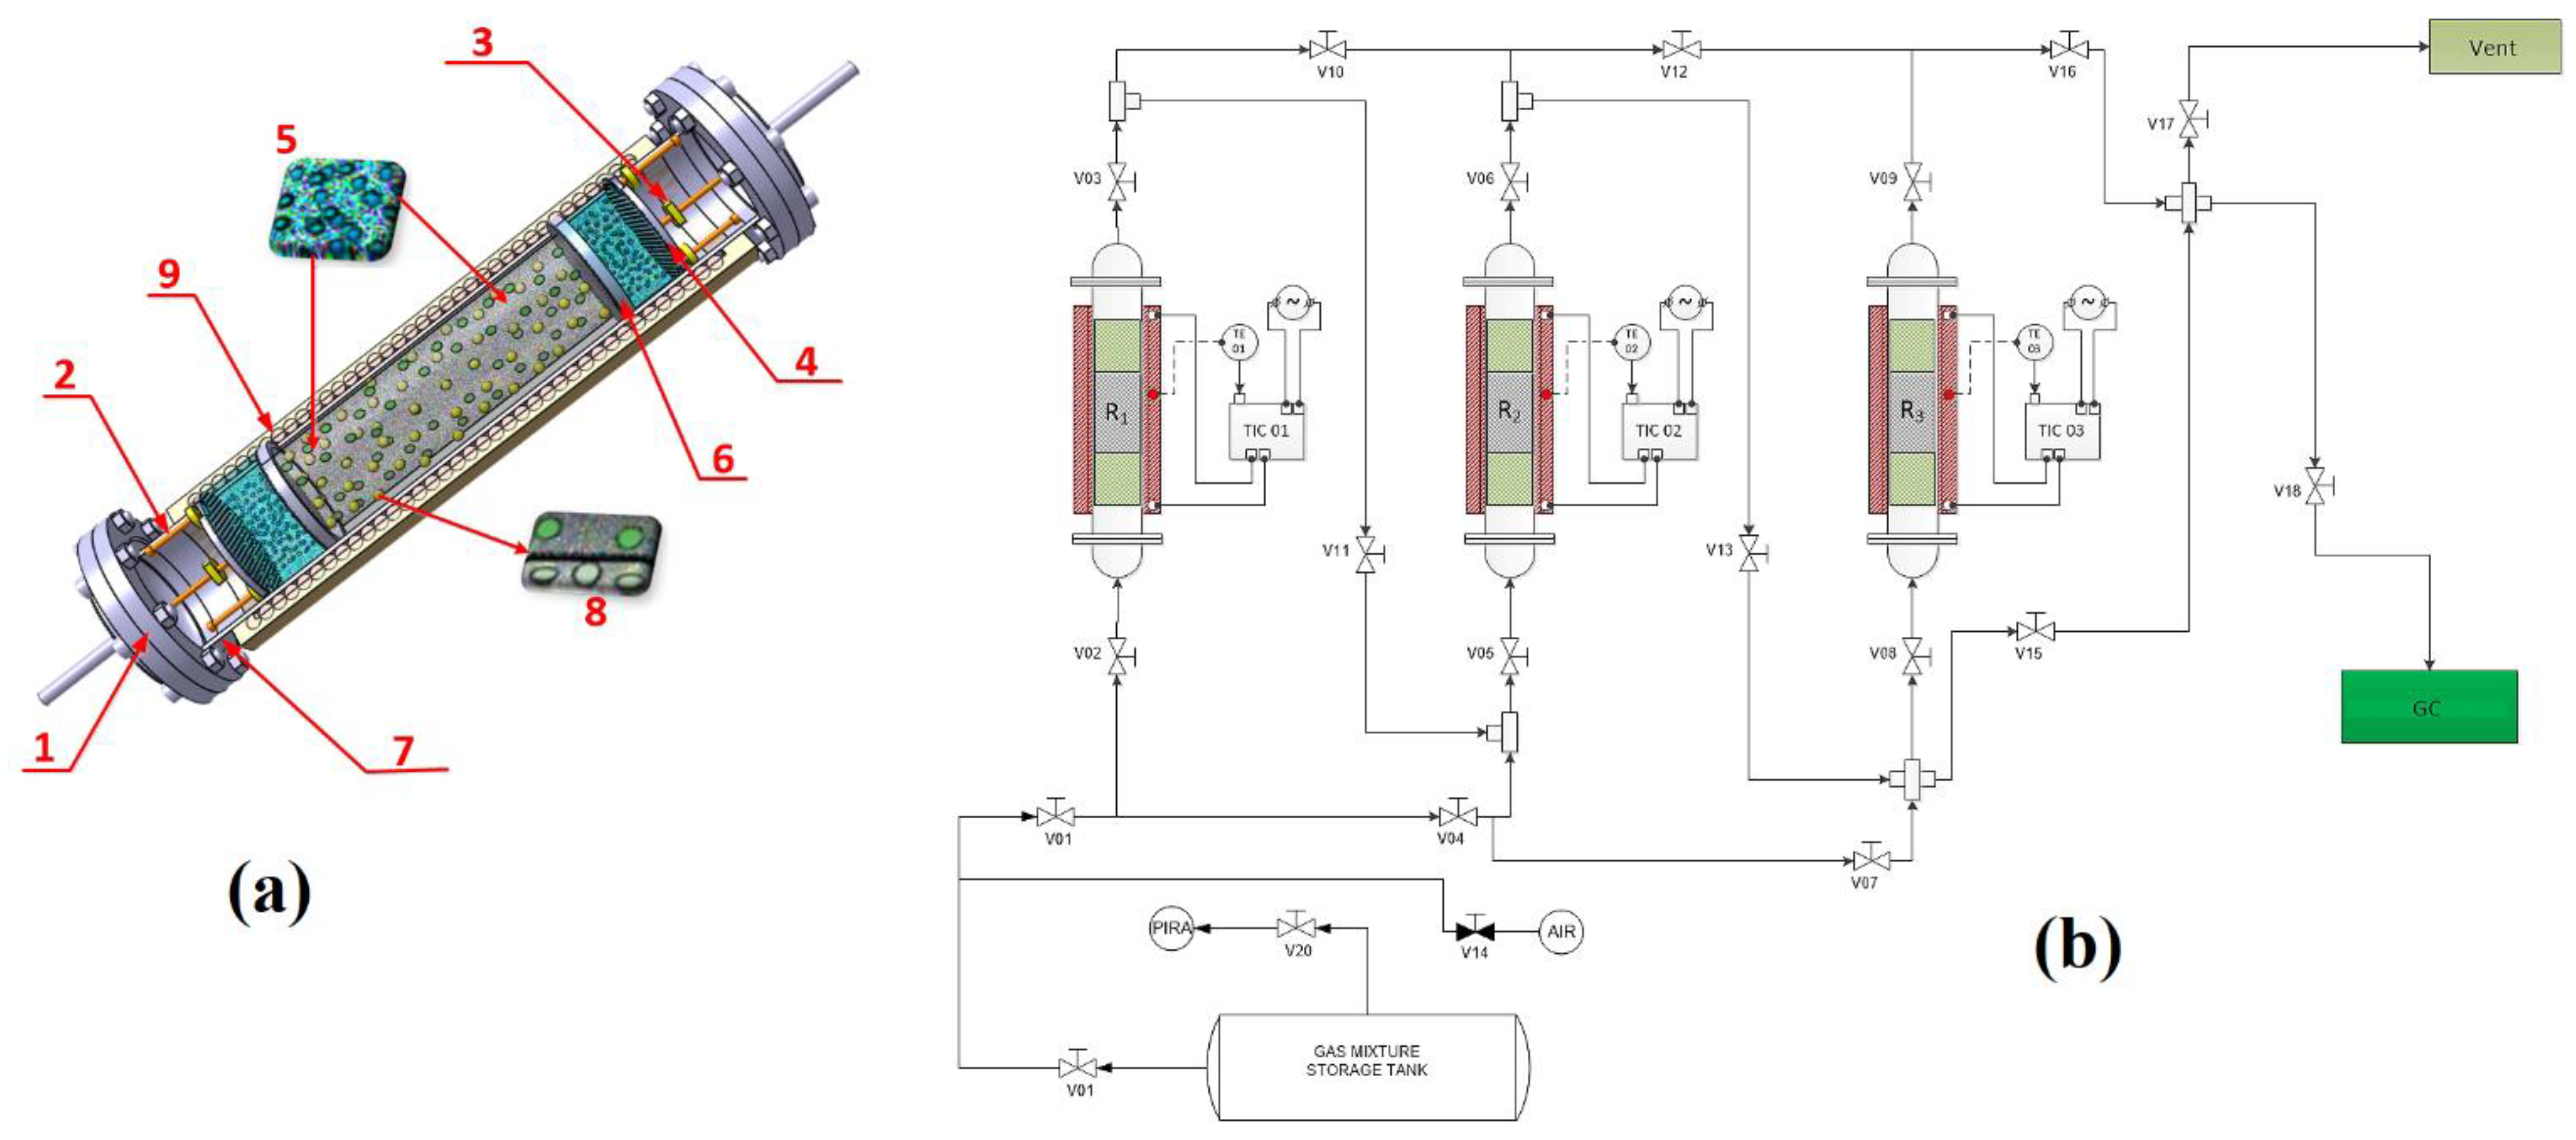
3.1. Characterisation and Behaviour of the Fe-BTC
Due to Fe’s low toxicity and excellent biocompatibility, expanded usage of Fe-BTC in the GHG adsorption niche is typically viewed as an exceptionally desirable goal [
30]. The tests conducted, along with related validations using GC, EA and FTIR, revealed a MOF, Fe-BTC, which has selective adsorption capacity—affinity for the investigated gas mixture—as a result of a molecular sieving effect [
10]. Technically, the process involved molecules with the appropriate kinetic diameter, which were blocked and trapped in the pores of the Fe-BTC structure (CO
2—3.3 Å). Also, the tests performed demonstrated that, even during the synthesis of Fe-BTC, the parameters were optimized (in terms of BET surface area and total volume of the pores) to increase the amount of adsorbed CO
2; ultramicropores and narrowed micropores had a critical role for the adsorbed CO
2, as presented in
Table 2. The adsorption capacity,
a = 188.11 cm
3/g, was superior when Fe-BTC was used, by 27.5 wt.% (around 140 cm
3/g at P = 8.5 bar and T = 298 K [
31]), which can be correlated with the average of other BTC-type MOFs (188-210 cm
3/g) [
32,
33], at T = 273.15–293.15 K and P = 1 bar.
The physical phenomenon of adsorption starts with the occupation of side rings, followed by the filling of unoccupied positions—channels around the unsaturated Fe atoms filled with CO
2 at a pressure that is slightly increased in relation to that set in the gas regulator [
34]. The presence of micropores (<0.7 nm) has been reported to be crucial for high CO
2 adsorption at ambient pressures [
35]. The loading of Fe-BTC with CO
2 is facilitated by the electrostatic interaction of the molecule with the open or exposed metal sites of the MOF [
36]. Also, CO
2 molecules could form coordination compounds on Lewis sites in mesoporous MOFs, further enhancing CO
2 adsorption and creating the premises for CO
2 solubility inside this structure [
37]. In addition, the Fe-BTC particles facilitate gas diffusion, providing an extra porous network for the transport of CO
2 molecules. To validate the adsorption behaviour of Fe-BTC, a representative and defining investigation was carried out.
Gas chromatography (
Figure 2) was performed to qualitatively and quantitatively determine the adsorption.
The method followed, in real time, the accelerated slope of decrease of CO2 concentration,1(5.89 vol%, reference material/initial value in house) towards 0.02 vol% (~200 ppm ± 5%), the lowest value recorded by GC, with RSD < 3%, followed by a slow return (deceleration) towards the saturation process of Fe-BTC (15.79 vol% ± 5%), the maximum measured value. Practically, the adsorption process was defined by three distinct segments: the first, ranging from 15.89 to 0.02 vol%, displaying a decrease rate of 2.24 vol%; the second, 0.02–0.55 vol%, characterized by an adsorption level, with a rate of 0.05 vol% and the third, 0.55–15.79 vol%, representing the saturation period, with a growth rate of 1.35 vol%.
Elemental analysis (EA), namely, the qualitative and quantitative determination of C (wt.%) from the Fe-BTC sample, was performed using a hybrid investigation method: combustion coupled with gas chromatography [
38]. The objective of this investigation was to examine the evolution of CO
2 as C in the Fe-BTC sample and the behaviour of the samples collected before and after the experiments from the developed MOF column-reactor system, with P = 1–5 bar; T = 313.15–373.115 K and Q: 100 mL/min as working conditions.
The results of the EA investigation revealed an increase in the C concentration at the end of the experiment compared to the initial levels, from Cinitial = 34.68 wt.% up to Cfinal = 39.62 wt.%.
The EA results, in conjunction with the findings from the GC and FTIR investigation, validated the high affinity for the selective adsorption of Fe-BTC towards CO2 from a gaseous mixture.
FTIR analysis (
Figure 3) confirmed the presence of CO
2 molecules on the surface of the nanomaterial. The intense bands at 1371 and 752 cm
−1 confirmed the presence of the trimesic linker in Fe-BTC [
39]. Therefore, the Fe-BTC material not only has a similar topology to a commercial MOF, named Basolite F300, but also exhibits a similar bonding environment. This suggests that the nature of the synthesized material, Fe-BTC, is probably equivalent to Basolite F300. After CO
2 adsorption, the intensity of Fe-BTC specific peaks and bands decreased following adsorption (
Figure 3). The lack of CO
2 molecule- specific peaks does not imply that CO
2 is not present, but can be correlated with the fact that it is physically adsorbed on the nanomaterial surface.
Both before and after the adsorption-desorption experiments, Fe-BTC was examined by scanning electron micrographs (SEM), and their analysis did not provide sufficient information to determine whether the adsorbate was physically present or whether the tested adsorbent underwent potential changes (
Figure 4).
The Fe-BTC exhibited a homogeneous, dense structure, having granular-shaped nanoparticles with an average particle size of about 200 mm, consistent with other studies [
39]. EDS analysis revealed the presence of peaks assigned to oxygen, carbon and Fe. The initial concentration of Fe was 12 wt.%, which, after adsorption, decreased to 7 wt.%, while oxygen increased from 49 wt.% up to 54 wt.%. Also, EDS confirmed the increase in C concentration, from 35 wt.% to 40 wt.%.
An investigation of the specific surface area and pore distribution was performed on the Fe-BTC nanomaterial (
Figure S1—Supplementary Materials). The specific surface area of the sample was 360 m
2/g, according to Brunauer–Emmett–Teller (BET), and the pore size distribution shows micropores with an average diameter of about 1.9 nm, as well as mesopores with an average diameter of around 2.4 nm. The N
2 adsorption–desorption results showed that the sample has a porous structure at the boundary between micro- and mesopores, consistent with SEM morphology and literature data [
40].
The calculation of predictions involves simulating scenarios by running a series of variables-drivers, coefficients and technical parameters, with the stated purpose of (i) saving resources, (ii) improvement and/or (iii) mitigation of hazards associated with the technological processes being implemented [
41]. In the case of Fe-BTC, a range of variables were considered to predict the CO
2 adsorption capacity. The key parameters, P (bar) and T (K), were selected based on the literature and third influence on the adsorption processes within the MOF column-reactor system, as depicted in
Figure 5. The predictions of the adsorption capacity dynamics,
a (cm
3/g), were evaluated using the equations common to the linear interpolation and extrapolation functions [
42]:
where
= independent variable;
= first independent variable;
= second independent variable;
= function value at value
;
= function value at
value and
where
and
are the coordinate points.
In accordance with the predictions (
Figure 5), each of the following scenarios was represented by two fixed intervals: (i) the prediction as a function of P (bar), 1 and 5 vs. 1–10; (ii) prediction as a function of T (K), 313.15 and 373.15 vs. 313.15–423.15. In conclusion, for Fe-BTC, the two running variables, P (bar) and T(K), for 40 points, can have a low, different impact on the evolution of the dynamics of the CO
2 adsorption capacity, as follows: (i) the P (bar) variation scenario, of <0.5%, for the interval 186.58–188.11 cm
3/g; (ii) the variation scenario of T (K), of <0.5%, for the interval 186.58–188.49 cm
3/g.
Recyclability is an important issue for solid adsorbents. Fe-BTC illustrates an adsorption capacity value over four adsorption–desorption cycles in the range of ainitial ± 10%.
3.2. Characterisation and Behaviour of UiO-66
The selective adsorption of CO2 in UiO-66 is based on the interactions that occur between the guest molecules and the topological or chemical characteristics of the MOF as a host. Although researchers have developed a rich library of UiO-66 that varies in shape, size and physicochemical functionality, a molecular-level understanding of how structure and functionality affect adsorption and transport has yet to be fully demonstrated.
UiO-66 involves octahedral nodes with a compact cubic unit cell structure. To date, the selective CO
2 adsorption capacities for UiO-66, with incorporated functionalities, have been studied and ranged from 2.7 wt.% (T = 298 K) to 25.6 wt.% (T = 273 K) [
43]. MOFs of the UiO-66 class are characterized by excellent chemical, thermal and mechanical properties [
44]. Furthermore, UiO-66 is considered highly stable, with increased selectivity for CO
2 adsorption, high workability and efficient recyclability [
45]. The selectivity of this MOF indicates a higher adsorption capacity for CO
2 compared to other gases, such as CH
4, N
2, CO and H
2. The amount of CO
2 adsorbed at T = 303 K, P = 0.99 bar can reach an adsorption capacity of 23.52 cm
3/g [
46]. The CO
2 adsorption capacity value for UiO-66 was reported in the literature [
46] to be 40.79 cm
3/g (298 K, 1 bar), which is equivalent to the general adsorption capacity of UiO-66 (32.10 cm
3/g). This measurement is comparable to the 54.22 cm
3/g measurement made in this study (
Table 3).
The selective adsorption capacity performance of UiO-66 was attributed to its high specific surface area, easily tuneable pore structure and high chemical and thermal stability. However, its CO
2 adsorption amount is somewhat modest compared to that of Fe-BTC, which is in accordance with the literature [
17].
The results of the experiments indicate two reasons for CO
2 binding inside UiO-66: (i) the different vibrational frequencies of the O=C=O asymmetric stretching mode, a configuration made by -H bonds with μ
3-OH groups on the UIO-66 nodes and (ii) dispersive interactions, where the topological features of the MOF affect the adsorption of GHG gas molecules [
47].
The smaller pore diameters in UiO-66 were principally responsible for the selective CO
2 absorption; nevertheless, the presence of N
2 atoms in the pores appears to be advantageous for improving selectivity and mechanically aids in channel narrowing [
48]. Knowing that UiO-66 contains two types of pores—octahedral and tetrahedral—which differ mostly in the orientation of the terephthalic bonds so that, in the tetrahedral ones, the organic bonds are closer to the interior of the pores by their size (tetrahedral (8 Å) and octahedral (11 Å)), the working pressure of the experiments (P = 1–5 bar) favoured more than 95% filling of the tetrahedral pores with CO
2, the adsorption in the octahedral pores being possible at higher pressures. This observation may lead to the conclusion that the CO
2 molecules fit perfectly in the corners of the tetrahedral pores, but not in the octahedral pores. This is attributed to the known size entropy effect of CO
2 in the pores [
48]. In other words, tetrahedral pores contain adsorption zones with affinity for CO
2 and octahedral pores do not [
49]. Validation of the selective adsorption capacity of UIO-66 was investigated using gas chromatography, EA and FTIR.
Gas chromatography (
Figure 6) investigated the evolution of the CO
2 concentration in a gaseous mixture on three segments: the first, between 15.89–0.44 vol%, with a decrease rate of 10.92 vol%; the second, 0.44–10.31 vol%, characterized by an adsorption plateau, with a rate of 3.78 vol% and the third, 10.31–15.62 vol%, representing the saturation period, with an increase rate of 1.20 vol%, with an average rate of 0.64 vol%, from one injection to another of the sample.
Elemental analysis (EA) involved the determination of C (wt.%) concentrations in the UiO-66 samples, and the results revealed an increase in the C (wt.%) content at the end of the experiment in relation to the initial levels: Cinitial = 31.00 wt.% vs. Cfinal = 35.34 wt.%.
As in the case of Fe-BTC, FTIR analysis (
Figure 7) confirmed the presence of CO
2 molecules on the surface of the nanomaterial.
The spectra of both samples are consistent with the literature and show intense bands in the 1700–1250 cm
−1 region, due to the carboxylate groups and deformations of the phenyl ring [
50]. The bands in the region 3100–2400 cm
−1 are due to C-H stretching modes. A sharp and narrow bit is detected at 3742 cm
−1 and is attributed to free hydroxyls—μ3 belonging to Zr6 groups [
50]. The bands at 1580 and 1390 cm
−1 were associated with esters and residual terephthalic acid [
50]. The band at 1658 cm
−1, together with a corresponding weak band at 1092 cm
−1, originates from residual DMF. The intense CO
2 ν
3 (O=C=O asymmetric stretching) mode registered at about 2500 cm
−1 and the weaker CO
2 combination bands (ν
3 + 2ν
2 and ν
3 + ν
1) from 2700 and 2950 cm
−1 confirmed the existence of CO
2 in the sample [
51]. The literature confirmed that the CO
2 combination modes can be applied for monitoring the CO
2 insertion into the nanoporous materials pores, the CO
2 behaviour, as well as the matrix–guest interaction [
51].
SEM analysis of the UiO-66 sample (
Figure 8), before and after the adsorption–desorption experiments, was not conclusive in evaluating the CO
2 presence.
Both before and after adsorption, UiO-66 presents a homogeneous dense structure. In can be observed that UiO-66 consists of nano-sized crystals of octahedral shape. UiO-66 exhibits a narrow crystal size distribution between 150 and 250 nm [
50]. Instead, EDS analysis revealed an increase in C concentration (from 31 wt.% up to 35 wt.%), confirming the hypothesis that CO
2 was adsorbed on the MOF surface. Also, EDS confirmed the presence of the Zr metal at a concentration of 41 wt.%, which decreased after adsorption to 40%; the oxygen concentration increased from 18 wt% to 21%, also confirming the CO
2 presence.
The UiO-66 material was also characterized by specific surface area and pore distribution (
Figure S2—Supplementary Materials). The specific surface area of the sample was 811 m
2/g, according to Brunauer–Emmett–Teller (BET), and the pore size distribution shows micropores with an average diameter of about 1.5–1.7 nm, as well as mesopores with diameter of 2.9 nm. The N
2 adsorption–desorption results showed that the sample has a porous structure at the boundary between micro- and mesopores, consistent with SEM morphology and literature data [
52].
The scenarios for UiO-66 ran two variables, P (bar) and T (K), with different impacts on the dynamic evolution of the CO
2 adsorption capacity, as follows: (i) scenario of P (bar) variation, by ~1.5%, for the interval 52.16–54.36 cm
3/g and (ii) the T (K) variation scenario, by ~1.3%, for the interval 52.05–54.22 cm
3/g (
Figure 9).
3.3. Characterization and Behaviour of the Cu–Zn–MCM-41
Mesoporous MCM-41 type materials are considered potential candidates for efficient adsorbents, due to their structure that facilitates the flow of GHGs [
53]. The literature presents MCM-41 functionalized with monoethanolamine with a maximum CO
2 adsorption capacity of 27.78–39.26 cm
3/g at T = 298.15 K and P = 1 bar [
54]. Also, MCM-41 adsorbent was modified with monoethanolamine and diethanolamine to improve CO
2 adsorption, registering high CO
2 adsorption capacity, even after 10 operating cycles [
55]. The synthesized nanomaterial, denoted as Cu–Zn–MCM-41, proved further selectivity towards CO
2 adsorption due to its physicochemical properties, which is in accordance with the literature [
56]. The explanation regarding the selective adsorption capacity can be related to the 2D hexagonal structure and the adjustable pore diameter. Fast adsorption kinetics and maximum recorded adsorption capacity of 33.95 cm
3/g CO
2 were demonstrated using the developed column-reactor system (
Table 4). The homogeneous arrangement in the reactor column of the filler (Cu–Zn–MCM-41) around the quartz balls—between the metal sandwich screens—allowed the contact surface to increase and the reaction time between the adsorbent and the adsorbate to be high [
57,
58]. The study of the physical adsorption mechanism of CO
2 suggested capillary condensation caused by the nanoscale channels of Cu–Zn–MCM-41 as the main contribution [
59].
Figure 10 presents the CO
2 adsorption at T = 313.15–373.15 K, P = 1–5 bar and Q = 100 mL/min, where, in independent stages, (i) pure N
2 passed through the silica surface in the first seconds, giving the background absorbance; (ii) CO
2 replaced N
2 in the flow and it was adsorbed on the silica surface; (iii) the absorbance corresponding to the process increases rapidly to reach an equilibrium state. The physical adsorption and rate were significantly improved with increasing pore size, a behaviour in contrast to that exhibited by Fe-BTC and UIO-66, due to the order degree, i.e., high crystallinity, this being consistent with a potential for higher interaction between the adsorbate and the adsorbent. Also, the weak van der Waals forces had a contribution to the physical adsorption capacity, an exothermic one—the increase in the isosteric heat between the adsorbent and adsorbate interface [
20,
60]. The cyclic stability of the developed Cu–Zn–MCM-41 was evaluated using reproducible adsorption–desorption experiments—under the same technical conditions—and the characterization results showed that the target adsorbents reacted successfully, showing good renewability and stability over the predetermined thermal range, 313.15–373.15 K on adsorption, at 313.15–298.15 K on desorption, with RSD ± 10%, at the end of 4 cycles [
61,
62]. The conclusive results place Cu–Zn–MCM-41 in the class of promising CO
2 adsorbents.
Elemental analysis (EA) revealed an increase in the concentration of C (wt.%) at the end of the experiment in relation to the initial level, from Cinitial = 0.79 wt.% to Cfinal = 3.04 wt.%.
As in the case of both MOFs, FTIR analysis (
Figure 11) confirmed the presence of CO
2 molecules on the surface of the nanomaterial.
The peak from 1632 cm
−1 corresponds to the deformation mode for the surface hydroxyl groups. The two bands from 1051 cm
−1 and 805 cm
−1 were assigned to stretching vibrations for symmetric and asymmetric Si-O clusters. The strain vibrations for the Si-O- groups on the silica surface were highlighted by the appearance of one peak at about 447 cm
−1 [
63]. Metallic interactions lead to increased distortions and vibrations of the silicon–oxygen tetrahedron, resulting in a more pronounced asymmetry [
56]. When the metals were introduced, the FTIR spectrum suffered some changes: a shoulder was registered at 577 cm
−1, attributed to Si-O-metal vibrations, concluding that metallic species were successfully impregnated on MCM-41. The introduction of metals was also confirmed by the disappearance of the peak at 615 cm
−1 specific to stretching vibrations for the Si-O- groups on the silica surface, confirming the positioning of the metal on the silica surface. When CO
2 was adsorbed on Cu–Zn–MCM-41, the peaks specific to the silica support decreased in intensity, demonstrating that CO
2 targeted the silanol surface (not the areas where the metallic species were bonded). Also, the band and peaks characteristic of CO
2 appeared.
The presence of prominent peaks at 1375 cm
−1 and 1580 cm
−1 may indicate the formation of carbamic acid, the first one being attributed to δ
OH, and the second one to C=O vibration [
64]. One can observe a large band at about 3400 cm
−1 which can be attributed to physically adsorbed water, probably present in the gas, adsorbed during the experiments or to -OH stretching of free surface OH groups [
64]. The peaks from 2780–2990 cm
−1 were attributed to C-H binding, which can be explained by the bond between the OH groups from the silica surface and the C from CO
2 [
64].
The FTIR analysis indicated that CO
2 not only is physically adsorbed on the silica surface, but most likely is also trapped as carbamic acid or carbamate species, corresponding to previously conducted studies regarding CO
2 binding on silica materials [
65].
As in the case of both MOFs, SEM analysis was inconclusive in revealing the presence of CO
2 at the nanomaterial surface (
Figure 12).
Scanning electron microscopy revealed the morphology of the sample (
Figure 12). The bimetallic system presented spherical and partially elongated particles with dimensions below 100 nm, the ordered morphology typical of MCM-41 mesoporous silica being maintained. EDS analysis confirmed Cu and Zn content. EDS also confirmed that, after CO
2 adsorption, the C and O percent increased, from 0.8 wt.% up to 3 wt.% and from 46 wt.% up to 49 wt.%.
The Cu–Zn–MCM-41 nanomaterial was also characterized by specific surface area and pore distribution (
Figure S3—Supplementary Materials). The specific surface area of the sample was 607 m
2/g, according to Brunauer–Emmett–Teller (BET), and the pore size distribution shows mesopores with diameter of 3.5 nm. The mesopore volume decreased drastically when metals were introduced into the silica matrix, down to 0.492 cm
3/g, one possible explanation being that the metals have entered the mesoporous silica matrix [
56].
For Cu–Zn–MCM-41, the two run variables had a direct impact on the evolution of the CO
2 adsorption capacity dynamics: (i) the P (bar) variation scenario, of <1%, for the interval 33.19–34.03 cm
3/g; (ii) the T (K) variation scenario, of <1%, for the interval 33.14–33.95 cm
3/g (
Figure 13).

 ,
, 


