3.1. Effect of Plasma–Substrate Distance on the Physicochemical Properties of DVE-3-Based Coatings
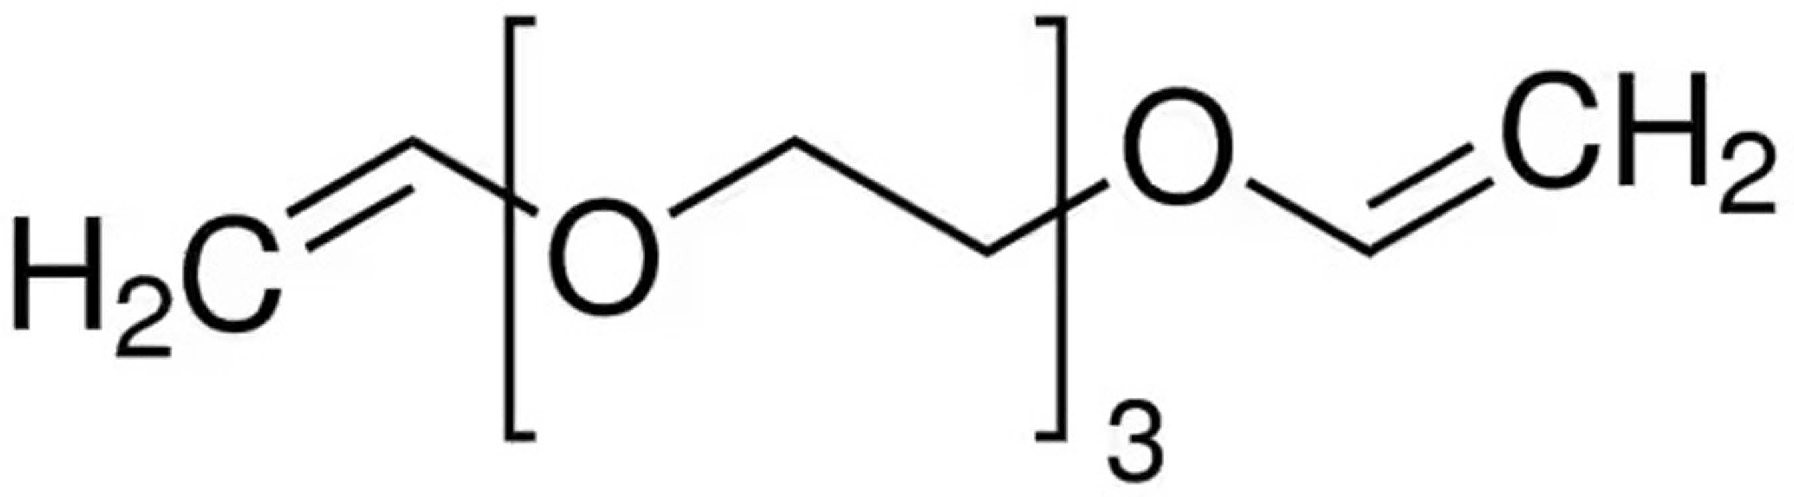
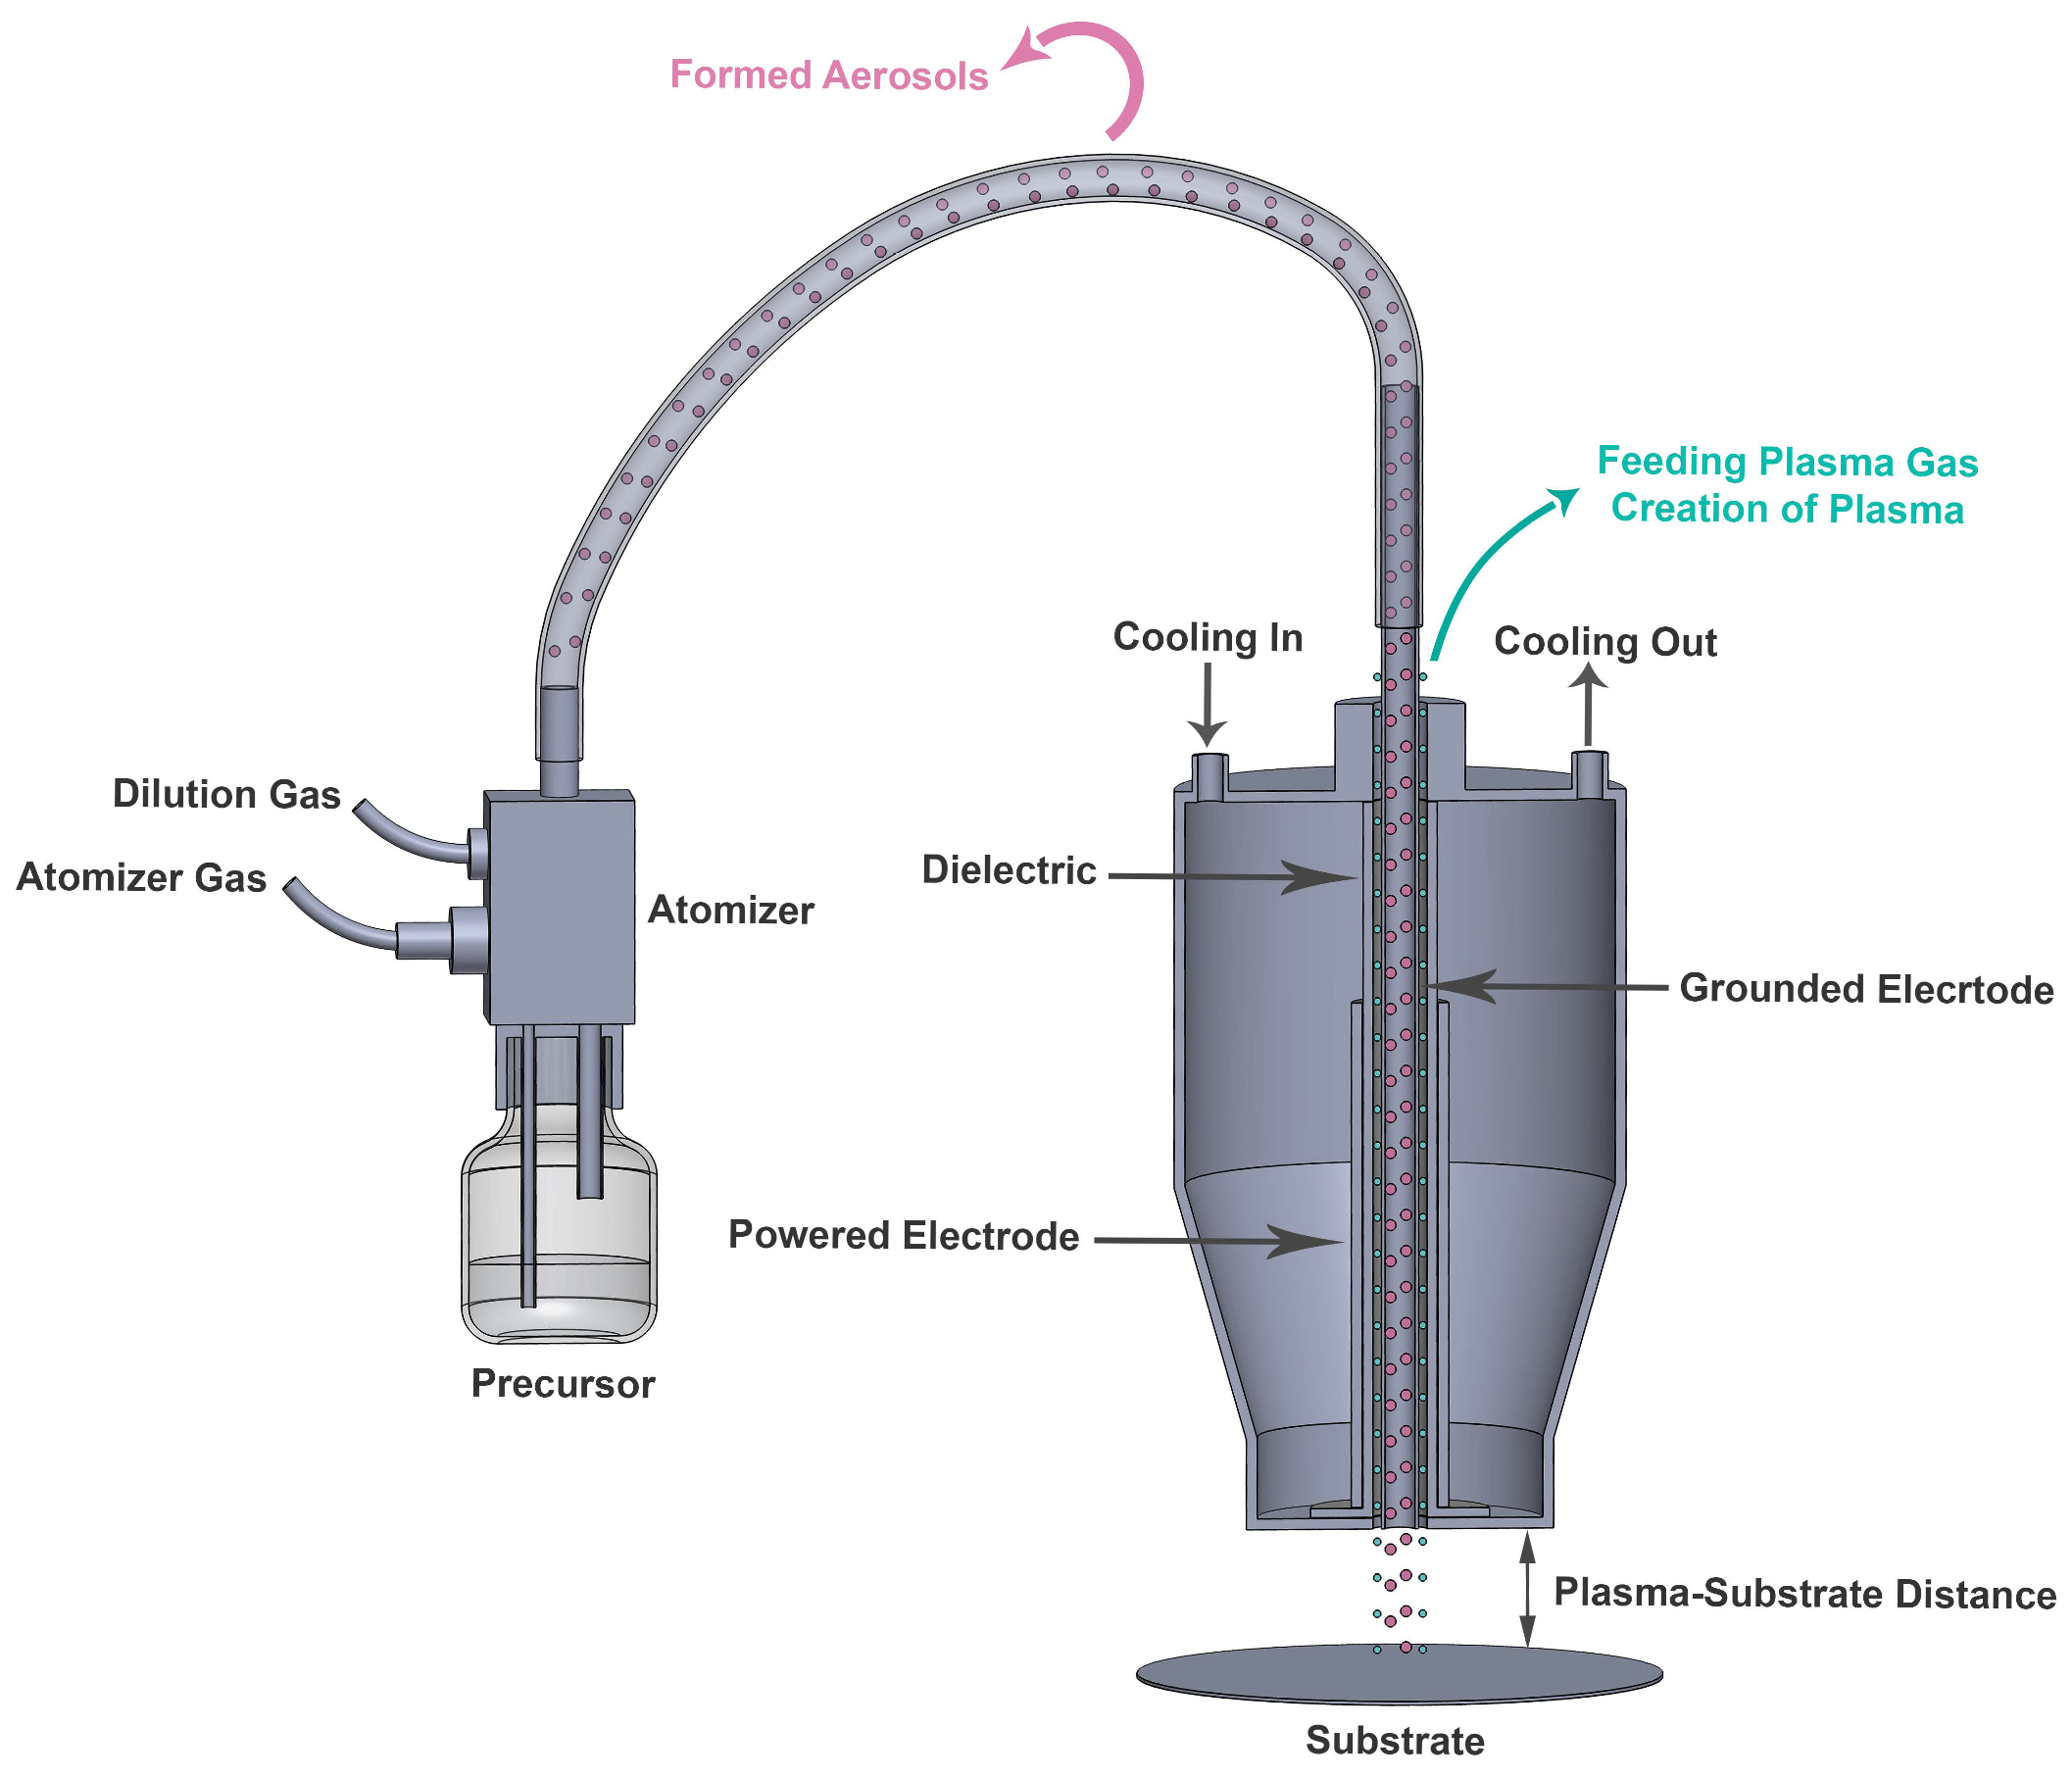
During the first step, the plasma polymerization of DVE-3 was conducted at various distances between the tip of the electrode (or the edge of the plasma head) and the substrate (2, 10, and 20 mm) at a constant input power of 175 W, and the impact of this distance on the coating properties was carefully examined. The reasons for choosing an input power of 175 W were to prevent excessive precursor fragmentation and to preserve the DVE-3 chemical structure as much as possible during the coating deposition.
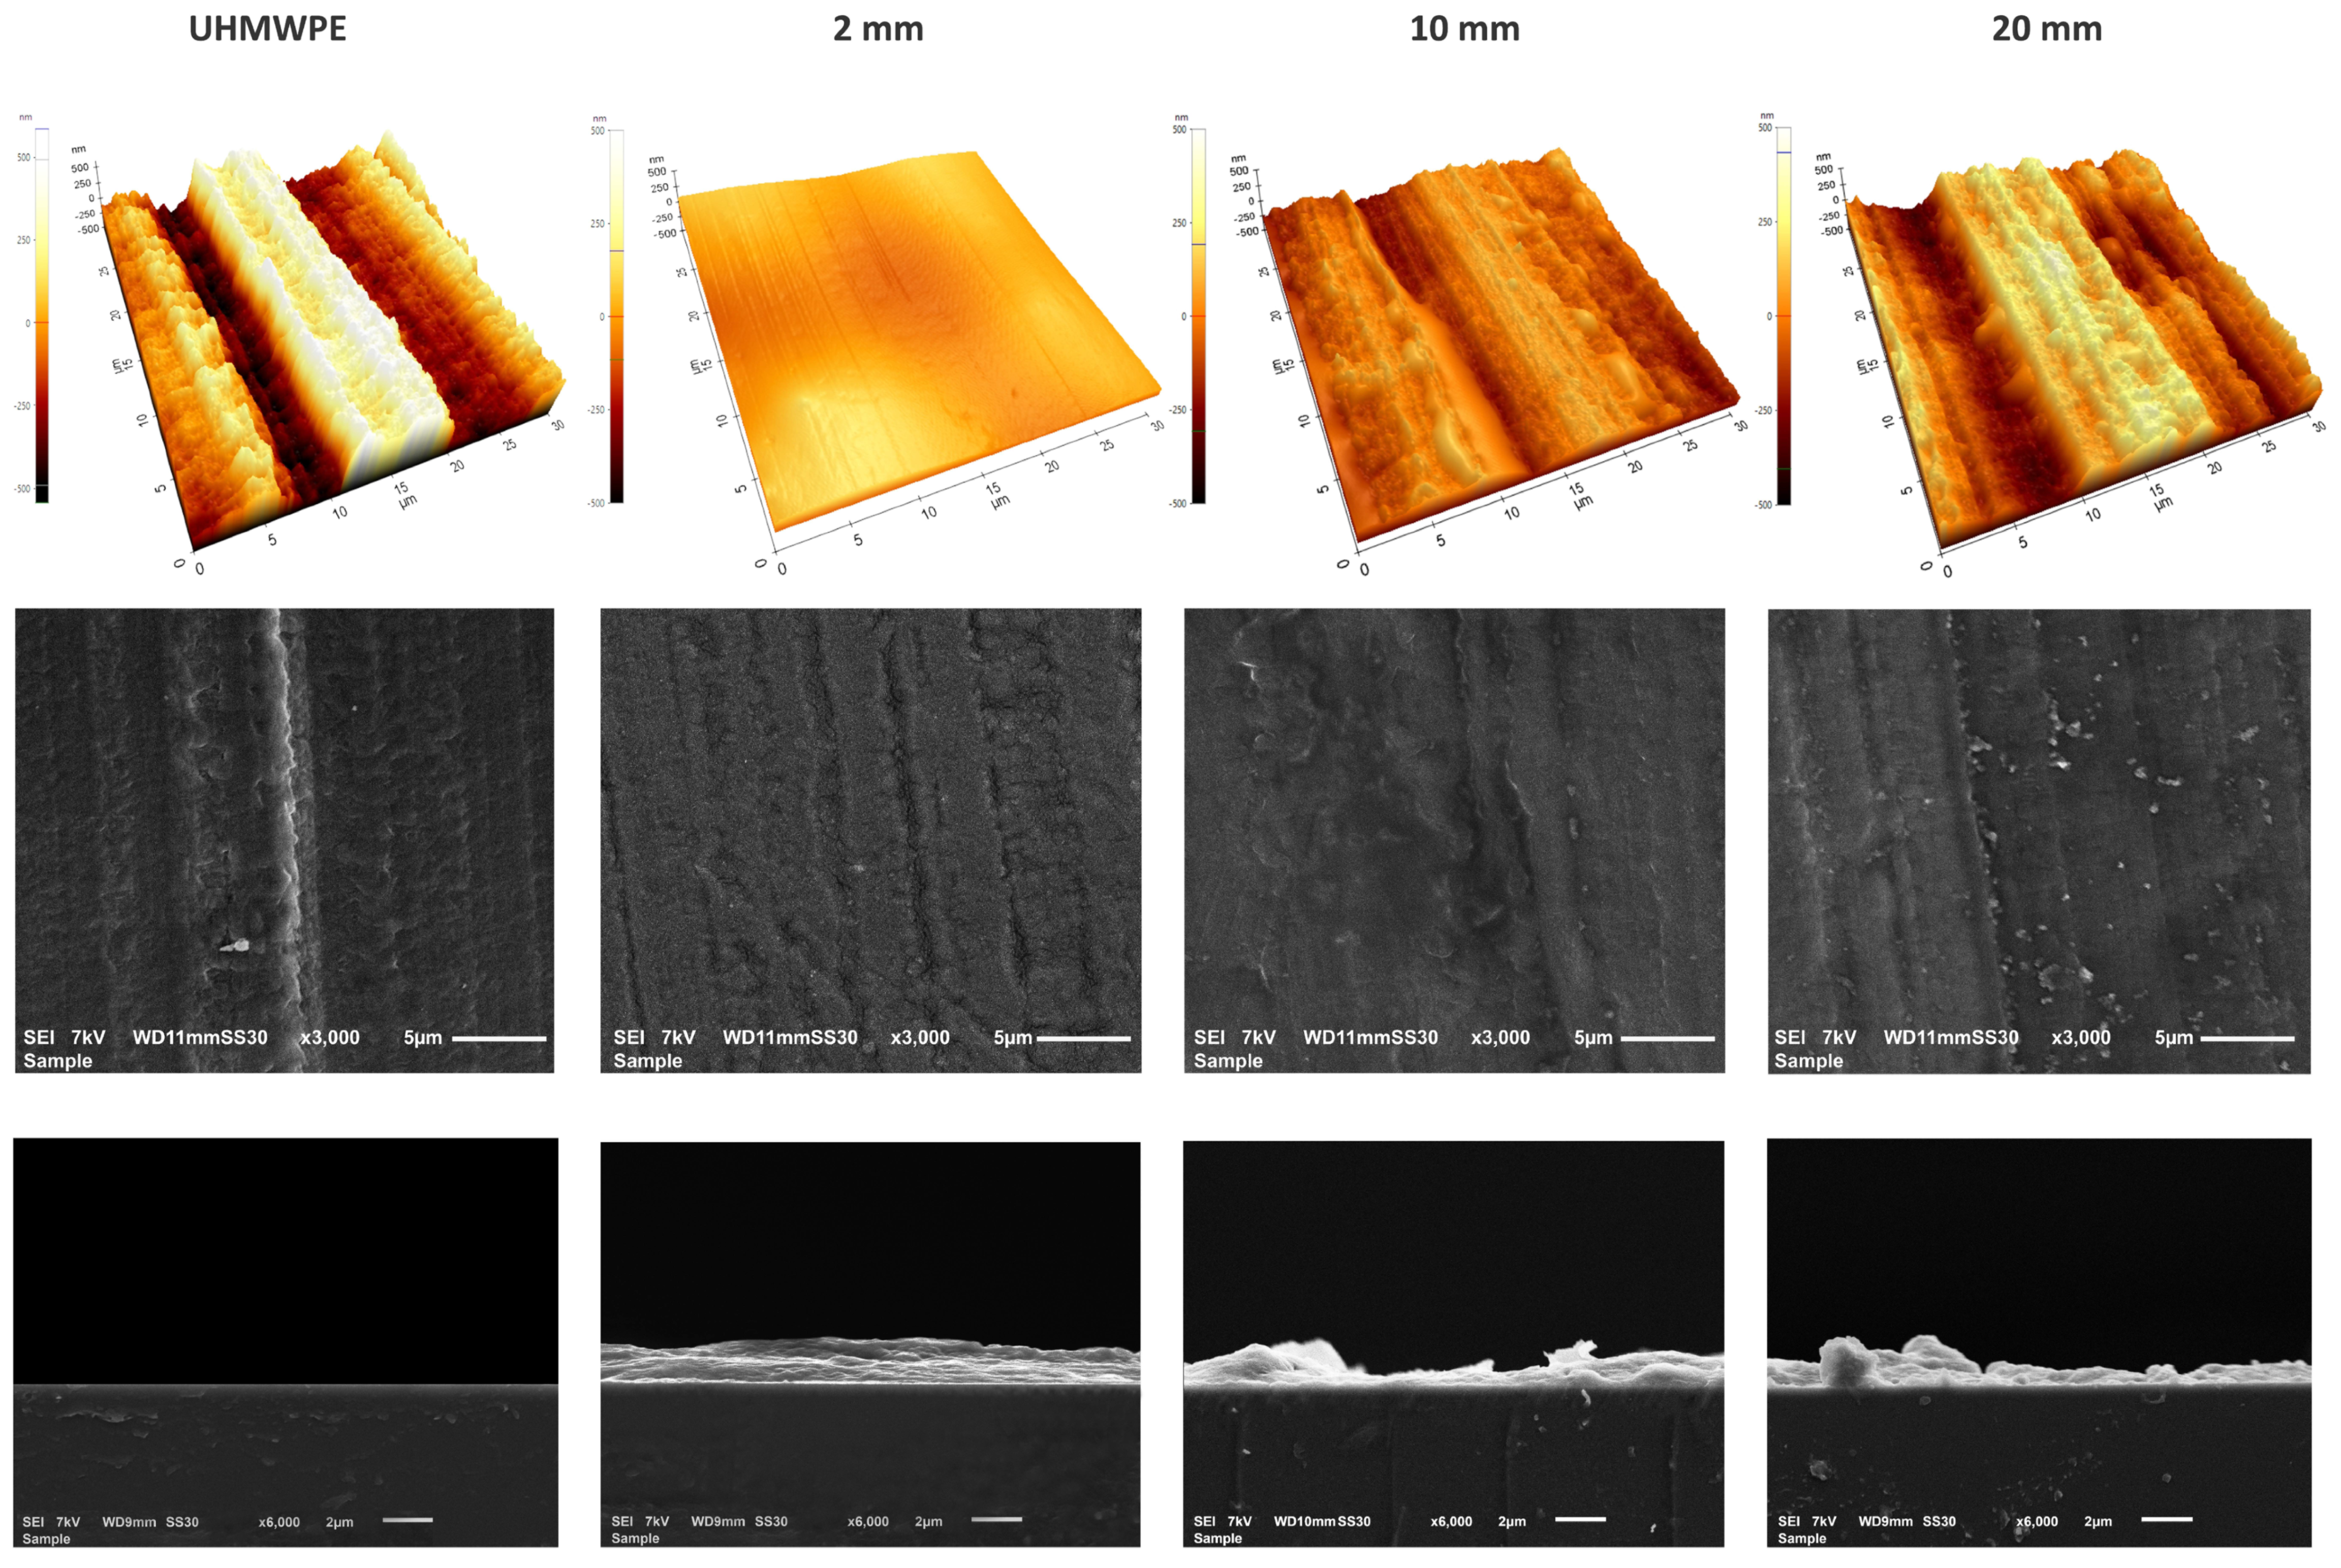
Figure 3 shows the AFM and SEM images (top view and cross-section) of the bare and plasma-coated UHMWPE at plasma–substrate distances of 2, 10, and 20 mm. Clearly, the uncoated UHMWPE substrate has a relatively rough surface. On the other hand, the plasma polymerization of the DVE-3 precursor at 2 mm clearly results in the deposition of a conformal coating. However, when the plasma–substrate distance is further increased, particularly to 20 mm, non-conformal and less-uniform coatings are deposited in a manner such that the coating morphology broadly resembles the substrate morphology.
The same trend could be observed in the top-view SEM images. These images indicate apparent differences in the morphology of the DVE-3 coatings obtained at different distances. By increasing the plasma–substrate distance, an “island-like” coating is deposited, and the UHMWPE is not homogeneously covered. These findings could be ascribed to the dilution of the chemically active plasma species by expanding the gap between the plasma source and substrate. Accordingly, the dilution of active plasma species can lead to a reduction in the plasma efficiency of the polymerization [
38,
39], which subsequently results in the formation of a non-conformal coating. Our observations agree well with those in previous research conducted by Korzec et al. [
39]. These researchers visualized the plasma–substrate contact areas of different atmospheric-pressure plasma jets at different plasma–substrate distances and found that the resulting contact area was reduced for all the examined plasma configurations by increasing the plasma–substrate distance.
Table 1 displays the calculated roughness values (
Rq) obtained from the AFM images of the uncoated and coated substrates. Clearly, the pristine UHMWPE has a relatively rough structure (
Rq = 231.7 ± 24.9 nm) with considerable variation over the sample surface, as evidenced by the elevated standard deviation. Conversely, the DVE-3-based coatings are significantly smoother, particularly the coatings deposited at 2 mm, for which the surface roughness is low (
Rq = 61.3 ± 3.2 nm). However, the data in
Table 1 clearly reveal that the coating surface roughness increases again with increasing plasma–substrate distance. The observed effect could be explained by the occurrence/absence of gas-phase nucleation [
40]. When the plasma–substrate distance is short, polymerization mainly occurs on the surface of the substrate, which contributes to the formation of a smooth conformal coating with a nanoscale roughness. This obtained nanoscale roughness can be very beneficial for the ultimate application as a matrix for embedding antibacterial agents. One of the crucial parameters affecting the antibacterial efficiency is the contact surface area provided for the packaged food. In this regard, an increased surface area (resulting from the nanoscale roughness) will enhance the antibacterial activity due to the more pronounced interaction of the bacteria with the surface [
41].
On the other hand, with increasing plasma–substrate distance, gas-phase nucleation becomes increasingly dominant, leading to the clustering of polymerized precursors in the gas phase rather than on the substrate [
40]. Consequently, at elevated plasma–substrate distances, non-conformal coatings with higher surface roughness values will be mainly deposited.
For a more precise analysis of the morphology and to obtain insight into the coating thickness, cross-sectional SEM images were also obtained. For this purpose, coatings were deposited on silicon wafers instead of UHMWPE. These cross-sectional images clearly indicate that an increase in the plasma–substrate distance results in the formation of non-uniform coatings. The DVE-3 coating deposited at 2 mm reveals a smooth morphology with a thickness of 2.21 ± 0.18 µm. On the other hand, by increasing the distance to 10 and 20 mm, the coatings become non-uniform with considerable variation in the thickness ranging from 0.3 µm to 2.6 µm, resulting in an average thickness of 1.21 ± 0.86 and 1.32 ± 0.88 µm, respectively. These findings further confirm the formation of non-conformal DVE-3-based coatings arising from the increased plasma–substrate distances.
In addition to the surface morphology and roughness, a detailed assessment of the surface elemental composition was conducted using XPS analysis to discern the effect of the plasma–substrate distance on the surface chemical composition of the samples. The elemental compositions of the UHMWPE substrate and coatings prepared at different distances are presented in
Table 2. As expected, the pristine UHMWPE mainly consists of carbon with some traces of oxygen originating from surface contamination during air exposure. The DVE-3-based coatings are mainly composed of carbon and oxygen, which are the two elements that construct the precursor. Intriguingly, a small amount of nitrogen was also detected in the coating deposited at 2 mm, which could originate from the nitrogen-feeding plasma gas. In a nitrogen-containing plasma, various nitrogen species can be present, including neutral atomic nitrogen (N), molecular nitrogen ions (N
2+), and excited nitrogen molecules (N
2(A
3∑
u+)). Among these species, neutral atomic nitrogen could be generated at an appreciable concentration [
42]. In addition, neutral atomic nitrogen is considered to have a high chemical reactivity and can directly be incorporated into a growing coating surface during plasma polymerization [
43]. However, N atoms have a finite lifetime of approximately 100 µs [
44,
45,
46]. Therefore, at gas-flow rate of 80 L/min, as used in the PlasmaSpot system, N atoms cannot travel over long distances (the characteristic decay distance is ~1 mm), which explains why nitrogen was only detected on the surface of the coating deposited at a plasma–substrate distance of 2 mm [
44]. By disregarding the small amount of incorporated nitrogen, the surface oxygen (≈36%) and carbon (≈62%) contents approximate those of the chemical composition of PEG when the shortest plasma–substrate distance is used. The surface oxygen content, however, sharply decreases with increasing plasma–substrate distance, while, in turn, the surface carbon content increases. These results indicate that the chemical structure of the plasma-polymerized DVE-3-based coatings strongly depends on the plasma–substrate distance. It should be noted that even at the increased plasma–substrate distance of 20 mm, a thick coating (approximately 1.00 µm) is still deposited on the substrate, and the detected carbon and oxygen contents still arise from the coating itself and not from the UHMWPE substrate, as confirmed by the previously provided thickness measurements.
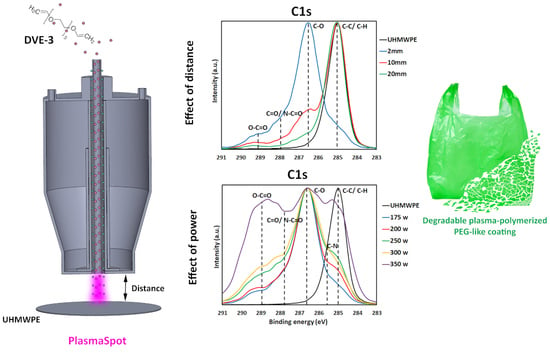
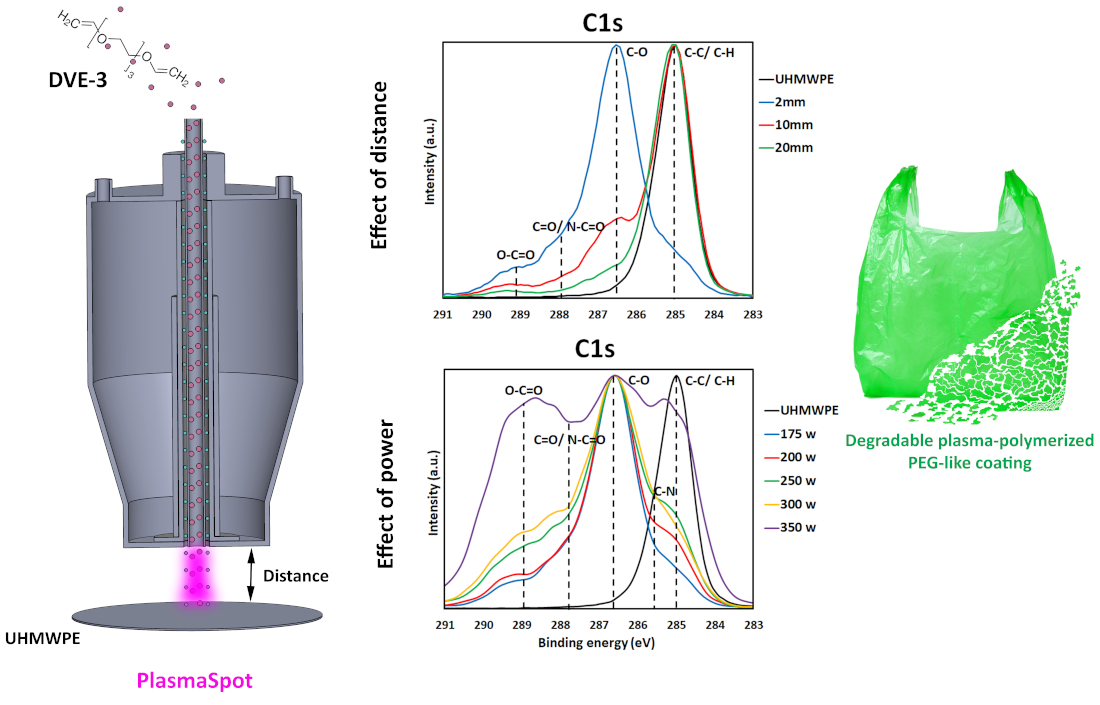
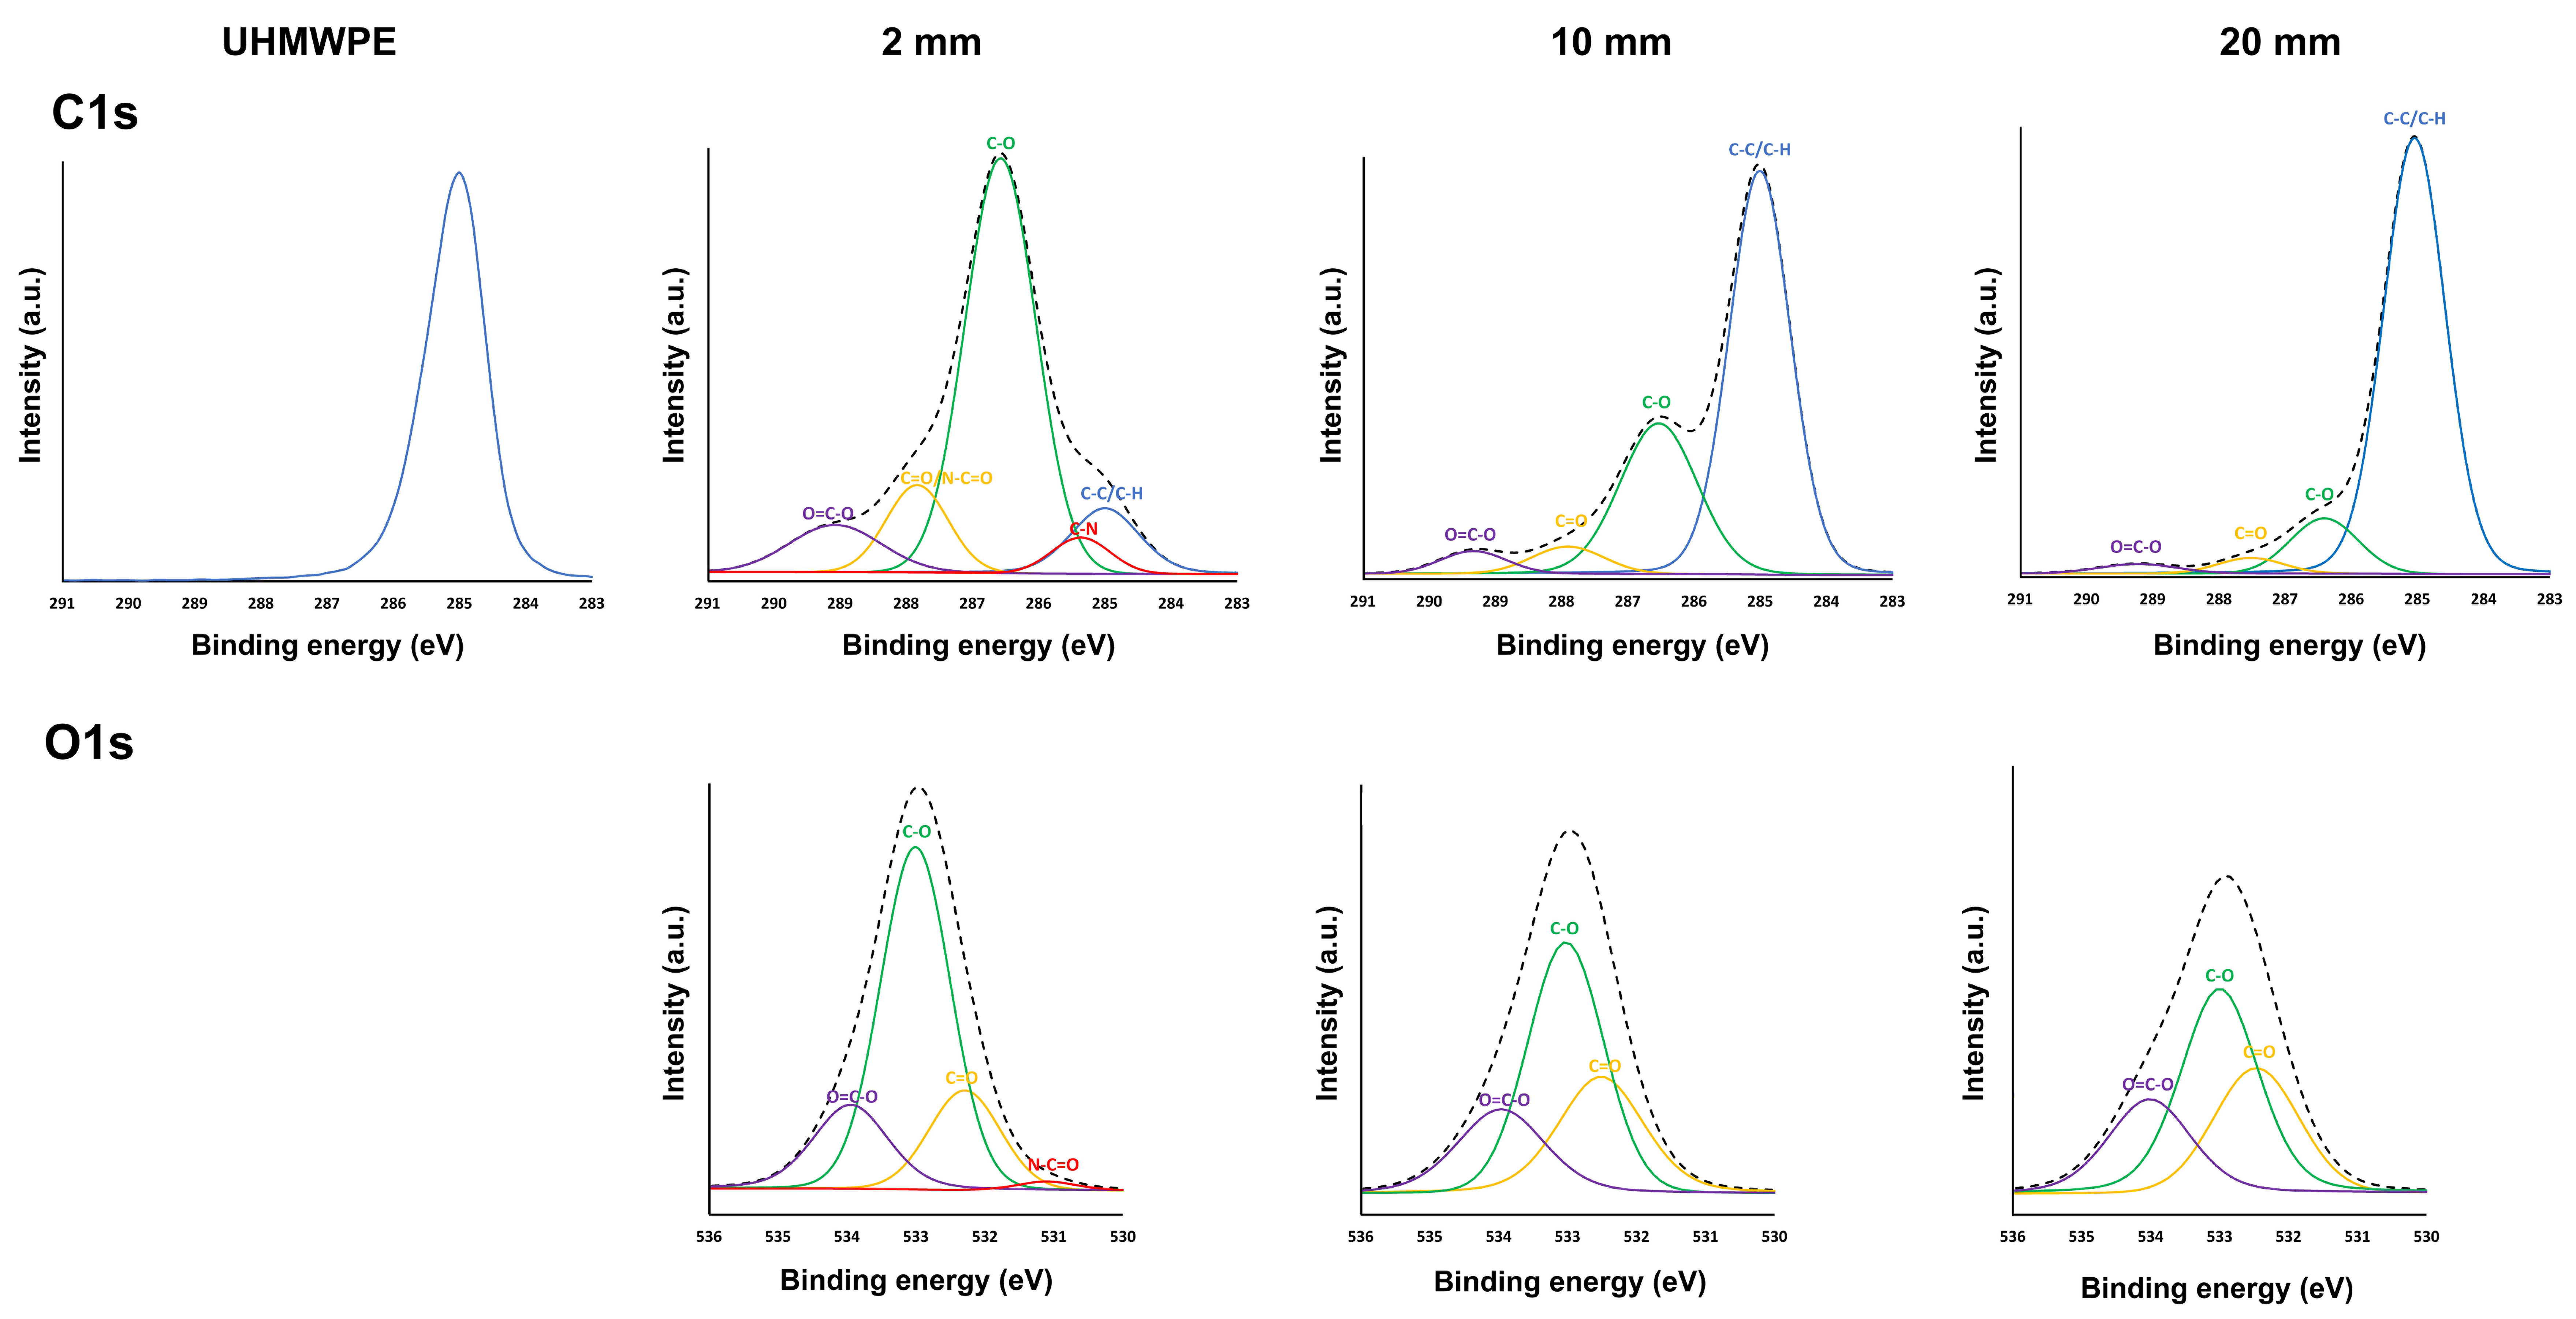
To obtain a clearer perception of the specific nature of the carbon- and oxygen-containing functional groups on the coating surfaces, high-resolution C1s and O1s core-level spectra were comprehensively assessed and deconvoluted.
Figure 4 depicts the high-resolution C1s peaks for the UHMWPE substrate and the high-resolution C1s and O1s peaks for the coatings deposited at different plasma–substrate distances. Because of its low intensity, the O1s peak of the UHMWPE substrate is not shown in
Figure 4.
Figure 4 reveals that the C1s spectrum of the UHMWPE substrate is dominated by a large peak at 285.0 eV, corresponding to C-C/C-H bonds, as expected considering the chemical structure of UHMWPE. According to previous studies, the C1s spectrum of the DVE-3-based coating deposited at 2 mm deconvolutes into five different peaks: a peak attributed to C-H/C-C bonds at 285.0 eV, a peak assigned to C-N bonds at 285.7 eV, a peak accredited to C-O bonds at 286.6 eV, a peak corresponding to C=O/N-C=O at 287.8 eV, and, finally, a peak ascribed to O-C=O groups at 289.1 eV. The O1s spectrum of this coating encompasses four peaks: a peak at 531.3 eV corresponding to N-C=O, a peak at 532.3 eV attributed to C=O groups, a peak at 532.8 eV assigned to C-O groups, and, finally, a peak at 533.7 eV accredited to O-C=O groups. On the other hand, for the DVE-3-based coatings deposited at longer plasma–substrate distances, the peaks corresponding to the nitrogen functional groups were not assigned owing to the absence of nitrogen in the surface elemental compositions. For these coatings, the high-resolution C1s spectrum predominantly has four peaks: C-H/C-C, C-O, C=O, and O-C=O, at these same binding energies. In addition, the O1s spectrum of the DVE-3-based coatings only encompasses three peaks, including C=O, C-O, and O-C=O [
47,
48]. When a DVE-3-based coating is deposited on the UHMWPE substrate at a plasma–substrate distance of 2 mm, the dominant peak in the C1s spectrum is no longer located at 285.0 eV (as is the case for UHMWPE) but at 286.6 eV because of the formation of new chemical groups (C-O bonds) originating from the monomer. In addition, a peak at 285.7 eV corresponding to C-N groups, a peak at 287.8 eV attributed to C=O/N-C=O bonds, and a peak at 289.1 eV accredited to O-C=O groups are detected. The obtained C1s spectrum, thus, agrees well with the XPS spectra of the plasma-deposited PEG-like coatings reported in other research papers [
21,
49], which indicates that the PEG polymer structure is retained when the plasma-polymerization process is conducted at a short plasma–substrate distance. However, when the plasma–substrate distance is increased, the relative contributions of the different C1s peaks noticeably changes such that the dominant peak in the C1s spectrum is at 285.0 eV, corresponding to C-C/C-H bonds.
When taking a closer look at the C1s curve-fitting results of the DVE-3-based coatings (
Table 3), one can notice that the chemical structure of the coating deposited at 2 mm closely resembles that of the DVE-3 monomer, as evidenced by the high number of C-O functional groups in its structure. However, minor monomer fragmentation also occurs, as low amounts of other nitrogen- and oxygen-containing functional groups (C-N, C=O/N-C=O, and O-C=O) are on the surface of this sample. When the plasma–substrate distance is increased, the content of C-O functional groups drastically decreases from approximately 64 at.% to 11 at.%, suggesting that considerable monomer fragmentation occurs at increased distances. Simultaneously, the contents of the other oxygen-containing groups (C=O and O-C=O) also sharply decrease, which agrees with the previously shown elemental composition data. These results reveal that more enhanced monomer fragmentation occurs with increasing plasma–substrate distance, ultimately resulting in the deposition of a hydrocarbon-like coating containing only a minor content of oxidized groups at the longest plasma–substrate distance. By increasing the distance from the plasma source, there is, thus, sufficient time for precursor molecules to fragment, leading to a significant loss in the content of monomer C-O functional groups in the deposited coatings [
38,
50,
51]. Short plasma–substrate distances are, thus, crucial to deposit a plasma-polymerized PEG-like coatings.
3.2. Effect of Input Power on the Physicochemical Properties of DVE-3-Based Coatings
In addition to the plasma–substrate distance, the input power is known to significantly affect coating properties when conducting plasma-polymerization experiments [
15], and this impact will be studied in this section. Based on the influence of the plasma–substrate distance on the chemical and physical characteristics of the DVE-3-based coatings, a plasma–substrate distance of 2 mm was selected. This distance was chosen as it was, in this case, possible to deposit a conformal smooth coating while maintaining the C-O functional groups of the DVE-3 precursor. To comprehensively explore the influence of the input power on the coating properties, tests were performed at various input powers (175, 200, 250, 300, and 350 W) at a fixed plasma–substrate distance of 2 mm.
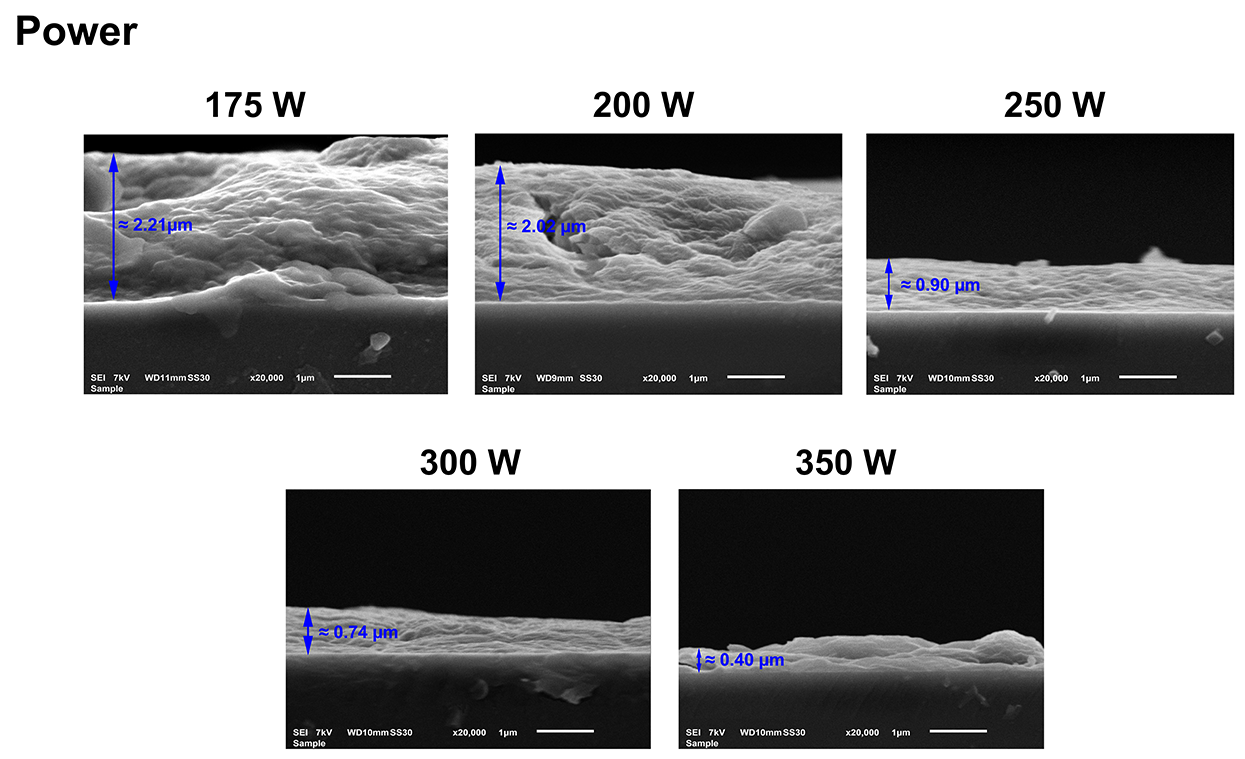
The cross-sectional SEM images of the UHMWPE substrate and the coatings deposited at various input powers are depicted in
Figure 5. From these SEM images, considerable variations in the coating thickness were detected for different input powers. Based on the cross-sectional SEM images, it can be concluded that the coating thickness decreases with increasing input power. At low input powers (175 and 200 W), thick coatings are deposited at average thicknesses of 2.21 ± 0.18 and 2.02 ± 0.29 µm, respectively. However, further increases in the input power to 250 and 300 W result in more than a two-fold decrease in the coating thicknesses to 0.90 ± 0.06 and 0.74 ± 0.06 µm, respectively. Moreover, at the highest input power, 350 W, the coating thickness further reduced to 0.40 ± 0.13 µm. The observed thickness variation with increasing input power can be explained by the fact that the input power modifies the electron density and distribution of the electron energy, which, in turn, influences the chemical reactions occurring in the plasma environment, thereby changing the physicochemical properties of the deposited coatings [
52,
53]. It is well known that the input power per precursor molecule has a crucial impact on the extent of the precursor fragmentation as well as on the cross-linking degree of the deposited coating [
34,
54]. In conformity with the Yasuda model, when using a constant precursor flow rate, which is the case in this work, only a few monomer dissociation reactions occur at low input powers. Under these conditions, coatings are deposited at a high rate, and the obtained coatings primarily preserve the chemical structure of the precursor, resulting in a high retention of the precursor’s functional groups [
55,
56,
57]. However, by increasing the input power per molecule, the plasma-polymerization mode can be switched to a monomer-deficient regime from a certain input power on. In this region, strong precursor fragmentation occurs, and competitive ablation and polymerization occur during the plasma-polymerization process [
58,
59]. As a result, coatings are deposited at a lower rate, resulting in thinner coatings that possess a higher cross-linking degree and a lower amount of the precursor’s functional groups. As revealed by the obtained thickness results, the DVE-based coatings were most likely obtained in the monomer-deficient regime at input powers ≥175 W when using a constant precursor gas-flow rate of 0.6 slm.
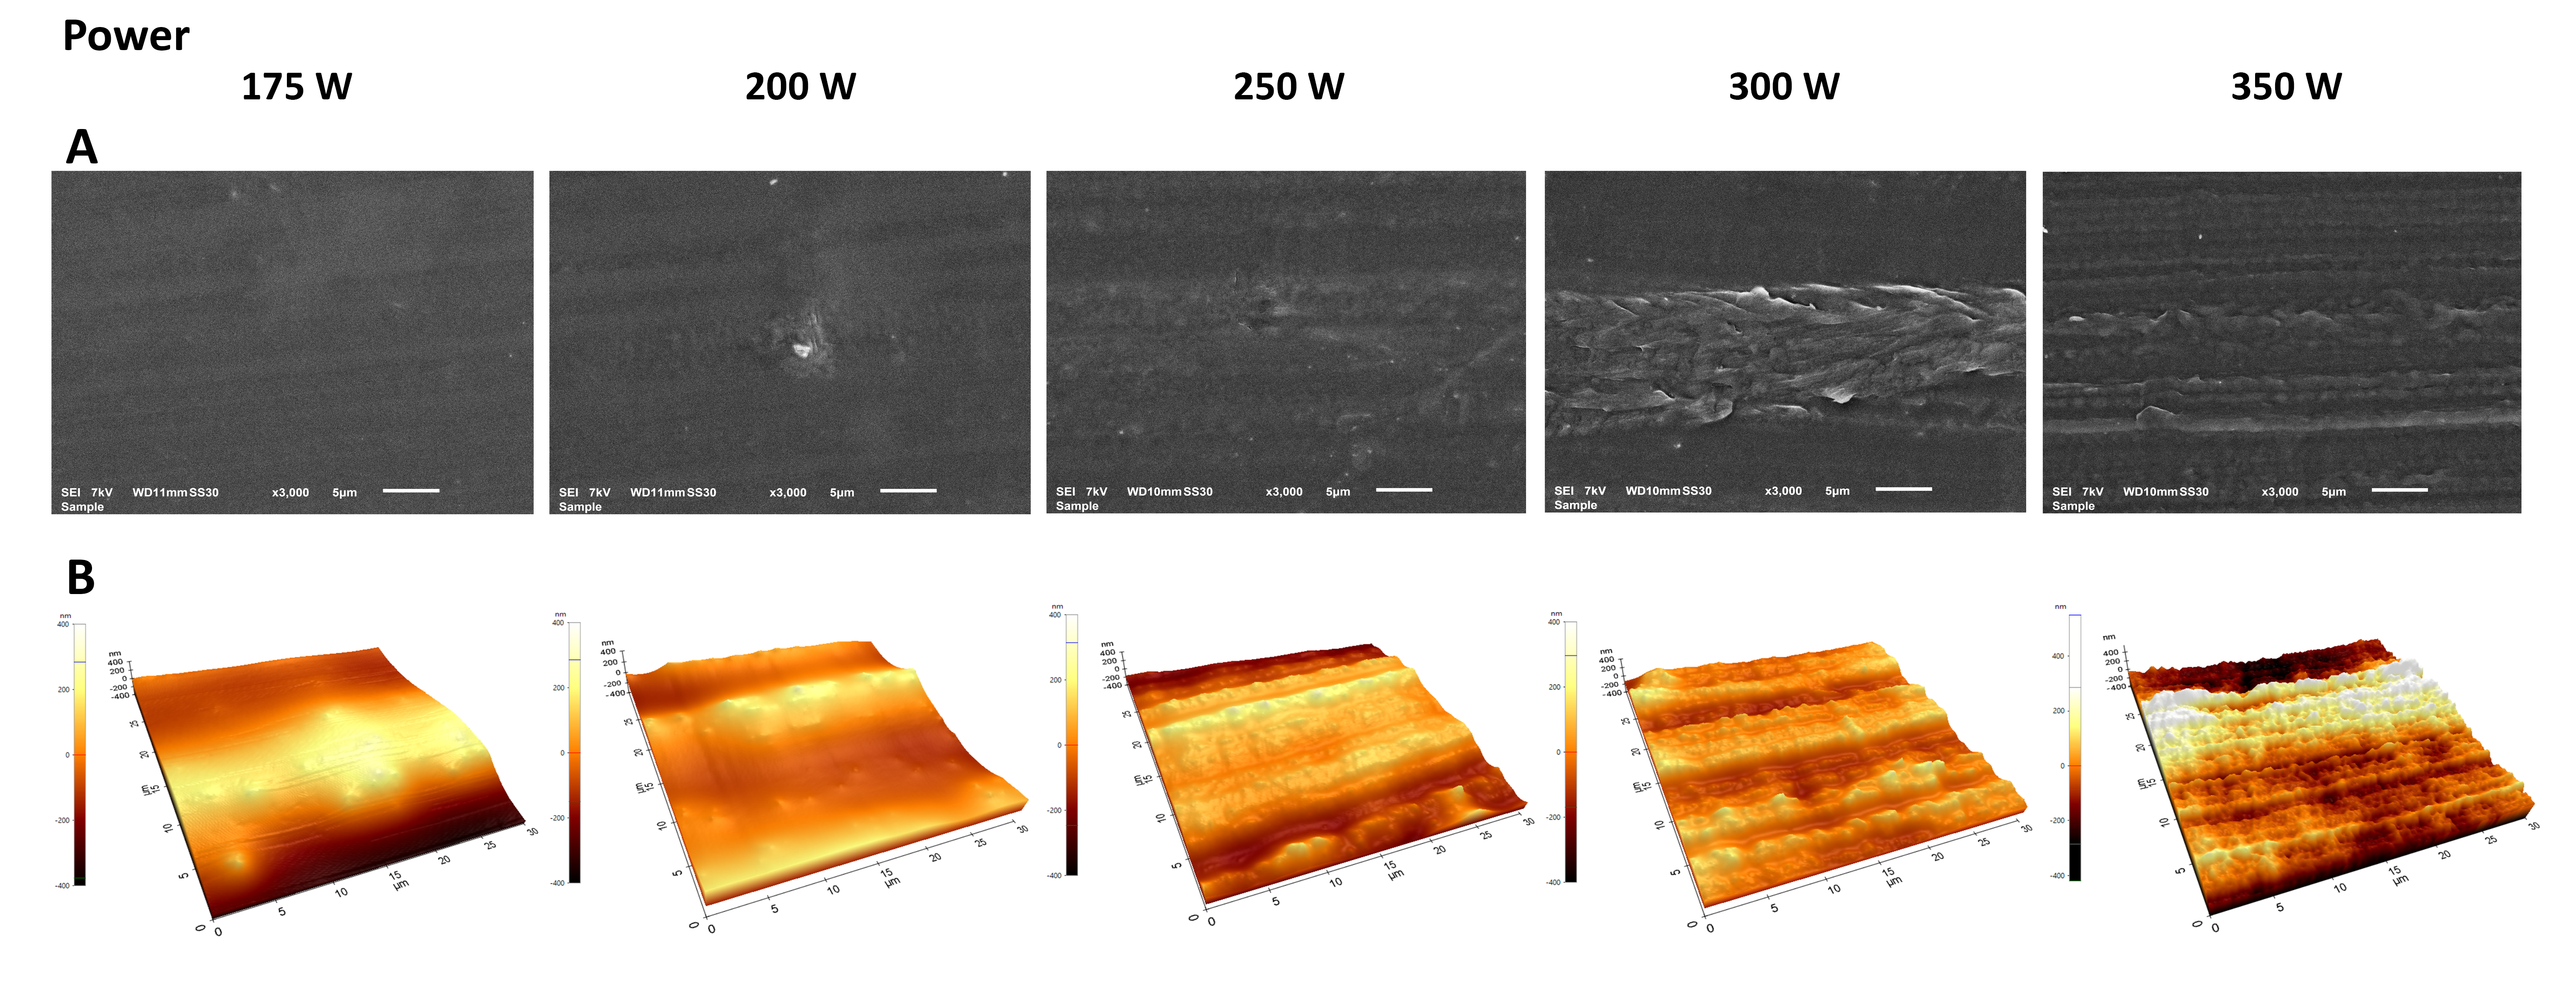
The top-view SEM images and AFM images of plasma-polymerized coatings deposited at different input powers are shown in
Figure 6. The top-view SEM images show that the plasma polymerization of DVE-3 at low input powers (175 and 200 W) provides a smooth and pinhole-free coating that homogeneously covers the entire substrate surface. However, considerable topographical changes can be observed with increasing input power: rough DVE-3-based coatings are deposited owing to the reduction in the coating thickness and the rough underlying substrate. These findings indicate that the application of high input powers results in thinner coatings that do not significantly change the morphology of the pristine UHMWPE. Therefore, under these conditions, the primary factor that determines the surface morphology of the obtained coatings is the substrate itself, which has a rough structure. This finding agrees with the AFM images, which also reveal that the surface roughness of the deposited coatings increases with increasing input power.
As presented in
Table 4, the surface roughness increases owing to the thickness reduction when the input power increases. However, the roughness of the coating obtained at the maximum input power of 350 W (
Rq = 143.9 ± 2.5 nm) is still considerably lower than the roughness of the uncoated UHMWPE (
Rq = 231.7 ± 24.9 nm), which confirms that a DVE-3-based coating is deposited on the surface, even at the highest used input power.
As in the previous section, XPS analysis was conducted to determine the influence of the input power on the chemical structure of the DVE-3-based coatings. The surface elemental compositions of the DVE-3 coatings deposited at different input powers are shown in
Table 5. The coating prepared using an input power of 175 W primarily comprises carbon, oxygen, and a small amount of nitrogen. Carbon and oxygen are the two elements that are present in the precursor structure; however, this is not the case for nitrogen. As previously mentioned, the detected nitrogen most likely originates from the nitrogen-feeding plasma gas. The PlasmaSpot device operates in N
2 gas, and neutral atomic nitrogen can be generated at high concentrations [
43] and be directly incorporated into the deposited coating. The data listed in
Table 5 also reveal that with increasing input power, the surface oxygen content decreases from approximately 36.3 at.% to 29.3 at.%, while the nitrogen content drastically increases from 1.9 at.% to almost 20.0 at.%. Simultaneously, the carbon content also decreases by more than 10 at.% when the input power is increased from 175 to 350 W.
The detected increase in the surface nitrogen content with increasing input power could be explained by reactions between nitrogen molecules and electrons, both of which are present in the nitrogen plasma [
42]:
The second reaction generates excited nitrogen molecules, which can, in turn, react with molecular nitrogen, thereby leading to the formation of additional atomic nitrogen [
42]:
(* denotes N
2 (X
1∑
g+, V), N
2 (A
3∑
u+), N
2 (B
1 3∑
g−), and N
2 (C
3Π
u)).
The dissociation reactions of nitrogen molecules to atomic nitrogen are intensified with increasing input power, which is expected to lead to an increased atomic nitrogen density in the gas phase. Subsequently, at higher input powers, more atomic nitrogen can be incorporated into the growing coating and form nitrogen-containing functional groups on the surface, as confirmed by the obtained XPS results. In addition to the changes in the nitrogen content, significant differences in the carbon and oxygen contents of the coatings are observed at different input powers. It is well known that with increasing input power, a higher concentration of reactive plasma species and more highly energetic species are present in the plasma, thereby resulting in more enhanced monomer fragmentation. As such, it is reasonable to assume that increasing the input power will intensify the DVE-3 fragmentation in the plasma, thereby leading to significant changes in the elemental composition of the coatings.
The high-resolution C1s and O1s spectra were also deconvoluted to quantify the relative concentrations of the different surface functional groups in the coatings. The curve-fitted peaks obtained for different input powers are depicted in
Figure 7, and similar peaks as those used for deconvoluting the C1s and O1s spectra of the DVE-3-based coatings deposited at a plasma–substrate distance of 2 mm (input power of 175 W) are used for deconvoluting these spectra. The relative concentrations of the carbon- and oxygen-containing functional groups, as obtained from the deconvoluted C1s and O1s spectra, are summarized in
Table 6.
Clearly, by increasing the input power, the relative concentrations of the carbon-containing functional groups substantially change. First, the relative C-O concentration gradually decreases with increasing input power, with only a few C-O groups remaining in the coating deposited at the highest input power (23.2%). This significant loss of C-O functional groups that are present in the DVE-3 chemical structure confirms that more pronounced monomer fragmentation occurs with increasing input power. On the other hand, the relative concentrations of other oxygen-containing functional groups, such as C=O and O-C=O groups, increase with increasing input power. Most likely, the C-O functional groups in the DVE-3 monomer are mainly destroyed at higher input powers, resulting in small monomer fragments, which can, in turn, recombine to deposit a coating containing higher relative contents of C=O and O-C=O groups [
55,
56,
57]. These results agree with those previously published in the literature, as other studies have also reported the incorporation of oxygen-containing groups, such as carboxyl (O-C=O) and carbonyl (C=O) groups, on the surfaces of growing coatings during atmospheric-pressure plasma polymerization [
60]. However, it is still important to highlight that despite the detected increase in the relative concentrations of the C=O and O-C=O groups, the surface oxygen content considerably decreases with increasing input power, meaning that the loss of C-O functional groups is much more pronounced compared to the increase in the contents of carbonyl and carboxyl functional groups. When looking at the relative concentrations of the oxygen-containing functional groups, similar conclusions can be drawn as those for the curve-fitted results of the C1s peaks: with increasing input power, the relative content of the C-O groups sharply decreases, while the relative contents of the C=O and O=C-O groups increase.
The data listed in
Table 6 also reveal that there is a large increase in the relative concentration of the C-N functional groups with increasing input power, which agrees with the observed increase in the nitrogen content, as presented in
Table 5. As previously mentioned, more atomic nitrogen is incorporated into the coating with increasing input power, and this incorporation is mostly in the form of C-N bonds. However, amide groups are also present in the coatings, as revealed by the O1s curve-fitting results, and their concentrations also increase with increasing input power. Therefore, by increasing the input power, more monomer fragmentation occurs, resulting in a significant loss of C-O functional groups. As a result, at high input powers, completely different coatings containing a mixture of C-O, C=O, O-C=O, N-C=O, and C-N functional groups are deposited, and the chemical structures of the coatings bear no resemblance to that of PEG.
In addition to examining the influence of the input power on the surface morphology and surface chemical composition of the coatings, its influence on the surface wettability is examined in the following section. The WCA results obtained for various input powers are shown in
Figure 8.
As expected, the uncoated UHMWPE substrate is hydrophobic, with a WCA value of 116 ± 1.7°, while the wettability of the DVE-3 plasma-polymerized coatings varies from hydrophilic (WCA value of 47 ± 0.8°) to highly hydrophilic (WCA value of 7.9 ± 1.2°) depending on the applied plasma input power: the higher the used input power, the higher the surface wettability and the lower the obtained WCA value. The observed decrease in WCA values with increasing input power can be attributed to large changes both in the surface chemical composition and surface roughness, as already evidenced in the previous sections focusing on the XPS analysis and SEM/AFM measurements. The XPS results clearly revealed the enhanced incorporation of nitrogen-containing functional groups (C-N and O-C=N) at higher input powers combined with enhanced contents of C=O and O-C=O functional groups at the expense of C-O groups. It is already well known that the presence of these nitrogen- and oxygen-containing functional groups on a coating’s surface can strongly enhance the coating’s hydrophilicity [
61,
62], which is also the case in this study. Another possible explanation for the observed WCA dependence on the input power could be related to the observed changes in the surface morphology. In the case of hydrophilic surfaces, it is well known that the apparent contact angle decreases when the solid’s surface roughness increases [
63,
64]. The obtained nanoscale roughness enhances the solid–liquid interfacial area, leading to improved wettability properties and a lower WCA value. The AFM results in
Table 4 clearly show that the surface roughness increases with increasing input power, and this change can, in turn, contribute to the lower WCA values observed at higher input powers. Therefore, it is possible to deposit coatings possessing completely different chemical and physical properties, starting from DVE-3, by simply varying the input power used during the plasma polymerization.
3.3. Water Stability
As it is very important for practical applications that developed coatings possess sufficient stability in water, this aspect was also closely examined in this work. In an initial stability study, the DVE-3-based coatings prepared using different input powers (at a fixed distance of 2 mm) were found to show very different stability behaviors after being immersed in water. In the case of the coatings deposited at low input powers (175 and 200 W), the coatings almost completely vanished within one hour of contact with water. On the other hand, when raising the input power, the stability of the coatings was improved. These observations can be explained by the enhanced monomer fragmentation and the accompanying higher cross-linking degree of the coatings when applying higher input powers. At lower input powers, the monomer fragmentation is not very pronounced, as was also evidenced by the chemical resemblance between the obtained coatings and the DVE-3 monomer molecules (see XPS section). In turn, the coatings deposited at low input powers are not highly cross-linked, resulting in poor coating stability in water. Based on the preliminary stability findings, an input power of 300 W was selected to investigate in more detail the performance of this DVE-3-based coating in contact with water.
The FT-IR spectra of the DVE-3-based coating deposited at 300 W before and after contact with water for different time intervals are shown in
Figure 9 for the wavenumber range 1900–950 cm
−1. As shown, all the spectra are dominated by the same three major peaks (excluding the peak attributed to the substrate at 1470 cm
−1). The spectra for all the samples contain a very broad band in the region 1000–1200 cm
−1, which can be attributed to C-O stretching vibrations. The absorption band at 1633 cm
−1 can be assigned to the amide I band, resulting from the stretching vibration of carbonyl groups (-C=O) in amide I structures [
65]; while the peak at 1724 cm
−1 can be attributed to carbonyl groups (C=O) in the structure of the PEG-like coatings. These results agree with the XPS analysis as similar chemical groups have also been identified using this technique [
66,
67]. As shown in
Figure 9, the intensity of these three peaks decreases with increasing immersion time, while the intensity of the substrate peak increases. This observation can be explained by the gradual dissolution of the deposited coating during water immersion, which leads to a reduction in coating thickness with increasing immersion time. However, it is important to point out that even after the coating was in contact with water for 72 h, the peaks attributed to the DVE-3 coating are still visible in the measured FTIR spectra, confirming that a thin layer of the coating remains on the UHMWPE substrate after 3 days of water immersion.
As the surface morphology and roughness can also provide some information about the coating stability, AFM measurements were conducted on the coatings deposited at 300 W for varying water immersion times, and the resulting AFM images are presented in
Figure 8. As visualized in
Figure 8, the surface becomes smoother after 24 h of contact with water, which is also evidenced by the assessed surface roughness, which decreases from 112.6 ± 2.4 nm to 79.7 ± 3.6 nm. This suggests that upon the initial water immersion, the coating surface becomes smoother with fewer cavities due to the removal of the top-layer of the coating. It is well known that this top layer is mechanically weak and can be easily abraded [
67]. When the immersion time is further increased to 48 and 72 h, the coating surface becomes rougher again and gradually increasingly resembles the morphology of the uncoated UHMWPE substrate. Indeed, the
Rq value raises to 113.7 ± 4.0 nm after 48 h of water exposure and, finally, even reaches 152.1 ± 6.8 nm after 72 h of exposure to water. However, it is worth mentioning that the roughness of the coating after 72 h of contact with water is still considerably less than the roughness of the UHMWPE substrate, suggesting that a part of the DVE-3-based coating remains on the substrate even after 72 h of water immersion. It can, thus, be concluded that the AFM measurements agree with the FTIR results, which also indicated the partial dissolution of the deposited DVE-3-based coating upon water immersion. These findings reveal that the DVE-3-based coatings developed in this study may act as a promising matrix for embedding antibacterial agents since it can allow the controlled release of the agents over time, owning to its gradual solubility in water.


 ,
, 


