Abstract
The catalytic conversion of CH4 and CO2 into H2-rich syngas is known as the dry reforming of methane (DRM). The dissociation of CH4 over active sites, coupled with the oxidation or polymerization of CH4−x (x = 1–4), plays a crucial role in determining in determining the DRM product yield and coke deposition. Herein, a series of bimetallic-supported catalysts are prepared by the dispersion of Ni-M (M = Ce, Co, Fe, and Sr) over 60 wt% MgO-40 wt% Al2O3 (60Mg40Al) support. Catalysts are tested for DRM and characterized with XRD, surface area and porosity, temperature-programmed reduction/desorption, UV−VIS−Raman spectroscopy, and thermogravimetry. 2.5Ni2.5Sr/60Mg40Al and 2.5Ni2.5Fe/60Mg40Al, and 2.5Ni2.5Ce/60Mg40Al and 2.5Ni2.5Co/60Mg40Al have similar CO2 interaction profiles. The 2.5Ni2.5Sr/60Mg40Al catalyst nurtures inert-type coke, whereas 2.5Ni2.5Fe/60Mg40Al accelerates the deposition of huge coke, which results in catalytic inferiority. The higher activity over 2.5Ni2.5Ce/60Mg40Al is due to the instant lattice oxygen-endowing capacity for oxidizing coke. Retaining a high DRM activity (54% H2-yield) up to 24 h even against a huge coke deposition (weight loss 46%) over 2.5Ni2.5Co/60Mg40Al is due to the timely diffusion of coke far from the active sites or the mounting of active sites over the carbon nanotube.
1. Introduction
The concentration of greenhouse gases has reached a critical level, and the effects are being seen everywhere. Apart from the rise in sea level, drastic seasonal changes, droughts, and wildfires are also becoming intensified across the globe. At this point, the catalytic conversion of the two leading greenhouse gases, CH4 and CO2, into H2-rich syngas is important. The proper catalyst for DRM may be a game changer for depleting greenhouse gases from the environment, and one of the main products, H2, is considered to be clean energy. This reaction is known as the dry reforming of methane (DRM), and it is highly endothermic (CH4 + CO2 → 2H2 + 2CO; ΔH° = 247.34 kJ/mol). Pt, Pd, Ir, Ru, and Ni dispersed over different supports such as MgO, CeO2, La2O3, Y2O3, TiO2, Si2O3, Al2O3, and ZrO2 are largely investigated for this reaction [1].
The selection of Ni as the active site and MgO, Al2O3, and TiO2 as the support is cost effective. Among the supports, TiO2 is known for its stronger metal−support interaction. Still, the catalytic performance of the Ni/TiO2 catalyst was found to be inferior to the Ni/MgO and Ni/Al2O3 catalysts due to the destabilization of titania phases, as well as the coverage of active sites of Ni by TiOx species [2,3,4,5,6,7]. Ni/MgO forms a NiO-MgO solid solution, which becomes hard at higher temperatures and results in a lower reducibility of NiO. It turns the inferior catalysts into the Ni/Al2O3 catalyst [4,5,6,7]. The Ni/Al2O3 catalyst was found to be superior compared with all of the above catalysts. However, an enriched surface acid profile vis-à-vis massive coke deposition limits its optimum catalytic performance on an industrial scale [8]. On the other hand, the addition of MgO with Al2O3 has been found to inhibit the diffusion of Ni active sites into Al2O3 (by forming NiAl2O4), and stabilizes Ni particles over MgAl2O4. MgO also depletes the acidity of Al2O3 and resists carbon deposition [9].
How can the catalytic limitation over the Ni/Al2O3 catalyst or Ni/MgO be overcome? Can we decrease the acidity of the support in the Ni/Al2O3 catalyst by incorporating some amount of MgO? Can we retain the reducibility of NiO (above 700 °C) over MgO by adding Al2O3? Keeping the major framework of basic MgO and rest by Al2O3, both DRM’s favorable properties of inherent basicity and Ni stability can be retained above 700 °C DRM temperature. Such an approach was previously tested for DRM by Quan et al. by keeping a Mg/Al ratio of 1:3 [8]. So, the dispersion of Ni over the MgO-Al2O3 support may be a promising approach for DRM. Further, the catalytic performance can be elevated by using suitable promotors over the Ni/MgO-Al2O3 catalyst.
Because of its inherent basic property vis-à-vis CO2 interactions, alkaline earth metals are frequently used as promoters over alumina-supported Ni catalysts. The Sr-promoted alumina-supported Ni catalyst showed enhanced basicity and a more significant metal support interaction by forming NiAl2O4 [10]. Alipour et al. found that Mg, Ba, and Ca-modified Ni/Al2O3 had a higher reducibility, coke resistance, and activity in the order of Mg > Ba > Ca (than Ni/Al2O3 catalyst) [11]. Karam et al. claimed the enhanced formation of small metallic Ni by spinel nickel-aluminate nano species by adding Mg over an alumina-supported Ni catalyst [12]. Diyanath et al. showed an enhanced metal−support interaction of Ni over magnesia-alumina support [13]. Akki et al. revealed that ceria-promoted MgAl2O4-supported Ni catalyst attained a highly reducible surface with enhanced basicity and effective active oxygen transfer [14]. Iron incorporation over an alumina-supported Ni catalyst was found to inhibit the deposition of inactive carbon and the oxidation of metallic Ni [15]. Previously, the promotional addition of Co over a magnesia-alumina -supported Ni catalyst resulted in enhanced coke elimination due to the high oxygen affinity of cobalt [16].
A further literature survey reveals the promotional role of Ce, Co, Fe, and Sr towards DRM. Herein, 2.5 wt% Ni-2.5 wt% M (M = Ce, Co, Fe, Sr) is supported over 60 wt% MgO-40 wt%Al2O3. The catalyst system is investigated for DRM and is characterized thoroughly via X-ray diffraction, surface area and porosity measurement, H2-temperature programmed reduction, CO2-temperature programmed desorption, UV−VIS spectroscopy, Raman spectroscopy, and thermogravimetry. Here, the good correlation of characterization results with the catalytic activity is aimed at bringing about more insight into two major competitive routes, DRM reaction and coke deposition, through four sets of bimetallic metal sites (Ni-Co, Ni-Fe, Ni-Sr, and Ni-Ce) over a cheap magnesia-alumina support. It may also pave the way for developing a robust DRM catalyst system using cheap chemicals like MgO, Al2O3 nickel nitrate, iron nitrate, strontium nitrate, and cobalt nitrate.
2. Materials and Methods
2.1. Materials
Nickel nitrate hexahydrate, cobalt nitrate hexahydrate, iron nitrate nonahydrate, cerium nitrate hexahydrate, strontium nitrate hexahydrate, MgO, and Al2O3.
2.2. Catalyst Preparation
Here, 0.95 g of 60 wt%MgO-40 wt%Al2O3 support was dispersed in 100 mL of deionized water at room temperature for 20 min. The nitrate precursor of Ni (equivalent to 2.5 wt%) and nitrate precursor of one metal (equivalent to 2.5 wt%) were added to the dispersed support solution at 80 °C until dry. The obtained solid sample was first calcined in air at 600 °C for 3 h. The support was abbreviated as 60Mg40Al, and the Ni supported catalysts were abbreviated as 2.5Ni-2.5M/60Mg40Al (M = Ce, Co, Fe, and Sr).
2.3. Catalyst Characterization
Brunauer–Emmett–Teller (BET), X-ray diffraction (XRD), Raman spectroscopy, H2 temperature-programmed reduction (H2-TPR), CH4-temperature programmed surface reaction (CH4-TPSR), CO2 temperature-programmed desorption (CO2-TPD), transmission electron microscopy (TEM), and thermogravimetric analysis (TGA) were used to characterize the catalysts. The Supporting Information (S1) provides a thorough explanation of the instruments and the characterization process.
2.4. Catalyst Activity Test
The dry reforming of the methane experiment was carried over 0.1g of promoted catalysts at 700 °C under 1atm pressure in a stainless steel vertical fixed tubular reactor (PID Eng. & Tech Micro Activity Reference, 9.1 mm i.d. and 30 cm long). The temperature of the reactor was monitored by an axially positioned thermocouple (K-type stainless sheathed) at the center of the catalyst bed. Before the catalytic tests, reductive pretreatment of the catalyst samples was carried out under the flow of hydrogen (20 mL/min) for 60 min at 600 °C. The mixture of gases fed CH4/CO2/N2 in the respective volumes as 6:6:2, and the volume flow rate was 70 mL·min−1 and 42,000 mL(h·gcat) −1 gas hourly space velocity was passed through the reactor. The product gas stream was analyzed with a GC (GC-2014 Shimadzu) unit equipped with a thermal conductivity detector and two columns, Porapak Q and Molecular Sieve 5A. H2 yield % and H2/CO molar ratio are determined using the following expressions:
3. Results and Discussion
3.1. Characterization Result and Discussion
The X-ray diffraction patterns of 2.5Ni-2.5M/60Mg40Al (M = Ce, Co, Fe, Sr) are shown in Figure 1. 2.5 wt%Ni-2.5 wt%M/60Mg40Al (M = Ce, Co, Fe, Sr) retained a noticeable diffraction pattern for the cubic NiO phase (JCPDS reference number 01-073-1519), cubic MgO phase (JCPDS reference number 01-075-1525), and orthorhombic MgAl2O4 phase (JCPDS reference number 00-033-0853) about 43.16°, 62.4° Bragg’s angle. The 2.5 wt%Ni-2.5 wt%Ce/60Mg40Al catalyst has additional diffraction pattern for cubic CeO2 (at Bragg’s angle 2θ = 28.55°, 33.08°, 47.48°, 56.34°; JCPDS reference number 01-075-0390) and the 2.5 wt%Ni-2.5 wt%Fe/60Mg40Al catalyst had an additional diffraction pattern for cubic Fe3O4 (at Bragg’s angle 2θ = 30.08°, 35.43°; JCPDS reference number 01-075-1372).
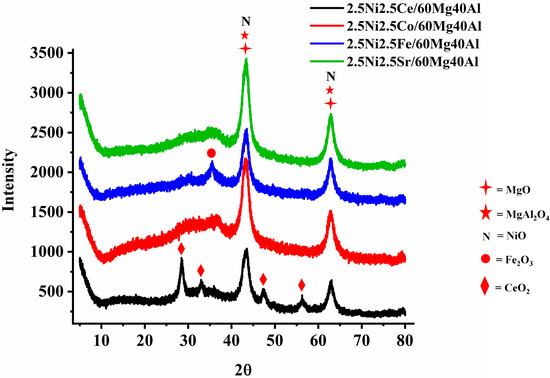
Figure 1.
X-ray diffraction (XRD) of the 2.5Ni-2.5M/60Mg40Al (M = Ce, Co, Fe, and Sr) catalysts.
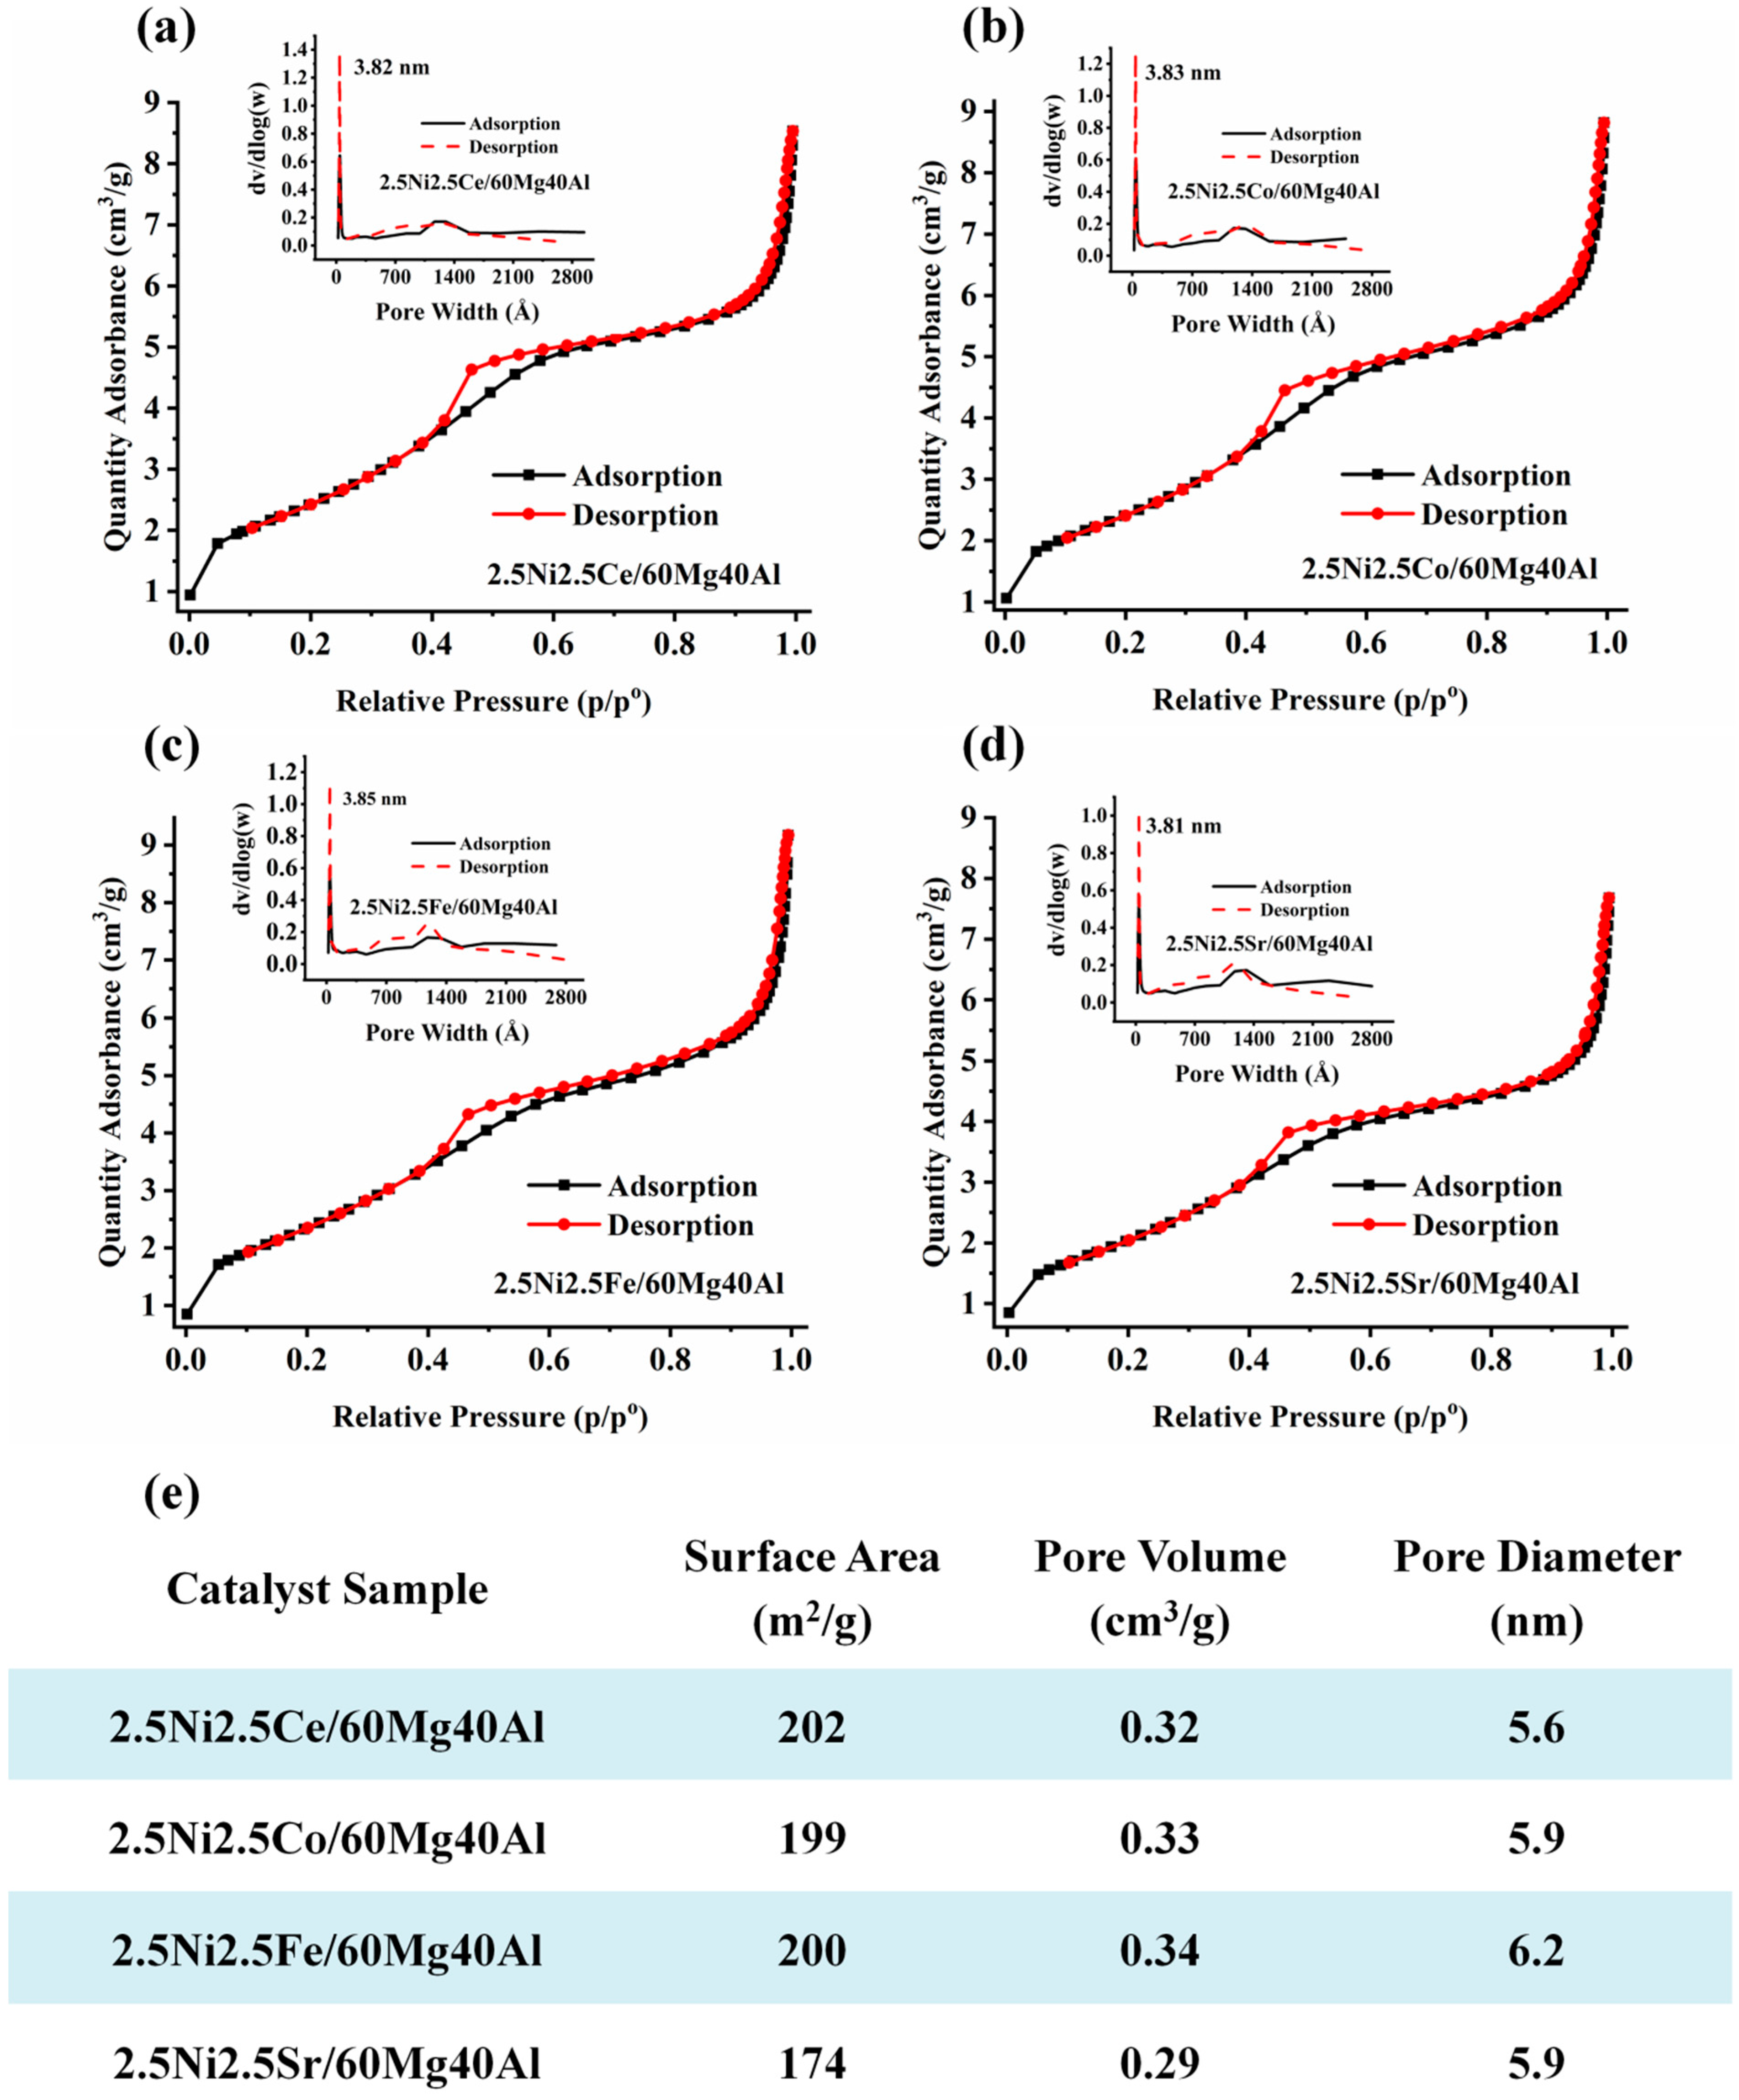
The surface and porosity results of the 2.5Ni-2.5M/60Mg40Al (M = Ce, Co, Fe, Sr) catalysts are shown in Figure 2. All catalysts showed type IV isotherms with an H4 hysteresis loop, indicating the presence of both micropores and mesopores [17]. The 2.5Ce2.5M/60Mg40Al (M = Ce, Co, Fe) catalyst had similar surface parameters (surface area 199–202 m2/g and pore volume 0.32–0.34 cm3/g). The surface area and pore volume of the 2.5Ni2.5Sr/60Mg40Al catalyst were the lowest (surface area: 174 m2/g, pore volume: 0.29 cm3/g) compared with the other catalysts. This indicates the serious accumulation of NiO and Sr compounds inside the pores.
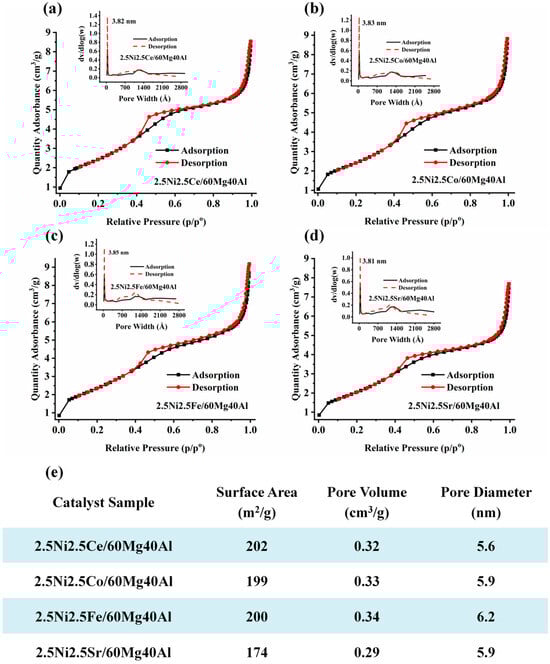
Figure 2.
The surface area and porosity of (a) 2.5Ni2.5Ce/60Mg40Al, (b) 2.5Ni2.5Co/60Mg40Al, (c) 2.5Ni2.5Fe/60Mg40Al, and (d) 2.5Ni2.5Sr/60Mg40Al. (e) Table of surface area, pore volume, and pore diameter of the 2.5Ni-2.5M/60Mg40Al (M = Ce, Co, Fe, Sr) catalysts.
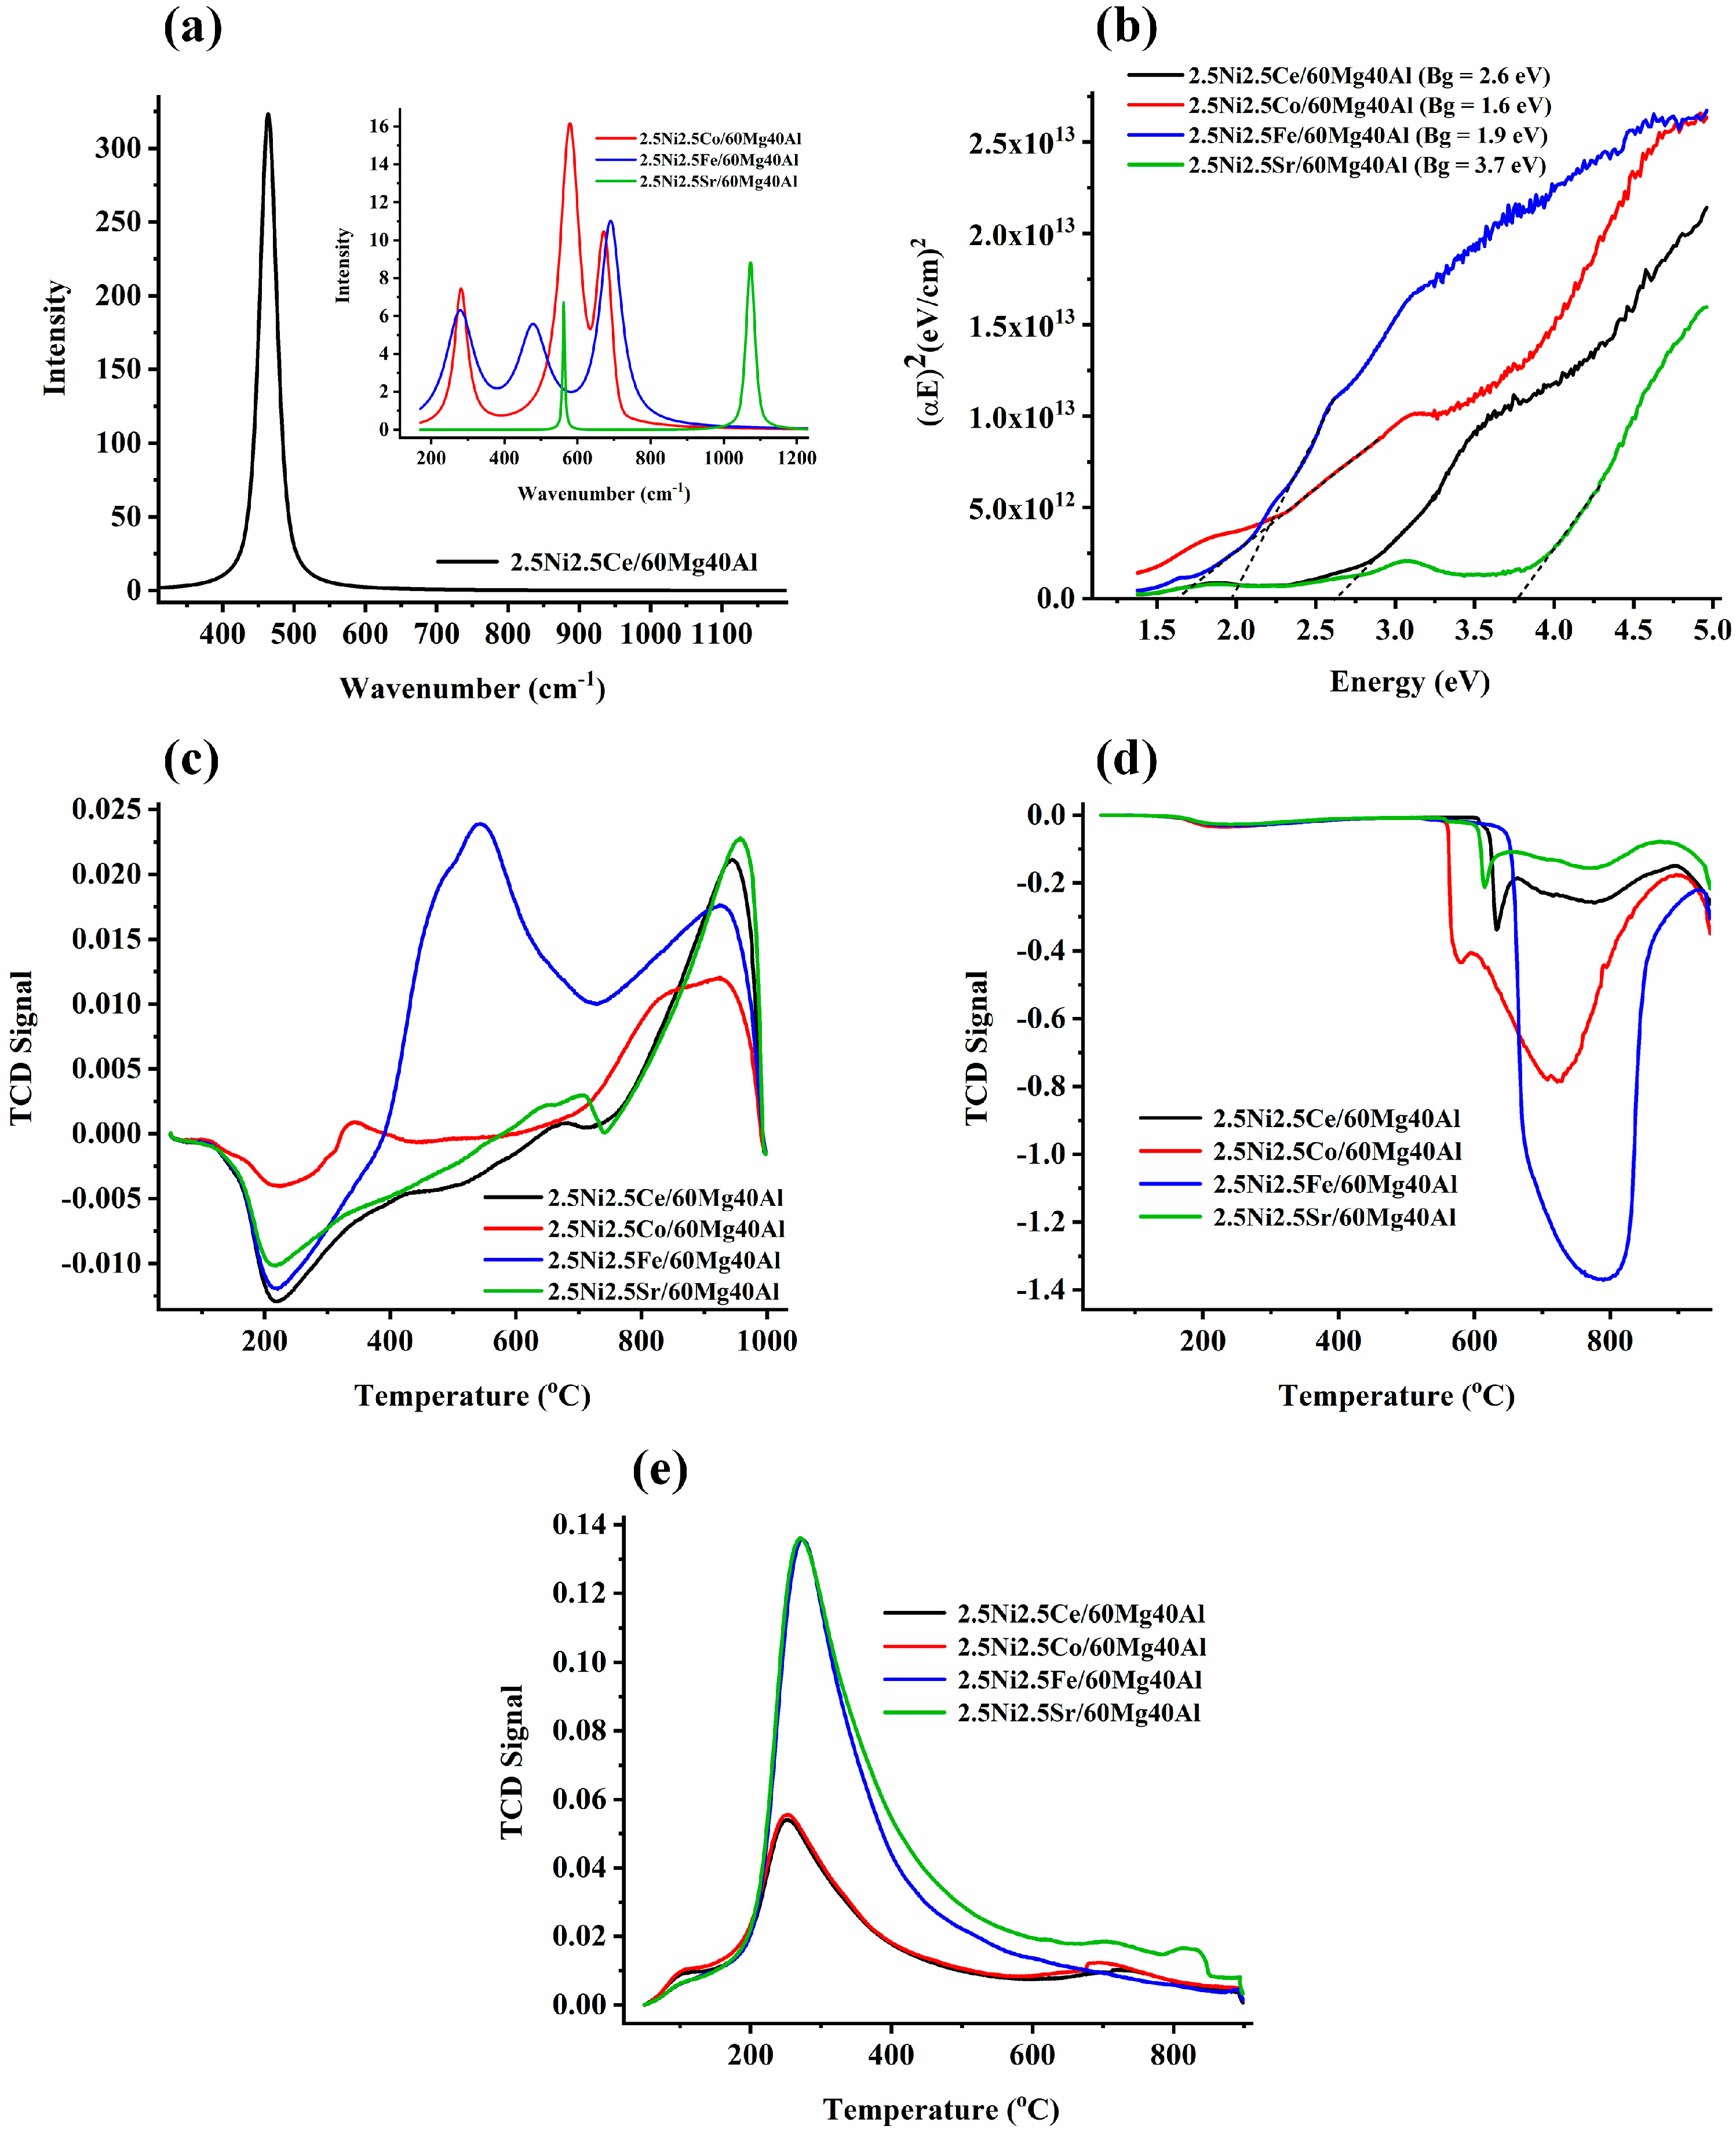
The Raman spectra of the 2.5Ni2.5M/60Mg40Al (M = Ce, Co, Fe, Sr) catalysts are shown in Figure 3.
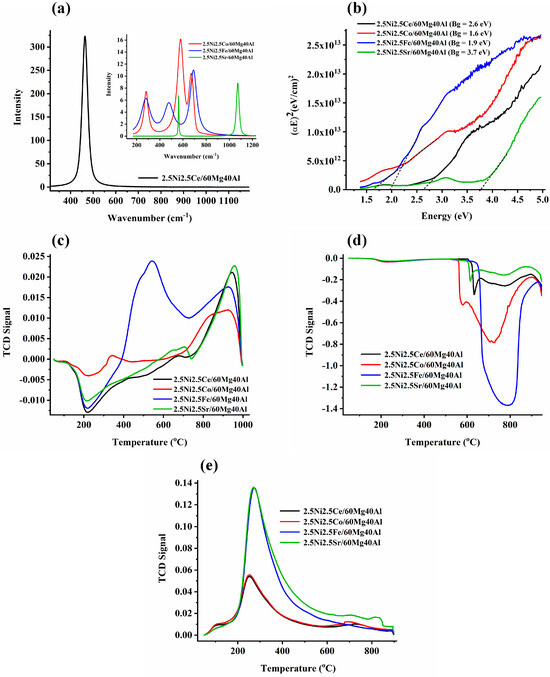
Figure 3.
(a) The Raman spectra of the 2.5Ni-2.5M/60Mg40Al (M = Ce, Co, Fe, Sr) catalysts. (b) Bandgap of the 2.5Ni-2.5M/60Mg40Al (M = Ce, Co, Fe, Sr) catalysts. (c) H2-temperature programmed reduction profile of the 2.5Ni-2.5M/60Mg40Al (M = Ce, Co, Fe, Sr) catalysts. (d) CH4-temperature programmed surface reaction experiment of the 2.5Ni-2.5M/60Mg40Al (M = Ce, Co, Fe, Sr) catalysts. (e) CO2-temperature programmed desorption of the 2.5Ni-2.5M/60Mg40Al (M = Ce, Co, Fe, Sr) catalysts.
The 2.5Ni2.5Ce/60Mg40Al catalyst showed an intense RAMAN band about 463 cm−1, which is attributed to the symmetric F2g stretching mode of oxygen surrounding the Ce4+ in cubic CeO2 [18,19] (Figure 3a). The XRD of 2.5Ni2.5Ce/60Mg40Al also showed the prominent peak for cubic CeO2. The 2.5Ni2.5Sr/60Mg40Al catalyst showed two sharp Raman peaks at 560 cm−1 and 1071 cm−1 for the Sr-O and CO32− vibration of Sr2+, respectively [20]. The absence of Sr-related phases in XRD may be due to the good dispersion of the Sr compound over the catalyst surface. The 2.5Ni2.5Co/60Mg40Al catalyst showed Raman vibration bands at 282 cm−1, 580 cm−1, and 672 cm−1. In the literature, the Raman peaks for Co(OH)2 have been reported at 284 cm−1, 462 cm−1 (OCoO bending mode), and 522 cm−1 (OH deformation mode) [21,22]. Previously, in the Ni1-xCoxTiO3 sample, as per the varying degree of x from 0.05 to 0.80, the Raman band was found to shift from 289 to 272 cm−1 [23]. This means for the 2.5Ni2.5Co/60Mg40Al catalyst, the Raman peak of about 284 cm−1 was for the Co(OH)2 vibration and was very sensitive to the degree of substitution. The Raman peak at 580 cm−1 was reported for the vibration mode of CoO(OH) (oxidation state of Co (III)) [21]. The peak at 580 cm−1 was the most intense Raman peak in the 2.5Ni2.5Co/60Mg40Al catalyst. The Raman band at 675–680 cm−1 was a typical band reported for Co-O vibration in CoO, Co3O4, and CoO·xCoO [22,24,25,26]. From the Raman analysis, an interacted-CoO, Co3O4, Co (OH)2, and CoO (OH)-type composition can be claimed. Previously, the absence of the CoO (OH) pattern in XRD was due to its amorphous nature [21]. It is noticeable that, here, the catalyst was prepared at 600 °C, activated at 800 °C, and employed for the DRM reaction at 700 °C. During this temperature range, various types of interconversion between cobalt compounds may be possible [22], as per the following reactions: 6Co(OH)2 + O2 → 2Co3O4 + 6H2O (at 120 °C), 12CoO(OH) → 4Co3O4 + O2 + 6H2O (at 252 °C), 2Co3O4 → 6CoO + O2 (at 790 °C). Here, H2-TPR was taken after the catalyst preparation. This means that over a fresh 2.5Ni2.5Co/60Mg40Al catalyst, some complex structure of cobalt compound made up of 6Co (OH)2 and Co3O4 (or Co2O3·CoO) may be present. In XRD, the phase for NiO was observed, but no phases of the cobalt compound were found. So, it can be expected that the cobalt compound may be amorphous or the cobalt compound may be more dispersed than NiO over the catalyst. The 2.5Ni2.5Fe/60Mg40Al catalyst had Raman bands at 280 cm−1, 480 cm−1, and 689 cm−1. In the literature, peaks at 290 cm−1, 490 cm−1, and 659 cm−1 were reported for the Raman vibration of Fe2O3 [27]. The red and blue shift of the Raman band (concerning the standard Fe2O3 band) was due to the insertion of the hetero-atom in the lattice of Fe2O3. The band at 689 cm−1 may be related to structural disorder due to the insertion of the Al cation into the iron oxide lattice [28].
The bandgap of the UV−VIS results is shown in Figure 3b. Among all of the catalysts, the band gap between the valance band and conduction band was found to be lowest for the 2.5Ni2.5Co/60Mg40Al catalyst and highest for 2.5Ni2.5Sr/60Mg40Al. The H2-temperature programmed reduction profile (H2-TPR) of 2.5Ni2.5M/60Mg40Al (M = Ce, Co, Fe, Sr) catalysts are shown in Figure 3c. The negative H2-TPR in the temperature range of 200 °C was attributed to hydrogen spillover into the mesopores [29]. Upon the incorporation of Ce or Sr along with Ni over 60Mg/40Al, there was a single intense peak of about 900 °C, which was attributed to reducible “strongly interacted NiO” species [30]. The H2-TPR profile of the 2.5Ni2.5Fe/60Mg40Al catalyst was unique. It had merge peak at 500 °C and 550 °C and a peak at 850 °C. These peaks were attributed to the reduction in “moderately interacted NiO” species (into Ni), reduction in Fe3O4 (into FeO), and “strongly interacted NiO” species (into Ni), respectively [30]. It may be possible that the reduction peak of FeO to Fe may be merged with a peak of about 850 °C over the 2.5Ni2.5Fe/60Mg40Al catalyst. So, the peak intensity at 850 °C may be due to reducible strongly-interacted-NiO and reducible FeO species.
The CH4-temperature programmed surface reaction (TPSR) experiment was carried out up to a temperature of 950 °C for the different catalyst systems (Figure 3d). The CH4-TPSR peaks at different temperatures signified the extent of CH4 decomposition over different active sites at the catalyst. From the CH4-TPSR experiments, it was clear that 2.5Ni2.5Fe/60Mg40Al had the highest density for the CH4 decomposition sites, whereas 2.5Ni2.5Ce/60Mg40Al and 2.5Ni2.5Sr/60Mg40Al had the least sites for CH4 decomposition [31]. The CO2-temperature programmed desorption profile of the 2.5Ni2.5M/60Mg40Al (M = Ce, Co, Fe, Sr) catalysts is shown in Figure 3e. All samples showed a desorption peak at about 300 °C, attributed to surface basicity due to surface oxygen anion [32]. The desorption peak intensity for the 2.5Ni2.5Fe/60Mg40Al and 2.5Ni2.5Sr/60Mg40Al catalysts indicated a similar type of basic site density over both catalysts. In the same way, the basic site distribution over the 2.5Ni2.5Ce/60Mg40Al and 2.5Ni2.5Co/60Mg40Al catalysts was similar. The total basic sites over the 2.5Ni2.5M/60Mg40Al (M = Sr, Fe) catalyst was higher than the 2.5Ni2.5M/60Mg40Al (M = Co, Ce) catalyst. Overall, it can be said that the CO2 interaction of the 2.5Ni2.5Fe/60Mg40Al and 2.5Ni2.5Sr/60Mg40Al catalysts was more significant than the 2.5Ni2.5Ce/60Mg40Al and 2.5Ni2.5Ce/60Mg40Al catalysts.
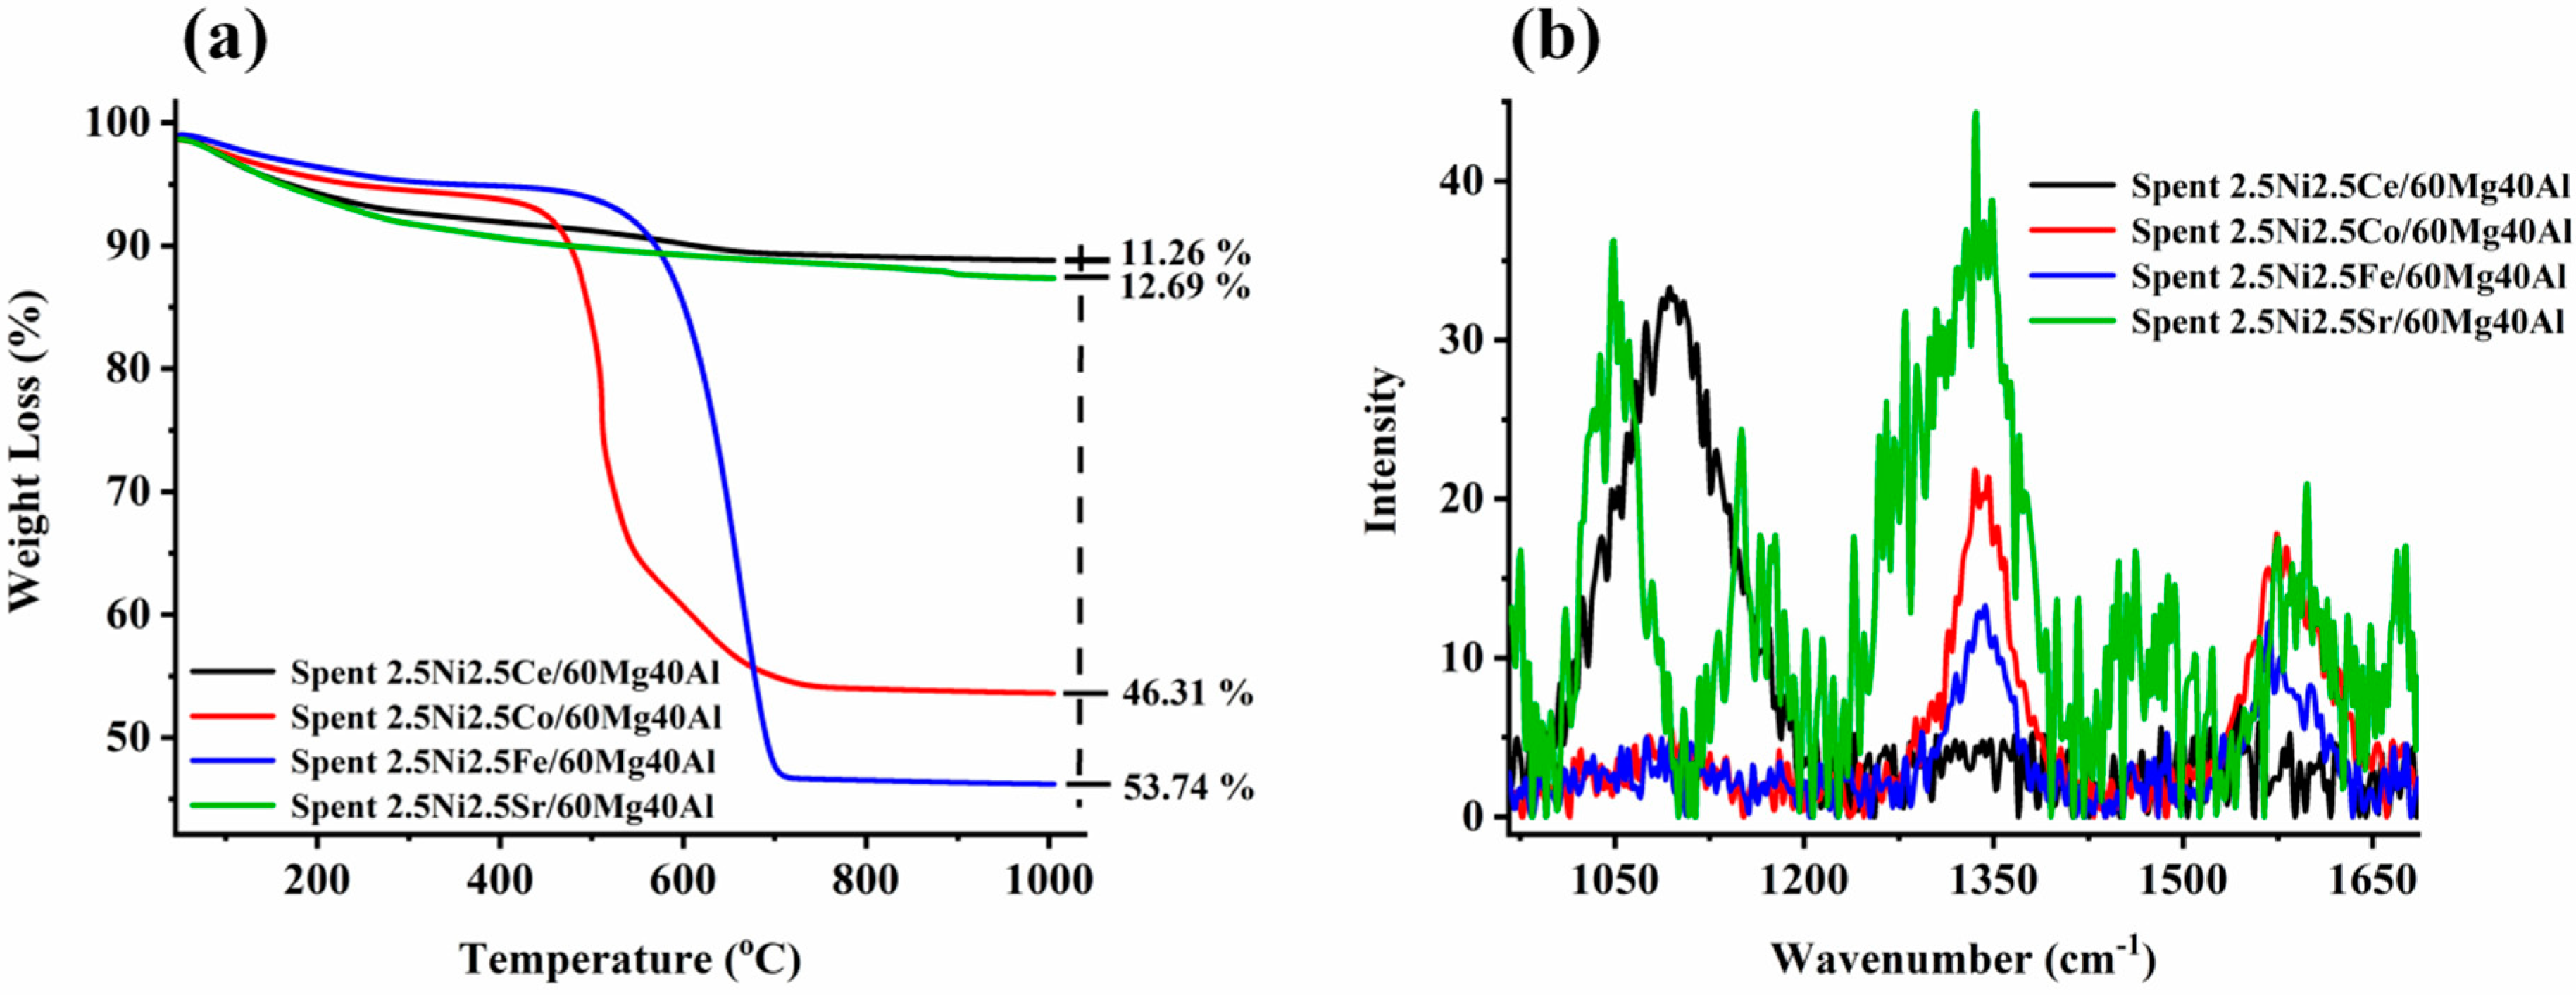
The thermogravimetry profile of spent-2.5Ni2.5M/60Mg40Al (M = Ce, Co, Fe, Sr) is shown in Figure 4a. The minimum weight loss (~11%) was noticed for the spent-2.5Ni2.5Ce/60Mg40Al catalyst. It is noticeable that the CO2-desorption profiles of both the 2.5Ni2.5Co/60Mg40Al catalyst and 2.5Ni2.5Ce/60Mg40Al catalyst were similar, but the amount of oxidizable carbon deposit earlier was much higher than later. This indicates the different oxidizing capacities of both catalysts, even though both had the same level of interaction with CO2 (verified by CO2-TPD). This indicates a different oxidizing route than the direct oxidation by CO2. The instant oxygen-endowing capacity of the ceria-based catalyst system ignited carbon deposits before CO2. So, the delay in carbon deposit oxidation by CO2 was minimized, and the catalyst surface had less carbon deposit than the 2.5Ni2.5Ce/60Mg40Al catalyst. The low weight loss (12.69%) over the spent-2.5Ni2.5Sr/60Mg40Al catalyst may be related to the presence of inert carbon species/non-oxidizable carbon species. The spent-2.5Ni2.5Fe/60Mg40Al and spent-2.5Ni2.5Co/60Mg40Al catalyst had a serious weight loss of 53.74% and 46.31%, respectively. In H2-TPR, we found huge reduction peaks for iron, and the oxidation of lower iron states was not neglected during TGA of spent-2.5Ni2.5Fe/60Mg40Al catalyst. Even with the possibility of oxidation of Fe, Spent-2.5Ni2.5Fe/60Mg40Al had the highest weight loss at 53.75%. This means the actual weight loss due to carbon deposit over Spent-2.5Ni2.5Fe/60Mg40Al was even higher. To understand the type of carbon deposit, the Raman profile of spent-2.5Ni2.5M/60Mg40Al (M = Ce, Co, Fe, Sr) catalysts was also carried out and is shown in Figure 4b and Figure S1. The peak profile at 1340 cm−1 was attributed to an imperfect carbon band/disordered carbon band (ID), whereas the peak at 1570 cm−1 was signified by the ordered graphitic carbon band (IG) [33]. The D and G bands were due to sp2 carbon vibration. Interestingly, ceria-based catalyst spent-2.5Ni2.5Ce/60Mg40Al had no band for graphitic/ordered carbon or disordered carbon, but it had a broad peak at 1070 cm−1 due to C-C sp3 vibration (T band) [33]. Including overtone bands, the spent-2.5Ni2.5Ce/60Mg40Al catalyst also had a 2D′′ band (2435 cm−1) [33] and the 2D band (2676 cm−1) [33]. The 2.5Ni2.5Fe/60Mg40Al and 2.5Ni2.5Co/60Mg40Al catalysts had only D, G, and 2D bands. The intensity of the disordered carbon band increased in the following order: spent-2.5Ni2.5Fe/60Mg40Al < spent-2.5Ni2.5Ce/60Mg40Al < spent-2.5Ni2.5Co/60Mg40Al < spent-2.5Ni2.5Sr/60Mg40Al. In the same way, the intensity of the graphitic carbon band increased in the following order: spent-2.5Ni2.5Fe/60Mg40Al < spent-2.5Ni2.5Ce/60Mg40Al < spent-2.5Ni2.5Co/60Mg40Al ~ spent-2.5Ni2.5Sr/60Mg40Al. The spent-2.5Ni2.5Sr/60Mg40Al catalyst had many additional bands, such as the T band (split into 1050 cm−1 and 1080 cm−1), 2T band (2100 cm−1), carbyne band (2175 cm−1) [34] 2D′′ band (2435 cm−1), and G + D band (at 2900 cm−1) [33]. Overall, it seems that the 2.5Ni2.5Sr/60Mg40Al catalyst had a wide range of inert carbon species over the surface, which did not oxidize during TGA (giving low weight loss), but could seriously affect the catalytic activity.
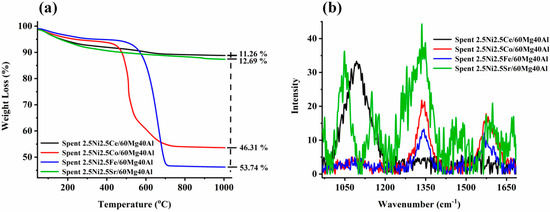
Figure 4.
(a) Thermogravimetry profile of spent-2.5Ni-2.5M/60Mg40Al (M = Ce, Co, Fe, and Sr) catalysts. (b) Raman spectra of spent-2.5Ni-2.5M/60Mg40Al (M = Ce, Co, Fe, and Sr) catalysts.
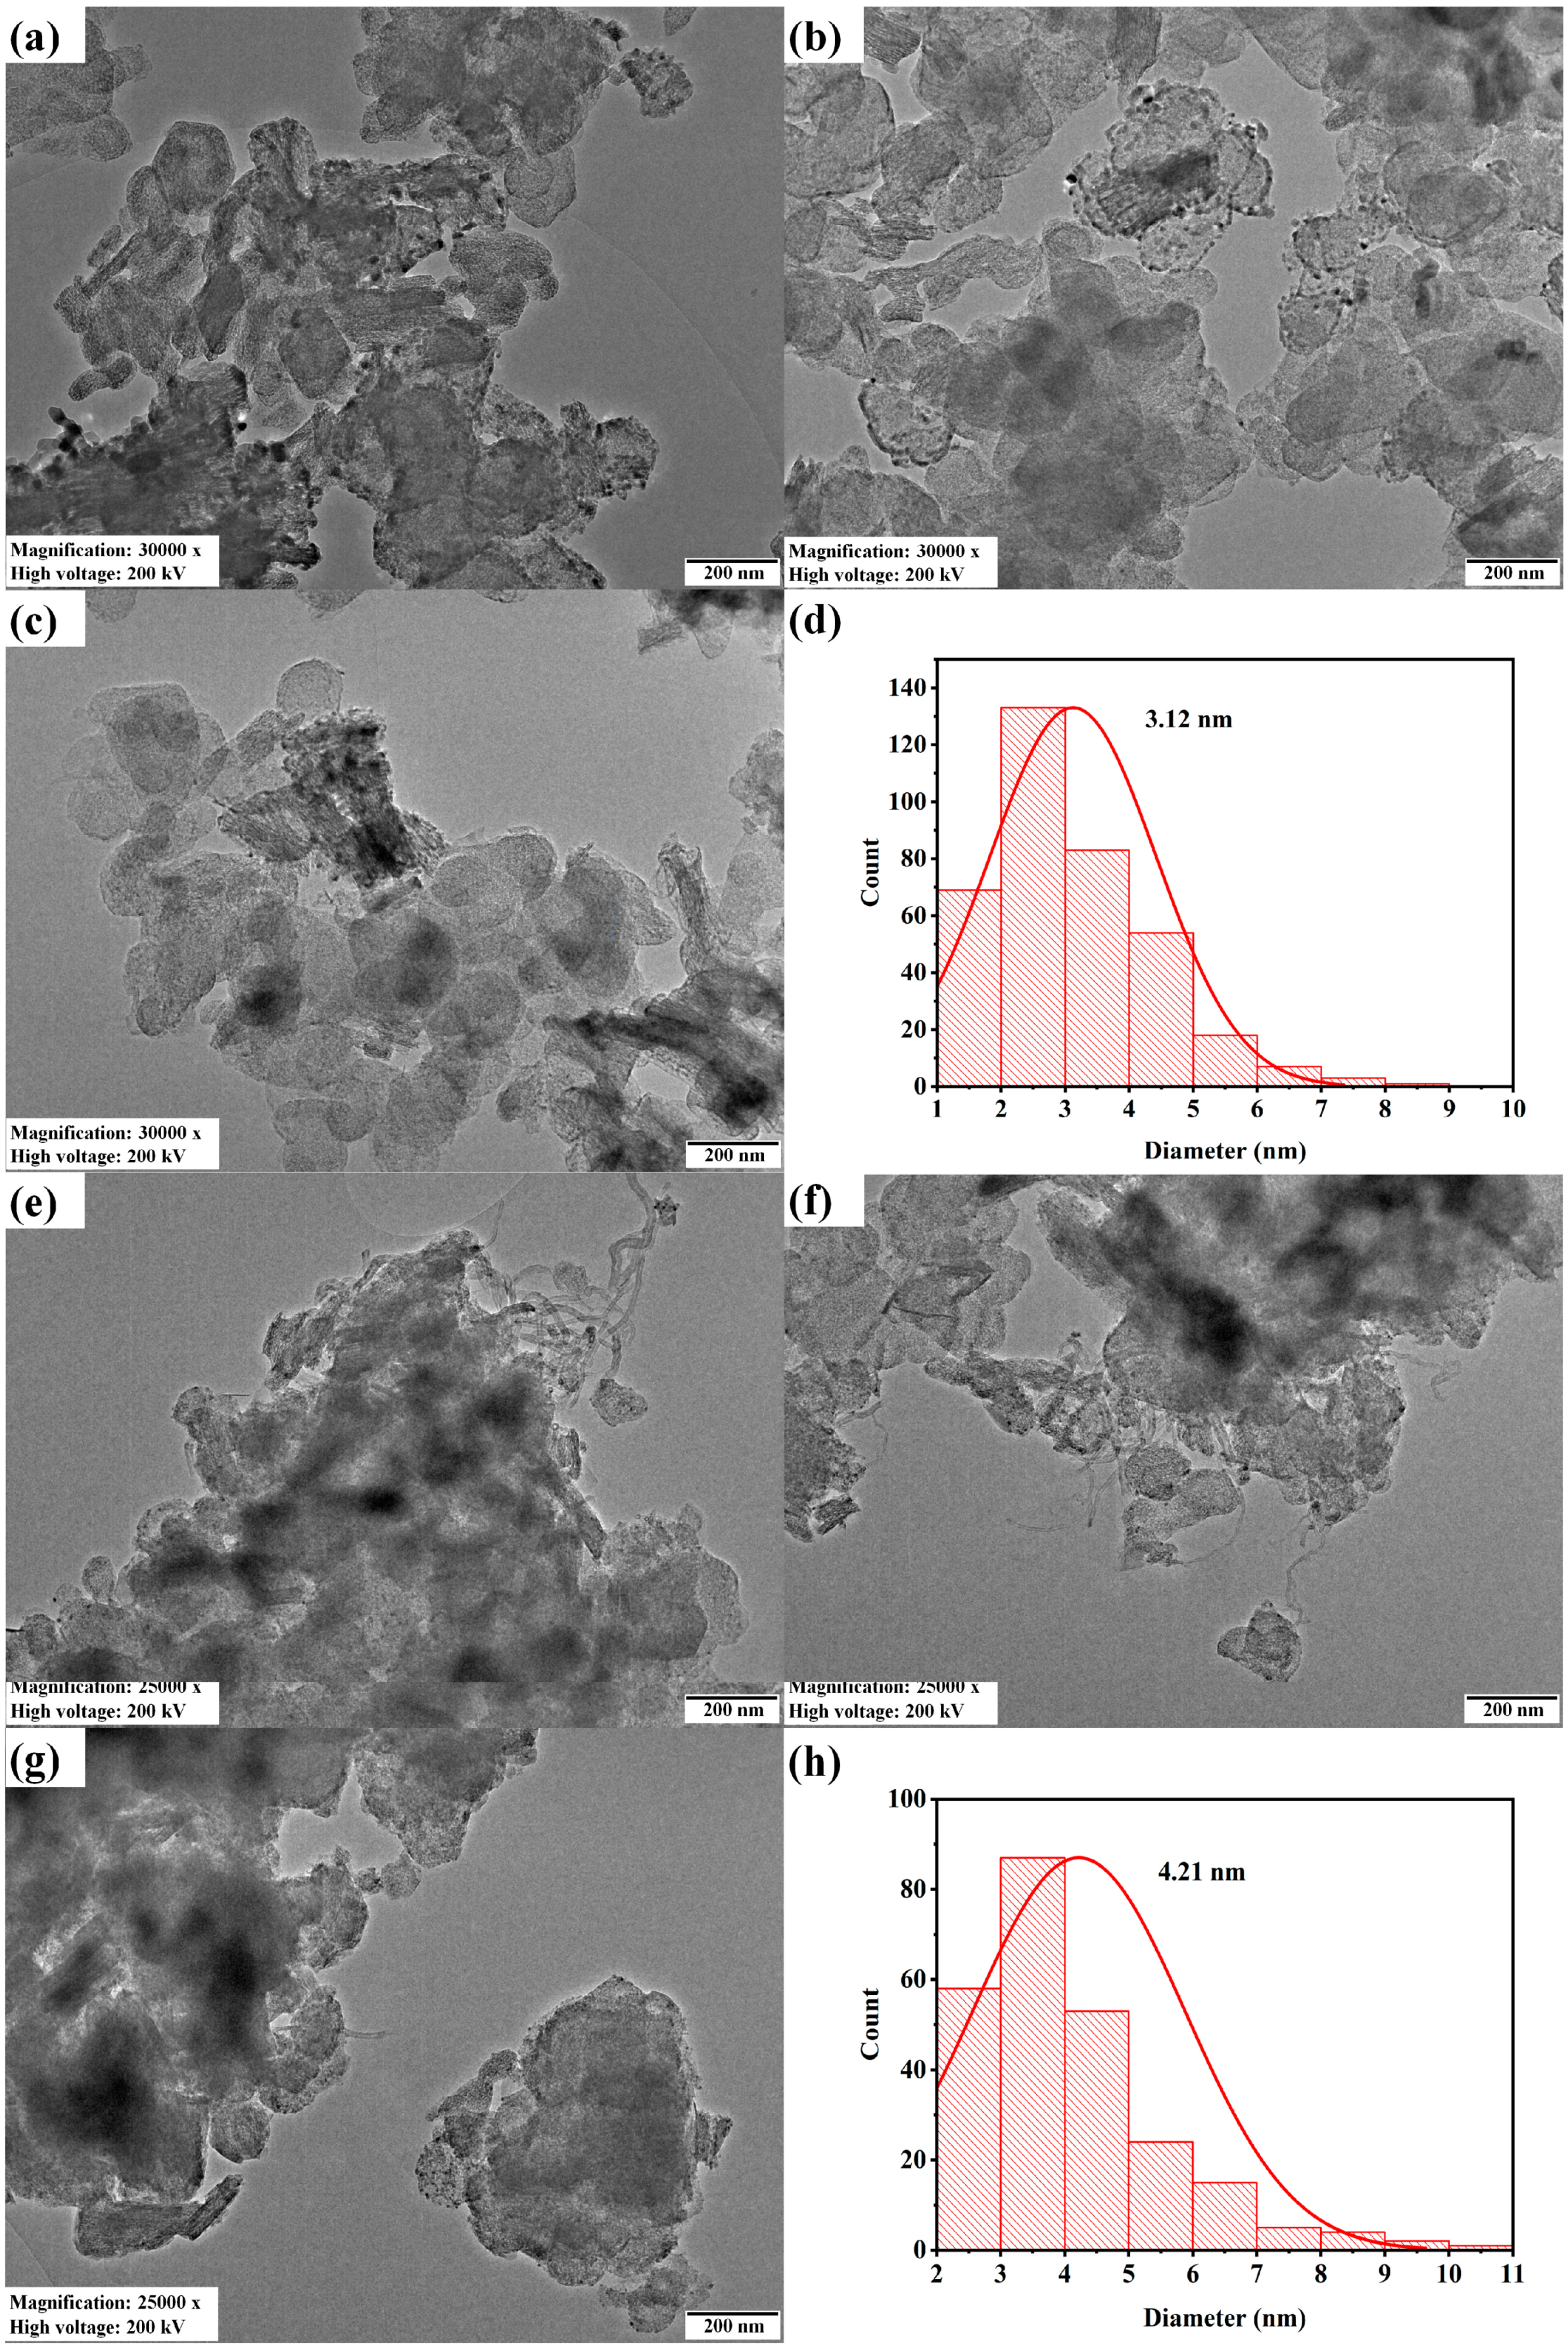
The transmission electron microscopy and Ni particle size distribution of fresh and spent 2.5Ni-2.5Co/60Mg40Al catalysts are depicted in Figure 5. The particle size of the spent 2.5Ni-2.5Co/60Mg40Al catalyst was larger (4.21 nm) than the fresh 2.5Ni-2.5Co/60Mg40Al catalyst (3.12 nm). The dark shadow marks and carbon nanotubes were evident over the spent-2.5Ni-2.5Co/60Mg40Al catalyst.
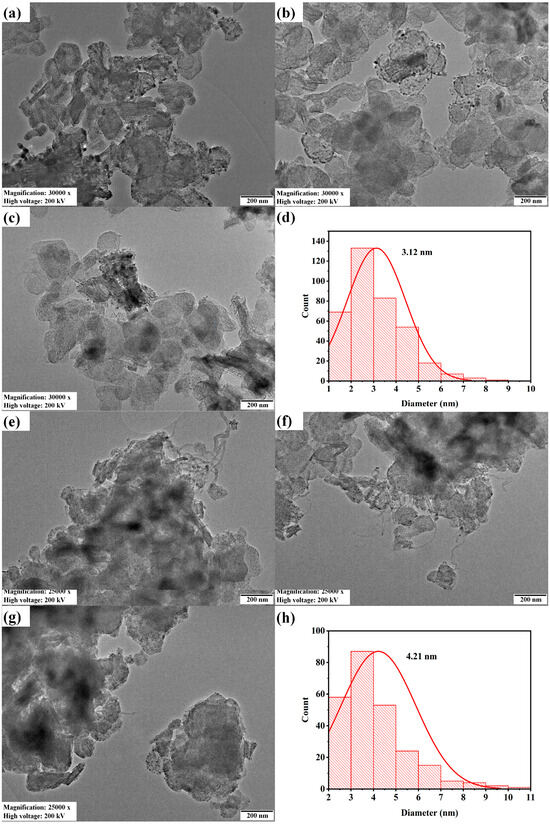
Figure 5.
Transmission electron microscopy of the (a–c) 2.5Ni2.5Co/60Mg40Al catalyst at 30,000× magnification, 200 kV voltage and 200 nm scale; (e–g) spent-2.5Ni2.5Co/60Mg40Al catalyst at 25,000× magnification, 200 kV voltage and 200 nm scale; Ni particle size distribution; (d) 2.5Ni2.5Co/60Mg40Al catalyst (h). Spent-2.5Ni2.5Co/60Mg40Al catalyst.
3.2. Catalytic Activity Result and Discussion
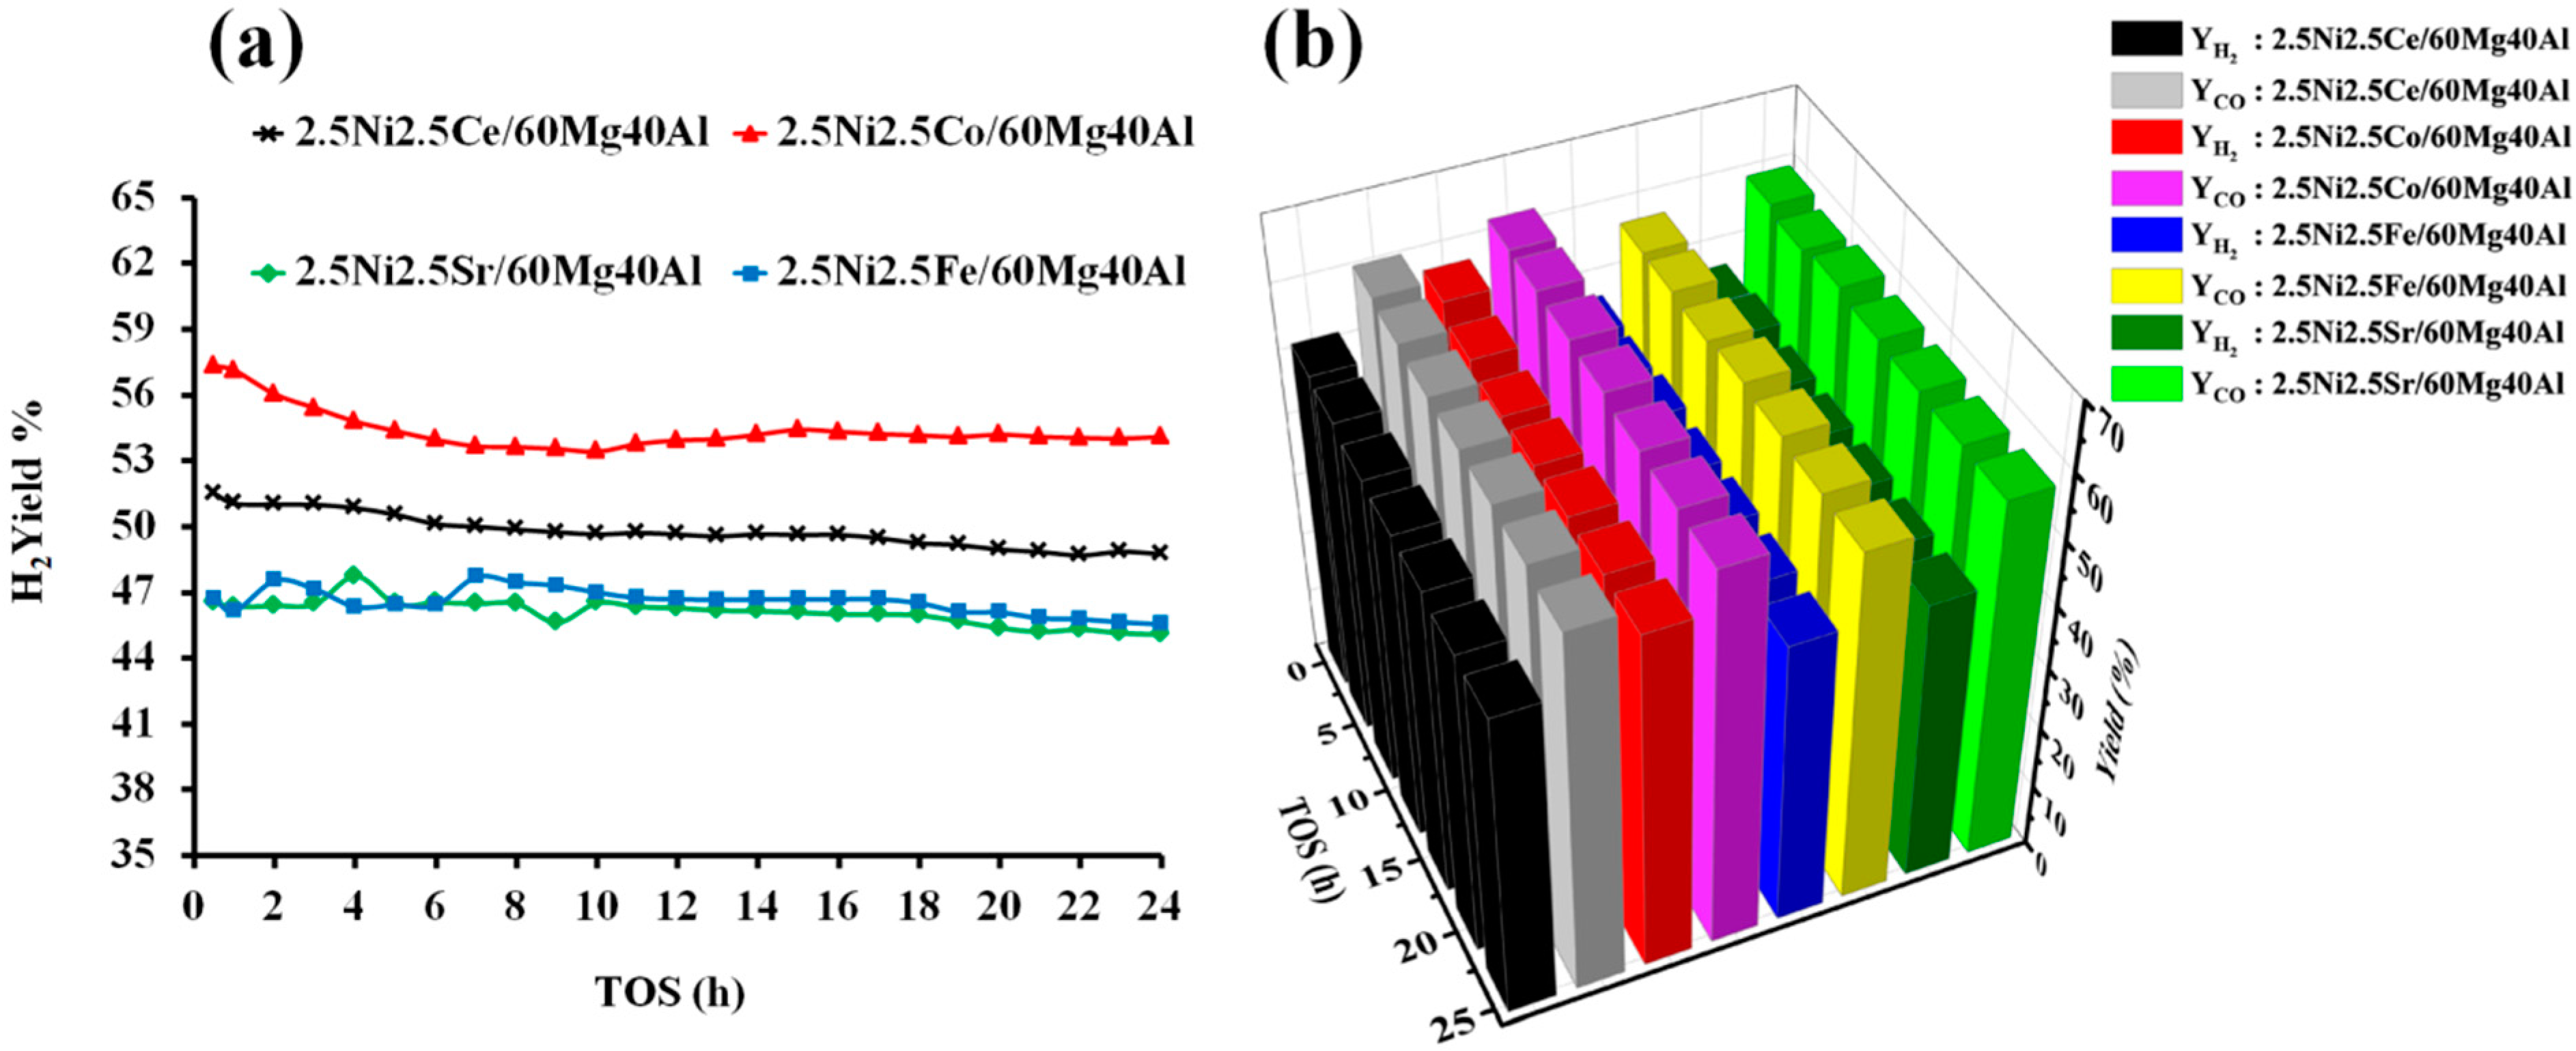
The catalytic activity of the pure NiO and support-60Mg40Al towards dry reforming of methane were tested. The H2 yield and CO yield with pure NiO were found to be only 0.75% and 1.25%, respectively, at a reaction temperature of 700 °C. The support “60 wt%MgO40 wt%Al2O3” was also found to exhibit a catalytic activity, but it was much more selective towards CO than H2. 60Mg40Al showed 0.06% H2 yield and 4.10 CO yield. However, when Ni was dispersed over the 60Mg40Al support, the H2 yield eventually increased more than 60%. This suggests that the size and stability of Ni against high temperatures over proper support is essential for achieving a high DRM activity. The size and morphology of Ni can be controlled by proper calcination methodology and mixing a suitable matrix with Ni during the catalyst preparation [35,36]. The XRD results show that the Al2O3 and MgO metal oxide matrixes mixed, and the support obtained a new phase (orthorhombic MgAl2O4) identity that was composed of Mg, O, and Al. That means a homogenous matrix of Mg, O, and Al was ready to carry the NiO-MOx (M = Ce, Co, Fe, Sr) metal oxide to catalyze the dry reforming of methane. The catalytic active sites of “metallic Ni” were derived from the reduction in “strongly interacted NiO” species over the 2.5Ni-2.5M/60Mg40Al (M = Ce, Co, Fe, Sr) catalyst system. The catalytic activity results of 2.5Ni-2.5M/60Mg40Al (M = Ce, Co, Fe, Sr) catalysts are shown in Figure 6. Among all of the catalysts, 2.5Ni2.5Co/60Mg40Al had a 57% H2 yield, which decreased to 54% after 24 h. The CO yield was above the H2 yield, and it remains between 62–60% 24 h TOS. The relatively higher CO yield than H2 yield indicates the presence of H2 consuming reactions. Over the catalytic surface, H2 can interact with carbon monoxide (CO) or carbon dioxide (CO2) and form water (H2O) and carbon (H2 + CO → H2O + C; 2H2 + CO2 → 2H2O + C). However, with a positive value for Gibb’s free energy, these reactions were not thermodynamic feasible [37]. On the other hand, the reaction of H2 and CO2 forming CO and water is thermodynamically feasible and is known as reverse water gas shift reaction. This reaction increases the concentration of CO at the expense of the H2 concentration, resulting into a higher CO yield. It is worth noting that we did not detect H2O in the gas-chromatogram, indicating the involvement of water in some other reactions. Thermodynamic equilibrium studies of DRM via Gibbs free energy have shown that the gasification of coke by water is a thermodynamically favorable reaction (C + H2O → CO + H2). Overall, the reverse water gas shift reaction and gasification reaction were also present along with the DRM reaction, resulting in an increase in CO concentration or CO yield [37]. The 2.5Ni2.5Ce/60Mg40Al catalyst showed a moderate activity towards DRM and H2 yield, and the CO yield remained between 51–49% and 60–59% during 24 h TOS, respectively. The activity of the 2.5Ni2.5Fe/60Mg40Al and 2.5Ni2.5Sr/60Mg40Al catalysts was found to be inferior, and their catalytic H2 yield remained about 45% during 24 h TOS.
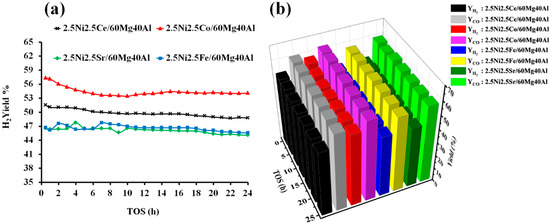
Figure 6.
Catalytic activity results of 2.5Ni-2.5M/60Mg40Al (M = Ce, Co, Fe, and Sr) catalysts (a) H2-yield vs. TOS. (b) Bar diagram of H2 yield and CO yield vs. TOS.
Here, we discuss the catalytic routes and coke deposition routes over different catalyst surfaces. The possible coke deposition routes are shown in Figure 7. The catalyst may bear the sites for CH4 decomposition or CO2 decomposition [38,39,40]. Further, the decomposed species (reaction intermediate) were quite active and could interact with another species or the same species instantly. In the current catalyst system, metallic Ni sites were available for CH4 decomposition. It is well accepted that CH4 is decomposed into CH4−x and H2 over metallic Ni (Step S1; Figure 7). After that, CH4−x may be oxidized by CO2 (under DRM) into syngas (CO + H2) (Step S2, Figure 7). However, the delay in the oxidation of CH4−x allowed for the polymerization of CH4−x into coke (Step S2′; Figure 7). In a recent study, Zhang et al. carried out DFT studies focused on methane cracking over a catalyst surface and the subsequent growth of cracked carbon from the C1 carbon unit to the C6 carbon unit (C1–C6) [41]. From the C1–C4 carbon growth, “chain to chain” growth path (lengthening of carbon chain) was the main growth path. Further, at >C4, the growth path shifted from “chain to chain” to “chain to ring”. The growth energy of the “chain to ring” path was lower (1.5 eV) than the “chain to chain” path from C4–C5, and it was further lowered to 0.55 eV from C5–C6. Clearly, the C6 unit was formed majorly from chain to ring growth pathways. It is basic unit of complex structural carbon species such as graphene and carbon nanotube.
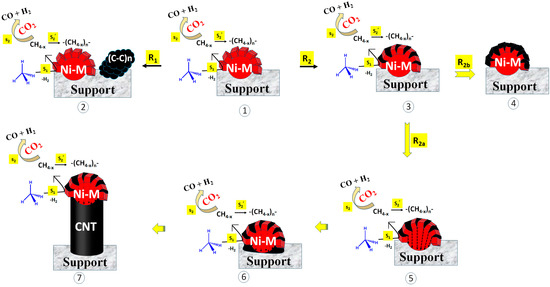
Figure 7.
Different routes of coke deposition. Route 1 (R1): Decomposition of CH4 at catalytic active sites (into CH4−x), polymerization of CH4−x (into coke), and diffusion of coke far from the active sites. Route 2 (R2): decomposition of CH4 at catalytic active sites (into CH4−x), polymerization of CH4−x (into coke), and coke deposition into the cell gap of active sites (as Ni-metal). Sub-route R2a: Coke deposition inside Ni-M, precipitation at metal−support junction, and mounting of Ni over coke. Sub-route R2b: Coke deposition inside Ni-M, encapsulation of active sites (Ni-M). M = Fe, Co, Ce, Ni; S1: CH4 decomposition into CH4−x, S2: Oxidation of carbon deposit, S2′. polymerization of carbon deposit into coke.
The 2.5Ni2.5Co/60Mg40Al catalyst has massive coke deposition (weight loss 46%); these cokes are sp2 hybridized defective carbon (disordered type) and ordered carbon (graphitic types). However, the TEM image of the spent-2.5Ni2.5Co/60Mg40Al catalyst shows very few carbon nanotubes, but the impression of dark marks is frequently visible. The catalyst has the highest and constant catalytic activity (54% H2 yield from 14 h to 24 h reaction time) among the rest of the catalysts. The presence of few carbon nanotubes, the impression of frequent dark marks, massive weight loss, and the high catalytic activity of the 2.5Ni2.5Co/60Mg40Al catalyst indicate that carbon deposits are mostly accumulated as dark impressions over the catalyst, without affecting the catalytic active sites. If the rate of coke formation (at active sites) is firmly matched to the rate of coke diffusion (far from catalytic active sites) (Route 1; R1; Figure 7), then active sites remain exposed and coke is accumulated far from the active sites [42]. This means that activity is not affected, even with a high coke deposition.
If the precursor of the carbon nanotube/C6 unit is not diffused out in a timely manner (far from the active site), it rapidly settles into the cell gap inside the Ni particle (or cell gap of active sites) (Route 2; R2; Figure 7). From here, there are two sub-routes. The first is the diffusion of coke inside the Ni particle, followed by the precipitation of coke at the site near the support. Slowly, the precipitated cokes are accumulated, the carbon nanotube grows, and, finally, catalytic active Ni is uplifted (R2a). In this way, metallic Ni is always mounted above the nanotube and remains exposed to the reactant. So, the activity of the catalyst is not suppressed. The second sub-route is coke deposition mounting in the cell gap and slowly encapsulating the active sites (metallic Ni) (R2b). Encapsulation of the active sites cuts the contact between the reactant and the catalyst. If step S2 (CH4−x oxidation) is delayed over step S2′ (CH4−x polymerization), encapsulation of the active sites is faster, and the catalytic activity is retarded. The 2.5Ni2.5Fe/60Mg40Al and 2.5Ni2.5Sr/60Mg40Al catalysts have a comparable activity (45–46% H2-yield) but inferior to the 2.5Ni2.5Ce/60Mg40Al and 2.5Ni2.5Co/60Mg40Al catalysts. The 2.5Ni2.5Fe/60Mg40Al catalyst has the same CO2 interaction profile as the 2.5Ni2.5Sr/60Mg40Al catalyst, but the bandgap energy (for electron transfer from the valance band to the conduction band) of 2.5Ni2.5Fe/60Mg40Al is about half that of 2.5Ni2.5Sr/60Mg40Al. The 2.5Ni2.5Fe/60Mg40Al catalyst is additionally populated with reducible iron oxide, which is known to trigger CH4 decomposition [42], but it has a huge coke deposition (~54% weight loss). The CH4-TPSR experiment also verifies the presence of the highest density of CH4 decomposition sites being in the 2.5Ni2.5Fe/60Mg40Al catalyst. The low catalytic activity (45% H2-yield) of 2.5Ni2.5Fe/60Mg40Al indicates that many of the active sites are arrested/encapsulated by bulk coke. The 2.5Ni2.5Sr/60Mg40Al catalyst has less surface area (and pore volume), which carries a diverse array of carbon deposits from the active to inert range (verified by Raman of spent catalyst). The shading of catalytic active sites by inert carbon over 2.5Ni2.5Sr/60Mg40Al causes the least catalytic activity (~45% H2-yield). The activity of the 2.5Ni2.5Ce/60Mg40Al catalyst is more progressed than the 2.5Ni2.5Fe/60Mg40Al and 2.5Ni2.5Sr/60Mg40Al catalysts due to its capability to release lattice oxygen instantly (prior than CO2) to oxidize carbon deposits. This results in the lowest non-graphitic carbon deposit and 49% H2 yield during 24 h TOS.
4. Conclusions
The formation of mixed oxide phases (orthorhombic MgAl2O4 phase) by MgO-Al2O3 indicates a more homogeneous distribution of atoms (Mg, O, and Al) in the support material. The support serves as a carrier for NiO-MOx (M = Ce, Co, Fe, and Sr) metal oxides, which catalyze the DRM reaction. The CO2 interaction profiles of both the 2.5Ni2.5Sr/60Mg40Al and 2.5Ni2.5Fe/60Mg40Al catalysts are similar, but the latter has less bandgap energy for electron transfer. Th relativelylow surface area and shading of active sites by inert carbon species make the 2.5Ni2.5Sr/60Mg40Al catalyst inferior (45% H2-yield). The presence of surface-active reducible iron oxide over 2.5Ni2.5Fe/60Mg40Al catalyst triggers pronounced CH4 decomposition, resulting in a huge carbon (inert and active) deposit (54% weight loss), which results in an inferior catalytic activity (47% H2-yield). Again, the CO2 interaction profiles of the 2.5Ni2.5Ce/60Mg40Al and 2.5Ni2.5Co/60Mg40Al catalysts are similar. The sudden interaction of lattice oxygen to the 2.5Ni2.5Ce/60Mg40Al catalyst causes the potential oxidation of coke. During 24 h on stream, the 2.5Ni2.5Ce/60Mg40Al catalyst achieves 49% H2 yield with minimal deposit of non-graphitic carbon. The 2.5Ni2.5Co/60Mg40Al catalyst system is characterized by the lowest bandgap for electron transfer and non-shading of the catalytic active sites, even with high coke deposition (weight loss of 46%). This is accomplished through the diffusion of coke far away from the active sites or by mounting the active sites over the carbon nanotubes. These surface modifications favor DRM, and the 2.5Ni2.5Ce/60Mg40Al catalyst shows a 54% H2 yield for up to 24 h in the stream test.
Supplementary Materials
The following supporting information can be downloaded at: https://www.mdpi.com/article/10.3390/nano13212874/s1, S1. The details of catalyst characterization, Figure S1: The Raman spectra of the spent-2.5Ni2.5M/60Mg40Al (M = Ce, Co, Fe, and Sr) catalyst.
Author Contributions
Y.M.A.: methodology, conceptualization, investigation, data curation, writing—original draft. N.P.: methodology, writing, formal analysis, data curation. A.H.F.: resources, formal analysis, data curation. J.A.-D.: review, data curation, validation, software, methodology, formal analysis. A.A.I.: data curation, visualization, software, methodology, formal analysis. A.E.A.: funding acquisition, data curation, conceptualization, investigation, software, methodology, formal analysis. A.A.-F.: funding acquisition, project administration, data curation, conceptualization, investigation, methodology. R.K.: data curation, Investigation, writing—review and editing. All authors have read and agreed to the published version of the manuscript.
Funding
Researchers Supporting Project number (RSP2023R368), King Saud University, Riyadh, Saudi Arabia.
Data Availability Statement
Data is contained within the article.
Acknowledgments
The authors would like to extend their sincere appreciation to Researchers Supporting Project number (RSP2023R368), King Saud University. R.K. and N.P. acknowledge Indus University, Ahmedabad, for supporting the research.
Conflicts of Interest
The authors declare that they have no known competing financial interest or personal relationships that could have appeared to influence the work reported in this paper.
References
- Ranjekar, A.M.; Yadav, G.D. Dry Reforming of Methane for Syngas Production: A Review and Assessment of Catalyst Development and Efficacy. J. Indian Chem. Soc. 2021, 98, 100002. [Google Scholar] [CrossRef]
- Shah, M.; Al Mesfer, M.K.; Danish, M. Effect of Titania Synthesis Conditions on the Catalytic Performance of Mesoporous Ni/TiO2 Catalysts for Carbon Dioxide Reforming of Methane. Int. J. Hydrogen Energy 2022, 47, 8867–8874. [Google Scholar] [CrossRef]
- Shah, M.; Bordoloi, A.; Nayak, A.K.; Mondal, P. Effect of Ti/Al Ratio on the Performance of Ni/TiO2-Al2O3 Catalyst for Methane Reforming with CO2. Fuel Process. Technol. 2019, 192, 21–35. [Google Scholar] [CrossRef]
- Taherian, Z.; Khataee, A.; Orooji, Y. Facile Synthesis of Yttria-Promoted Nickel Catalysts Supported on MgO-MCM-41 for Syngas Production from Greenhouse Gases. Renew. Sustain. Energy Rev. 2020, 134, 110130. [Google Scholar] [CrossRef]
- Jafarbegloo, M.; Tarlani, A.; Mesbah, A.W.; Muzart, J.; Sahebdelfar, S. NiO–MgO Solid Solution Prepared by Sol–Gel Method as Precursor for Ni/MgO Methane Dry Reforming Catalyst: Effect of Calcination Temperature on Catalytic Performance. Catal. Lett. 2016, 146, 238–248. [Google Scholar] [CrossRef]
- Usman, M.; Daud, W.M.A.W. An Investigation on the Influence of Catalyst Composition, Calcination and Reduction Temperatures on Ni/MgO Catalyst for Dry Reforming of Methane. RSC Adv. 2016, 6, 91603–91616. [Google Scholar] [CrossRef]
- Xu, Y.; Du, X.-H.; Li, J.; Wang, P.; Zhu, J.; Ge, F.-J.; Zhou, J.; Song, M.; Zhu, W.-Y. A comparison of Al2O3 and SiO2 supported Ni-based catalysts in their performance for the dry reforming of methane. J. Fuel Chem. Technol. 2019, 47, 199–208. [Google Scholar] [CrossRef]
- Ha, Q.L.M.; Armbruster, U.; Atia, H.; Schneider, M.; Lund, H.; Agostini, G.; Radnik, J.; Vuong, H.T.; Martin, A. Development of Active and Stable Low Nickel Content Catalysts for Dry Reforming of Methane. Catalysts 2017, 7, 157. [Google Scholar] [CrossRef]
- Guo, J.; Lou, H.; Zhao, H.; Chai, D.; Zheng, X. Dry Reforming of Methane over Nickel Catalysts Supported on Magnesium Aluminate Spinels. Appl. Catal. A Gen. 2004, 273, 75–82. [Google Scholar] [CrossRef]
- Al-Fatesh, A.S.; Naeem, M.A.; Fakeeha, A.H.; Abasaeed, A.E. CO2 Reforming of Methane to Produce Syngas over γ-Al2O3 -Supported NiSr Catalysts. Bull. Chem. Soc. Jpn. 2013, 86, 742–748. [Google Scholar] [CrossRef]
- Alipour, Z.; Rezaei, M.; Meshkani, F. Effects of Support Modifiers on the Catalytic Performance of Ni/Al2O3 Catalyst in CO2 Reforming of Methane. Fuel 2014, 129, 197–203. [Google Scholar] [CrossRef]
- Karam, L.; Armandi, M.; Casale, S.; El Khoury, V.; Bonelli, B.; Massiani, P.; El Hassan, N. Comprehensive Study on the Effect of Magnesium Loading over Nickel-Ordered Mesoporous Alumina for Dry Reforming of Methane. Energy Convers. Manag. 2020, 225, 113470. [Google Scholar] [CrossRef]
- Diyanah, R.; Yusuf, M.; Abdullah, B. Dry Reforming of Methane over Ni-Based Catalysts: Effect of ZrO2 and MgO Addition as Support. Mater. Lett. X 2021, 12, 100095. [Google Scholar] [CrossRef]
- Akiki, E.; Akiki, D.; Italiano, C.; Vita, A.; Abbas-Ghaleb, R.; Chlala, D.; Ferrante, G.D.; Laganà, M.; Pino, L.; Specchia, S. Production of Hydrogen by Methane Dry Reforming: A Study on the Effect of Cerium and Lanthanum on Ni/MgAl2O4 Catalyst Performance. Int. J. Hydrogen Energy 2020, 45, 21392–21408. [Google Scholar] [CrossRef]
- Song, Z.; Wang, Q.; Guo, C.; Li, S.; Yan, W.; Jiao, W.; Qiu, L.; Yan, X.; Li, R. Improved Effect of Fe on the Stable NiFe/Al2O3 Catalyst in Low-Temperature Dry Reforming of Methane. Ind. Eng. Chem. Res. 2020, 59, 17250–17258. [Google Scholar] [CrossRef]
- Aramouni, N.A.K.; Zeaiter, J.; Kwapinski, W.; Leahy, J.J.; Ahmad, M.N. Trimetallic Ni-Co-Ru Catalyst for the Dry Reforming of Methane: Effect of the Ni/Co Ratio and the Calcination Temperature. Fuel 2021, 300, 120950. [Google Scholar] [CrossRef]
- Thomas, J. Handbook Of Heterogeneous Catalysis. 2., Completely Revised and Enlarged Edition. Vol. 1–8. Edited by G. Ertl, H. Knözinger, F. Schüth, and J. Weitkamp. Angew. Chemie Int. Ed. 2009, 48, 3390–3391. [Google Scholar] [CrossRef]
- Liu, B.; Li, C.; Zhang, G.; Yao, X.; Chuang, S.S.C.; Li, Z. Oxygen Vacancy Promoting Dimethyl Carbonate Synthesis from CO2 and Methanol over Zr-Doped CeO2 Nanorods. ACS Catal. 2018, 8, 10446–10456. [Google Scholar] [CrossRef]
- Lin, X.; Li, S.; He, H.; Wu, Z.; Wu, J.; Chen, L.; Ye, D.; Fu, M. Evolution of Oxygen Vacancies in MnOx-CeO2 Mixed Oxides for Soot Oxidation. Appl. Catal. B Environ. 2018, 223, 91–102. [Google Scholar] [CrossRef]
- De Waal, D.; Range, K.J.; Königstein, M.; Kiefer, W. Raman Spectra of the Barium Oxide Peroxide and Strontium Oxide Peroxide Series. J. Raman Spectrosc. 1998, 29, 109–113. [Google Scholar] [CrossRef]
- Chen, M.; Li, H.; Wu, C.; Liang, Y.; Qi, J.; Li, J.; Shangguan, E.; Zhang, W.; Cao, R. Interfacial Engineering of Heterostructured Co(OH)2/NiPx Nanosheets for Enhanced Oxygen Evolution Reaction. Adv. Funct. Mater. 2022, 32, 2206407. [Google Scholar] [CrossRef]
- Yang, J.; Liu, H.; Martens, W.N.; Frost, R.L. Synthesis and Characterization of Cobalt Hydroxide, Cobalt Oxyhydroxide, and Cobalt Oxide Nanodiscs. J. Phys. Chem. C 2010, 114, 111–119. [Google Scholar] [CrossRef]
- Fujioka, Y.; Frantti, J.; Puretzky, A.; King, G. Raman Study of the Structural Distortion in the Ni1-XCoxTiO3 Solid Solution. Inorg. Chem. 2016, 55, 9436–9444. [Google Scholar] [CrossRef]
- Choi, H.C.; Jung, Y.M.; Noda, I.; Kim, S. Bin A Study of the Mechanism of the Electrochemical Reaction of Lithium with CoO by Two-Dimensional Soft X-Ray Absorption Spectroscopy (2D XAS), 2D Raman, and 2D Heterospectral XAS-Raman Correlation Analysis. J. Phys. Chem. B 2003, 107, 5806–5811. [Google Scholar] [CrossRef]
- Rauwel, E.; Al-Arag, S.; Salehi, H.; Amorim, C.O.; Cuisinier, F.; Guha, M.; Rosario, M.S.; Rauwel, P. Assessing Cobalt Metal Nanoparticles Uptake by Cancer Cells Using Live Raman Spectroscopy. Int. J. Nanomed. 2020, 15, 7051–7062. [Google Scholar] [CrossRef]
- Bøckman, O.; Østvold, T.; Voyiatzis, G.A.; Papatheodorou, G.N. Raman Spectroscopy of Cemented Cobalt on Zinc Substrates. Hydrometallurgy 2000, 55, 93–105. [Google Scholar] [CrossRef]
- Shim, S.H.; Duffy, T.S. Raman Spectroscopy of Fe2O3 to 62 GPa. Am. Miner. 2002, 87, 318–326. [Google Scholar] [CrossRef]
- Miljanić, S.; Frkanec, L.; Biljan, T.; Žinić, Z.M.M. Recent Advances in Linear and Nonlinear Raman Spectroscopy I. J. Raman Spectrosc. 2007, 38, 1538–1553. [Google Scholar]
- Gobara, H.M. Characterization and catalytic activity of NiO/mesoporous aluminosilicate AlSBA-15 in conversion of some hydrocarbons. Egypt. J. Pet. 2012, 21, 1–10. [Google Scholar] [CrossRef]
- Al-Fatesh, A.S.; Patel, N.; Srivastava, V.; Osman, A.I.; Rooney, D.W.; Fakeeha, A.H.; Abasaeed, A.E.; Alotibi, M.F.; Kumar, R. Iron-Promoted Zirconia-Alumina Supported Ni Catalyst for Highly Efficient and Cost-Effective Hydrogen Production via Dry Reforming of Methane. J. Environ. Sci. 2023. [Google Scholar] [CrossRef]
- Al-Fatesh, A.S.; Kumar, R.; Fakeeha, A.H.; Kasim, S.O.; Khatri, J.; Ibrahim, A.A.; Arasheed, R.; Alabdulsalam, M.; Lanre, M.S.; Osman, A.I.; et al. Promotional Effect of Magnesium Oxide for a Stable Nickel-Based Catalyst in Dry Reforming of Methane. Sci. Rep. 2020, 10, 13861. [Google Scholar] [CrossRef] [PubMed]
- Ay, H.; Üner, D. Dry Reforming of Methane over CeO2 Supported Ni, Co and Ni-Co Catalysts. Appl. Catal. B Environ. 2015, 179, 128–138. [Google Scholar] [CrossRef]
- Charisiou, N.D.; Tzounis, L.; Sebastian, V.; Hinder, S.J.; Baker, M.A.; Polychronopoulou, K.; Goula, M.A. Investigating the Correlation between Deactivation and the Carbon Deposited on the Surface of Ni/Al2O3 and Ni/La2O3-Al2O3 Catalysts during the Biogas Reforming Reaction. Appl. Surf. Sci. 2019, 474, 42–56. [Google Scholar] [CrossRef]
- Pan, B.; Xiao, J.; Li, J.; Liu, P.; Wang, C.; Yang, G. Materials: Carbyne with Finite Length: The One-Dimensional Sp Carbon. Sci. Adv. 2015, 1, e1500857. [Google Scholar] [CrossRef]
- Mashayekhi, F. The Effects of Molar Ratio and Calcination Temperature on NiO Nanoparticles’ Properties. Int. Nano Lett. 2022, 12, 273–279. [Google Scholar] [CrossRef]
- Silva, V.D.; Nascimento, E.P.; Grilo, J.P.F.; Simões, T.A.; Menezes, R.R.; Macedo, D.A.; Medeiros, E.S. Effect of Two-Step Calcination on the Formation of Nickel Oxide Hollow Nanofibers. Open Ceram. 2021, 5, 100087. [Google Scholar] [CrossRef]
- Al-Fatesh, A.S.; Arafat, Y.; Kasim, S.O.; Ibrahim, A.A.; Abasaeed, A.E.; Fakeeha, A.H. In Situ Auto-Gasification of Coke Deposits over a Novel Ni-Ce/W-Zr Catalyst by Sequential Generation of Oxygen Vacancies for Remarkably Stable Syngas Production via CO2-Reforming of Methane. Appl. Catal. B Environ. 2021, 280, 119445. [Google Scholar] [CrossRef]
- Patel, R.; Al-Fatesh, A.S.; Fakeeha, A.H.; Arafat, Y.; Kasim, S.O.; Ibrahim, A.A.; Al-Zahrani, S.A.; Abasaeed, A.E.; Srivastava, V.K.; Kumar, R. Impact of Ceria over WO3–ZrO2 Supported Ni Catalyst towards Hydrogen Production through Dry Reforming of Methane. Int. J. Hydrogen Energy 2021, 46, 25015–25028. [Google Scholar] [CrossRef]
- Koolen, C.D.; Luo, W.; Züttel, A. From Single Crystal to Single Atom Catalysts: Structural Factors Influencing the Performance of Metal Catalysts for CO2 Electroreduction. ACS Catal. 2023, 13, 948–973. [Google Scholar] [CrossRef]
- Zhang, J.; Pham, T.H.M.; Ko, Y.; Li, M.; Yang, S.; Koolen, C.D.; Zhong, L.; Luo, W.; Züttel, A. Tandem Effect of Ag@C@Cu Catalysts Enhances Ethanol Selectivity for Electrochemical CO2 Reduction in Flow Reactors. Cell Rep. Phys. Sci. 2022, 3, 100949. [Google Scholar] [CrossRef]
- Zhang, C.; Niu, J.; Guo, Z.; Liu, H.; Jin, Y.; Ran, J. Effects of Cu Ratios on the C1–C6 Growth Mechanism on Copper–Nickel Bimetallic Surfaces. Phys. Chem. Chem. Phys. 2023, 25, 18322–18331. [Google Scholar] [CrossRef] [PubMed]
- Chen, P.; Zhang, H.B.; Lin, G.D.; Hong, Q.; Tsai, K.R. Growth of carbon nanotubes by catalytic decomposition of CH4 or CO on a Ni-MgO catalyst. Carbon 1997, 35, 1495–1501. [Google Scholar] [CrossRef]


Disclaimer/Publisher’s Note: The statements, opinions and data contained in all publications are solely those of the individual author(s) and contributor(s) and not of MDPI and/or the editor(s). MDPI and/or the editor(s) disclaim responsibility for any injury to people or property resulting from any ideas, methods, instructions or products referred to in the content. |
© 2023 by the authors. Licensee MDPI, Basel, Switzerland. This article is an open access article distributed under the terms and conditions of the Creative Commons Attribution (CC BY) license (https://creativecommons.org/licenses/by/4.0/).