
The Janus Structure of Graphene Oxide and Its Large-Size Conductive Film Strip Pattern


Abstract
:1. Introduction
2. Experimental Methods
2.1. Materials
2.2. Preparation of Graphene Oxide
2.3. janus-GO Experimental Tests
2.4. MS Simulation of janus-GO
2.5. Preparation of Conductive Films
2.6. Secondary Reduced Graphene Films
2.7. Characterization of Conductive Film
3. Results and Discussion
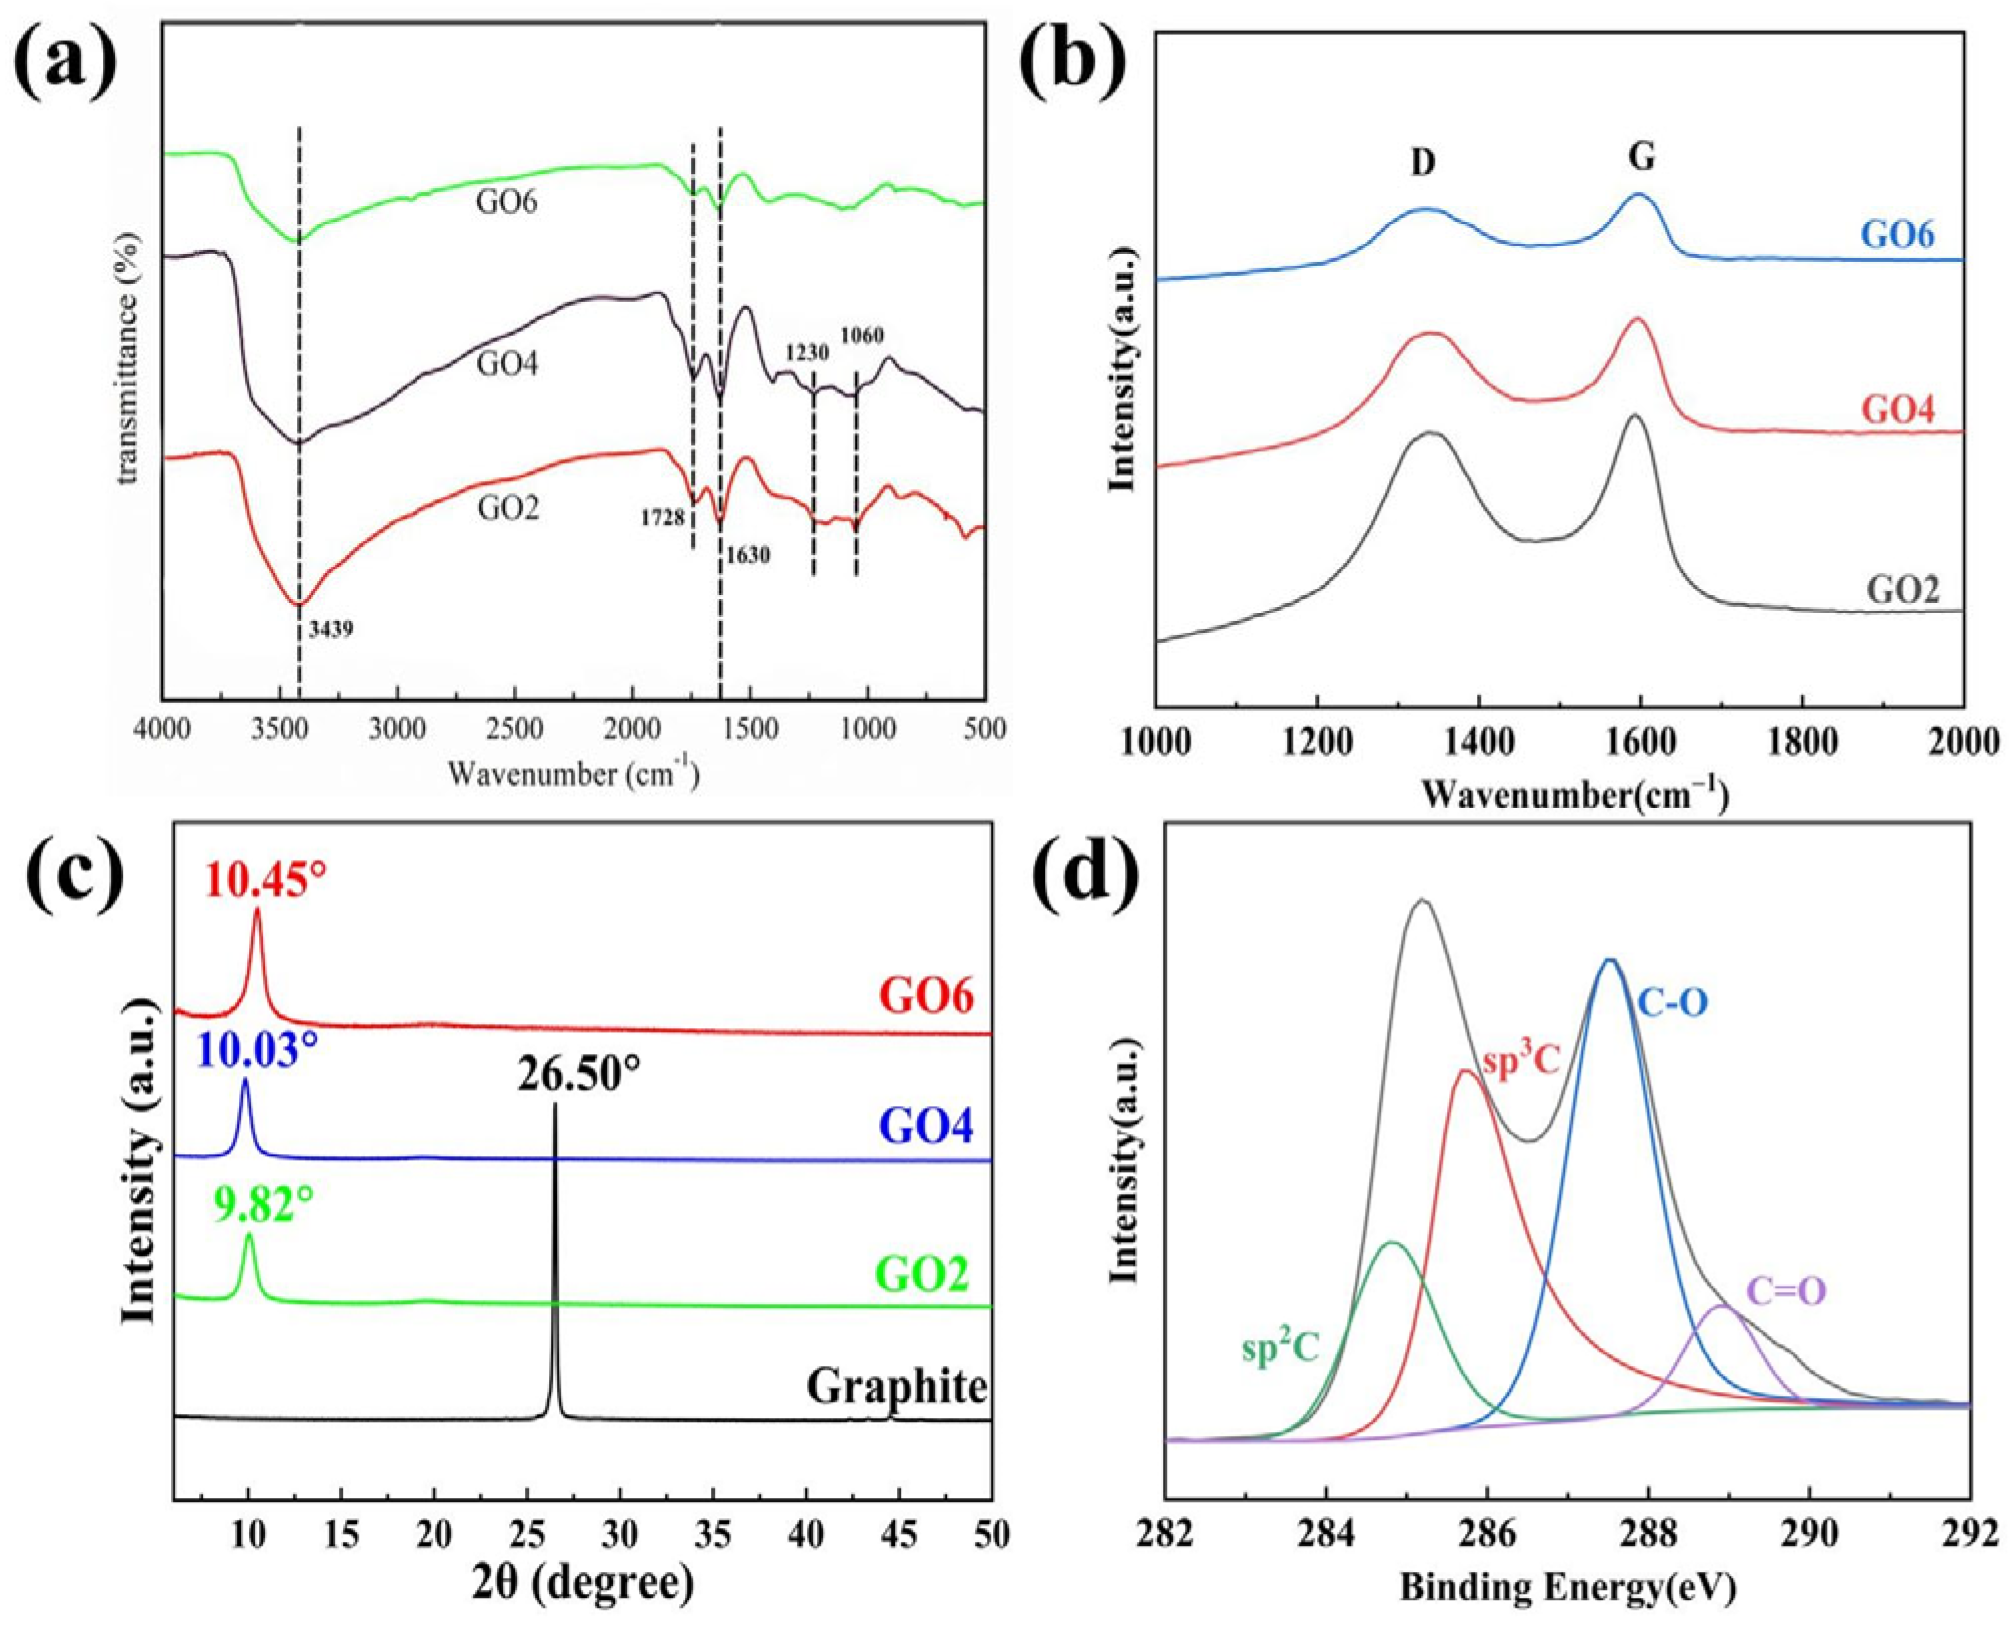
3.1. GO Preparation and Characterisation Studies
3.1.1. Improvement of the GO Preparation Process
3.1.2. GO Stripping Mechanism and Janus Structure Study
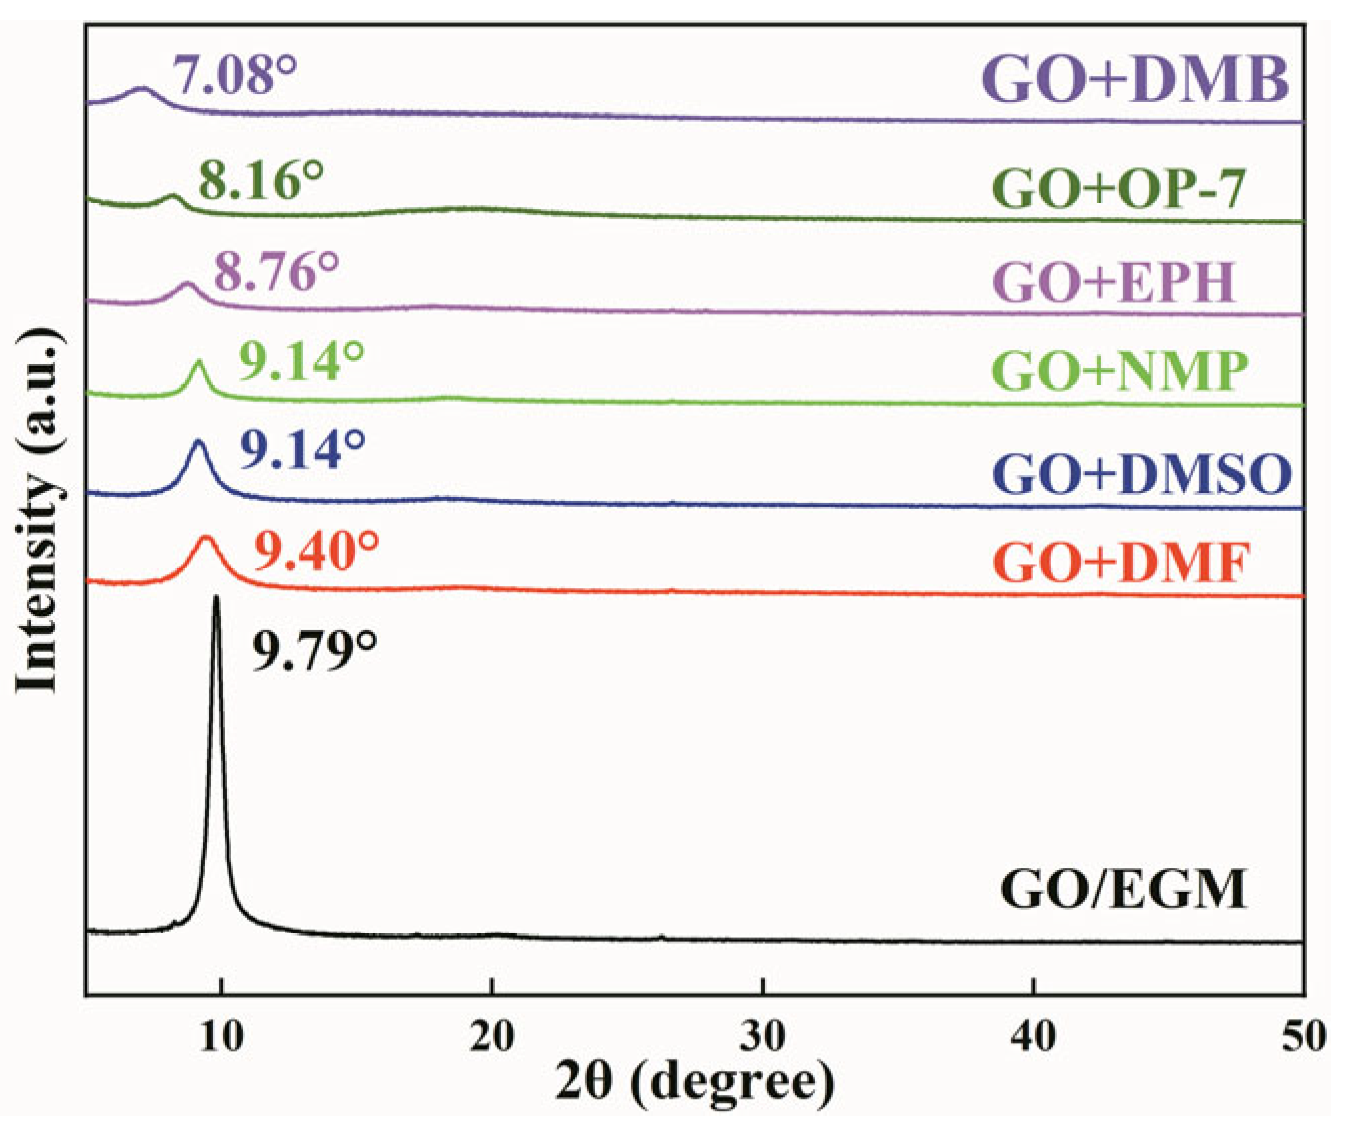
3.1.3. Effect of Different Solutions on janus-GO Layer Spacing
3.2. Self-Assembly Studies of janus-GO in Different Solutions
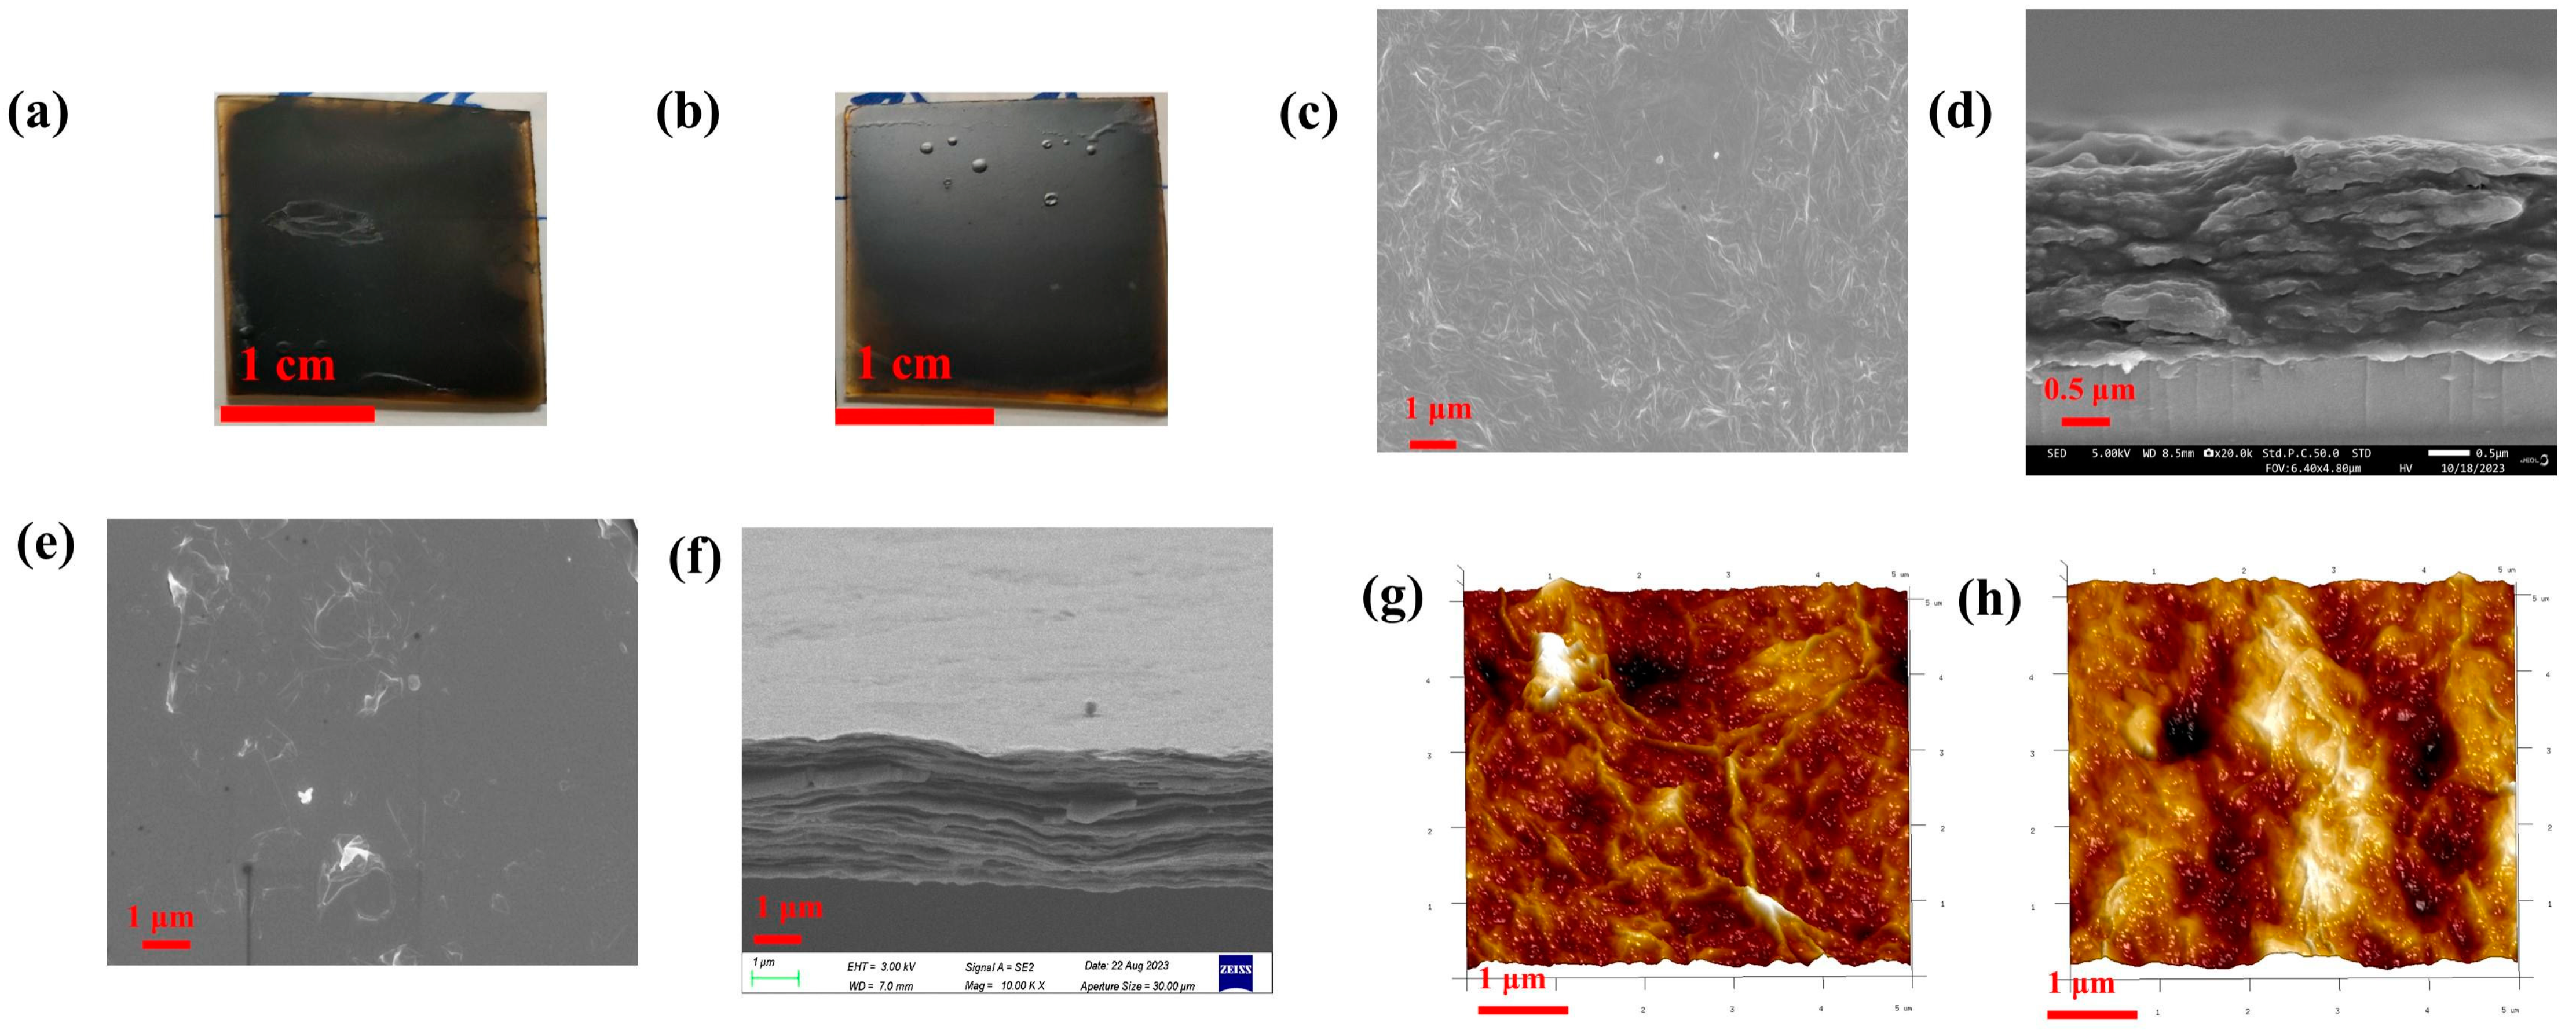
3.3. Preparation and Structural Characterisation of Conductive Thin Films Based on Benzyl Alcohol Solution
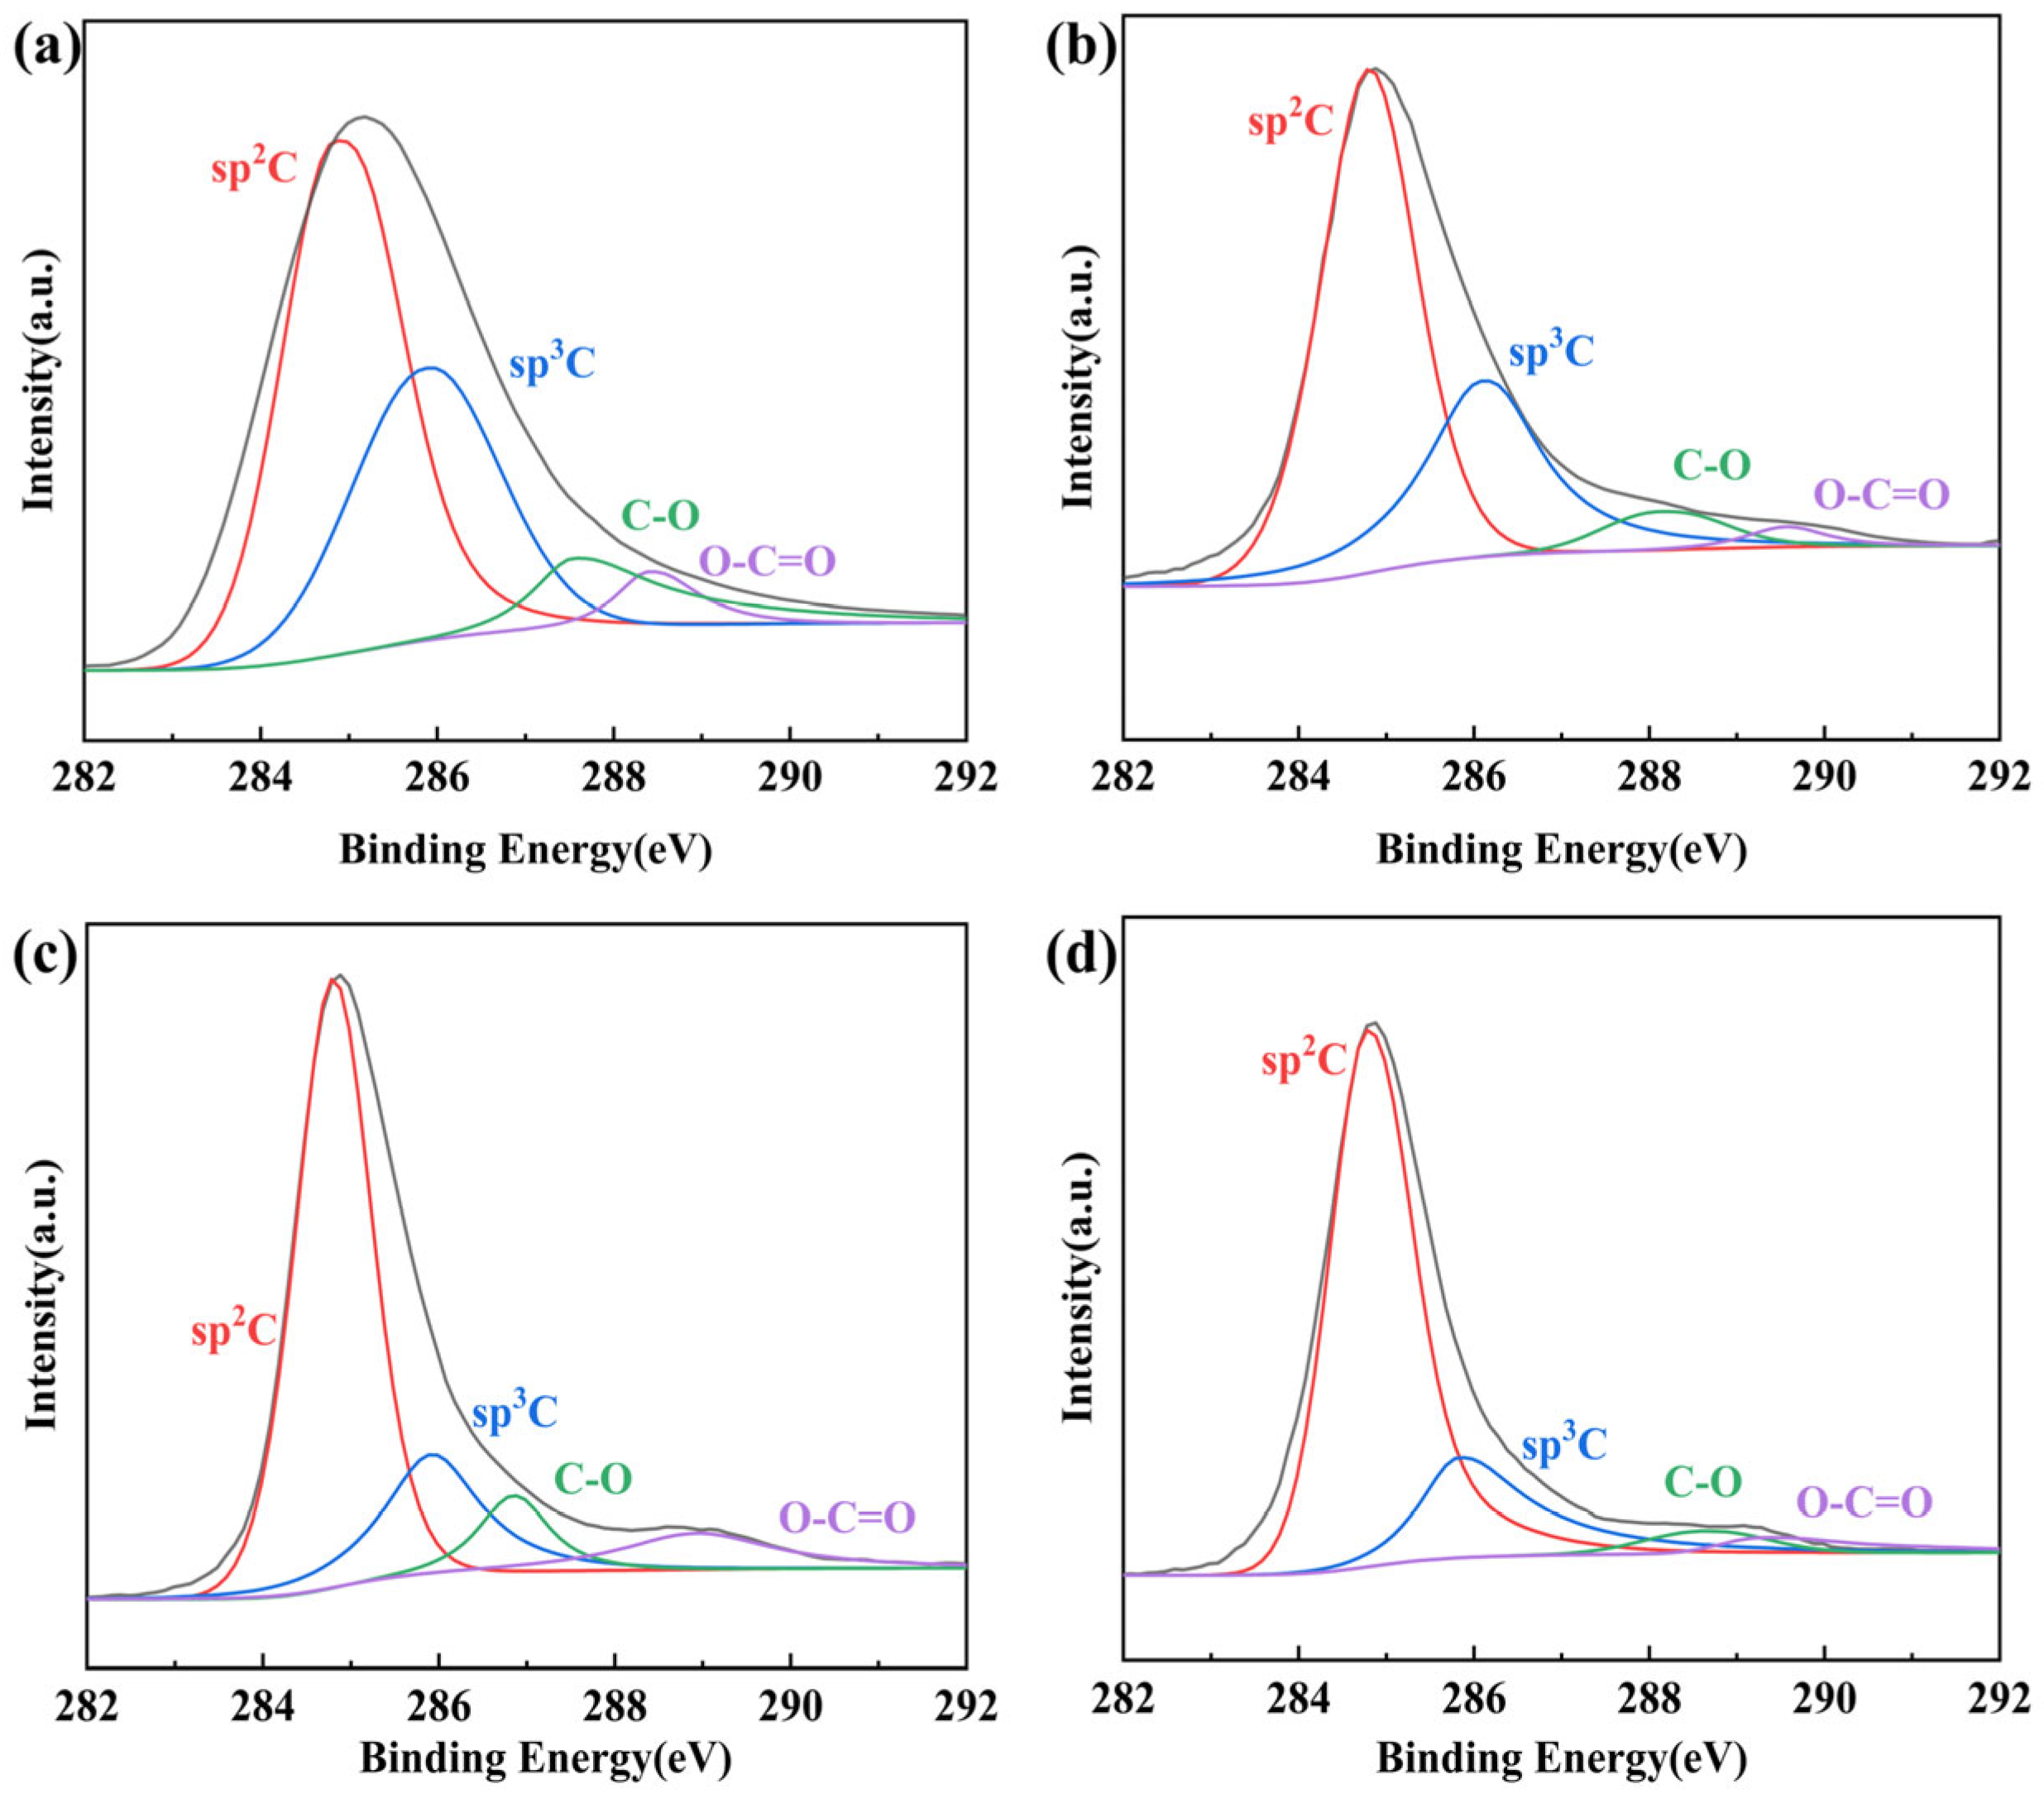
3.3.1. Primary Reduction
3.3.2. Secondary Reduction
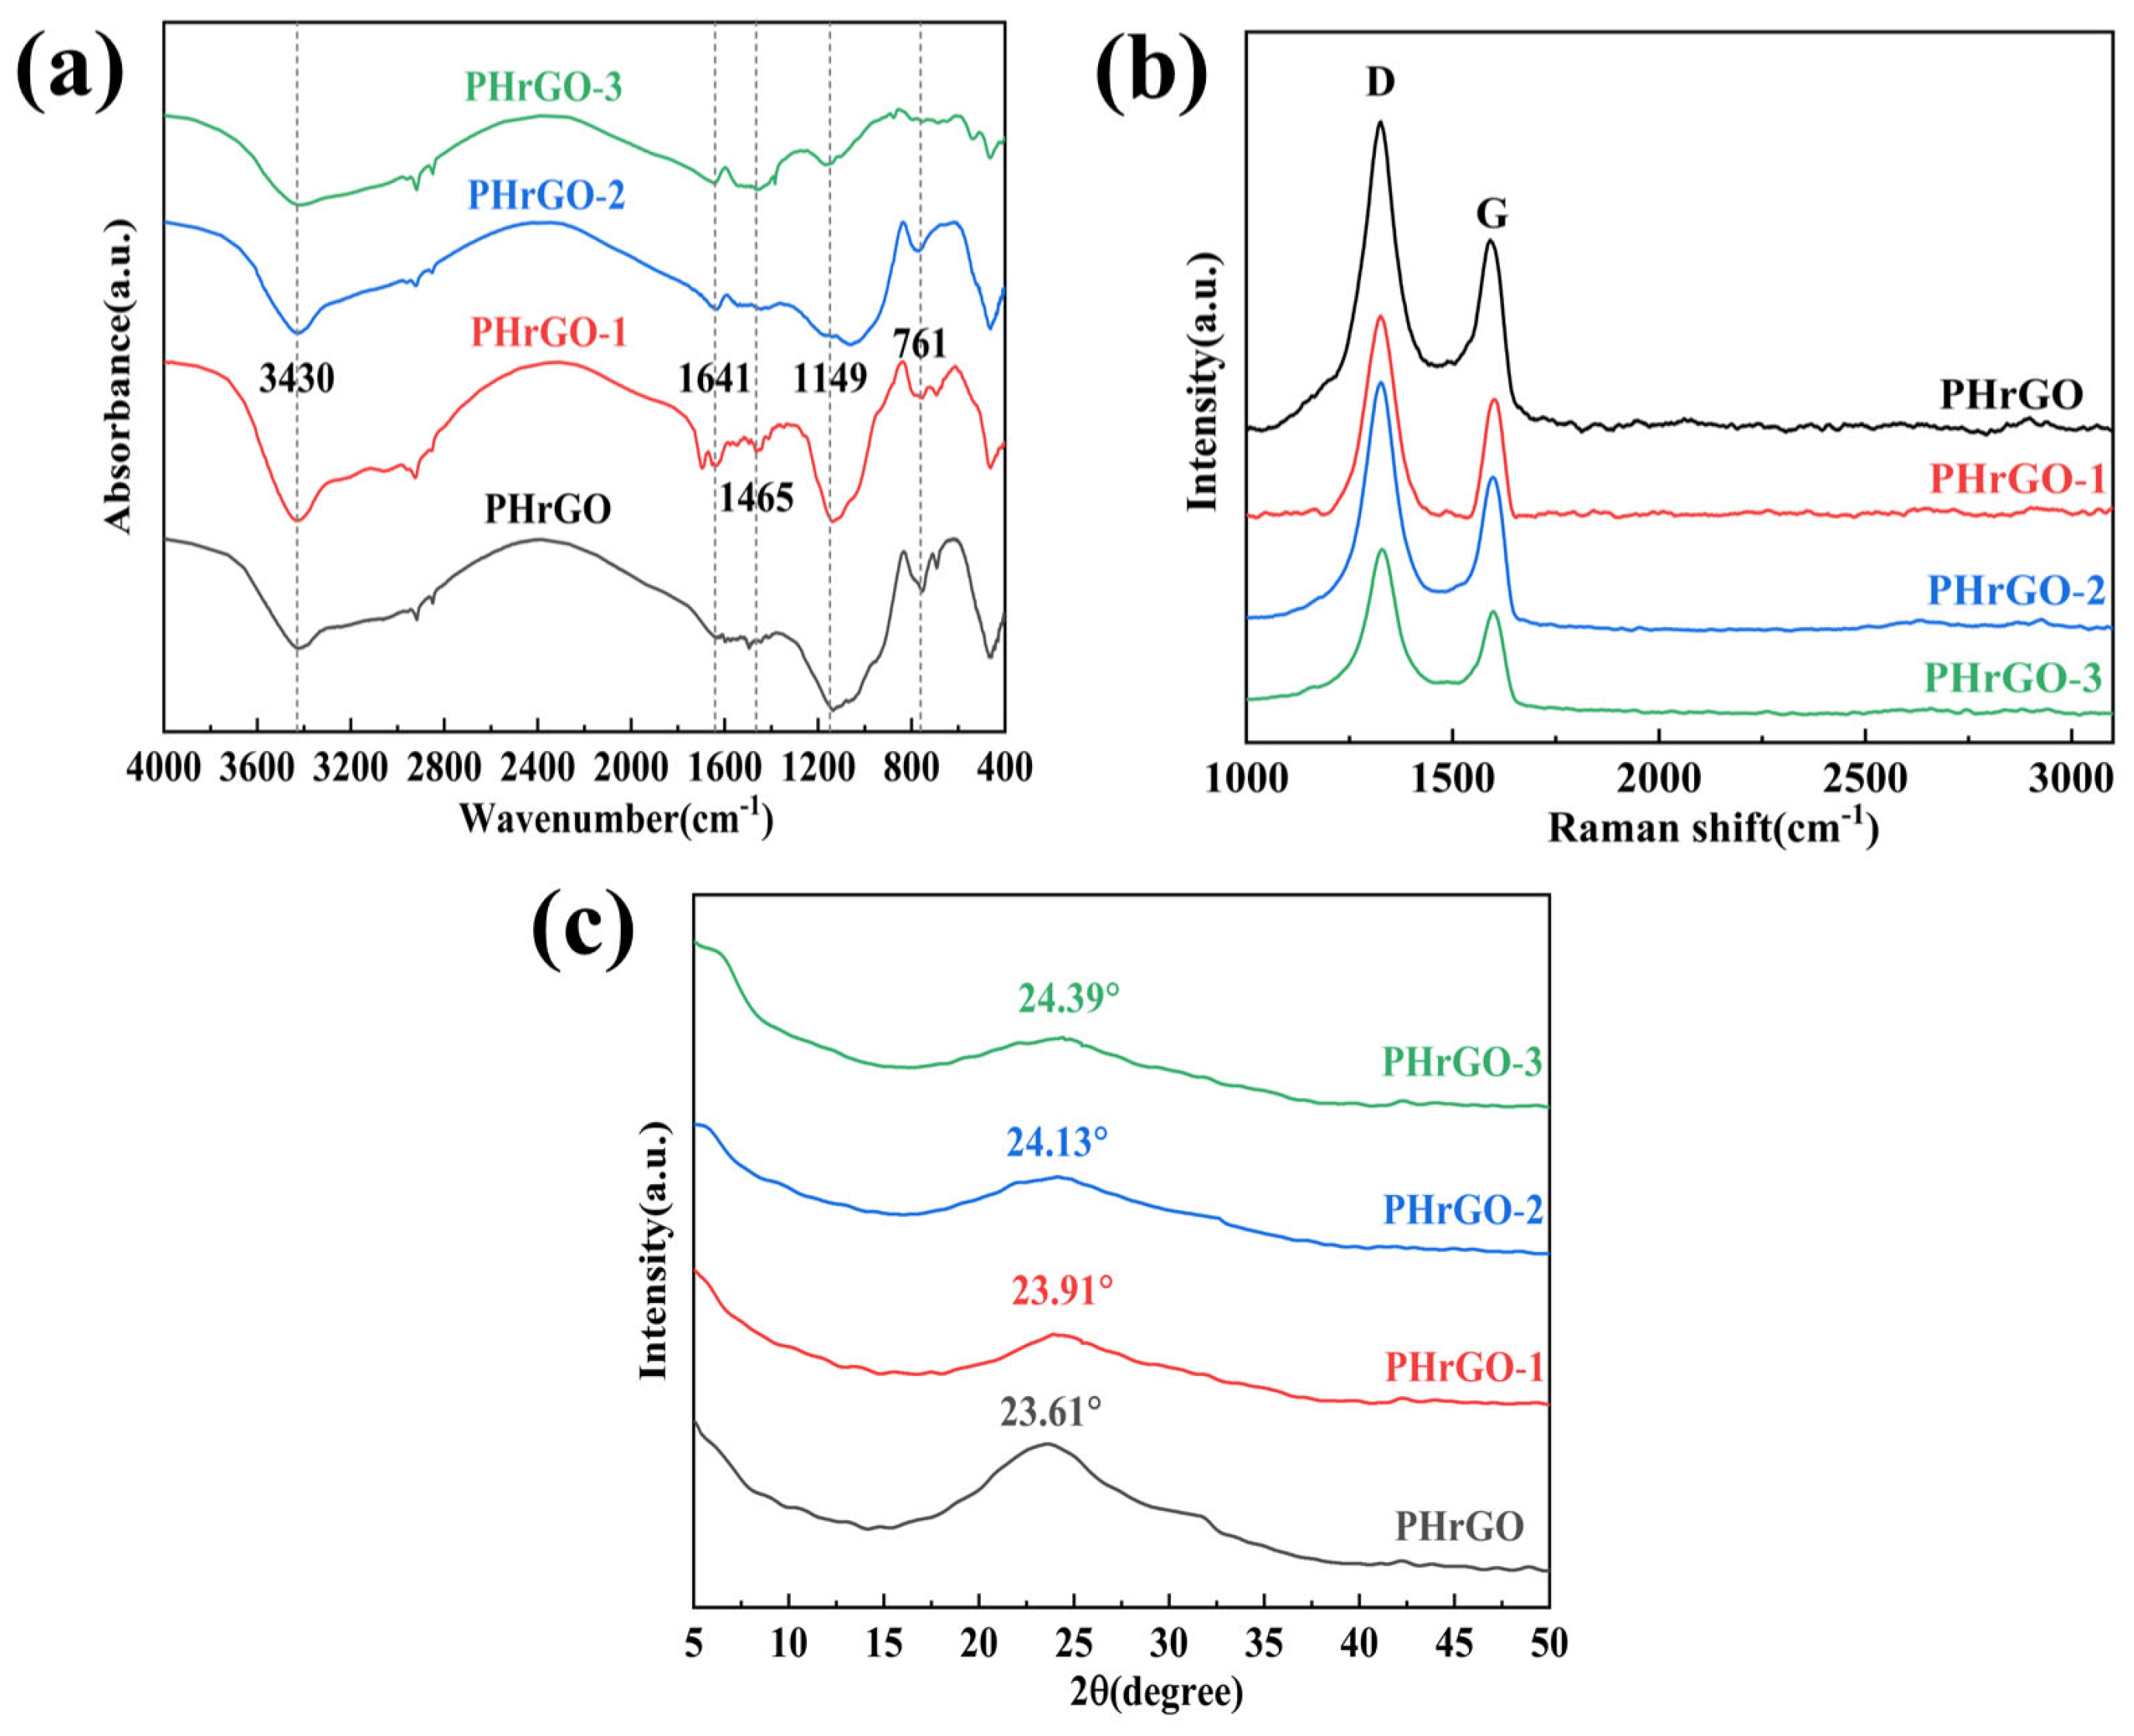
Conductive Films Prepared with Phenylhydrazine (PHrGO)
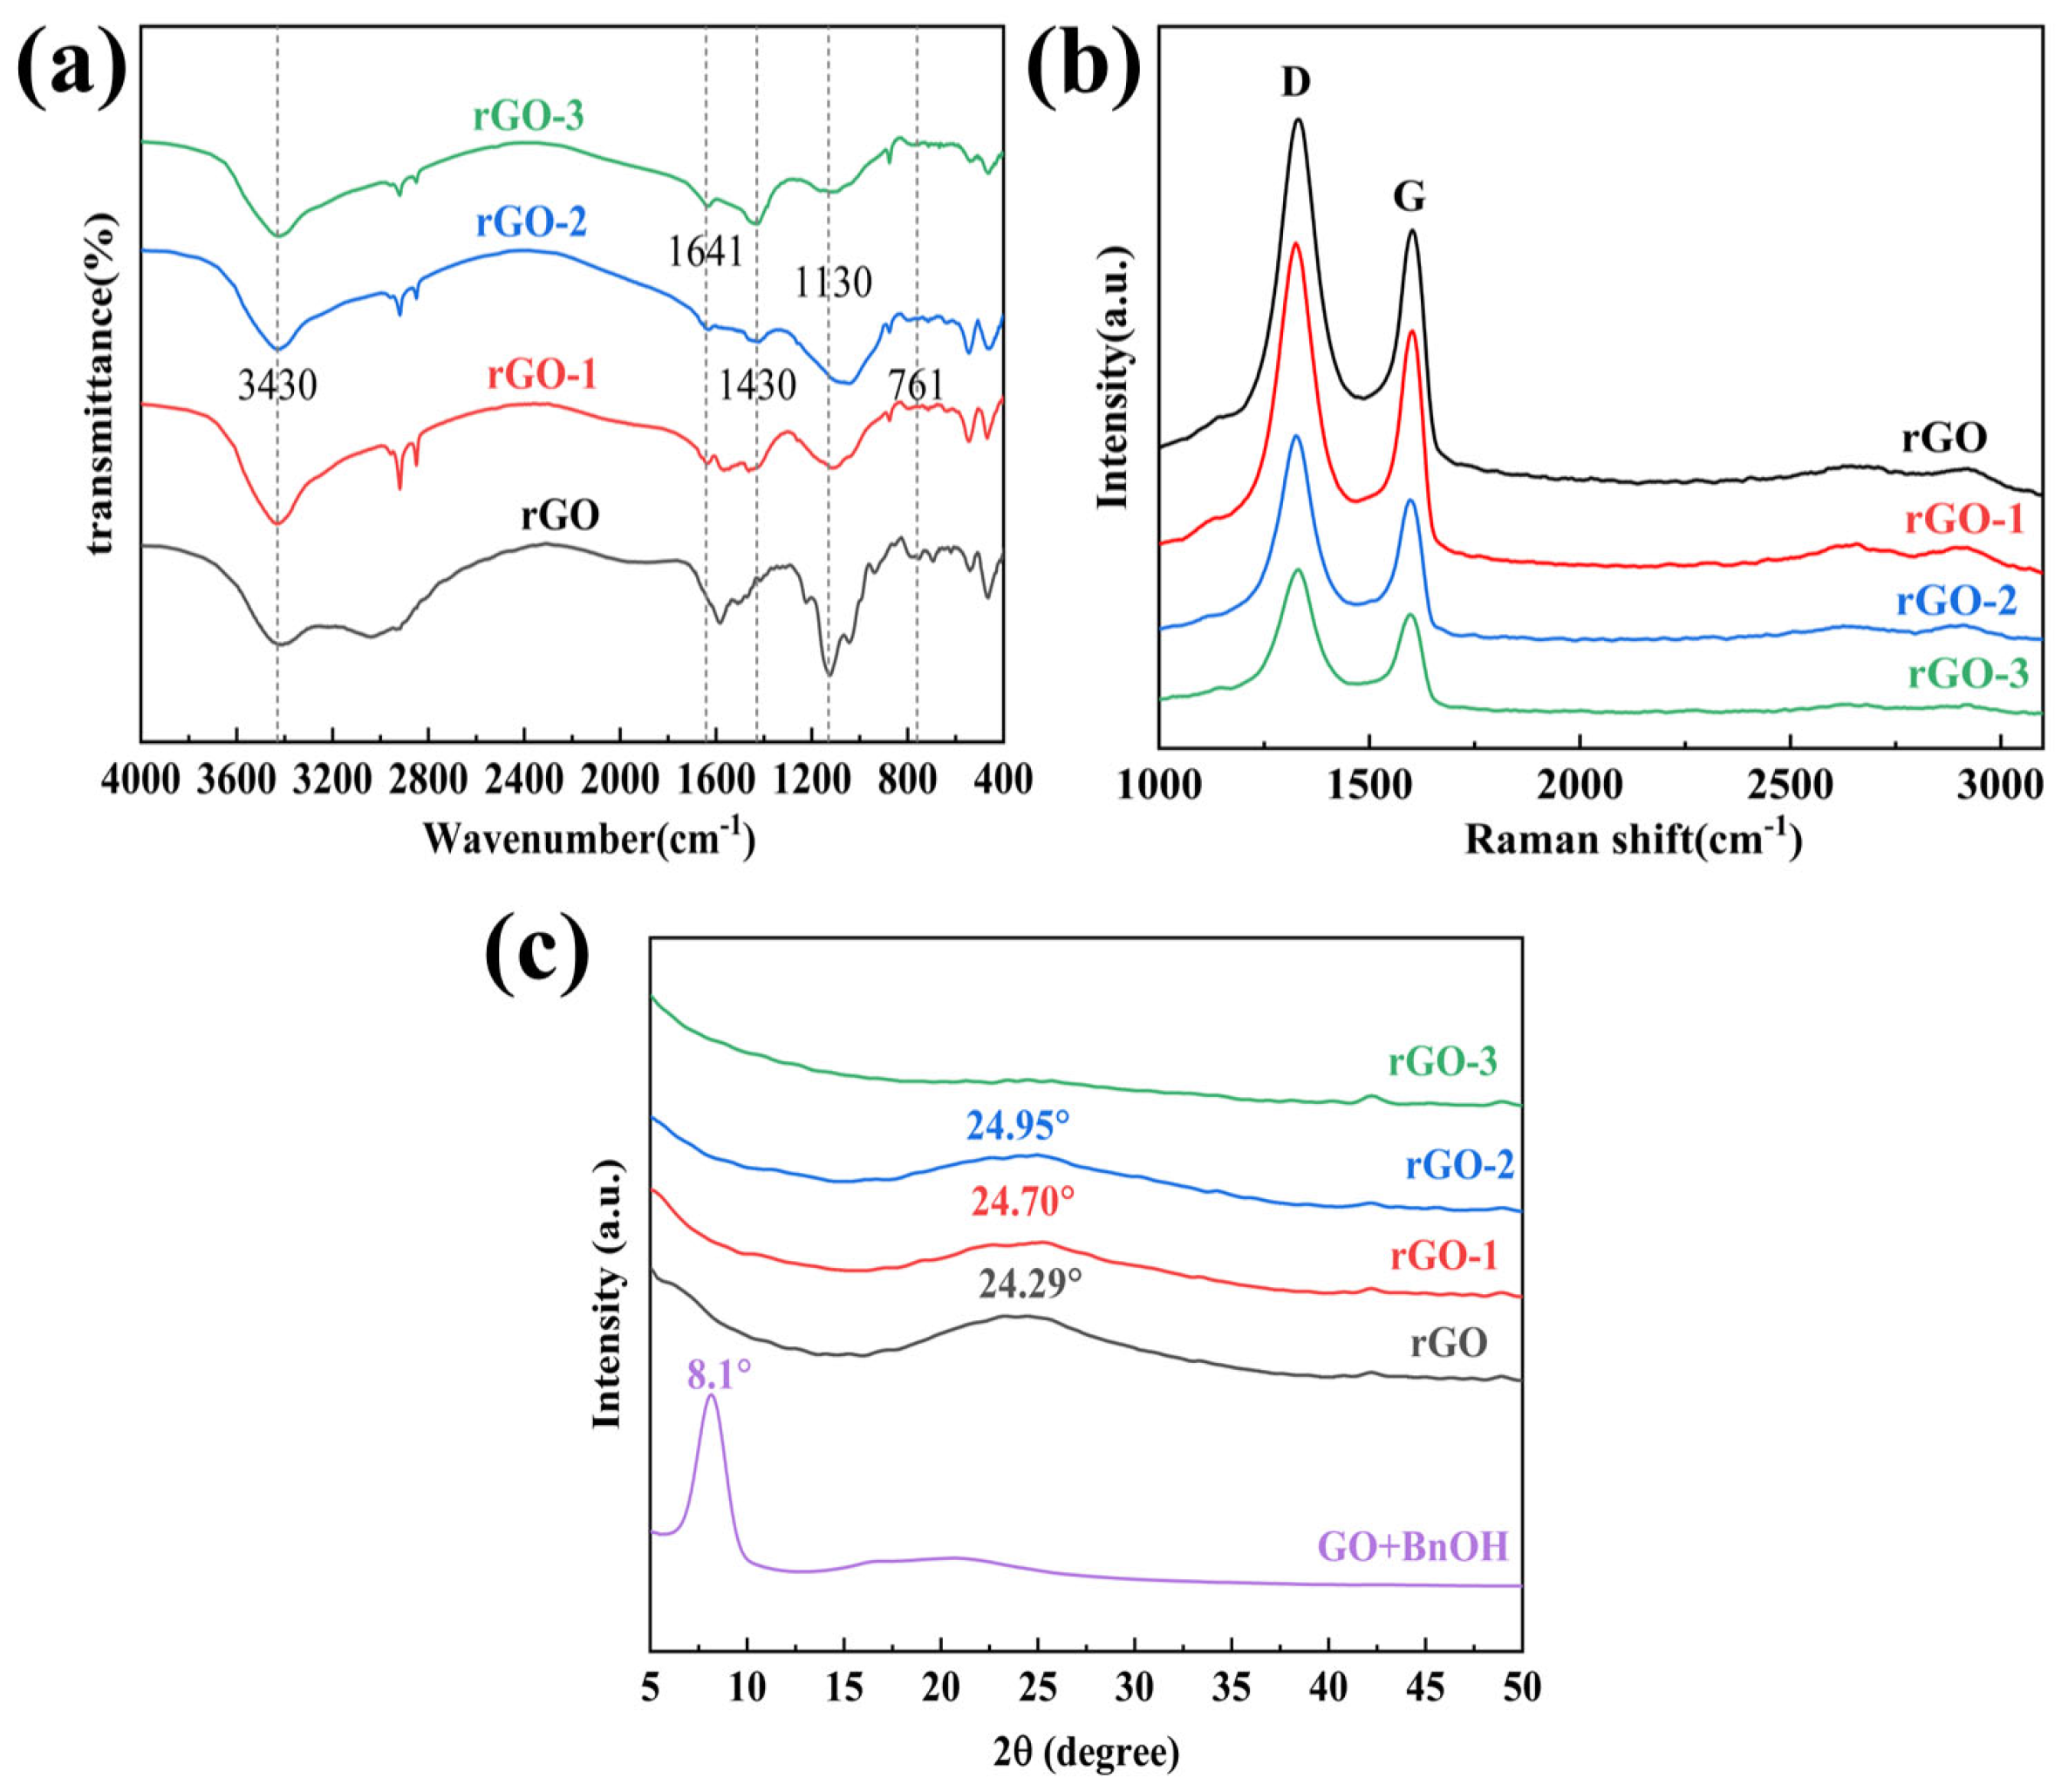
Conductive Films Prepared with Hydrazine Hydrate (rGO)
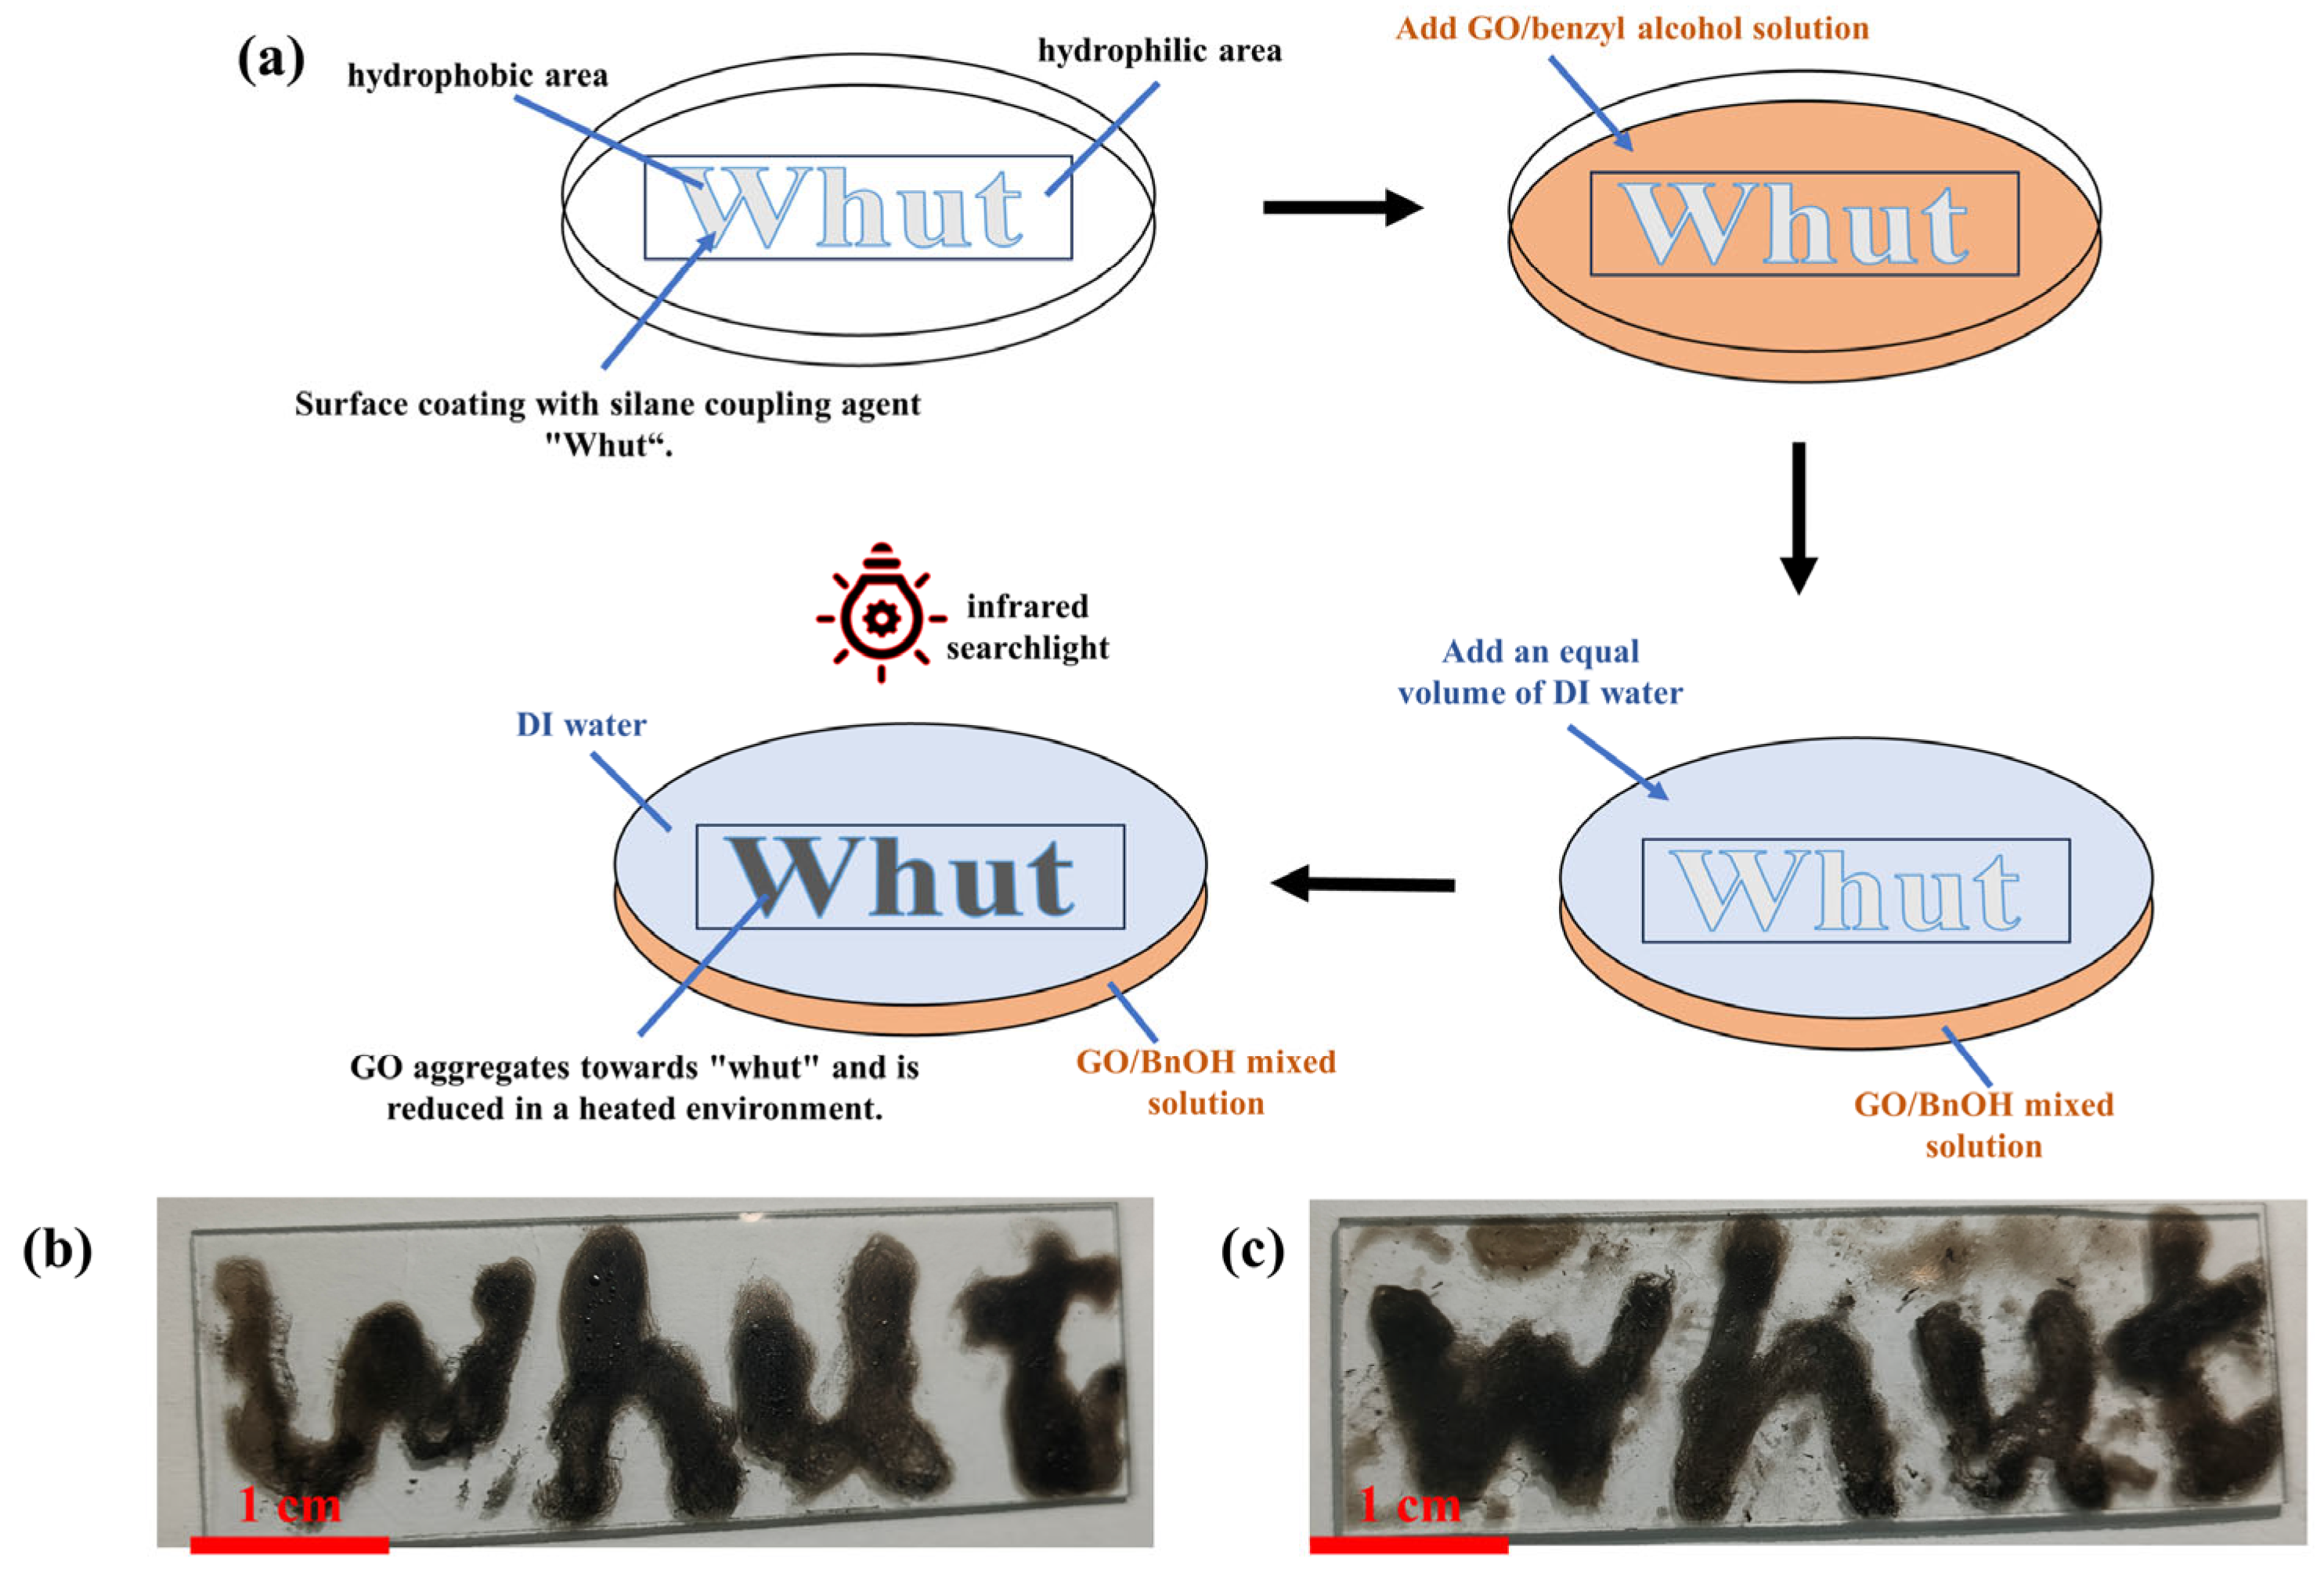
3.3.3. Reduced Graphene Oxide Patterns
4. Conclusions
Supplementary Materials
Author Contributions
Funding
Data Availability Statement
Conflicts of Interest
References
- Sun, C.; Wen, B.; Bai, B. Recent Advances in Nanoporous Graphene Membrane for Gas Separation and Water Purification. Sci. Bull. 2015, 60, 1807–1823. [Google Scholar] [CrossRef]
- Geim, A.K.; Novoselov, K.S. The Rise of Graphene. Nat. Mater. 2007, 6, 183–191. [Google Scholar] [CrossRef]
- Pumera, M. Graphene in Biosensing. Mater. Today 2011, 14, 308–315. [Google Scholar] [CrossRef]
- Bunch, J.S.; Verbridge, S.S.; Alden, J.S.; van der Zande, A.M.; Parpia, J.M.; Craighead, H.G.; McEuen, P.L. Impermeable Atomic Membranes from Graphene Sheets. Nano Lett. 2008, 8, 2458–2462. [Google Scholar] [CrossRef]
- Marconcini, P.; Cresti, A.; Roche, S. Effect of the Channel Length on the Transport Characteristics of Transistors Based on Boron-Doped Graphene Ribbons. Materials 2018, 11, 667. [Google Scholar] [CrossRef]
- Schwierz, F. Graphene Transistors. Nat. Nanotechnol. 2010, 5, 487–496. [Google Scholar] [CrossRef] [PubMed]
- Vacacela Gomez, C.; Guevara, M.; Tene, T.; Villamagua, L.; Usca, G.T.; Maldonado, F.; Tapia, C.; Cataldo, A.; Bellucci, S.; Caputi, L.S. The Liquid Exfoliation of Graphene in Polar Solvents. Appl. Surf. Sci. 2021, 546, 149046. [Google Scholar] [CrossRef]
- Tan, H.; Navik, R.; Liu, Z.; Xiang, Q.; Zhao, Y. Scalable Massive Production of Defect-Free Few-Layer Graphene by Ball-Milling in Series with Shearing Exfoliation in Supercritical CO2. J. Supercrit. Fluids 2022, 181, 105496. [Google Scholar] [CrossRef]
- Khanam, Z.; Liu, J.; Song, S. High-Concentration Graphene Dispersions Prepared via Exfoliation of Graphite in PVA/H2O Green Solvent System Using High-Shear Forces. J. Nanopart. Res. 2021, 23, 170. [Google Scholar] [CrossRef]
- Large, M.J.; Ogilvie, S.P.; Amorim Graf, A.; Lynch, P.J.; O’Mara, M.A.; Waters, T.; Jurewicz, I.; Salvage, J.P.; Dalton, A.B. Large-Scale Surfactant Exfoliation of Graphene and Conductivity-Optimized Graphite Enabling Wireless Connectivity. Adv. Mater. Technol. 2020, 5, 2000284. [Google Scholar] [CrossRef]
- Zhang, N.; Zhang, Y.; Duan, C.; Li, S.; Yang, Z.; Zhang, X.; Wang, T.; Wang, Q. Supercritical CO2-Assisted Microfluidization as Ultra-High Efficiency Strategy for Graphene Preparation. J. Mater. Sci. 2021, 56, 15653–15666. [Google Scholar] [CrossRef]
- Edison, T.N.J.I.; Atchudan, R.; Karthik, N.; Chandrasekaran, P.; Perumal, S.; Arunachalam, P.; Raja, P.B.; Sethuraman, M.G.; Lee, Y.R. Electrochemically Exfoliated Graphene Sheets as Electrode Material for Aqueous Symmetric Supercapacitors. Surf. Coat. Technol. 2021, 416, 127150. [Google Scholar] [CrossRef]
- Pedrazzetti, L.; Gibertini, E.; Bizzoni, F.; Russo, V.; Lucotti, A.; Nobili, L.; Magagnin, L. Graphene Growth on Electroformed Copper Substrates by Atmospheric Pressure CVD. Materials 2022, 15, 1572. [Google Scholar] [CrossRef] [PubMed]
- Sun, L.; Chen, B.; Wang, W.; Li, Y.; Zeng, X.; Liu, H.; Liang, Y.; Zhao, Z.; Cai, A.; Zhang, R.; et al. Toward Epitaxial Growth of Misorientation-Free Graphene on Cu(111) Foils. ACS Nano 2022, 16, 285–294. [Google Scholar] [CrossRef] [PubMed]
- Cai, X.; Wen, S.; Lv, B.; Dou, W.-D. Vertical-Graphene-Assisted Chemical Vapor Deposition for Fast Growth of Macroscaled Graphene Grains. J. Phys. Chem. C 2023, 127, 6991–6997. [Google Scholar] [CrossRef]
- Kuang, B.; Song, W.; Ning, M.; Li, J.; Zhao, Z.; Guo, D.; Cao, M.; Jin, H. Chemical Reduction Dependent Dielectric Properties and Dielectric Loss Mechanism of Reduced Graphene Oxide. Carbon 2018, 127, 209–217. [Google Scholar] [CrossRef]
- Jiang, X.; Wang, J.; Zhou, B. A Two-Step Chemical-Hydrothermal Reduction Method to Prepare Reduced Graphene Oxide with High Electrical Conductivity. Diam. Relat. Mater. 2022, 130, 109437. [Google Scholar] [CrossRef]
- Zhang, P.; Li, Z.; Zhang, S.; Shao, G. Recent Advances in Effective Reduction of Graphene Oxide for Highly Improved Performance Toward Electrochemical Energy Storage. Energy Environ. Mater. 2018, 1, 5–12. [Google Scholar] [CrossRef]
- Hu, J.; Kong, G.; Zhu, Y.; Che, C. Ultrafast Room-Temperature Reduction of Graphene Oxide by Sodium Borohydride, Sodium Molybdate and Hydrochloric Acid. Chin. Chem. Lett. 2021, 32, 543–547. [Google Scholar] [CrossRef]
- Zhang, J.; Yang, H.; Shen, G.; Cheng, P.; Zhang, J.; Guo, S. Reduction of Graphene Oxide via l-Ascorbic Acid. Chem. Commun. 2010, 46, 1112–1114. [Google Scholar] [CrossRef]
- Brodie, B.C., XIII. On the Atomic Weight of Graphite. Philos. Trans. R. Soc. Lond. 1997, 149, 249–259. [Google Scholar] [CrossRef]
- Staudenmaier, L. Verfahren Zur Darstellung Der Graphitsäure. Berichte Dtsch. Chem. Ges. 1898, 31, 1481–1487. [Google Scholar] [CrossRef]
- Hummers, W.S., Jr.; Offeman, R.E. Preparation of Graphitic Oxide. J. Am. Chem. Soc. 1958, 80, 1339. [Google Scholar] [CrossRef]
- Guex, L.G.; Sacchi, B.; Peuvot, K.F.; Andersson, R.L.; Pourrahimi, A.M.; Ström, V.; Farris, S.; Olsson, R.T. Experimental Review: Chemical Reduction of Graphene Oxide (GO) to Reduced Graphene Oxide (rGO) by Aqueous Chemistry. Nanoscale 2017, 9, 9562–9571. [Google Scholar] [CrossRef] [PubMed]
- Wang, R.; Wang, Y.; Xu, C.; Sun, J.; Gao, L. Facile One-Step Hydrazine-Assisted Solvothermal Synthesis of Nitrogen-Doped Reduced Graphene Oxide: Reduction Effect and Mechanisms. RSC Adv. 2013, 3, 1194–1200. [Google Scholar] [CrossRef]
- Tung, V.C.; Allen, M.J.; Yang, Y.; Kaner, R.B. High-Throughput Solution Processing of Large-Scale Graphene. Nat. Nanotechnol. 2009, 4, 25–29. [Google Scholar] [CrossRef] [PubMed]
- Bhuyan, M.S.A.; Uddin, M.N.; Islam, M.M.; Bipasha, F.A.; Hossain, S.S. Synthesis of Graphene. Int. Nano Lett. 2016, 6, 65–83. [Google Scholar] [CrossRef]
- Pei, S.; Cheng, H.-M. The Reduction of Graphene Oxide. Carbon 2012, 50, 3210–3228. [Google Scholar] [CrossRef]
- Cherian, R.S.; Sandeman, S.; Ray, S.; Savina, I.N.; Ashtami, J.; Mohanan, P.V. Green Synthesis of Pluronic Stabilized Reduced Graphene Oxide: Chemical and Biological Characterization. Colloids Surf. B Biointerfaces 2019, 179, 94–106. [Google Scholar] [CrossRef]
- Peng, L.; Xu, Z.; Liu, Z.; Wei, Y.; Sun, H.; Li, Z.; Zhao, X.; Gao, C. An Iron-Based Green Approach to 1-h Production of Single-Layer Graphene Oxide. Nat. Commun. 2015, 6, 5716. [Google Scholar] [CrossRef]
- Mirmohseni, A.; Azizi, M.; Seyed Dorraji, M.S. Facile Synthesis of Copper/Reduced Single Layer Graphene Oxide as a Multifunctional Nanohybrid for Simultaneous Enhancement of Antibacterial and Antistatic Properties of Waterborne Polyurethane Coating. Prog. Org. Coat. 2019, 131, 322–332. [Google Scholar] [CrossRef]
- Marcano, D.C.; Kosynkin, D.V.; Berlin, J.M.; Sinitskii, A.; Sun, Z.; Slesarev, A.; Alemany, L.B.; Lu, W.; Tour, J.M. Improved Synthesis of Graphene Oxide. ACS Nano 2010, 4, 4806–4814. [Google Scholar] [CrossRef] [PubMed]
- Dreyer, D.R.; Park, S.; Bielawski, C.W.; Ruoff, R.S. The Chemistry of Graphene Oxide. Chem. Soc. Rev. 2010, 39, 228–240. [Google Scholar] [CrossRef] [PubMed]
- Dreyer, D.R.; Todd, A.D.; Bielawski, C.W. Harnessing the Chemistry of Graphene Oxide. Chem. Soc. Rev. 2014, 43, 5288. [Google Scholar] [CrossRef] [PubMed]
- Lerf, A.; He, H.; Forster, M.; Klinowski, J. Structure of Graphite Oxide Revisited. J. Phys. Chem. B 1998, 102, 4477–4482. [Google Scholar] [CrossRef]
- He, H.; Klinowski, J.; Forster, M.; Lerf, A. A New Structural Model for Graphite Oxide. Chem. Phys. Lett. 1998, 287, 53–56. [Google Scholar] [CrossRef]
- Szabó, T.; Berkesi, O.; Forgó, P.; Josepovits, K.; Sanakis, Y.; Petridis, D.; Dékány, I. Evolution of Surface Functional Groups in a Series of Progressively Oxidized Graphite Oxides. Chem. Mater. 2006, 18, 2740–2749. [Google Scholar] [CrossRef]
- Szabó, T.; Berkesi, O.; Dékány, I. DRIFT Study of Deuterium-Exchanged Graphite Oxide. Carbon 2005, 43, 3186–3189. [Google Scholar] [CrossRef]
- Stankovich, S.; Piner, R.D.; Chen, X.; Wu, N.; Nguyen, S.T.; Ruoff, R.S. Stable Aqueous Dispersions of Graphitic Nanoplatelets via the Reduction of Exfoliated Graphite Oxide in the Presence of Poly(Sodium 4-Styrenesulfonate). J. Mater. Chem. 2006, 16, 155–158. [Google Scholar] [CrossRef]
- Behabtu, N.; Lomeda, J.R.; Green, M.J.; Higginbotham, A.L.; Sinitskii, A.; Kosynkin, D.V.; Tsentalovich, D.; Parra-Vasquez, A.N.G.; Schmidt, J.; Kesselman, E.; et al. Spontaneous High-Concentration Dispersions and Liquid Crystals of Graphene. Nat. Nanotechnol. 2010, 5, 406–411. [Google Scholar] [CrossRef]
- Kim, J.E.; Han, T.H.; Lee, S.H.; Kim, J.Y.; Ahn, C.W.; Yun, J.M.; Kim, S.O. Graphene Oxide Liquid Crystals. Angew. Chem. Int. Ed. 2011, 50, 3043–3047. [Google Scholar] [CrossRef] [PubMed]
- Xu, Z.; Gao, C. Aqueous Liquid Crystals of Graphene Oxide. ACS Nano 2011, 5, 2908–2915. [Google Scholar] [CrossRef] [PubMed]
- Aboutalebi, S.H.; Gudarzi, M.M.; Zheng, Q.B.; Kim, J. Spontaneous Formation of Liquid Crystals in Ultralarge Graphene Oxide Dispersions. Adv. Funct. Mater. 2011, 21, 2978–2988. [Google Scholar] [CrossRef]
- Dan, B.; Behabtu, N.; Martinez, A.; Evans, J.S.; Kosynkin, D.V.; Tour, J.M.; Pasquali, M.; Smalyukh, I.I. Liquid Crystals of Aqueous, Giant Graphene Oxide Flakes. Soft Matter 2011, 7, 11154. [Google Scholar] [CrossRef]
- Guo, F.; Kim, F.; Han, T.H.; Shenoy, V.B.; Huang, J.; Hurt, R.H. Hydration-Responsive Folding and Unfolding in Graphene Oxide Liquid Crystal Phases. ACS Nano 2011, 5, 8019–8025. [Google Scholar] [CrossRef] [PubMed]
- Dubin, S.; Gilje, S.; Wang, K.; Tung, V.C.; Cha, K.; Hall, A.S.; Farrar, J.; Varshneya, R.; Yang, Y.; Kaner, R.B. A One-Step, Solvothermal Reduction Method for Producing Reduced Graphene Oxide Dispersions in Organic Solvents. ACS Nano 2010, 4, 3845–3852. [Google Scholar] [CrossRef] [PubMed]
- Chhetri, S.; Adak, N.C.; Samanta, P.; Murmu, N.C.; Kuila, T. Functionalized Reduced Graphene Oxide/Epoxy Composites with Enhanced Mechanical Properties and Thermal Stability. Polym. Test. 2017, 63, 1–11. [Google Scholar] [CrossRef]
- Jung, H.J.; Padmajan Sasikala, S.; Lee, K.E.; Hwang, H.S.; Yun, T.; Kim, I.H.; Koo, S.H.; Jain, R.; Lee, G.S.; Kang, Y.H.; et al. Self-Planarization of High-Performance Graphene Liquid Crystalline Fibers by Hydration. ACS Cent. Sci. 2020, 6, 1105–1114. [Google Scholar] [CrossRef] [PubMed]
- Song, M.Y.; Yun, Y.S.; Kim, N.R.; Jin, H.-J. Dispersion Stability of Chemically Reduced Graphene Oxide Nanoribbons in Organic Solvents. RSC Adv. 2016, 6, 19389–19393. [Google Scholar] [CrossRef]
- Liu, Z.; Liu, J.; Wang, Y.; Razal, J.M.; Francis, P.S.; Biggs, M.J.; Barrow, C.J.; Yang, W. Simultaneously ‘Pushing’ and ‘Pulling’ Graphene Oxide into Low-Polar Solvents through a Designed Interface. Nanotechnology 2018, 29, 315707. [Google Scholar] [CrossRef]
- Choi, E.-Y.; Han, T.H.; Hong, J.; Kim, J.E.; Lee, S.H.; Kim, H.W.; Kim, S.O. Noncovalent Functionalization of Graphene with End-Functional Polymers. J. Mater. Chem. 2010, 20, 1907–1912. [Google Scholar] [CrossRef]
- Hofmann, U.; Holst, R. Über Die Säurenatur Und Die Methylierung von Graphitoxyd. Berichte Dtsch. Chem. Ges. (A B Ser.) 1939, 72, 754–771. [Google Scholar] [CrossRef]
- Ruess, G. Über Das Graphitoxyhydroxyd (Graphitoxyd). Monatshefte Chem. 1947, 76, 381–417. [Google Scholar] [CrossRef]
- Scholz, W.; Boehm, H.P. Untersuchungen Am Graphitoxid. VI. Betrachtungen Zur Struktur Des Graphitoxids. Z. Anorg. Allg. Chem. 1969, 369, 327–340. [Google Scholar] [CrossRef]
- Nakajima, T.; Matsuo, Y. Formation Process and Structure of Graphite Oxide. Carbon 1994, 32, 469–475. [Google Scholar] [CrossRef]
- Fathizadeh, M.; Tien, H.N.; Khivantsev, K.; Chen, J.-T.; Yu, M. Printing Ultrathin Graphene Oxide Nanofiltration Membranes for Water Purification. J. Mater. Chem. A 2017, 5, 20860–20866. [Google Scholar] [CrossRef]
- Zhao, J.; Pei, S.; Ren, W.; Gao, L.; Cheng, H.-M. Efficient Preparation of Large-Area Graphene Oxide Sheets for Transparent Conductive Films. ACS Nano 2010, 4, 5245–5252. [Google Scholar] [CrossRef] [PubMed]
- Liu, Z.; Xie, Y.; Zhao, J.; Wu, S.; Zhou, Z.; Wen, M.; Cheng, Y.-B.; Zhong, J. Rapid Preparation of Conductive Transparent Films via Solution Printing of Graphene Precursor. Thin Solid Films 2018, 657, 24–31. [Google Scholar] [CrossRef]
- Sheng, Y.; Zhou, Y.; Tang, C.; Cheng, X.; Zhang, C. Redispersible Reduced Graphene Oxide Prepared in a Gradient Solvent System. Nanomaterials 2022, 12, 1982. [Google Scholar] [CrossRef] [PubMed]
- Su, H.; Zhang, C.; Li, X.; Wu, L.; Chen, Y. Aggregation Prevention: Reduction of Graphene Oxide in Mixed Medium of Alkylphenol Polyoxyethylene (7) Ether and 2-Methoxyethanol. RSC Adv. 2018, 8, 39140–39148. [Google Scholar] [CrossRef]
- Hu, Y.; Gao, H. Chemical Synthesis of Reduced Graphene Oxide: A Review. Miner. Miner. Mater. 2023, 2, 8. [Google Scholar] [CrossRef]
- Mahanta, S.K.; Balaji, U.; Pradhan, S.K.; Suman, S.; Sankaran, K.J. Towards High-Quality Graphite Oxide from Graphite—Systemization of the Balance in Oxidative and Mechanical Forces for Yield Enhancement. Chem. Eng. Sci. 2022, 259, 117815. [Google Scholar] [CrossRef]
- Chen, J.; Li, Y.; Huang, L.; Li, C.; Shi, G. High-Yield Preparation of Graphene Oxide from Small Graphite Flakes via an Improved Hummers Method with a Simple Purification Process. Carbon 2015, 81, 826–834. [Google Scholar] [CrossRef]
- Sim, H.J.; Li, Z.; Xiao, P.; Lu, H. The Influence of Lateral Size and Oxidation of Graphene Oxide on Its Chemical Reduction and Electrical Conductivity of Reduced Graphene Oxide. Molecules 2022, 27, 7840. [Google Scholar] [CrossRef] [PubMed]
- Dimiev, A.; Kosynkin, D.V.; Alemany, L.B.; Chaguine, P.; Tour, J.M. Pristine Graphite Oxide. J. Am. Chem. Soc. 2012, 134, 2815–2822. [Google Scholar] [CrossRef] [PubMed]
- Dimiev, A.M.; Tour, J.M. Mechanism of Graphene Oxide Formation. ACS Nano 2014, 8, 3060–3068. [Google Scholar] [CrossRef] [PubMed]
- Singh, B.P.; Nayak, S.; Nanda, K.K.; Singh, A.; Takai, C.; Takashi, S.; Fuji, M. Transparent, Flexible, and Conducting Films Based on Graphene–Polymer Composites. Polym. Compos. 2018, 39, 297–304. [Google Scholar] [CrossRef]
- Xu, P.; Wu, L.; Zhang, X.; Wang, W.; Zhou, X.; Liu, Z. Highly Flexible and Conductive Graphene Films for Low Cost RFID Applications. J. Mater. Sci. Mater. Electron. 2023, 34, 913. [Google Scholar] [CrossRef]


| GO1 | GO2 | GO3 | GO4 | GO5 | GO6 | |
|---|---|---|---|---|---|---|
| H2SO4 (mL) | 85.5 | 81 | 76.5 | 72 | 67.5 | 63 |
| H2O (mL) | 4.5 | 9 | 13.5 | 18 | 22.5 | 27 |
| Film Type | HI (mL) | NaI (g) | H2O (mL) | |
|---|---|---|---|---|
| Films prepared with phenylhydrazine | PHrGO | - | - | |
| PHrGO-1 | 10 | - | ||
| PHrGO-2 | 10 | 2.5 | ||
| PHrGO-3 | 10 | 10 | ||
| Films prepared with hydrazine hydrate | rGO | - | - | - |
| rGO-1 | 10 | - | - | |
| rGO-2 | 10 | 2.5 | - | |
| rGO-3 | 10 | 10 | 5 |
| GO1 | GO2 | GO3 | GO4 | GO5 | GO6 | |
|---|---|---|---|---|---|---|
| Graphite (g) | 1 | 1 | 1 | 1 | 1 | 1 |
| KMnO4 (mol) | 0.032 | 0.032 | 0.032 | 0.032 | 0.032 | 0.032 |
| H2O (mL) | 4.5 | 9 | 13.5 | 18 | 22.5 | 27 |
| H2SO4 (mL) | 85.5 | 81 | 76.5 | 72 | 67.5 | 63 |
| H2O2 (mL) | 2 | 2 | 2 | 3 | 3 | 6 |
| Product weight (g) | 1.05 | 1.01 | 0.99 | 0.92 | <0.84 | <0.5 |
| Product colour | light brown | yellow | yellow | yellow | light brown | black |
| Solvent | janus-GO | Total Energy (kcal/mol) | Single Energy-A (kcal/mol) | Single Energy-B (kcal/mol) | Interaction Energy (kcal/mol) |
|---|---|---|---|---|---|
| H2O | janus-GO-A-A | 3006.27 | 1509.61 | - | −12.94 |
| janus-GO-A-B | 2379.87 | 1509.61 | 829.37 | 40.89 | |
| janus-GO-B-B | 1734.13 | - | 829.37 | 75.38 | |
| BnOH | janus-GO-A-A | 2198.52 | 1078.21 | - | 42.11 |
| janus-GO-A-B | 1509.65 | 1078.21 | 401.65 | 29.80 | |
| janus-GO-B-B | 816.41 | - | 401.65 | 13.11 | |
| DEP | janus-GO-A-A | 1967.25 | 969.09 | - | 29.07 |
| janus-GO-A-B | 1309.35 | 969.09 | 329.76 | 10.50 | |
| janus-GO-B-B | 660.33 | - | 329.76 | 0.81 |
| Number of Film Reductions | HI (mL) | NaI (g) | H2O (mL) | C/O Ratio (%) | Electrical Conductivity (S/m) | |
|---|---|---|---|---|---|---|
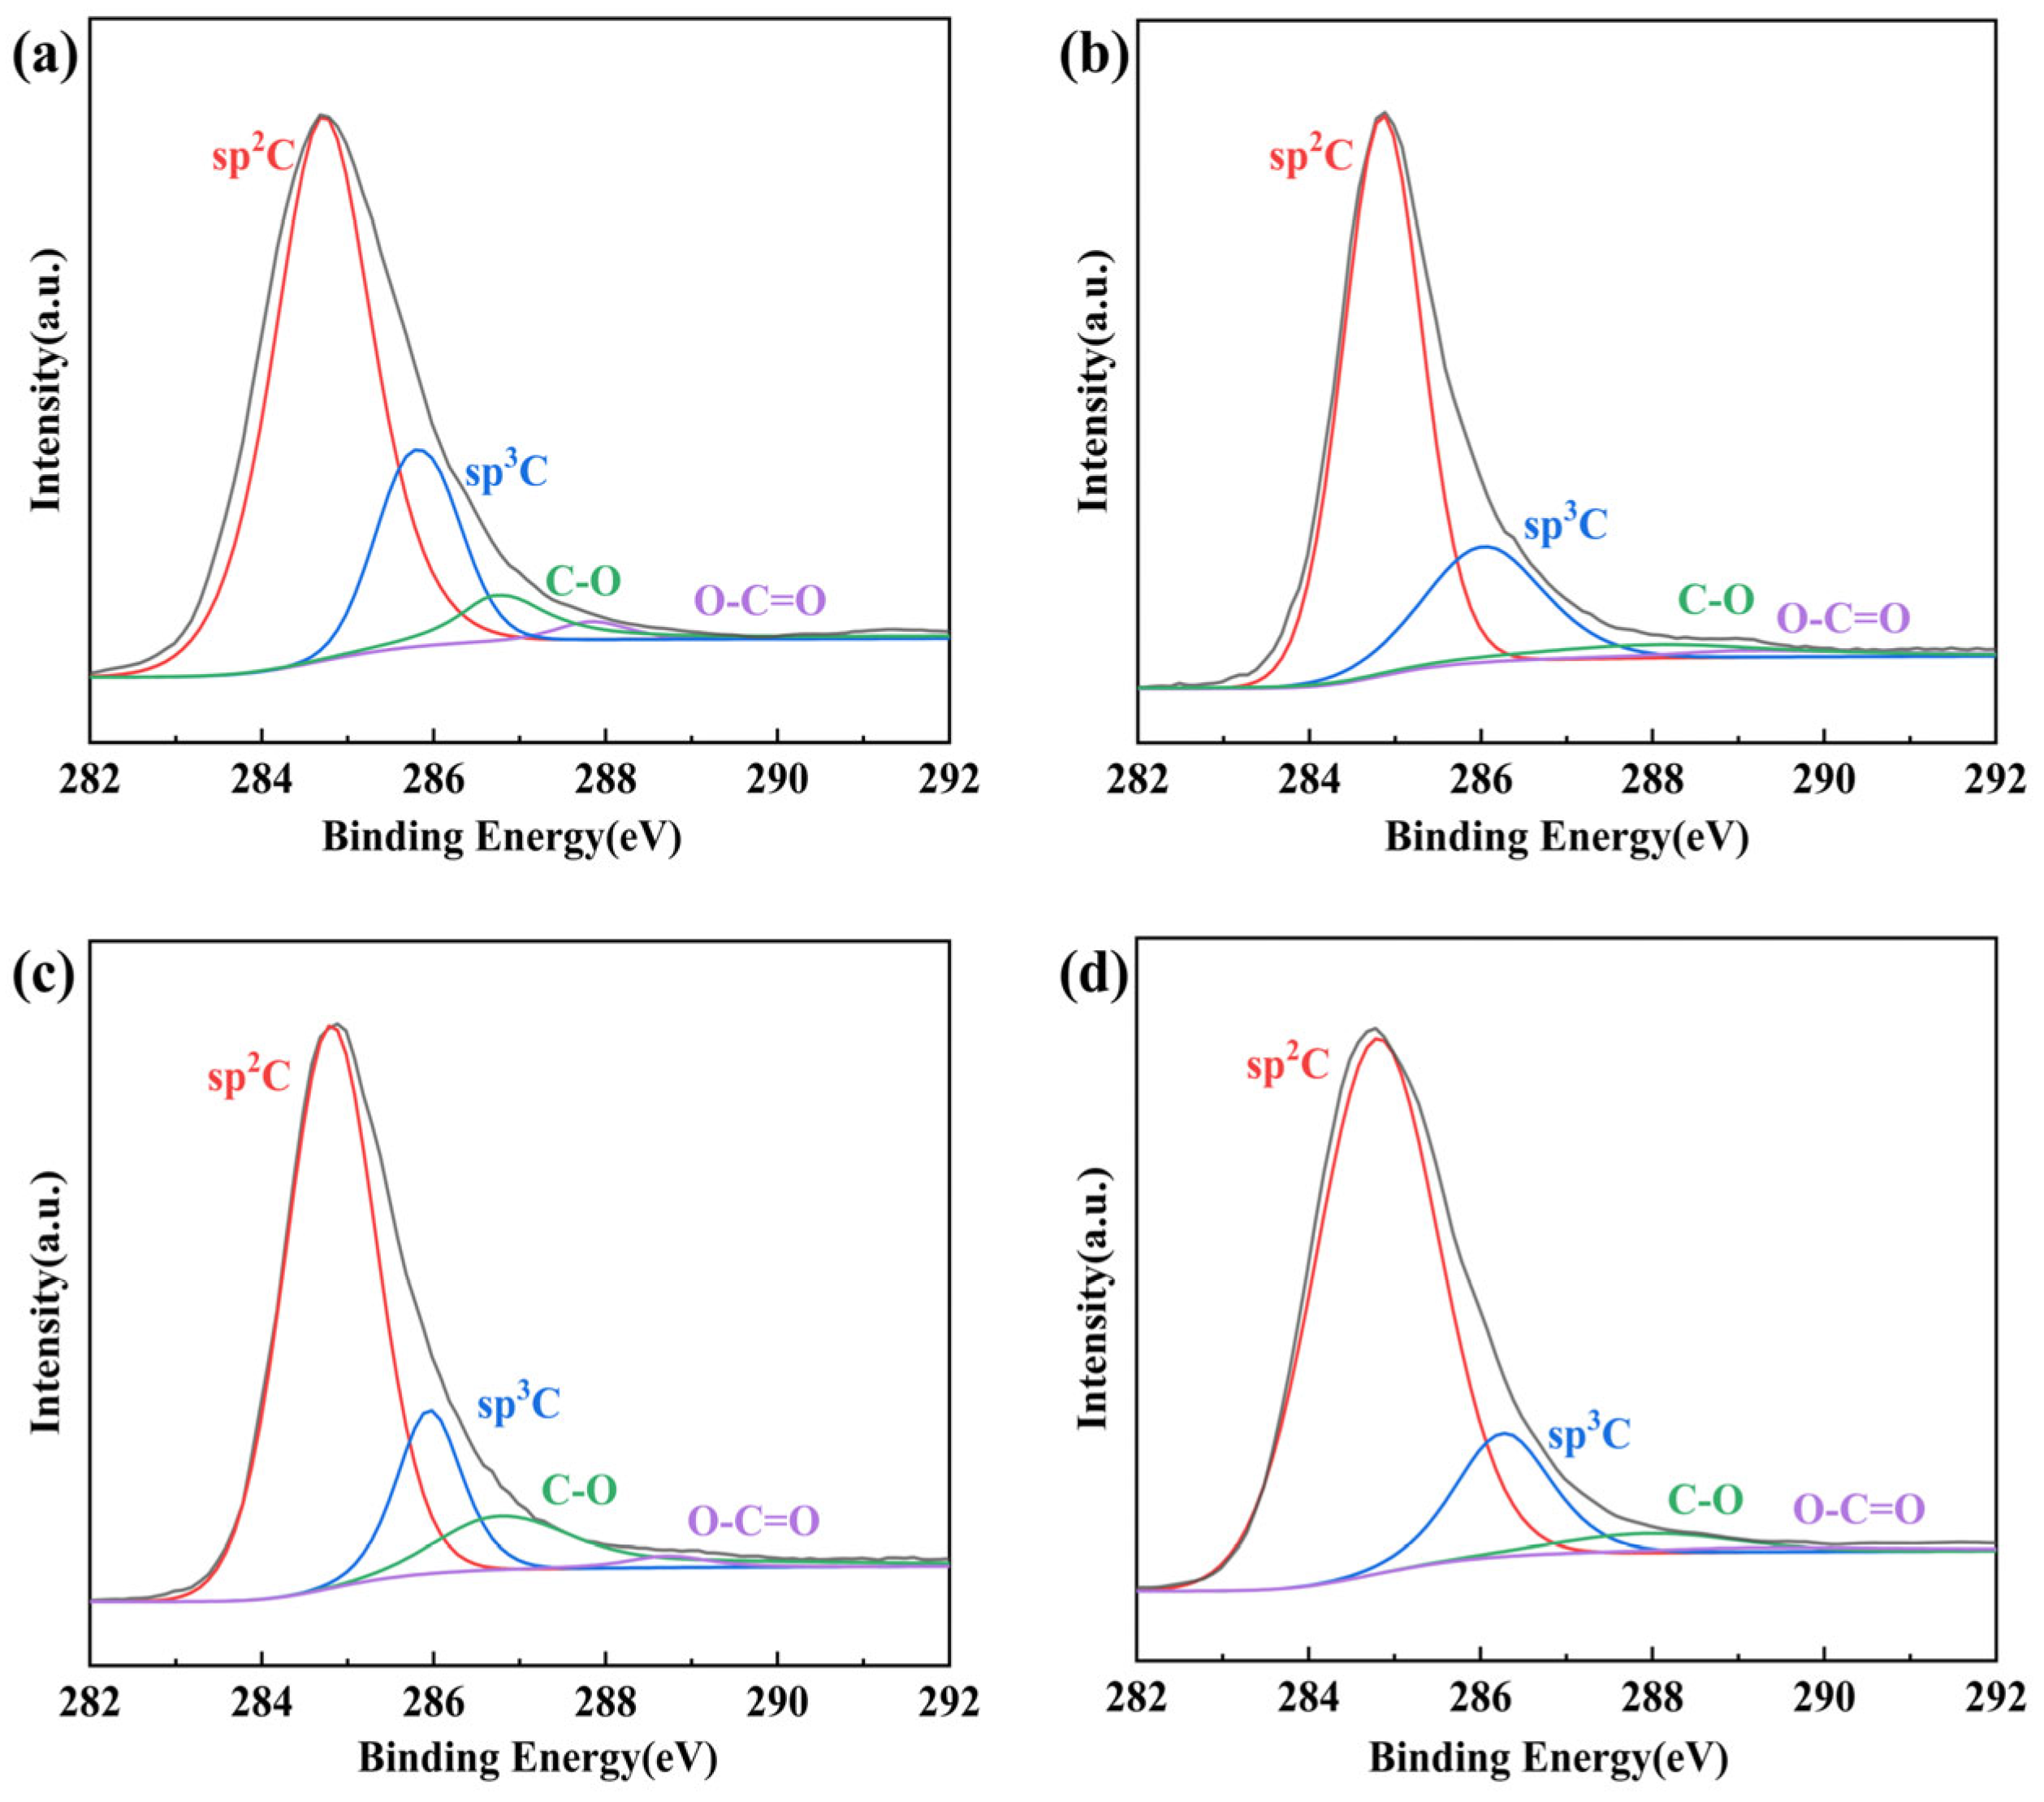
| PHrGO | Primary reduction | - | - | - | 5.04 | 177 |
| PHrGO-1 | Secondary reduction | 10 | - | - | 6.11 | 458 |
| PHrGO-2 | Secondary reduction | 10 | 2.5 | - | 6.99 | 989 |
| PHrGO-3 | Secondary reduction | 10 | 10 | 5 | 7.59 | 2579 |
| D Band (cm−1) | G Band (cm−1) | ID/IG (%) | |
|---|---|---|---|
| PHrGO | 1324 | 1589 | 1.54 |
| PHrGO-1 | 1324 | 1599 | 1.50 |
| PHrGO-2 | 1327 | 1591 | 1.45 |
| PHrGO-3 | 1324 | 1591 | 1.42 |
| Number of Film Reductions | HI (mL) | NaI (g) | H2O (mL) | C/O Ratio (%) | Electrical Conductivity (S/m) | |
|---|---|---|---|---|---|---|
| rGO | Primary reduction | - | - | - | 7.49 | 1053 |
| rGO-1 | Secondary reduction | 10 | - | - | 8.48 | 2539 |
| rGO-2 | Secondary reduction | 10 | 2.5 | - | 8.96 | 5570 |
| rGO-3 | Secondary reduction | 10 | 10 | 5 | 9.47 | 8653 |
| D Band (cm−1) | G Band (cm−1) | ID/IG (%) | |
|---|---|---|---|
| rGO | 1330 | 1592 | 1.40 |
| rGO-1 | 1327 | 1590 | 1.39 |
| rGO-2 | 1324 | 1591 | 1.37 |
| rGO-3 | 1325 | 1592 | 1.31 |
Disclaimer/Publisher’s Note: The statements, opinions and data contained in all publications are solely those of the individual author(s) and contributor(s) and not of MDPI and/or the editor(s). MDPI and/or the editor(s) disclaim responsibility for any injury to people or property resulting from any ideas, methods, instructions or products referred to in the content. |
© 2024 by the authors. Licensee MDPI, Basel, Switzerland. This article is an open access article distributed under the terms and conditions of the Creative Commons Attribution (CC BY) license (https://creativecommons.org/licenses/by/4.0/).
Share and Cite
Yi, L.; Chen, X.; Su, H.; Zhang, C. The Janus Structure of Graphene Oxide and Its Large-Size Conductive Film Strip Pattern. Nanomaterials 2024, 14, 980. https://doi.org/10.3390/nano14110980
Yi L, Chen X, Su H, Zhang C. The Janus Structure of Graphene Oxide and Its Large-Size Conductive Film Strip Pattern. Nanomaterials. 2024; 14(11):980. https://doi.org/10.3390/nano14110980
Chicago/Turabian StyleYi, Lu, Xiangnan Chen, Heng Su, and Chaocan Zhang. 2024. "The Janus Structure of Graphene Oxide and Its Large-Size Conductive Film Strip Pattern" Nanomaterials 14, no. 11: 980. https://doi.org/10.3390/nano14110980
APA StyleYi, L., Chen, X., Su, H., & Zhang, C. (2024). The Janus Structure of Graphene Oxide and Its Large-Size Conductive Film Strip Pattern. Nanomaterials, 14(11), 980. https://doi.org/10.3390/nano14110980