Article

Engineering of LiTaO3 Nanoparticles by Flame Spray Pyrolysis: Understanding In Situ Li-Incorporation into the Ta2O5 Lattice

Laboratory of Physical Chemistry of Materials & Environment, Department of Physics, University of Ioannina, 45110 Ioannina, Greece
*
Author to whom correspondence should be addressed.
Nanomaterials 2024, 14(15), 1257; https://doi.org/10.3390/nano14151257 (registering DOI)
Submission received: 30 June 2024 / Revised: 15 July 2024 / Accepted: 25 July 2024 / Published: 27 July 2024
(This article belongs to the Section Energy and Catalysis)

Abstract

:
Lithium tantalate (LiTaO3) perovskite finds wide use in pyroelectric detectors, optical waveguides and piezoelectric transducers, stemming from its good mechanical and chemical stability and optical transparency. Herein, we present a method for synthesis of LiTaO3 nanoparticles using a scalable Flame Spray Pyrolysis (FSP) technology, that allows the formation of LiTaO3 nanomaterials in a single step. Raman, XRD and TEM studies allow for comprehension of the formation mechanism of the LiTaO3 nanophases, with particular emphasis on the penetration of Li atoms into the Ta-oxide lattice. We show that, control of the High-Temperature Particle Residence Time (HTPRT) in the FSP flame, is the key-parameter that allows successful penetration of the -otherwise amorphous- Li phase into the Ta2O5 nanophase. In this way, via control of the HTPRT in the FSP process, we synthesized a series of nanostructured LiTaO3 particles of varying phase composition from {amorphous Li/Ta2O5/LiTaO3} to {pure LiTaO3, 15–25 nm}. Finally, the photophysical activity of the FSP-made LiTaO3 was validated for photocatalytic H2 production from H2O. These data are discussed in conjunction with the role of the phase composition of the LiTaO3 nanoparticles. More generally, the present work allows a better understanding of the mechanism of ABO3 perovskite formation that requires the incorporation of two cations, A and B, into the nanolattice.

1. Introduction

Perovskites are efficient materials in electrocatalytic applications due to their low activation energy and high electron transfer kinetics; they also have the potential to be used as efficient photocatalysts due to their long-term stability and selectivity in catalytic reactions [1,2]. In the family of perovskites, titanates, tantalates, niobates, vanadates and ferrites have been used in many applications such as gas sensors, solid oxide fuel cells, dielectrics, ferroelectrics and photocatalysts for water splitting, to name a few [3,4,5]. Tantalum pentaoxide (Ta2O5) and its alkali tantalate perovskites, like lithium-tantalate (LiTaO3), sodium-tantalate (NaTaO3) and potassium-tantalate (KTaO3), have been demonstrated as highly effective materials in photocatalytic water splitting and CO2 reduction [5,6,7], making them promising candidates for solar energy conversion applications. Their photocatalytic activity is both attributed to, and determined by, the d-orbitals of Ta located at the conduction band, as well as to the efficient carrier delocalization promoted by small distortions in TaO6 bonds [2,8].
Tantalate perovskites have been shown to be able to perform water splitting without the use of a cocatalyst [9,10] under proper UV photon excitation, i.e., their energy gap lies around 4.7 eV for LiTaO3, 4 eV for NaTaO3 and 3.6 eV for KTaO3 [10,11]. Among the alkali tantalates, LiTaO3 stands out as one of the most notable materials due to its remarkable physical properties, including piezoelectricity, pyroelectricity and ferroelectric characteristics [12]. Kato and Kudo investigated alkali tantalates and their photocatalytic water splitting ability, i.e., splitting water into H2 and O2 without the use of cocatalysts such as Pt or NiO [13,14].
So far, the methods used to synthesize perovskite are numerous, and all of them require high temperatures, i.e., sol–gel [15], hydrothermal [16], microwave [17,18] and flame aerosol synthesis [4,19,20]. The synthetic approach can have a great impact on the properties of the final material, affecting the morphology, shape, crystallite size, specific surface area (SSA) and structure of the perovskite. Compared to other synthetic methods, the fundamental advantage of flame spray pyrolysis (FSP), a flame aerosol synthesis route, stems from its straightforward scalability, enabling industrial production yields to reach kilograms per hour [21]. However, the synthesis of perovskite ABO3 nanoparticles using FSP is rather challenging considering that we demand the concomitant insertion of two cations, A and B, into the lattice of ABO3 at the correct stoichiometry of 1:1:3.
So far, there are few works in the literature regarding the FSP synthesis of ABO3 nanostructures; for example, Angel et al. synthesized LaMO3 (M = Mn, Fe, Co) nanomaterials using FSP and investigated the effect of dispersion gas flow on both the particle size and morphology [22]. In another work, Yuan et al. used the FSP method to deposit CuO quantum dots onto SrTiO3 perovskite [23]. The authors explored the role of copper loading onto perovskites and optimized the catalytic efficiency for the complete oxidation of lean CO and CH4, with the best-performing nanocomposite being 15 mol% CuO. Our group used FSP to synthesize BiFeO3 perovskite or mullite-type Bi2Fe4O9, which proved to be both efficient in the catalytic reduction of 4-nitrophenol to 4-aminophenol [24] and a highly efficient photocatalyst for O2 production from H2O [25].
In general, FSP is an effective method for the production of particles well-below 100 nm, a characteristic that might be difficult to achieve using wet synthesis routes. However, the crystallinity and phase transformation of flame-made perovskites are not straightforward. Kho et al. investigated the degree of crystallinity of as-prepared FSP-made BiVO4 nanoparticles [26]. By varying the filter temperature (Tf) during FSP synthesis, the authors transitioned from the initially dominant amorphous to highly crystalline monoclinic-scheelite BiVO4 when Tf was greater than 360 °C. The crystallization of BiVO4 is highly dependent on Tf, suggesting that, the short residence time of the particles in the FSP flame, is inadequate to induce crystallization within the flame. The same trend was verified by our group in the case of FSP synthesis of W- and Zr-doped BiVO4 [27]. Recently, we showed that FSP can achieve the synthesis of highly crystalline NaTaO3 under the condition that a well-defined protocol is adopted [28]. Specifically, we found that in FSP-made NaTaO3, the combustion profile in the FSP flame, i.e., the precursor/dispersion ratio (P/D), has a significant impact on both the crystallinity and the phase composition of the final material. A higher P/D ratio, where P corresponds to a higher solvent feed flow in the flame that boosts combustion enthalpy, favors the formation of 100% crystalline NaTaO3 perovskite [28].
Herein, our aim was to develop an FSP process protocol to successfully synthesize crystalline LiTaO3 nanomaterials. To do this, we systematically studied the thermodynamics of the FSP process that control the transition from {amorphous Li} + {Ta2O5} to crystalline LiTaO3 perovskite. The underlying solid-state process involves the incorporation of Li atoms into the Ta2O5 lattice and thermodynamic stabilization to a stable LiTaO3 crystal. Thus, our specific aims were [i] to use FSP to synthesize a series of amorphous Li/Ta2O5/LiTaO3 nanomaterials with different percentages of the three components, [ii] to show that amorphous Li/Ta2O5 could be transformed to crystalline LiTaO3 in a single post-FSP calcination step, [iii] to optimize the FSP process configuration in order to obtain high-purity (>95%) LiTaO3 in one step and [iv] to validate the functional quality of the resulting LiTaO3 in photocatalytic H2 production from H2O.
By an analysis of key data (XRD, Raman) with the aid of TEM, we provide a comprehensive physicochemical frame that allows an understanding of the Li/Ta2O5→LiTaO3 transition in the FSP flame. We show that the HTPRT is the key parameter that must be optimized via control of the FSP reactor parameters.

2. Materials and Methods

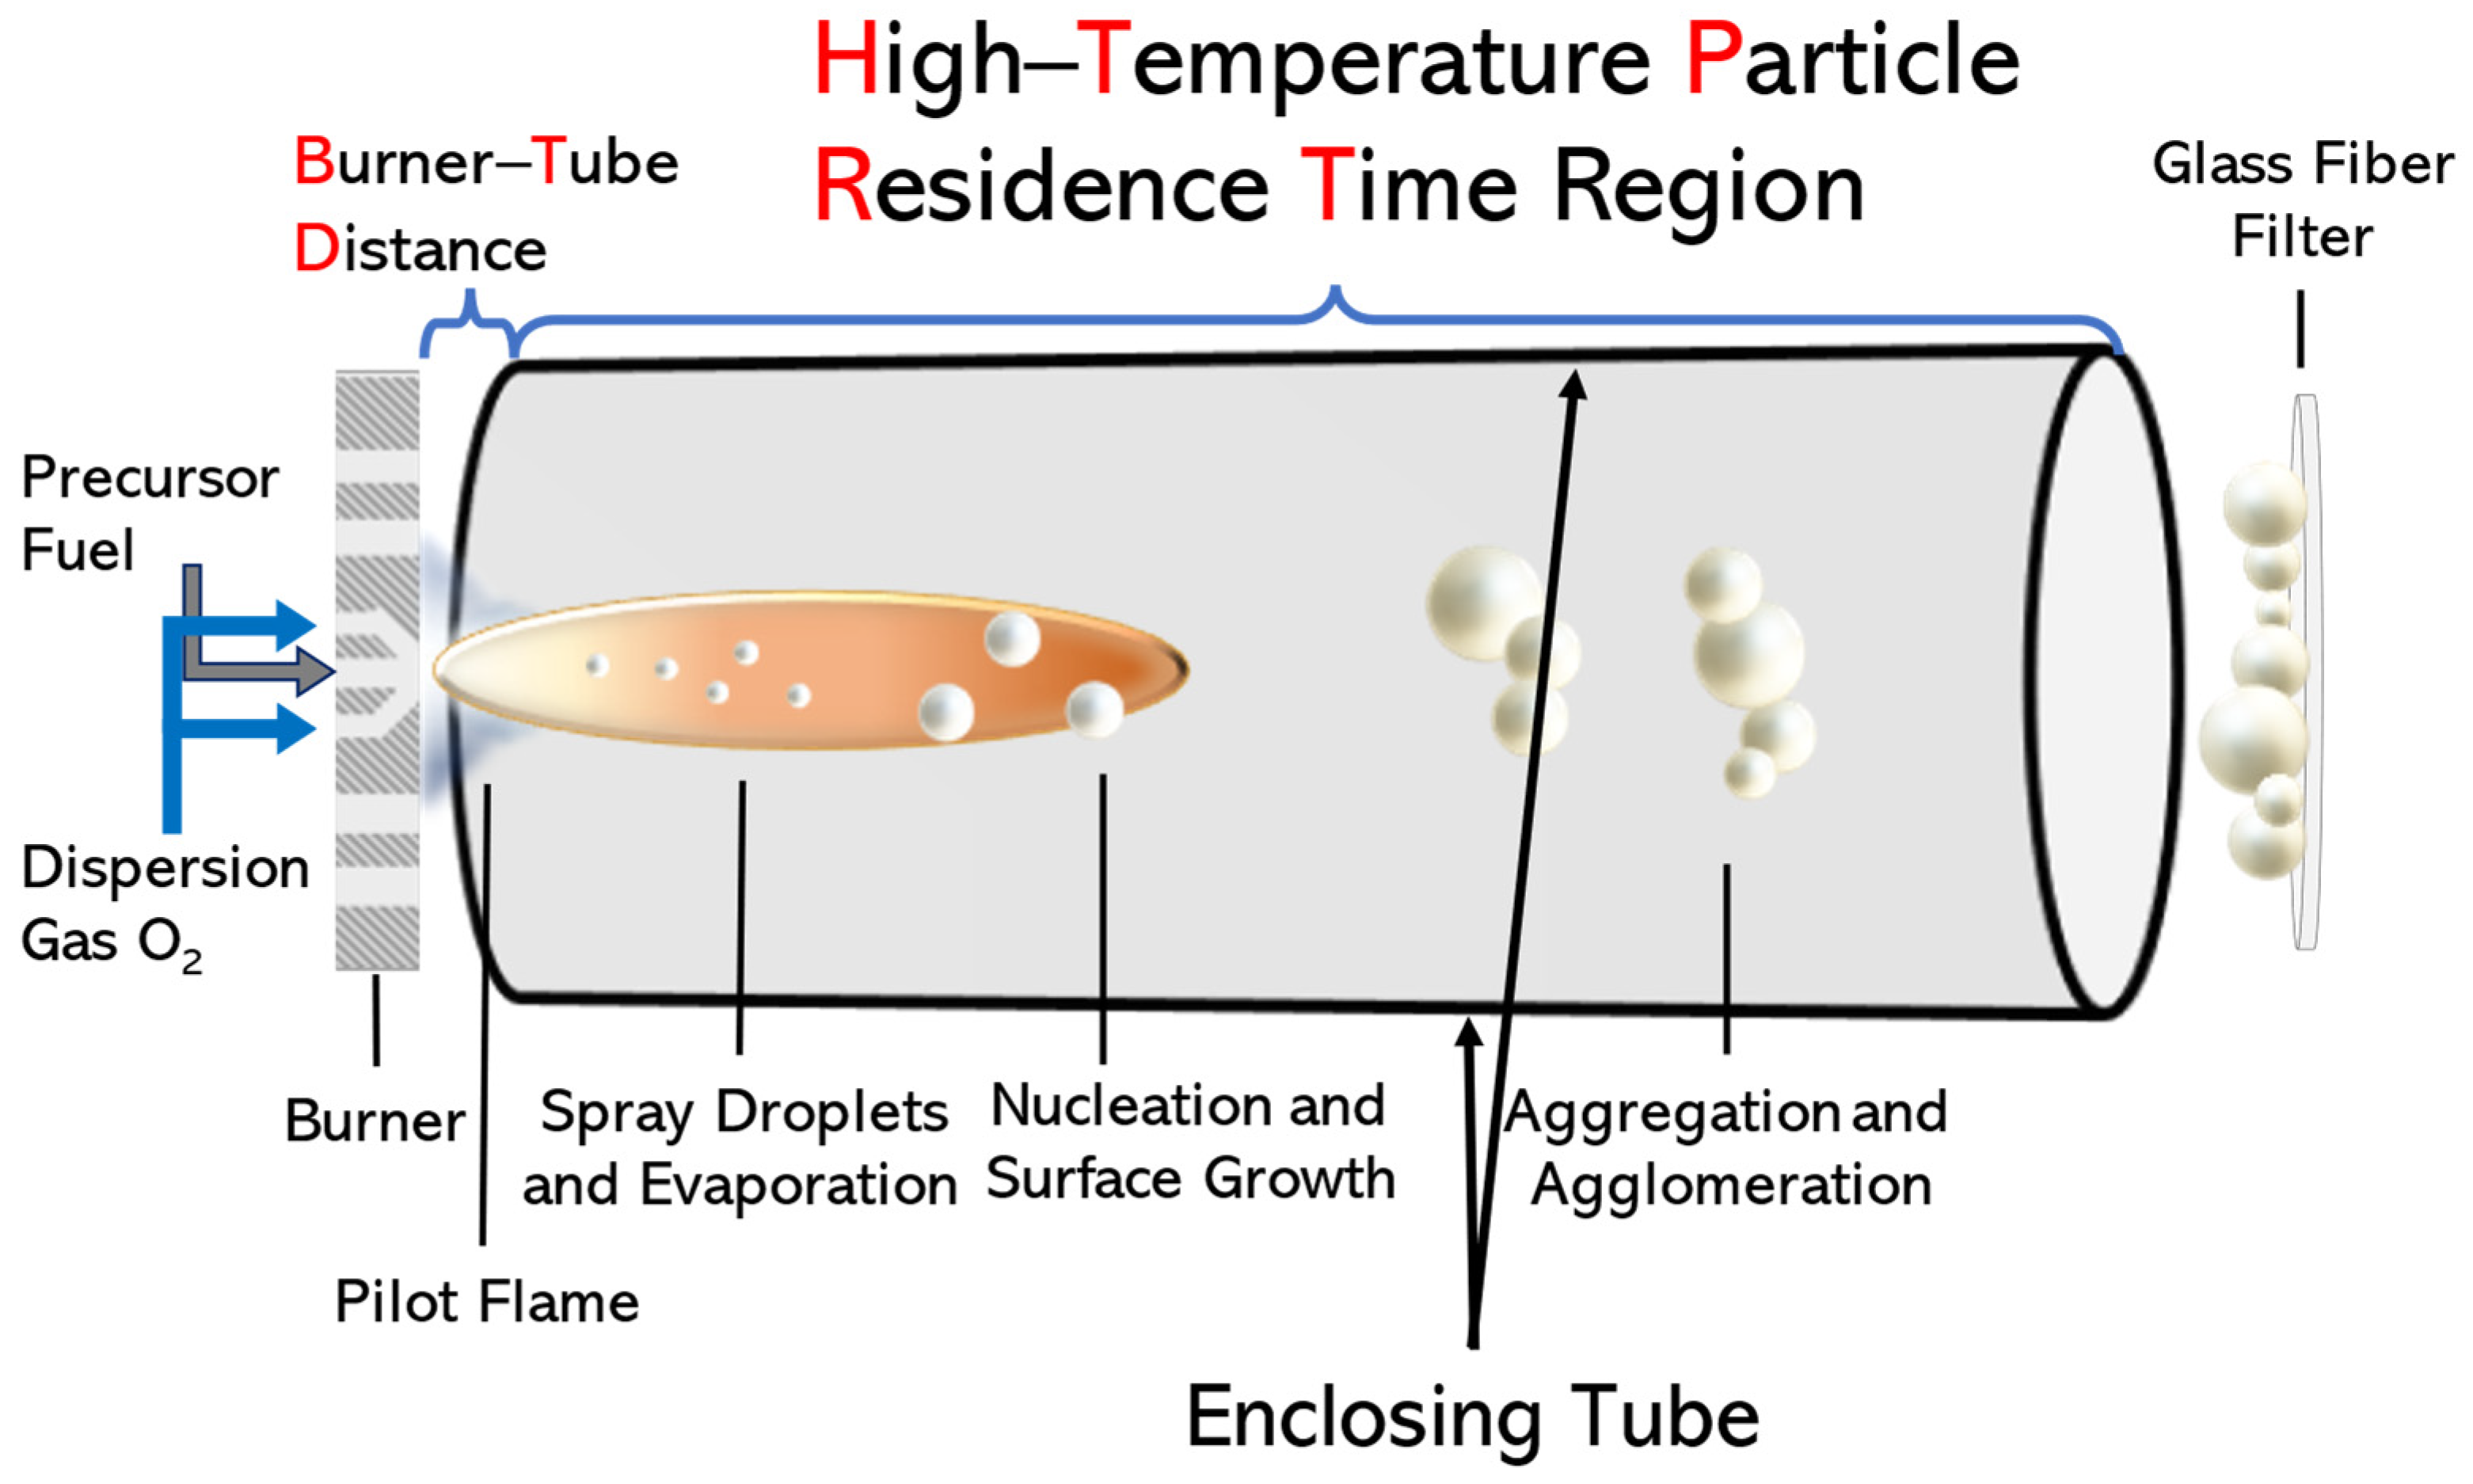
2.1. Synthesis of LiTaO3 Nanoparticles via Flame Spray Pyrolysis (FSP)

For the synthesis of LiTaO3 nanoparticles (NPs), for convenience, we codenamed the FSP-made LiTaO3 materials as LTO. A single-nozzle FSP reactor was used, schematically illustrated in Figure 1. Precursor solutions were prepared by dissolving 0.3 M Ta (V) n-Butoxide (99.9% Ta, STREM (Newburyport, MA, USA)) and 0.3 M Li-Butoxide (98%, STREM (Newburyport, MA, USA)) in xylene. Each precursor solution was then fed into the FSP system through a capillary with a steady precursor flow rate (P) of 3, 5, or 9 mL min−1 and dispersed into fine droplets using an oxygen dispersion flow rate (D) of 9, 5, or 3 L min−1 (Linde 99.999%). To initiate combustion, a premixed O2/CH4 pilot flame at flow rates of 4 L min−1 and 2 L min−1, respectively, was applied. Moreover, a 44 cm metal tube placed 2 cm above the burner (Burner–Tube Distance (BTD) = 2 cm) was used to enclose the flame compartment from the surrounding environment, prolonging the HTPRT and preventing cooling of the flame. Finally, the particle collection was assisted by an additional 10 L min−1 O2 sheath flow and a vacuum pump (BUSCH V40). The powder was then retrieved by scrubbing it off from a glass microfiber filter with a binder (Albet Labscience, Hahnemuehle, Dasen, Germany, GF 6 257) filter.

2.2. Structural Characterization Techniques

Raman spectroscopy: The structural features of the LTO NPs were evaluated by Raman spectroscopy using a HORIBA-Xplora Plus spectrometer (Kyoto, Japan), equipped with an Olympus BX41 microscope (Breinigsville, PA, USA). A 785 nm diode laser served as the excitation source, with the laser beam focused on the sample using the microscope. Raman spectra were obtained by performing 30 accumulations over 10 se at a consistent laser intensity, which was 100% of the laser’s total intensity.
Ultraviolet–Visible Diffuse Reflectance (UV–Vis DRS): DRS experiments were conducted using a Perkin Elmer Lambda-35 spectrophotometer (Waltham, MA, USA) using BaSO4 powder as the background standard while operating at room temperature. The optical energy gap value (Eg) of each LTO semiconductor was determined through extrapolation of a straight line on the curve that was formed from the correlation between (αhv)1/n and hv, called the Tauc plot method [28], and the following equation:
a h v 1 / n = C h v E g
where α is the absorption coefficient, hv is the photon energy, Eg is the energy gap and C is a constant. The exponent denotes the nature of the electronic transition; when n = 1/2, it is a direct allowed transition, and when n = 2, it is an indirect allowed transition.
Powder X-ray Diffraction (pXRD): In order to obtain the crystal structures of the nanoparticles, a D8 Advance Bruker diffractometer with a Cu source (Kα, λ = 1.5418 Å) and a secondary beam monochromator was used. All XRD patterns were collected at room temperature, operating at 36 kV and 36 mA. Using the Scherrer equation, the crystal size (dXRD) of the nanoparticles was calculated [29]:
d X R D = K   λ F W H M c o s θ
where K = 0.9, λ = 1.5418 Å and FWHM is the full width at half-maximum of the XRD peaks.
Transmission Electron Microscopy (TEM): The morphology and nanostructure of the nanoparticles were unveiled using an FEI Titan 80-300 S/TEM microscope at 300 kV accelerating voltage and a 21.5 mrad beam convergence angle. The powdered sample preparation involved sonicating the samples in ethanol, followed by depositing the resulting homogeneous suspension as a single droplet onto a TEM copper grid covered with lacey carbon film.

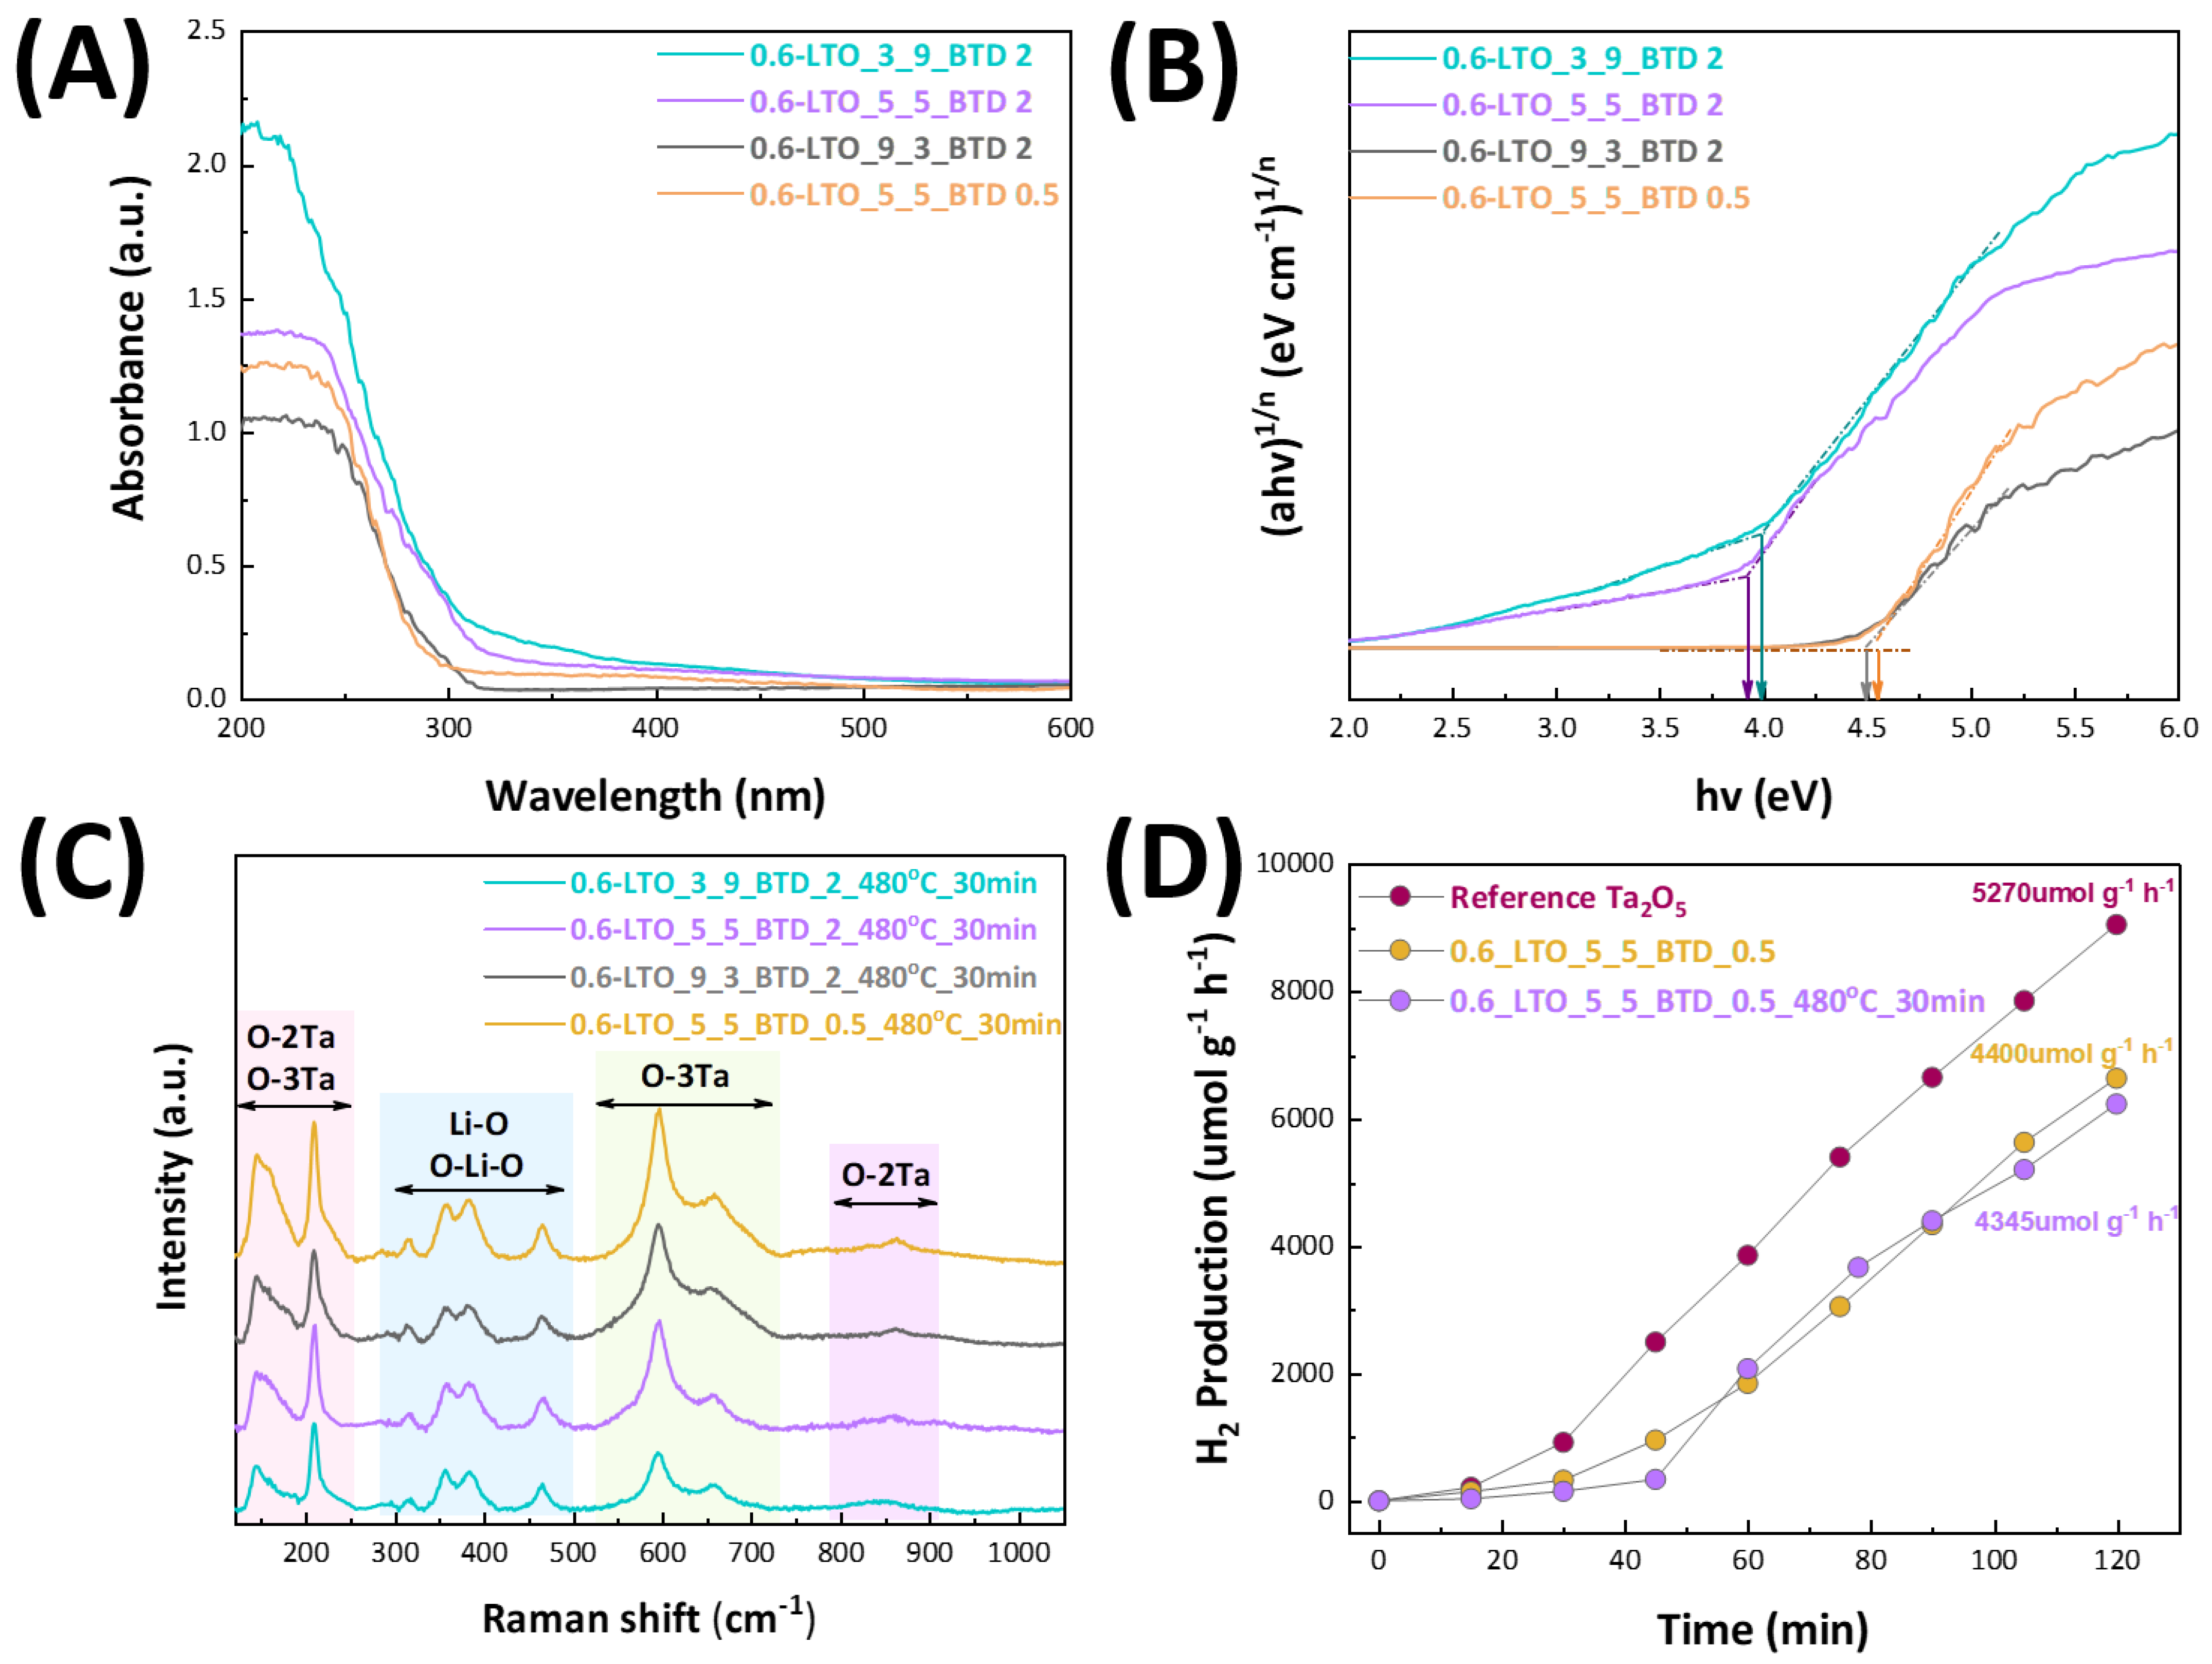
2.3. Photocatalytic Evaluation
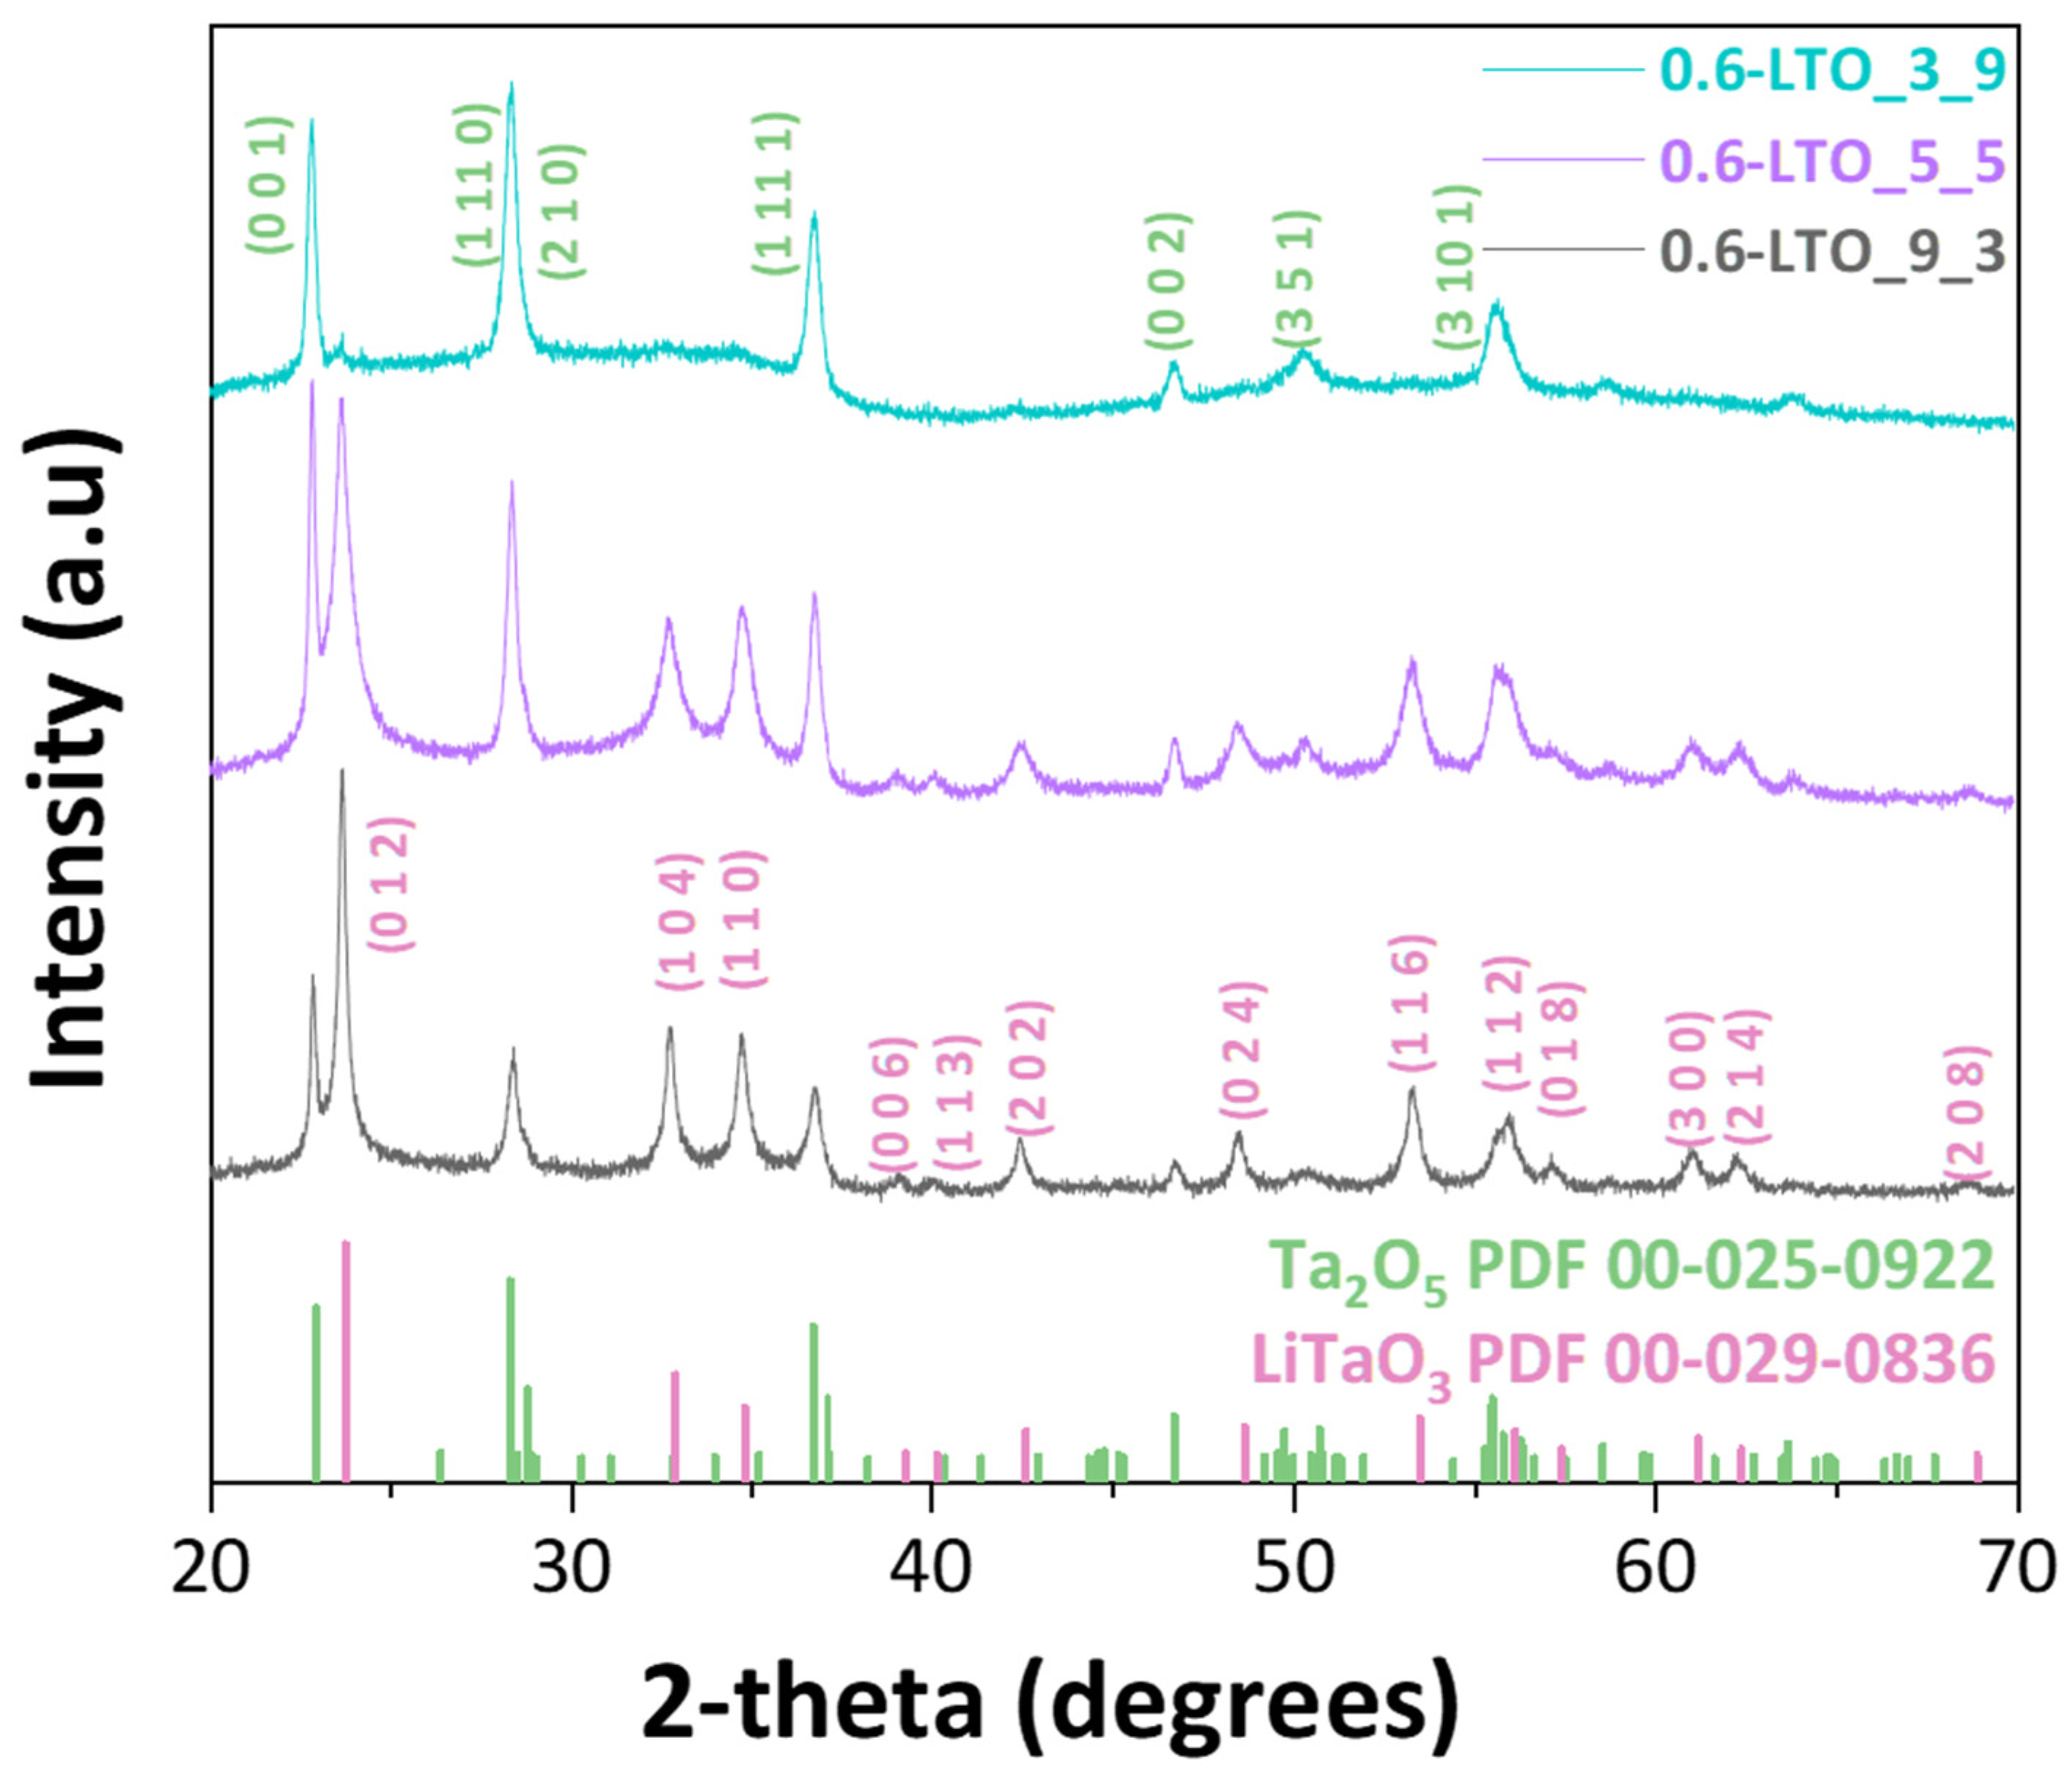
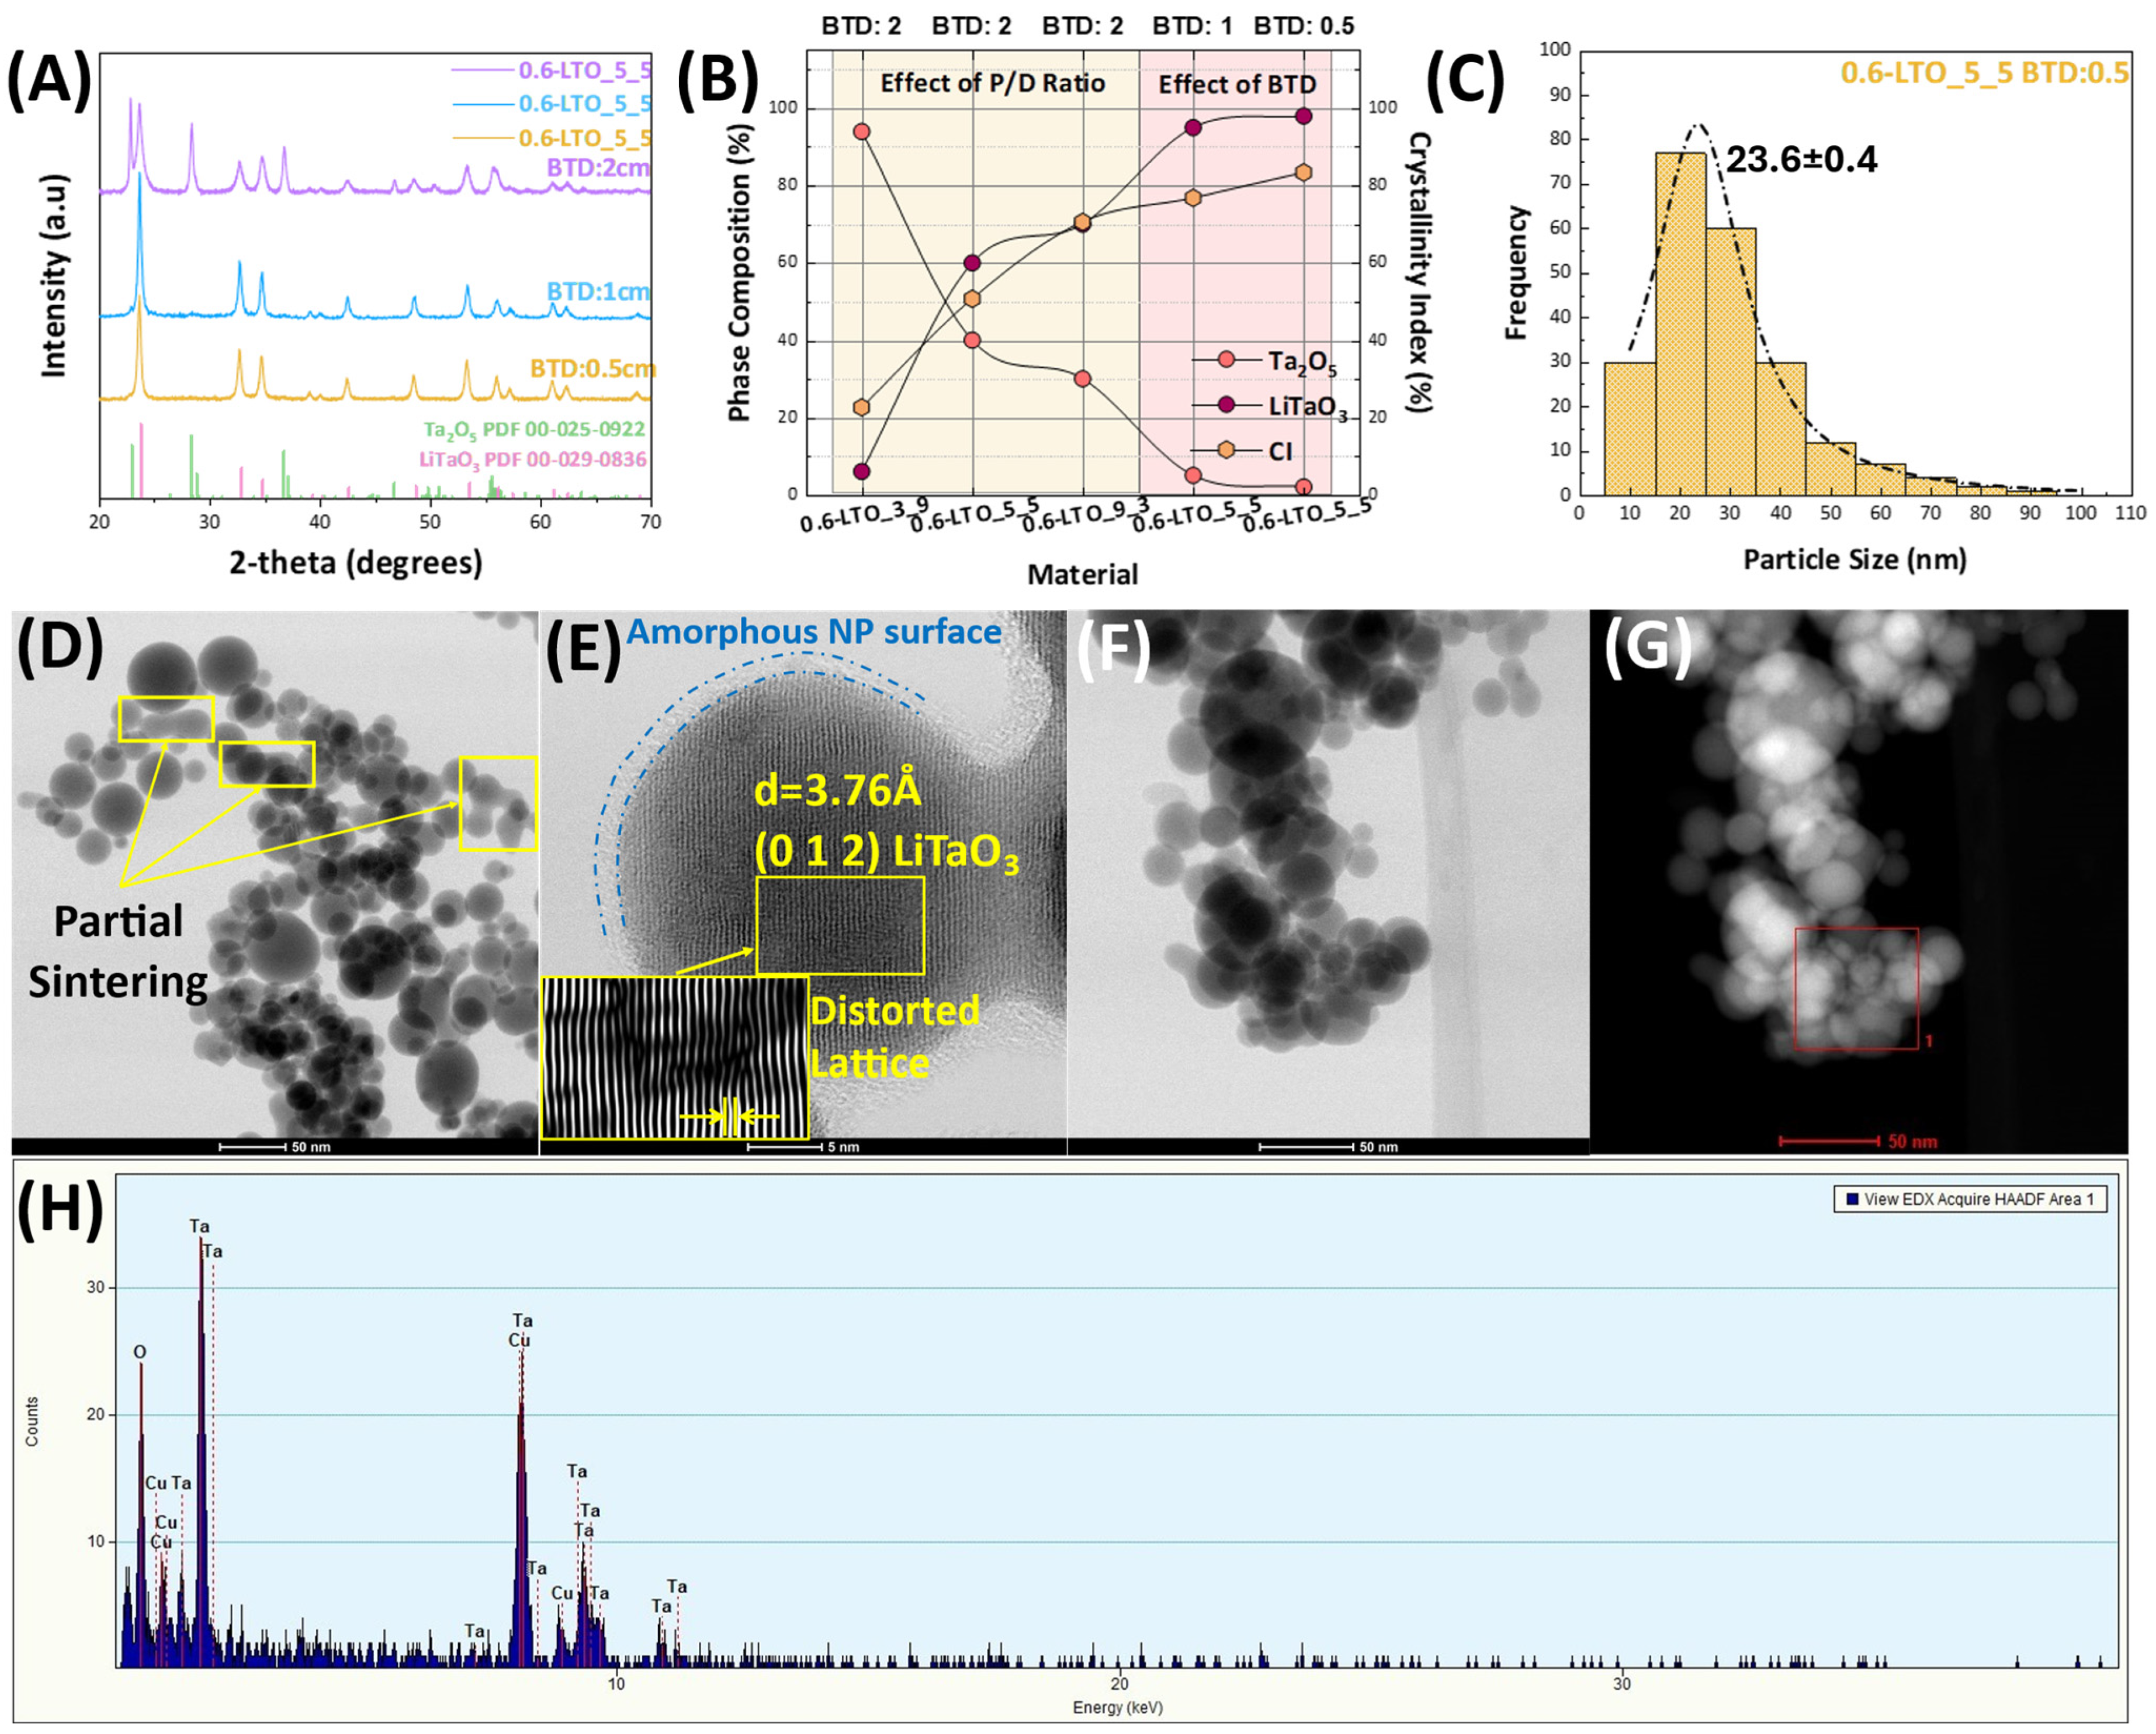
Photocatalytic H2 production from H2O: Photocatalytic experiments were conducted in a double-walled photochemical reactor (Toption instrument Co., Ltd. (TaiBai Road, YanTa District, Xi’an, China)) with a total volume of 340 mL at room temperature (25 °C), regulated by tap circulation. A 250 W mercury lamp (UV irradiation) was used as the light source, positioned at the geometric center of the photoreactor within a quartz immersion well. The irradiation power, measured in situ with a power meter at an average experimental distance of 3 cm, was 0.34 W cm−2. For each experiment, 69 mg of the catalyst was suspended in 275 mL of water/methanol mixture (methanol 20% v/v), where methanol served as a hole scavenger. To increase the photocatalytic production, 1% w/w Pt was photodeposited in situ in the reaction mixture. As the Pt precursor, dihydrogen hexachloroplatinate (IV) hydrate complex (H2Pt4Cl6. 6H2O, 99.99%, Alfa Aesar (Ward Hill, MA, USA)) was used. In order to identify and quantify the produced gases, such as H2, a Gas Chromatography system equipped with a Thermal Conductivity Detector (TCD) (Shimadzu GC-2014, Agilent Carboxen 1000 column (Stevens Creek Blvd., Santa Clara, CA, USA), Ar carrier gas) was employed.

3. Results

As shown in the XRD patterns in Figure 2 the diffraction peaks of the as-prepared LTO nanoparticles matched the structures of Ta2O5 (PDF 00-025-0922) and LiTaO3 (PDF 00-029-0836) and exhibited different phase percentages. A detailed list of the so-produced nanomaterials can be found in Table 1, where the materials are codenamed with respect to their total {Li + Ta} concentration, i.e., 0.6 M, and their corresponding P/D ratio. In all cases, the size of the crystalline domains (dXRD) was estimated from the XRD patterns using the Scherrer equation and the peaks at 22.8° and 23.8°, which correspond to (0 0 1) and (0 1 2) of Ta2O5 and LiTaO3, respectively; these are listed in Table 1. As such, dXRD refers to the crystallite nanosize, while the size of the NPs can be further characterized using TEM.
With both the {Li + Ta} concentration and the BTD kept constant, adjusting the P/D ratio from 3/9 to 5/5 and finally to 9/3 led to an increase in the LiTaO3 phase percentage at the expense of Ta2O5; see Table 1. This can be understood by taking into account that an increased P/D ratio means that more precursor is injected into/combusted in the flame; this results in longer and hotter flames and an enhanced HTPRT, which ultimately defines particle growth [30]. On the opposite side, a decrease in the P/D ratio leads to shorter flames, limiting the HTPRT. In the present case, for {0.6-LTO_3_9}, the P/D = 3/9 flame resulted in 94% Ta2O5 with only 6% LiTaO3. As we show in Figure S1 and Table S1, in the {0.6-LTO_3_9} material, a short post-FSP treatment (480 °C, 30 min) boosted the LiTaO3 formation to 74%. This demonstrates that in the as-prepared {0.6-LTO_3_9}, the Li atoms are present but not incorporated into any crystalline lattice; i.e., this material is [amorphous Li] + [Ta2O5] with little LiTaO3. The short HTPRT for P/D = 3/9 did not allow the incorporation of Li into Ta2O5 to form LiTaO3.
In general, the production of ABO3 perovskites involves rather challenging thermodynamically driven ABO3 phase formation, if we take into account the competing processes: the possibility of forming separate AOn and BOm oxides. Moreover, in the FSP process, this should be considered taking into account the speed of the process, i.e., milliseconds of exposure time for the particles in the high-temperature region [21] and temperature gradients ranging from ~3000 °C to 600 °C at the flame’s apex. In our case, the XRD data clearly showcase the dominant role of the flame profile (via the P/D) in LiTaO3 perovskite formation. An increase in the P/D ratio has a profound effect on the phase composition. At P/D = 3/9, the incorporation of Li in the nanolattice failed, since we observed only the formation of Ta2O5. At a higher P/D ratio, LiTaO3 was formed at a percentage of 70% in the case of 0.6-LTO_9_3 due to the prolongation of the time window in which the particles remained in the high-temperature region. However, we noticed that while the crystallinity of the final material increased as the P/D ratio increased from 22.6% up to 70.6%, the percentage of the LiTaO3 phase had not yet reached a maximum (please see Table 1).
Thus, the present data for LiTaO3, as well as our recent work on NaTaO3 [28], clearly exemplify that in such ABO3 perovskites, the P/D ratio serves a dual purpose, affecting both the crystallinity and the phase composition. However, further optimization was required for LiTaO3.
To examine whether Li was present, and had not yet formed a crystal structure after FSP, the FSP process was followed by annealing at 480 °C for 30 min in atmospheric air. As shown in Figure S1, a quantitative analysis of the XRD patterns exhibited an increase in the LiTaO3 percentages; therefore, we can conclude that even if the temperatures inside the flame region are more than enough for the formation of the LiTaO3 phase, the effect of the short time-window of the FSP process is overwhelming, suppressing the formation of the perovskite structure.
In our endeavor to produce pure-phase LiTaO3, we further adjusted the BTD parameter to regulate the air entrainment (AE). Process-wise, Pratsinis et al. quantitatively analyzed the role of AE during aerosol synthesis by computational fluid dynamics (CFD) and calculated the temperatures inside an enclosed FSP reactor [31]. Based on their findings, the overall temperature inside the tube decreases as AE increases due to cold gas (air) intrusion, plus dilution of the combustibles [32]. In the absence of AE, such as in a hermetically enclosed FSP burner, a recirculation vortex is expected to be formed [32], which leads to an extension of the high-temperature zone inside the reactor; therefore, the particles remain at high temperatures for a longer duration, which results in particle growth. In the intermediate case of AE = 50–100 L min−1, the vortex is diminished and the overall temperature inside the tube decreases, leading to reduced particle growth. For higher AE and a longer BTD, the flow and temperature patterns are similar to those for the open FSP configuration [31].
In our case, the formation of high-purity LiTaO3 nanopowders is closely related to the BTD parameter, in addition to the P/D ratio. In all cases, the {Li + Ta} concentration, HTPRT and P/D ratio were kept constant and a second series of LTO materials was prepared by adjusting only the BTD (see Figure 3A). By decreasing the BTD to 1 cm, with lower AE, we observed a dramatic effect on the Ta2O5 phase, which was reduced to 5% from 40%, while the LiTaO3 phase increased from 60% to 95%. A further decrease in the BTD induced small changes in the phase composition, reaching 2% and 98% for Ta2O5 and LiTaO3, respectively (see Figure 3B). Based on the CFD analysis by Pratsinis [31] and the research by Waser [32] regarding the effect of AE, altered via lifting-off the enclosing tube, during CuO synthesis, a clear correlation between the BTD and AE emerges. In the case of CuO, enclosure of the FSP reactor (AE = 0 L min−1) resulted in larger nanoparticles i.e. due to their prolonged exposure to high temperatures [33]. Increasing the BTD results in higher AE flows, smaller nanoparticles, and reduced vortex recirculation inside the tube, which subsequently leads to a decrease in the temperature flow field [31,32]. In the present case of LiTaO3, Figure 3A,B show that this increase in the temperature flow-field inside the FSP reactor, as induced by the smaller BTD values, resulted in NPs with higher LiTaO3 phase percentages. Thus, in this way we achieved the synthesis of the desired LiTaO3 perovskite phase in a single step, eliminating the need for post-FSP treatment.
An analysis of TEM images using open-access software ImageJ v.1.52a, showed a size distribution ranging from 10 to 90 nm (Figure 3C), where the majority of the particles fell between 10 and 40 nm, with a mean size of dTEM = 23.6 ± 0.4 nm. Moreover, TEM images (Figure 3D) of the highest-percentage LTO material, i.e., 0.6-LTO_5_5, BTD: 0.5, depicted the formation of quasi-spherical LiTaO3 particles forming neck-sintered aggregates, typical of FSP-produced nanoparticles. Additionally, Figure 3E shows the formation of crystalline Miller planes with spacing of d012 = 3.76 Å corresponding to the LiTaO3 phase. Energy-dispersive X-ray (EDX) analysis confirmed the existence of Ta but did not detect Li due to its low energy of characteristic radiation (Figure 3H).
The LTO materials were further studied using UV–Vis DRS and Raman spectroscopy. The energy gap values (Eg) of the materials were estimated via the Tauc plot (see Figure 4A,B), using the Kubelka–Munk method. As anticipated, none of the samples exhibited absorption in the visible region. Their spectra consisted of a single absorption band below 400 nm, which is characteristic of this group of oxides. From the Tauc plot in Figure 4B, it is evident that materials 0.6-LTO_3_9_BTD_2 and 0.6-LTO_5_5_BTD_2 exhibited Eg values of 4 eV and 3.92 eV, respectively. These values are in accordance with literature values for Ta2O5 Eg equal to 4 eV [33]. At P/D = 9/3, where the LiTaO3 percentage was higher, we observed an increment in Eg up to 4.5 eV, a value close to the literature Eg of 4.7–4.84 eV for LiTaO3 [10,11].
Figure S2 in the Supporting Information shows the Raman spectra of the as-prepared LTO materials. In all cases, the absence of well-defined Raman peaks witnesses the formation of an amorphous/semi-crystalline surface on the LTO flame-made perovskites, which is also evident from the TEM images (see Figure 3E). Post-FSP annealing at 480 °C for 30 min of the LTO materials produced Raman spectra of enhanced intensity and sharpness, shown in Figure 4C. According to the literature [34,35], the Raman bands at <250 cm−1 are attributed to the internal deformation of O-2Ta and O-3Ta, while the bands between 300 and 500 cm−1 correspond to Li-O stretching and O-Li-O bending modes. Furthermore, the bands shown at the regions between 550 and 1000 cm−1 are ascribed to the stretching modes of O-3Ta and O-2Ta [34,35]. Overall, taking into account the XRD and Raman spectra, the data in Table 2 allow us to safely conclude that, in these cases, Li atoms were successfully incorporated into the Ta2O5 lattice to form a stable LiTaO3 lattice.
Figure 4D shows the photocatalytic activity of the as-prepared and calcined materials, with the highest percentage of LiTaO3, i.e., 0.6_LTO_5_5_BTD_0.5 and 0.6_LTO_5_5_BTD_0.5_480 °C_30 min, respectively. Compared to the photocatalytic activity of pristine Ta2O5, both LTO perovskites exhibited lower H2 production under UV irradiation i.e. despite the improved crystallinity induced by the refinement of the BTD. In all cases, Pt0 was used as a co-catalyst due to its high work function of ΦPt = 5.65 eV, compared to those of other noble metal co-catalysts (ΦPd = 5.30 eV, ΦAu = 5.21 eV and ΦAg = 4.26 eV) [36], which leads to a high energy difference between the conduction band of the semiconductor and the noble metal co-catalyst. This energy difference favors the formation of a stronger Schottky barrier and the trapping of electrons in the conduction band of the semiconductor.
Moreover, the slow electron accumulation by the cocatalyst, in the case of LTO materials, leads to retardation of the H2 production rate, up to 45 min, compared to 15 min delay, observed with Ta2O5. However, these results do not come as a surprise, due to the difference in the energy gap values of Ta2O5 and LiTaO3, as we have already stated. Besides this, all ATaO3 compounds (A being Li, Na or K) feature corner-sharing TaO6 octahedra forming a perovskite-like structure. The photocatalytic activities of these materials depend on the A-site cation of the structure. It was also reported that the Ta-O-Ta bond angles have an intrinsic role in photocatalytic activity and aid in energy delocalization [37,38]. LiTaO3 exhibits a bond angle of 143°, while NaTaO3 and KTaO3 form bond angles of 163° and 180°, respectively. This makes LiTaO3 a tantalate perovskite with high Eg, high distortions and low energy delocalization compared to the aforementioned Ta-based materials.

4. Conclusions

In the present work, we extended the versatility of FSP in the family of Ta perovskites through the successful synthesis of LiTaO3. By adjusting the P/D ratio, which affects both the combustion enthalpy and the HTPRT, simultaneous crystallization and phase transformation from {amorphous Li/Ta2O5} to {Ta2O5-LiTaO3} was achieved. However, post-calcination of the flame-made Ta2O5-LiTaO3 sample enhanced the LiTaO3 phase percentage. Further optimization involved control of the AE by adjusting the BTD, which affected the overall HTPRT profile. These findings imply that the flame synthesis of LiTaO3 requires finetuning of the exposure of the NPs to the HTPRT zone to achieve high crystallinity and the incorporation of Li into the Ta2O5 nanolattice.
However, despite the bold advancements in FSP-made perovskite synthesis, some critical problems emerge. Technology-wise, lithium and tantalum are considered critical elements in Europe due to their vital roles in emerging technologies and their limited supply. Lithium is a key component in rechargeable batteries, particularly for electric vehicles and renewable energy storage systems, which are vital for the transition to a low-carbon economy. Tantalum is widely used in electronic components, such as capacitors and semiconductors, which are crucial for modern electronics and communication systems. Intensive use of Li and Ta will lead to resource scarcity, environmental impacts, supply chain vulnerabilities and economic pressures. To mitigate these challenges, there will be an increased need for technological innovation. This includes developing alternative materials, advancing recycling technologies and improving the efficiency and lifespan of products that utilize lithium and tantalum.

Supplementary Materials

The following supporting information can be downloaded at: https://www.mdpi.com/article/10.3390/nano14151257/s1, Figure S1: XRD patterns of the post-FSP treated materials; Table S1: Structural characteristics of the post-FSP treated materials; Figure S2: Raman spectra of the as-prepared LTO materials.

Author Contributions

Conceptualization, Y.D.; methodology, P.P., A.Z. and A.V.S.; formal analysis, P.P., A.Z. and A.V.S.; investigation, P.P., A.Z. and A.V.S.; data curation, P.P., A.Z. and A.V.S.; writing—original draft preparation, A.Z. and A.V.S.; writing—review and editing, A.Z., A.V.S. and Y.D.; supervision, Y.D.; funding acquisition, Y.D. All authors have read and agreed to the published version of the manuscript.

Funding

This research was funded by the project “Advanced Nanostructured Materials for Sustainable Growth: Green Energy Production/Storage, Energy Saving and Environmental Remediation” (TAEDR-0535821), which is implemented under the action “Flagship actions in interdisciplinary scientific fields with a special focus on the productive fabric” (ID 16618), Greece 2.0—National Recovery and Resilience Fund and funded by European Union NextGenerationEU.

Data Availability Statement

Data is contained within the article or Supplementary Materials.

Conflicts of Interest

The authors declare no conflicts of interest.

References

  1. Zhang, P.; Zhang, J.; Gong, J. Tantalum-Based Semiconductors for Solar Water Splitting. Chem. Soc. Rev. 2014, 43, 4395–4422. [Google Scholar] [CrossRef]
  2. Kudo, A.; Miseki, Y. Heterogeneous Photocatalyst Materials for Water Splitting. Chem. Soc. Rev. 2009, 38, 253–278. [Google Scholar] [CrossRef]
  3. Zhu, J.; Li, H.; Zhong, L.; Xiao, P.; Xu, X.; Yang, X.; Zhao, Z.; Li, J. Perovskite Oxides: Preparation, Characterizations, and Applications in Heterogeneous Catalysis. ACS Catal. 2014, 4, 2917–2940. [Google Scholar] [CrossRef]
  4. Jiao, A.; Zhang, Y.; Yang, L.; Zhao, X.; Wu, C.; Chen, T.; Zhan, R.; Huang, Z.; Lin, H. Enhanced CO2 Response of La1−xFeO3−δ Perovskites with A-Site Deficiency Synthesized by Flame Spray Pyrolysis. Ceram. Int. 2023, 49, 591–599. [Google Scholar] [CrossRef]
  5. Ahmad, T.; Farooq, U.; Phul, R. Fabrication and Photocatalytic Applications of Perovskite Materials with Special Emphasis on Alkali-Metal-Based Niobates and Tantalates. Ind. Eng. Chem. Res. 2018, 57, 18–41. [Google Scholar] [CrossRef]
  6. Ishihara, T.; Nishiguchi, H.; Fukamachi, K.; Takita, Y. Effects of Acceptor Doping to KTaO3 on Photocatalytic Decomposition of Pure H2O. J. Phys. Chem. B 1999, 103, 1–3. [Google Scholar] [CrossRef]
  7. Bienkowski, K.; Solarska, R.; Trinh, L.; Widera-Kalinowska, J.; Al-Anesi, B.; Liu, M.; Grandhi, G.K.; Vivo, P.; Oral, B.; Yılmaz, B.; et al. Halide Perovskites for Photoelectrochemical Water Splitting and CO2 Reduction: Challenges and Opportunities. ACS Catal. 2024, 14, 6603–6622. [Google Scholar] [CrossRef]
  8. Yan, S.C.; Wang, Z.Q.; Li, Z.S.; Zou, Z.G. Photocatalytic Activities for Water Splitting of La-Doped-NaTaO3 Fabricated by Microwave Synthesis. Solid State Ion. 2009, 180, 1539–1542. [Google Scholar] [CrossRef]
  9. Takasugi, S.; Tomita, K.; Iwaoka, M.; Kato, H.; Kakihana, M. The Hydrothermal and Solvothermal Synthesis of LiTaO3 Photocatalyst: Suppressing the Deterioration of the Water Splitting Activity without Using a Cocatalyst. Int. J. Hydrogen Energy 2015, 40, 5638–5643. [Google Scholar] [CrossRef]
  10. Zlotnik, S.; Tobaldi, D.M.; Seabra, P.; Labrincha, J.A.; Vilarinho, P.M. Alkali Niobate and Tantalate Perovskites as Alternative Photocatalysts. ChemPhysChem 2016, 17, 3570–3575. [Google Scholar] [CrossRef]
  11. Kato, H.; Kudo, A. Water Splitting into H2 and O2 on Alkali Tantalate Photocatalysts ATaO3 (A = Li, Na, and K). J. Phys. Chem. B 2001, 105, 4285–4292. [Google Scholar] [CrossRef]
  12. Nyman, M.; Anderson, T.M.; Provencio, P.P. Comparison of Aqueous and Non-Aqueous Soft-Chemical Syntheses of Lithium Niobate and Lithium Tantalate Powders. Cryst. Growth Des. 2009, 9, 1036–1040. [Google Scholar] [CrossRef]
  13. Kato, H.; Kudo, A. New Tantalate Photocatalysts for Water Decomposition into H2 and O2. Chem. Phys. Lett. 1998, 295, 487–492. [Google Scholar] [CrossRef]
  14. Kato, H.; Kudo, A. Highly Efficient Decomposition of Pure Water into H2 and O2 over NaTaO3 Photocatalysts. Catal. Lett. 1999, 58, 153–155. [Google Scholar] [CrossRef]
  15. Ashiri, R.; Nemati, A.; Sasani Ghamsari, M.; Sanjabi, S.; Aalipour, M. A Modified Method for Barium Titanate Nanoparticles Synthesis. Mater. Res. Bull. 2011, 46, 2291–2295. [Google Scholar] [CrossRef]
  16. Joshi, U.A.; Lee, J.S. Template-Free Hydrothermal Synthesis of Single-Crystalline Barium Titanate and Strontium Titanate Nanowires. Small 2005, 1, 1172–1176. [Google Scholar] [CrossRef]
  17. Pan, Q.; Hu, H.; Zou, Y.; Chen, M.; Wu, L.; Yang, D.; Yuan, X.; Fan, J.; Sun, B.; Zhang, Q. Microwave-Assisted Synthesis of High-Quality “All-Inorganic” CsPbX3 (X = Cl, Br, I) Perovskite Nanocrystals and Their Application in Light Emitting Diodes. J. Mater. Chem. C 2017, 5, 10947–10954. [Google Scholar] [CrossRef]
  18. Sonia; Chandrasekhar, M.; Kumar, P. Microwave Sintered Sol–Gel Derived BaTiO3 and Ba0.95La0.05TiO3 Ceramic Samples for Capacitor Applications. Ceram. Int. 2016, 42, 10587–10592. [Google Scholar] [CrossRef]
  19. Chiarello, G.; Rossetti, I.; Forni, L. Flame-Spray Pyrolysis Preparation of Perovskites for Methane Catalytic Combustion. J. Catal. 2005, 236, 251–261. [Google Scholar] [CrossRef]
  20. Zeyrek Ongun, M.; Oguzlar, S.; Akalin, S.A.; Yildirim, S. Characterization and Optical Gas Sensing Properties of BaSnO3 Synthesized by Novel Technique: Flame Spray Pyrolysis. J. Mater. Sci. Mater. Electron. 2021, 32, 15160–15170. [Google Scholar] [CrossRef]
  21. Teoh, W.Y.; Amal, R.; Mädler, L. Flame Spray Pyrolysis: An Enabling Technology for Nanoparticles Design and Fabrication. Nanoscale 2010, 2, 1324. [Google Scholar] [CrossRef]
  22. Angel, S.; Schneider, F.; Apazeller, S.; Kaziur-Cegla, W.; Schmidt, T.C.; Schulz, C.; Wiggers, H. Spray-Flame Synthesis of LaMO3 (M = Mn, Fe, Co) Perovskite Nanomaterials: Effect of Spray Droplet Size and Esterification on Particle Size Distribution. Proc. Combust. Inst. 2021, 38, 1279–1287. [Google Scholar] [CrossRef]
  23. Yuan, X.; Meng, L.; Xu, Z.; Zheng, C.; Zhao, H. CuO Quantum Dots Supported by SrTiO3 Perovskite Using the Flame Spray Pyrolysis Method: Enhanced Activity and Excellent Thermal Resistance for Catalytic Combustion of CO and CH4. Environ. Sci. Technol. 2021, 55, 14080–14086. [Google Scholar] [CrossRef] [PubMed]
  24. Psathas, P.; Georgiou, Y.; Moularas, C.; Armatas, G.S.; Deligiannakis, Y. Controlled-Phase Synthesis of Bi2Fe4O9 & BiFeO3 by Flame Spray Pyrolysis and Their Evaluation as Non-Noble Metal Catalysts for Efficient Reduction of 4-Nitrophenol. Powder Technol. 2020, 368, 268–277. [Google Scholar] [CrossRef]
  25. Psathas, P.; Solakidou, M.; Mantzanis, A.; Deligiannakis, Y. Flame Spray Pyrolysis Engineering of Nanosized Mullite-Bi2Fe4O9 and Perovskite-BiFeO3 as Highly Efficient Photocatalysts for O2 Production from H2O Splitting. Energies 2021, 14, 5235. [Google Scholar] [CrossRef]
  26. Kho, Y.K.; Teoh, W.Y.; Iwase, A.; Mädler, L.; Kudo, A.; Amal, R. Flame Preparation of Visible-Light-Responsive BiVO4 Oxygen Evolution Photocatalysts with Subsequent Activation via Aqueous Route. ACS Appl. Mater. Interfaces 2011, 3, 1997–2004. [Google Scholar] [CrossRef]
  27. Stathi, P.; Solakidou, M.; Deligiannakis, Y. Lattice Defects Engineering in W-, Zr-Doped BiVO4 by Flame Spray Pyrolysis: Enhancing Photocatalytic O2 Evolution. Nanomaterials 2021, 11, 501. [Google Scholar] [CrossRef] [PubMed]
  28. Tauc, J.; Grigorovici, R.; Vancu, A. Optical Properties and Electronic Structure of Amorphous Germanium. Phys. Status Solidi (B) 1966, 15, 627–637. [Google Scholar] [CrossRef]
  29. Patterson, A.L. The Scherrer Formula for X-ray Particle Size Determination. Phys. Rev. 1939, 56, 978–982. [Google Scholar] [CrossRef]
  30. Koirala, R.; Pratsinis, S.E.; Baiker, A. Synthesis of Catalytic Materials in Flames: Opportunities and Challenges. Chem. Soc. Rev. 2016, 45, 3053–3068. [Google Scholar] [CrossRef]
  31. Pratsinis, S.E.; Groehn, A.J.; Waser, O.; Brenner, O. Process Design for Size-Controlled Flame Spray Synthesis of Li4Ti5O12 and Electrochemical Performance. Chem. Process Eng. 2017, 38, 51–66. [Google Scholar]
  32. Waser, O.; Groehn, A.J.; Eggersdorfer, M.L.; Pratsinis, S.E. Air Entrainment During Flame Aerosol Synthesis of Nanoparticles. Aerosol Sci. Technol. 2014, 48, 1195–1206. [Google Scholar] [CrossRef]
  33. Knausenberger, H. Selected Properties of Pyrolytic Ta2O5 Films. J. Electrochem. Soc. 1973, 120, 927–931. [Google Scholar] [CrossRef]
  34. Satapathy, S.; Gupta, P.K.; Srivastava, H.; Srivastava, A.K.; Wadhawan, V.K.; Varma, K.B.R.; Sathe, V.G. Effect of Capping Ligands on the Synthesis and on the Physical Properties of the Nanoparticles of LiTaO3. J. Cryst. Growth 2007, 307, 185–191. [Google Scholar] [CrossRef]
  35. Djohan, N.; Harsono, B.; Liman, J.; Hardhienata, H. Structural, Optical Properties and Raman Spectroscopy of In2O3 Doped LiTaO3 Thin Films. Int. J. Nanoelectron. Mater. 2022, 15, 17–26. [Google Scholar]
  36. Halas, S.; Durakiewicz, T. Work Functions of Elements Expressed in Terms of the Fermi Energy and the Density of Free Electrons. J. Phys. Condens. Matter 1998, 10, 10815–10826. [Google Scholar] [CrossRef]
  37. Shi, J.; Guo, L. ABO3-Based Photocatalysts for Water Splitting. Prog. Nat. Sci. Mater. Int. 2012, 22, 592–615. [Google Scholar] [CrossRef]
  38. Kato, H.; Kudo, A. Photocatalytic Water Splitting into H2 and O2 over Various Tantalate Photocatalysts. Catal. Today 2003, 78, 561–569. [Google Scholar] [CrossRef]
Figure 1. Schematic representation of the FSP process. The HTPRT signifies the region of the FSP process where the T-profile is high enough to allow phase evolution of the nanolattice, i.e., the Li/Ta2O5→LiTaO3 transition in the present case. We used a metal tube to enclose the flame, which provided a longer HRPRT. Adjustment of the BTD allows for control of ambient air entrainment, which acts as a flame coolant.
Nanomaterials 14 01257 g001
Figure 2. XRD patterns of the as-prepared FSP LTO nano-perovskites.
Nanomaterials 14 01257 g002
Figure 3. (A) XRD patterns of the FSP optimization process. Variation of the BTD parameter allows for control of the Ta2O5/LiTaO3 phase balance. (B) Phase composition and crystallinity index percentages of the as-prepared LTO materials. (C) Size distribution graph obtained from several TEM images for 0.6-LTO_5_5, BTD: 0.5. (D,E) TEM images of the as-prepared 0.6-LTO_5_5, BTD: 0.5, where we observe partial sintering due to the HTPRT. Moreover, we have the formation of a <2 nm amorphous LiTaO3 layer and distortions of the lattice. (F,G) STEM images and (H) EDX spectrum of the as-prepared 0.6-LTO_5_5, BTD: 0.5.
Nanomaterials 14 01257 g003
Figure 4. (A) UV–Vis DRS absorption spectra of LTO NPs. (B) Tauc plots derived from UV–Vis DRS spectra for LTO nanomaterials with the arrows showing the calculated Eg values. (C) Raman spectra of the LTO nanomaterials after calcination at 480 °C for 30 min with the assigned deformation and stretching vibrations of O-2Ta and O-3Ta marked with pink, green and violet color, as well as the stretching and bending of the Li-O and O-Li-O modes with blue color, respectively. (D) Photocatalytic H2 production under UV light irradiation of 0.6_LTO_5_5_BTD_0.5 material, which possessed the highest LiTaO3 percentage with respect to Ta2O5.
Nanomaterials 14 01257 g004
Table 1. FSP process parameters and structural characteristics of the as-prepared LiTaO3 NPs.
NanomaterialP/D [Li/Ta]
Concentration (mM)
BTD (cm)HTPRT (cm)% Phase (±5%)Crystallite Size (nm) (±0.5 nm) 1CI (%) 2
Ta2O5 (%)LiTaO3 (%)dXRD Ta2O5dXRD LiTaO3
0.6-LTO_3_93/9300:30024494633.8-22.6
0.6-LTO_5_55/5300:300244406026.716.650.7
0.6-LTO_9_39/3300:30024430702427.970.6
0.6-LTO_5_55/5300:300144595-15.276.8
0.6-LTO_5_55/5300:3000.544298-2583.4
1 The ±0.5 nm uncertainty stems from the uncertainty in the estimations of the FWHM of the XRD peaks. 2 Crystallinity index (CI) = 100% − amorphous content (%). The amorphous content was determined by measuring the area under the curvature hump in the XRD baseline.
Table 2. Summarized Raman band frequencies of the calcined materials and the vibrational modes in the crystal lattice that correspond to these frequencies.
Phonon BranchAssignmentRaman Shift (cm−1)Raman Shift (cm−1)
(Literature)
E (TO1)O-3Ta and O-2Ta deformation145143 [34], 144 [35]
A1 (TO1)209208 [34], 209 [35]
E (TO4)Li-O stretching and O-Li-O bending317315 [34,35]
A1 (LO2)357356 [34,35]
E (LO5)381383 [34], 380 [35]
E (TO7)466465 [34], 463 [35]
A1 (TO4)O-3Ta stretching597596 [34,35]
E (LO8)659661 [34,35]
A1 (LO4)O-2Ta stretching863861 [34], 863 [35]
Disclaimer/Publisher’s Note: The statements, opinions and data contained in all publications are solely those of the individual author(s) and contributor(s) and not of MDPI and/or the editor(s). MDPI and/or the editor(s) disclaim responsibility for any injury to people or property resulting from any ideas, methods, instructions or products referred to in the content.

