Article

Geometry-Tuned Optical Absorption Spectra of the Coupled Quantum Dot–Double Quantum Ring Structure

1
Faculty of Physics, University of Bucharest, 077125 Bucharest, Romania
2
Faculty of Applied Sciences, National University of Science and Technology POLITEHNICA Bucharest, 060042 Bucharest, Romania
*
Author to whom correspondence should be addressed.
Nanomaterials 2024, 14(16), 1337; https://doi.org/10.3390/nano14161337
Submission received: 16 July 2024 / Revised: 4 August 2024 / Accepted: 8 August 2024 / Published: 11 August 2024
(This article belongs to the Section Theory and Simulation of Nanostructures)

Abstract

:
We investigate the energy spectra and optical absorption of a 3D quantum dot–double quantum ring structure of GaAs/Al0.3Ga0.7As with adjustable geometrical parameters. In the effective mass approximation, we perform 3D numerical computations using as height profile a superposition of three Gaussian functions. Independent variations of height and width of the dot and of the rings and also of the dot–rings distance determine particular responses, useful in practical applications. We consider that a suitable manipulation of the geometrical parameters of this type of quantum coupling offer a variety of responses and, more important, the possibility of a fine adjusting in energy spectra and in the opportunity of choosing definite absorption domains, properties required for the improvement of the performances of optoelectronic devices.

1. Introduction

Complex semiconductor nanostructures built using different configurations of quantum dots (QDs), quantum rings (QRs) or a combination of them are considered as artificial molecules having discrete energy spectra and optoelectronic properties that can be easily tuned by carefully modifying their composition, strain, size and shape. They have many potential applications in the construction of terahertz detectors and modulators, efficient solar cells, quantum information technologies, photonic quantum technologies, nanotransistors, etc. [1,2,3,4,5,6,7,8].
For these reasons, the theoretical investigations of QD and QR properties have received much attention in recent years. Since the literature is quite abundant in this direction, we will cite only a few examples from each case. For instance, there are reported theoretical studies about quantum dots coupled laterally [7] or vertically aligned [9,10], about quantum rings laterally or vertically coupled [11,12,13,14] and about vertical stacks of rings [15], double toroidal quantum rings [16], concentric double rings [17,18,19,20,21,22] and triple rings [23,24].
Considerable attention has received the combination of quantum dot with quantum ring. The growth performed with droplet epitaxy enables the combination of QD and QR into a single, multi-functional complex (QDR) [25,26]. The electronic and optical properties of QDRs without or with hydrogenic donor impurity or singly ionized double donor systems (D+2) were investigated in external electric or magnetic fields [27,28,29,30,31,32,33]. Theoretical studies of the dc current through a QDR show that it can efficiently work as a single-electron transistor or a current rectifier [34]. Many particle studies revealed that it is possible to effectively control the electron charge and spin distribution inside QDR by modifying the confinement potentials [35,36,37].
Despite the abundance of studies related to combined dots and rings, to the best of our knowledge, the quantum dot–double ring structure (QDDR) has not yet been theoretically studied even though it was experimentally constructed through droplet epitaxy in the last decade by Somaschini et al. [25]. For this reason, in the present paper we investigate the influence of geometrical parameters on the electronic and optical properties of QDDR. The influence of the external fields on this structure will be the subject of other forthcoming papers.
Because the experimental QDDR has a low response to external fields having a large diameter (about 360 nm), we propose here a smaller structure with adjustable dimensions that we verified as highly responsive to electric and magnetic fields, being in this way the most interesting for potential applications. New generations of electronic and optical devices with a decreasing size are required due to the rapid advancement in communication technology, information systems, nanoelectronics and optoelectronics. We follow the example of Hernandez et al. [32] who, starting from the experimental QDR structure given also in [25,32], investigated a smaller one in order to compare their results with previous ones [38]. Synthesis of QRs or QDs with similar dimensions has been reported by various other authors [39,40,41].
Hernandez et al. [32] also showed that the height profile of the experimental QDR can be successfully described by a superposition of Gaussian functions, which allows the independent control of the QR and QD height-to-base aspect ratios. Similar to the model proposed in [32] as a validation test, the height profile of the quantum dot–double quantum ring was built as a superposition of three Gaussian functions. This theoretical shape allows an independent control for each QR and QD height, width and position, offering the possibility of an in-depth investigation of the effects of geometry variation on the electronic and optical absorption spectra.
We perform full 3D numerical computations that allow obtaining results for the variation of the structure height on a large domain with a higher level of accuracy compared to the usual adiabatic approach for the separation of the in-plane and vertical variables [42]. We also show that the independent variation of each parameter enables the control of the electron density localization in each of the rings or in the quantum dot, a property which is crucial for the transport properties of semiconductor structures [34].
The paper is organized as follows. In Section 2 we describe the theoretical framework for QDDR. The electronic and optical properties are presented and analyzed comparatively in Section 3. Finally, the conclusions are summarized in Section 4.

2. Theory

We consider the electrons confined in the coupled quantum dot–double quantum ring of GaAs/Al0.3Ga0.7As. We use a finite confinement potential V(x,y,z) corresponding to the geometry illustrated in Figure 1.
Following [31], the height profile h ρ of the GaAs/AlGaAs structure is constructed as a superposition of three Gaussian functions, each centered on the position of the dot ( ρ d ), inner ring ( ρ 1 ) and outer ring ( ρ 2 ):
h ρ = h d exp ρ ρ d 2 w d 2 + h 1 ρ ρ 1 2 w 1 2 + h 2 ρ ρ 2 2 w 2 2
where ρ = x 2 + y 2 , h d , h 1 , h 2 are the maximum height while w d , w 1 , w 2 corresponds to the full width at 1/e from the height of the dot, inner ring and outer ring, respectively, as indicated in Figure 1b.
The atemporal Schrödinger equation for the electron in this structure reads as:
2 2 1 m r * + V x , y , z ψ x , y , z = E ψ x , y , z
The electron confining potential V r and the position-dependent effective mass of the electron m r * have expressions dictated by the axial symmetry of the structure as follows:
V r = V 0 H z + H z h ρ m r * = m * G a A s + m * G a A l A s m * G a A s H z + H z h ρ
Here H is the Heaviside step function and V 0 is the barrier potential for electrons in GaAs embedded in Ga0.7Al0.3As.
The energy eigenvalues E and eigenfunctions ψ x , y , z were calculated numerically using FEM (finite element method) as incorporated by COMSOL Multiphysics® software (v. 5.6) [43]. The spatial domain of integration of the model has a cylindrical shape, coaxial with the QDDR, having a radius and a height twice the corresponding dimensions of the structure. We used an adaptative, free tetrahedral-type mesh and Dirichlet conditions for the boundary of the cylindrical domain.
When the QDDR system is under the action of a probe laser of variable angular frequency ( ω ), the intraband absorption coefficient for transitions starting from the ground level can be written, using the compact density-matrix formalism under the steady state conditions, as [44]:
α 1 j ω = ω N μ 1 j 2 T 2 ε 0 c n r J 0 2 μ j j μ 11 E 0 ω J 2 2 μ j j μ 11 E 0 ω 1 + T 2 2 ω ω j 1 2 + μ ¯ 1 j 2 E 0 2 T 1 T 2 / 2
where
μ ¯ 1 j = μ 1 j J 0 μ j j μ 11 E 0 ω + J 2 μ j j μ 11 E 0 ω
In Equations (4) and (5), J 0 , J 2 are the first-kind Bessel functions of orders 0 and 2, N is the electron density, T1 is the population decay time and T2 is the dephasing time, ε 0 is the vacuum dielectric permittivity, nr is the refractive index and c the vacuum speed of light. E 0 is the amplitude of the probe laser electric field, and μ i j are the dipole moment matrix elements between the states i and j. However, because of the axial symmetry, all μ j j are negligibly small, so the part related to the Bessel functions is always 1.

3. Results

In this section, we present the numerical results concerning the geometry effects on the electronic and optical properties of the QDDR structure. The parameters used in our computations are: m * G a A s = 0.067 m 0 , m * G a A l A s = 0.093 m 0 (where m 0 is the mass of a free electron), V 0 = 262 meV [45], n r = 3.55 , T1 = 10 ps, T2 = 5 ps [44], N = 5 × 10 22   m 3 .
If not specified otherwise, the QDDR parameters are: h d = 20 nm, w d = 8 nm, ρ d = 0 for the dot (QD), h 1 = 7 nm, w 1 = 2.5 nm, ρ 1 = 14 nm for the inner ring (QR1) and h 2 = 3.5 nm, w 2 = 2.8 nm, ρ 2 = 21 nm for the outer ring (QR2). The parameters for the dot and inner ring are taken from [32] to facilitate the comparison of the results. The values for the outer ring parameters are chosen proportional to those of the inner ring, their ratios being the same as for the experimental structure from [25]. We varied each parameter independently in order to observe its specific influence on the energy spectra and absorption coefficient. We consider that ten levels of energy are relevant for the electronic and absorption properties in all the considered cases. In the following, only the most representative results are presented. We mention that, in all calculations, the QDDR structure keeps always its cylindrical symmetry.

3.1. Electronic Properties of the Quantum Dot–Double Quantum Ring

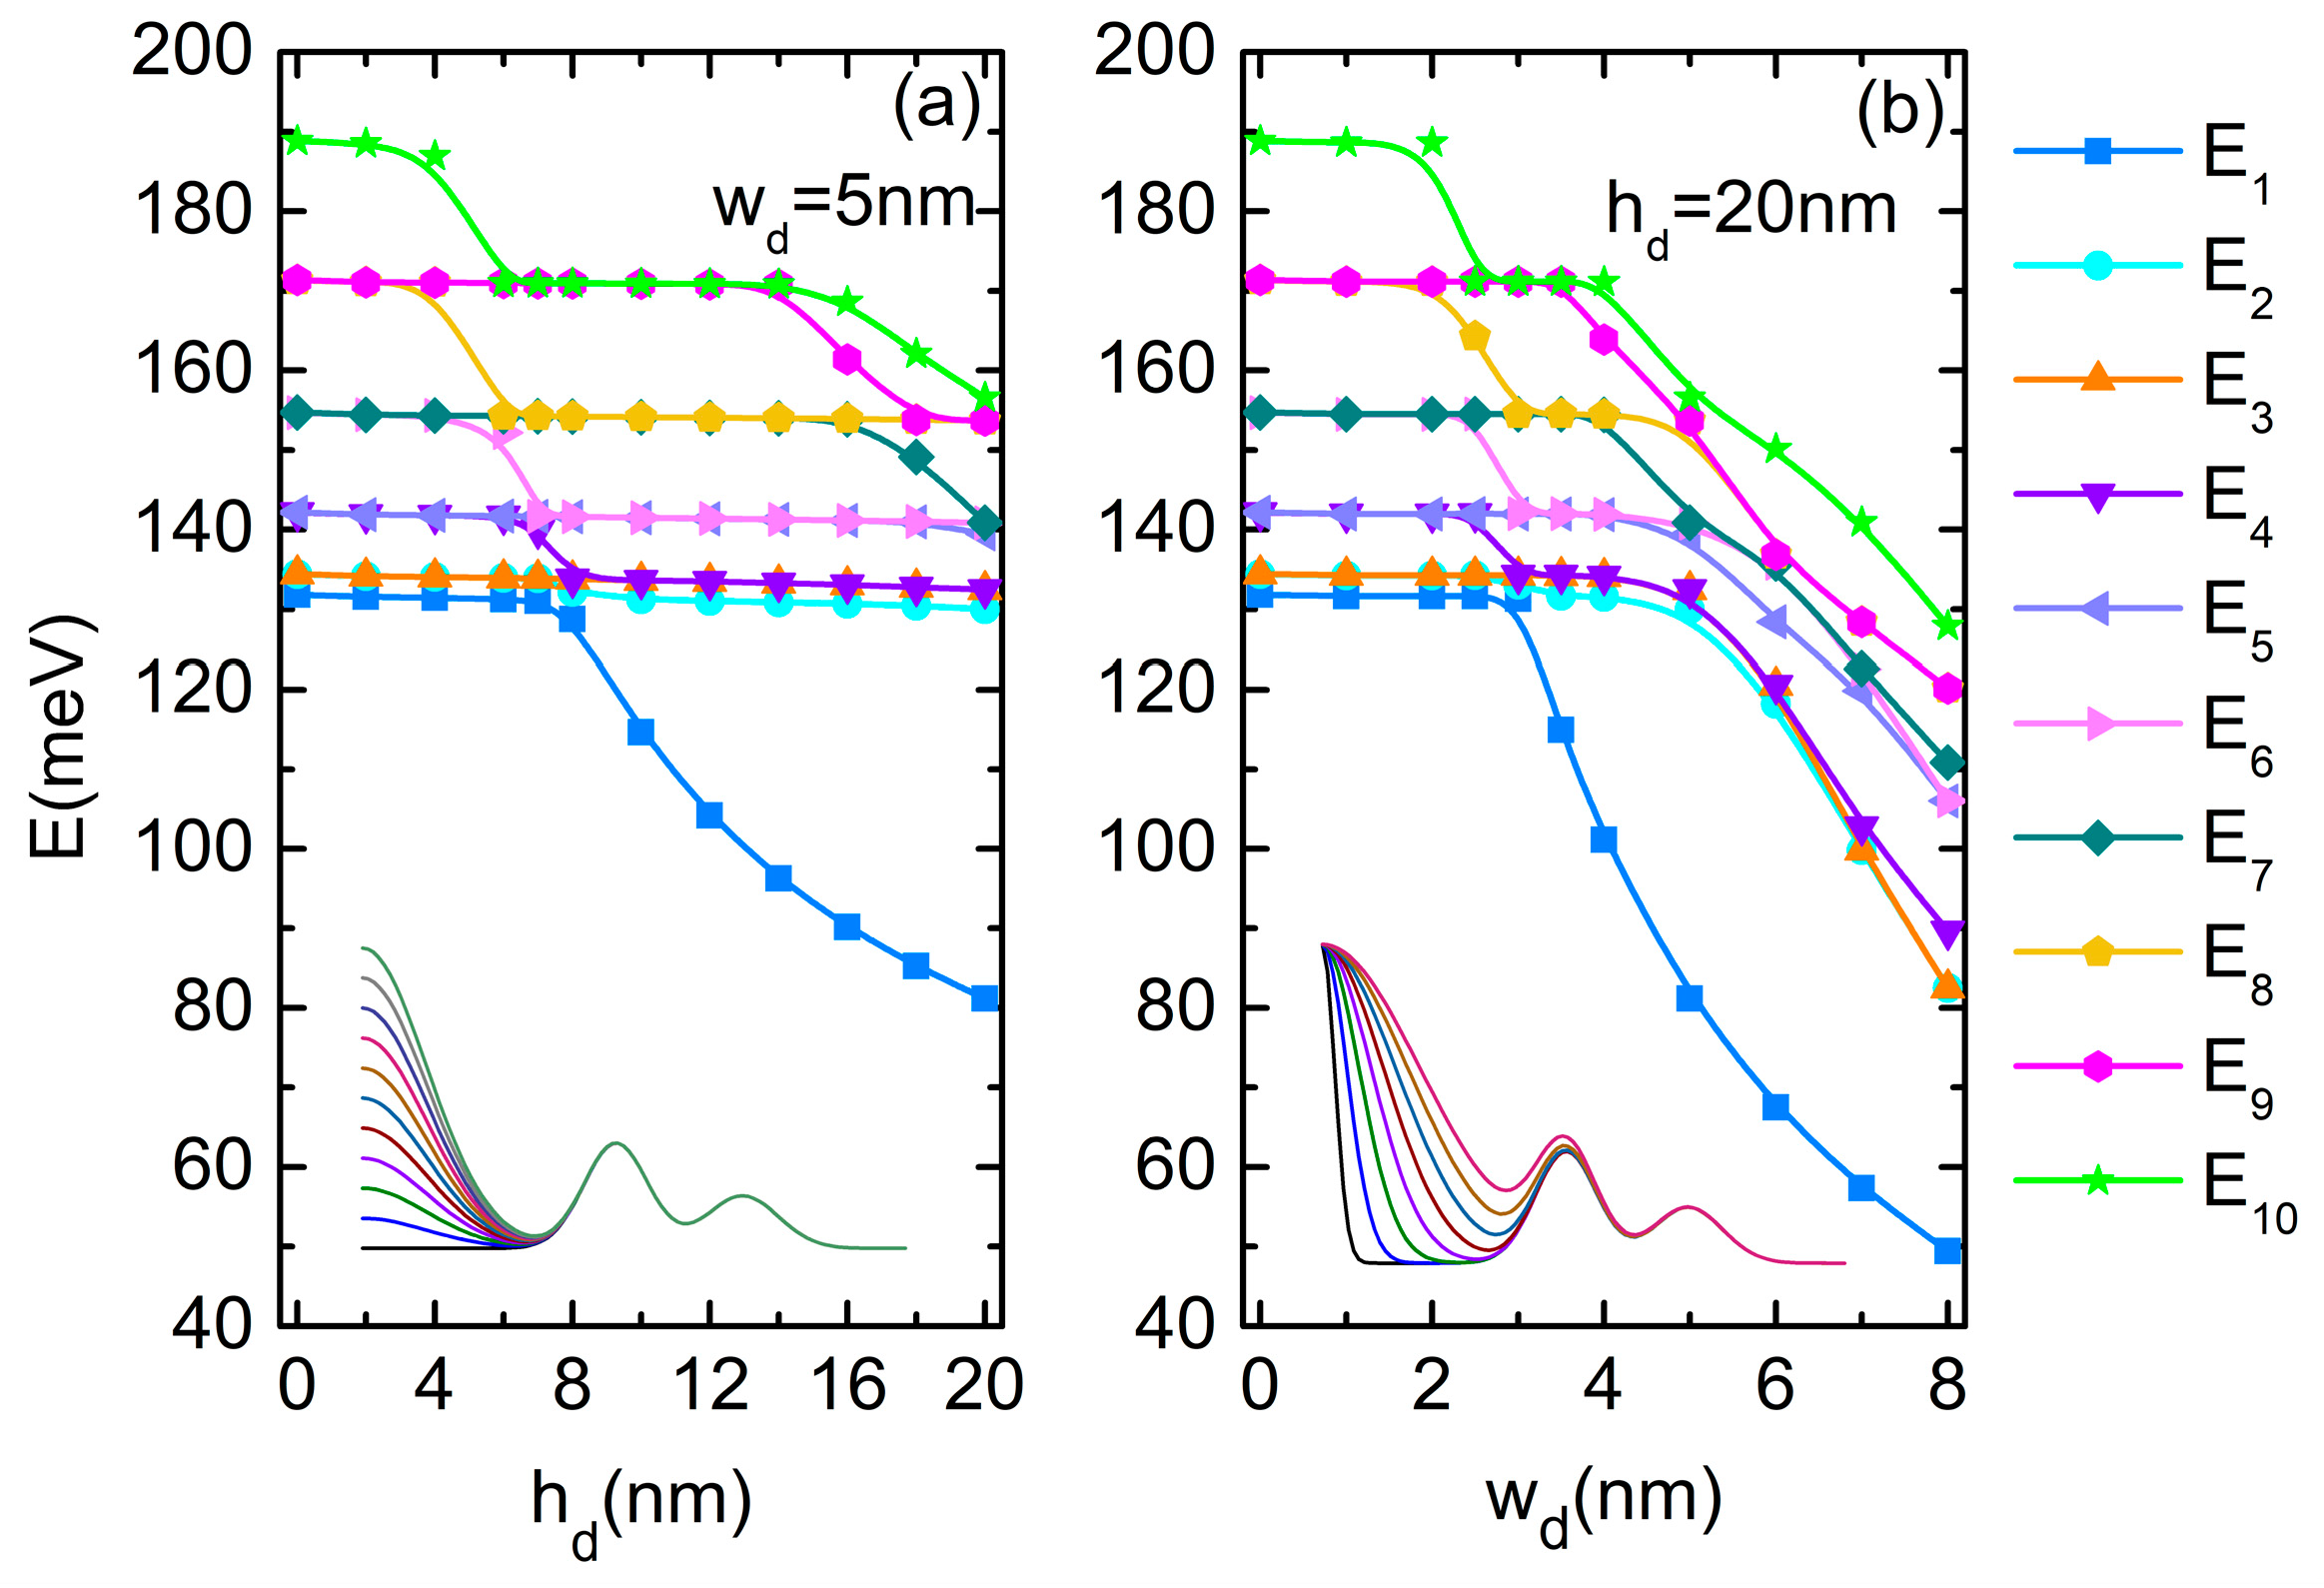
We analyze first the influence of the central dot parameters. Figure 2a,b present the variation of the electron energies in QDDR as functions of the dot height h d (at w d = 5 nm) and as a function of wd (for hd = 20 nm), respectively. Inset of each figure are the shapes of the semi-profiles for the chosen parameters h d and w d , respectively, of the central dot. Additional simulations showed that for other choices of wd, the energy variation is less affected.
The spectra from Figure 2a,b show multiple anti-crossings due to the lowering of the energy of the state confined into the dot at the increment of h d and w d , respectively. Similar anti-crossing in the energy spectra were obtained before by Hernandez et al. [32] for the dot–single ring structure.
An essential support in understanding the energy behavior is given by the 3D representations of the wave functions shown in Figure 3a,b using 500 contour lines.
A limiting case is the quantum dot absence ( h d = 0), when the structure corresponds to a double concentric quantum ring (DQR). The ground level is single, with the quantum magnetic number m = 0, and, due to the cylindrical symmetry, all the other levels form degenerate pairs (with quantum magnetic numbers m, −m) [45]. As shown in Figure 3a, first row, the wave function (WF) of the ground state ψ1 has a maximum located on the inner ring and a minimum on the outer one because of the greater height of the inner ring. Its energy is E1 = 131.8 meV. The WFs of the second and third states (with m = 1, −1) have one maximum and one minimum, both located on the inner ring. The fourth and fifth states’ WFs (with m = 2, −2) have two maxima and two minima, all located on the inner ring, and so on. However, the tenth state is a single state, completely symmetrical (m = 0) but, contrary to ψ1, with a minimum located on the inner ring and a maximum on the outer ring.
As the height or width of the central quantum dot grows, the effects in the energy levels (Figure 2) and wave function localizations (Figure 3) start to be significant after some critical values. The WFs illustrated in the first column in Figure 3 show the effect of the increasing of the quantum dot height or width on the ground state WF and, implicitly, on the probability of the electron localization in QDDR.
For small values of h d , the WF of the ground state keeps its maximum on the inner ring. At h d = 6 nm, the energies of the excited levels decrease abruptly and E6 is now the single level with a WF maximum into the dot (second row of Figure 3a). New degenerate pairs of levels are formed (E9, E10), (E8, E7) and, due to their re-grouping, multiple anti-crossing points appear in the energy spectrum of Figure 2a. At h d = 8 nm (third row of Figure 3a), ψ1 and ψ2 completely change their configuration: ψ1 has a maximum within the dot and a minimum on the DQR, while for ψ2 the locations of maxima and minima are reversed. The formation of new pairs (E3, E4), (E5, E6) determines other anti-crossing in the spectrum. At further increment of h d , the WF of the ground state becomes more and more confined into the dot and its energy decreases as a direct consequence of h d raise. Up to h d = 14 nm, the degenerate pairs maintain a constant energy, because their WFs are confined in the DQR. At h d = 16 nm, ψ2–ψ8 are eigenfunctions with maxima and minima located mainly on QR1. ψ9 and ψ10 present maxima and minima mainly within the dot (fourth row of Figure 3a), and the corresponding states separate their energies because, as expected, (E10, E11) becomes degenerate. Finally, at h d = 20 nm, ψ2–ψ4 and ψ6–ψ9 have maxima and minima located mainly on QR1, ψ5 is confined mainly into the dot (as the third single state, completely symmetrical) as well as ψ10, leading to new anti-crossings in the energy spectrum (last row of Figure 3a).
As seen in Figure 2b, the energies are more sensitive in their decreasing tendency to the dot width variation, so their control and/or adjustment can be chosen accordingly. The multiple anti-crossing points in the energy spectrum are explained by the WF localization illustrated in Figure 3b. For instance, at w d = 2 nm, all the lowest nine states are confined in DQR, while ψ10 has a maximum within the dot and minima on DQR (first row of Figure 3b). The first two states change at w d = 3 nm, extending over the whole QDDR (second row of Figure 3b), while the others are confined in DQR, leading to a re-grouping of degenerate levels and multiple anti-crossings in the energy spectrum. At the further increment of w d , due to the dot extension over the inner ring, the ground state energy decreases since the WFs are confined more and more into the dot and QR1. Finally, at w d = 8 nm, ψ1–ψ7 and also ψ10 are all confined into the dot and QR1, while ψ8–ψ9 extend over QR2 (last row of Figure 3b).
In the second step of our analysis, we are interested in the inner ring influence on the energy spectrum. All the calculations are performed for h d = 8 nm and w d = 8 nm, at which a significant variation of the ground state energy is obtained. Our computations show that at higher values of h d , low or insignificant variation can be observed for the ground state energy, similarly to [32].
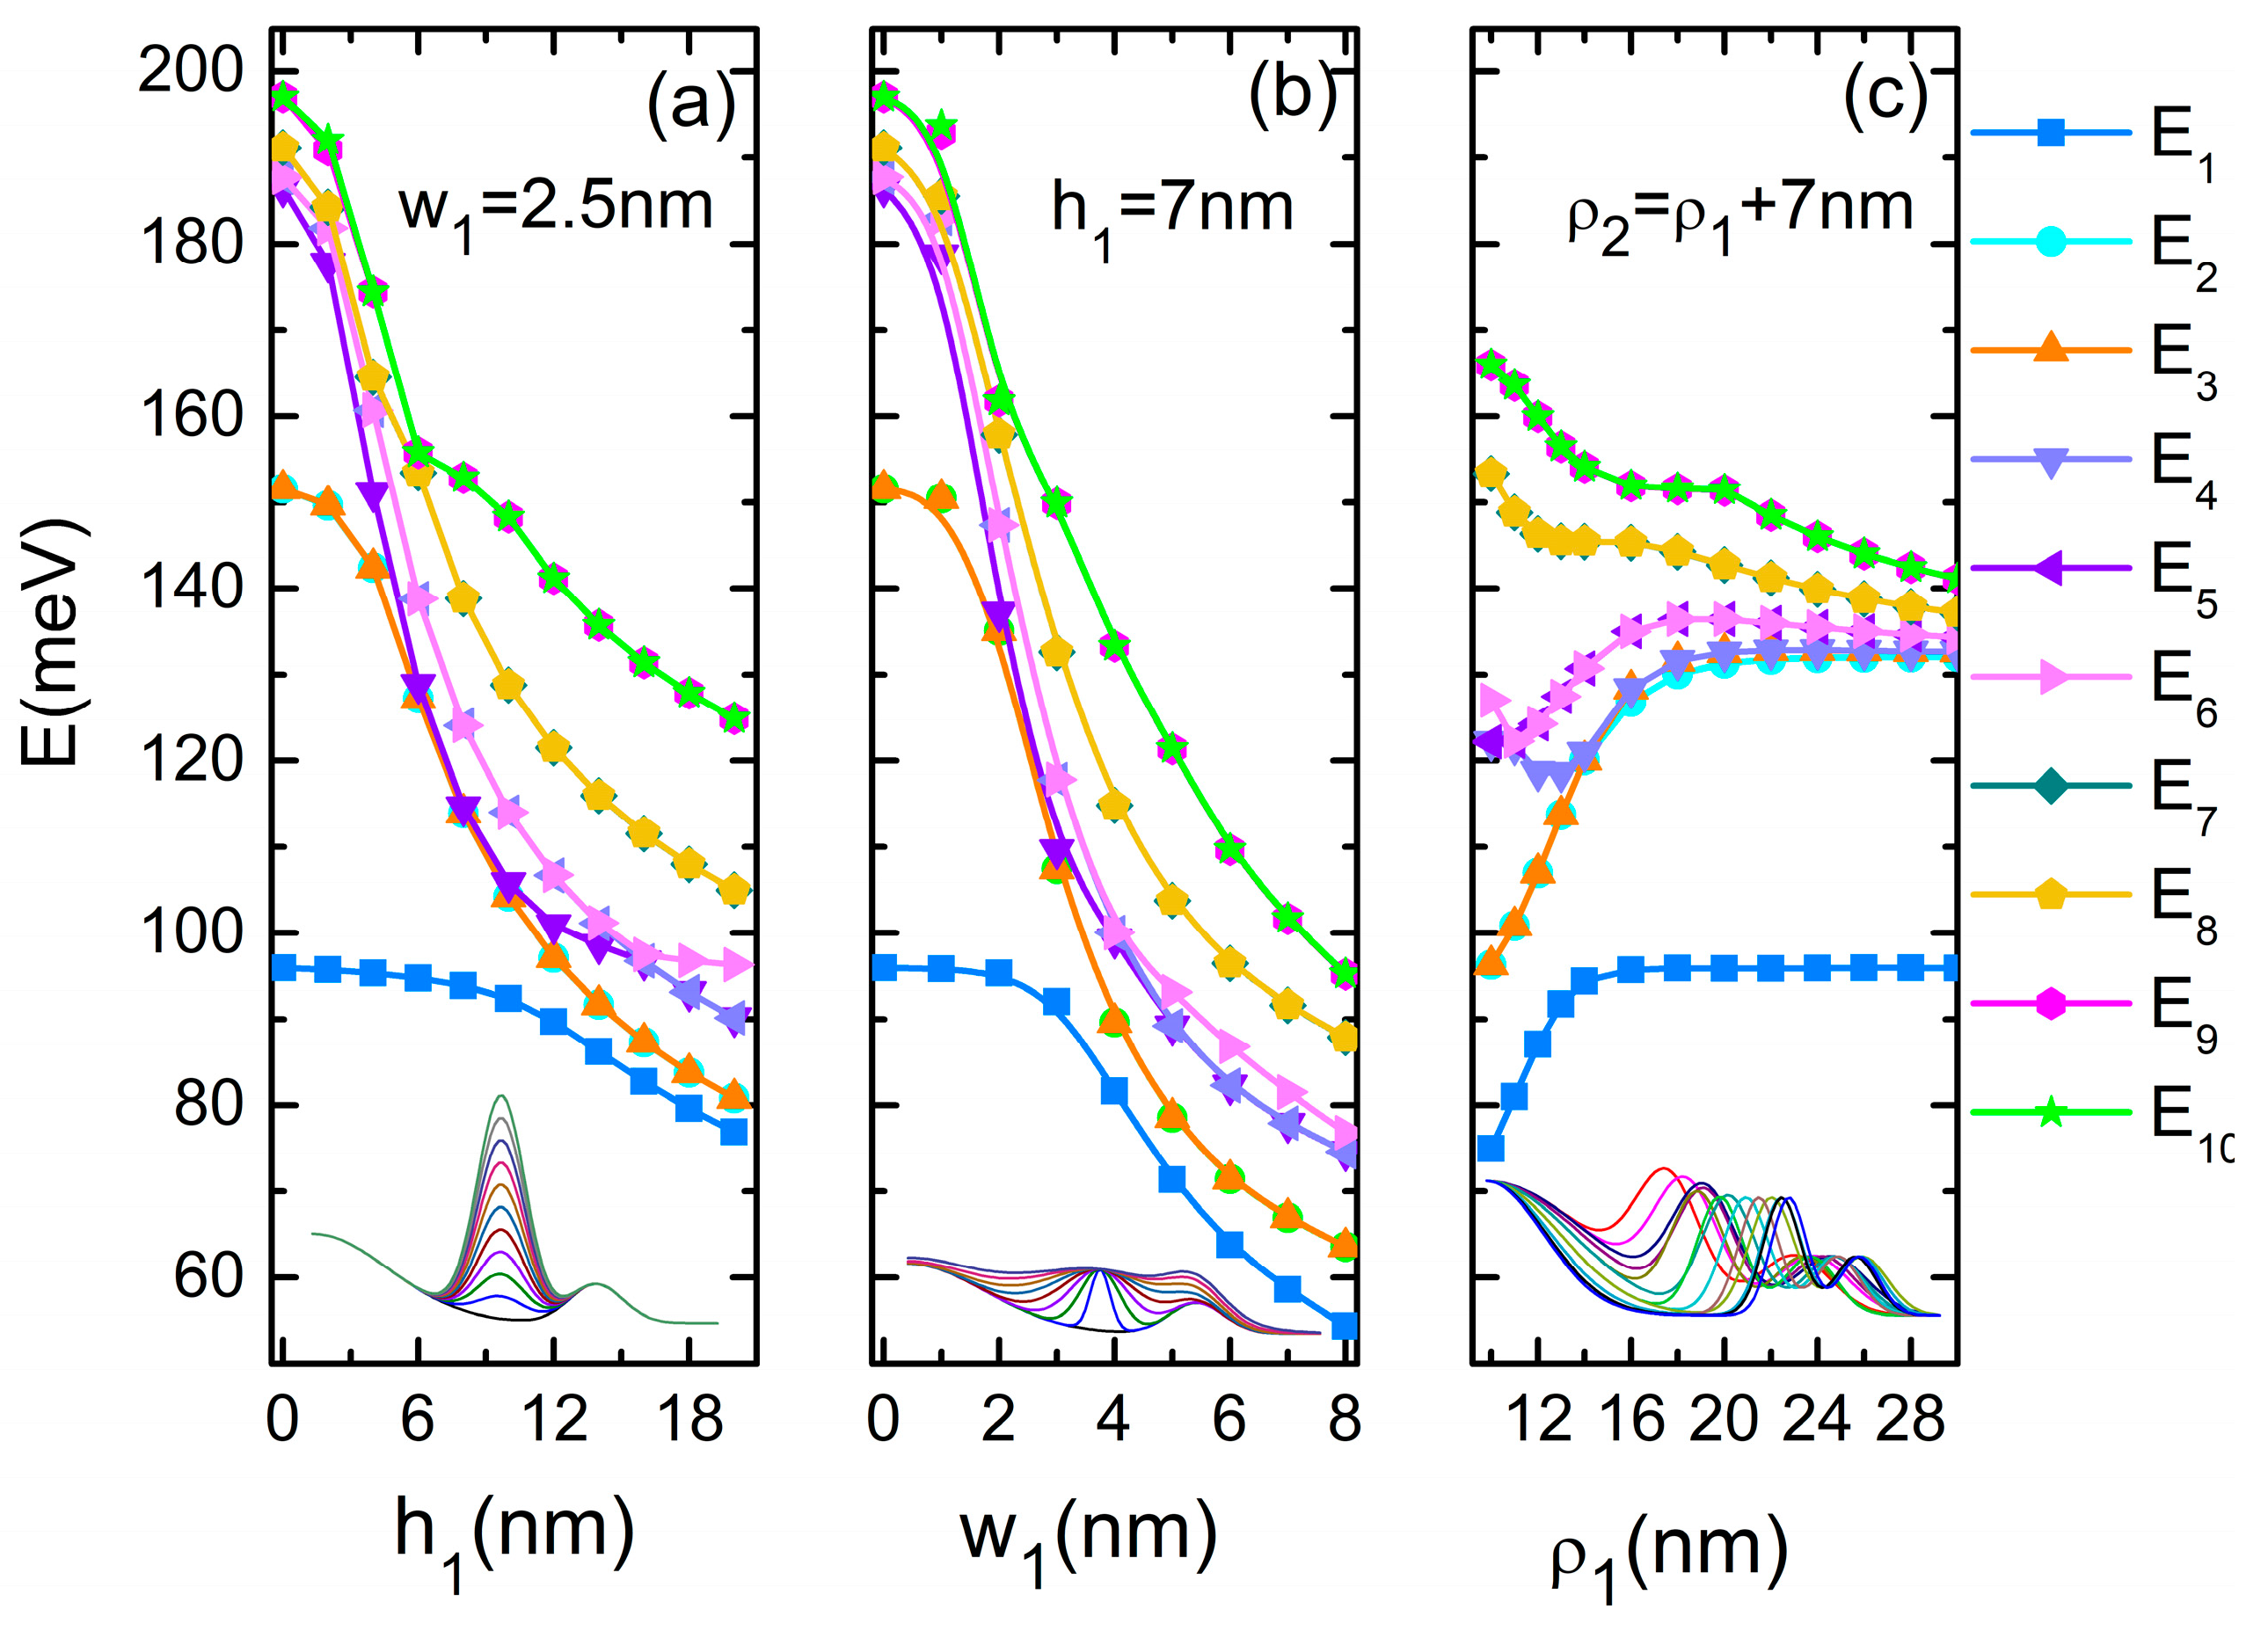
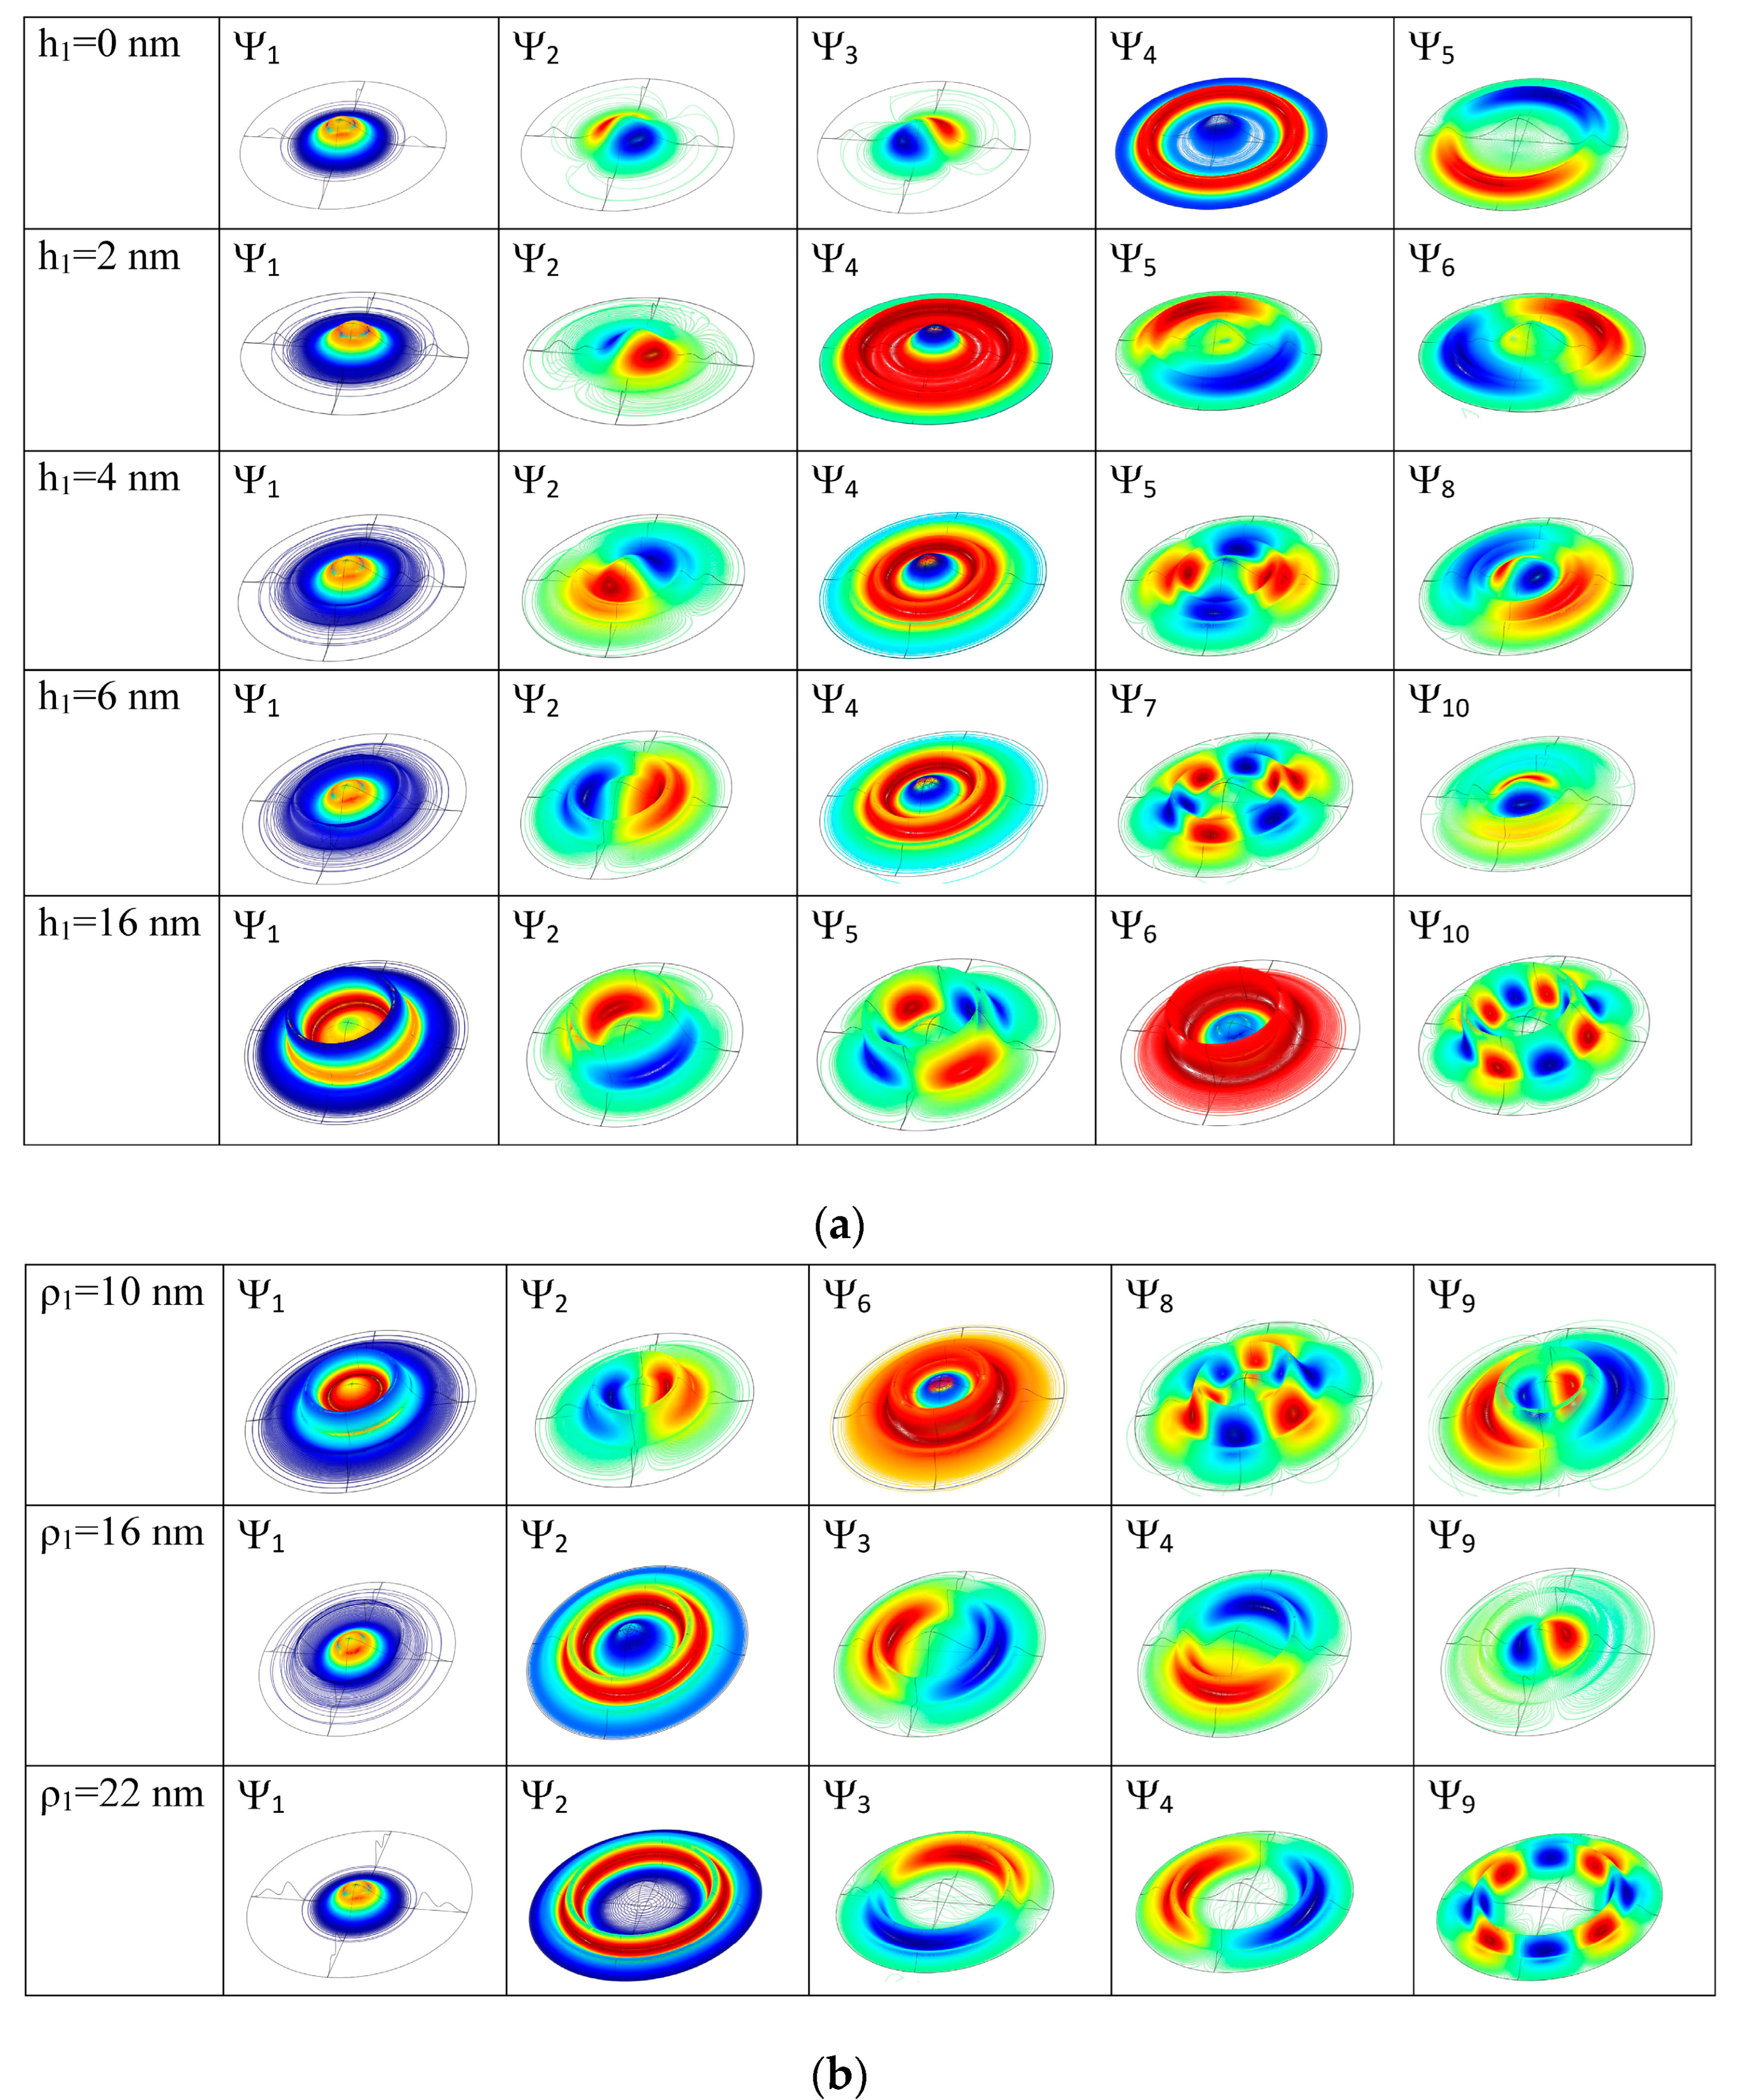
Figure 4 presents the electron energies’ response to the variation of the geometric dimensions of QR1. This is discussed in correspondence to the WFs from Figure 5. For the limiting situation h 1 = 0, the structure corresponds to a quantum dot coupled with the outer ring (Figure 4a). As seen in Figure 5a, first row, the lowest three states are mainly the dot states while, beginning with the fourth level, the upper states are mainly QR2 states. The ground level is single and coincides with the ground level of the QD (E1 = 95.93 meV). (E2, E3) form a degenerate pair and E4 is a single state with a different radial function than ψ1, while (E5, E6), (E7, E8), (E9, E10) form new degenerated pairs. For h 1 = 2 nm (Figure 5a, second row), the first three states are mainly located in QD, but the upper ones extend over QDDR, because the presence of QR1 facilitates the coupling between the QR2 and the dot. When h 1 = 4 nm (Figure 5a, third row) the lowest three states extend over the dot and inner ring and the fourth state over the whole QDDR with a maximum on the inner ring (single state). WFs ψ7 and ψ8 have m = 1, −1 like ψ2, ψ3 but different radial function. At h 1 = 6 nm, due to the anti-crossing between the degenerate levels (E7, E8) and (E9, E10), ψ9, ψ10 have now m = 1, −1.
At the further increment of h 1 , the lowest three states cover more and more of the whole structure. There is a clear transition (around 10 nm) to a linear decrement in the ground state energy. This is generated by the spreading of this state over the whole QDDR, indicating a lowering of the confinement. Around h 1 = 16 nm, E6 becomes the single level due to the anti-crossing between E4 and the degenerate levels (E5, E6). Moreover, the WFs ψ1–ψ6 extend the whole structure while ψ7–ψ10 are confined mainly into the DQR (last row in Figure 5a).
Figure 4b illustrates the variation of the electron energies as functions of w 1 . We can observe a great similarity with Figure 4a (for this reason, we do not represent the WFs), except that the structure is more sensitive to w 1 increment. For instance, the passage to a linear decrement in the ground state energy is observed for w 1 > 3 nm.
Figure 4c presents the variation of the electron energies as functions of ρ 1 . We modified ρ 1 from 10 nm to 30 nm, maintaining a constant distance between QR1 and QR2 ( ρ 2 = ρ 1 + 7   nm ). Therefore, we modified only the distance between QD and DQR.
We observe that the energies of the lowest three states increase and then stabilize at constant values as ρ 1 grows. On the contrary, the energies of the upper states decrease, first rapidly and then more slowly. This behavior can be explained in connection with the selected WFs illustrated in Figure 5b.
At ρ 1 = 10 nm, ψ1–ψ5 extend over the whole QDDR, while ψ6–ψ8 are confined mainly in DQR (with very little extension in the dot) and ψ9–ψ10 completely cover the dot. E1 and E6 are single states while all other levels form degenerate pairs (Figure 5b, first row). Beginning with ρ 1 = 16 nm, ψ1, ψ9, ψ10 are almost confined into the dot, while ψ2–ψ8 are located in DQR with a little extension into the QD region (Figure 5b, second row). Thus, E1, E2 are single levels, all other levels forming degenerate pairs. At the further increment of ρ 1 , E1 and E2 stabilize at constant values of 95.9 meV and 131.9 meV, respectively, because they are the ground states of the QD and DQR. Beginning with ρ 1 = 22 nm, all excited states are WFs of DQR due to the increasing distance between QD and DQR (Figure 5b, last row). However, the energies of the upper levels still decrease as their WFs are restrained more and more in the DQR region.
In the third step of our analysis, we are interested in observing the effects of the parameters related to the second ring on the energy spectra.
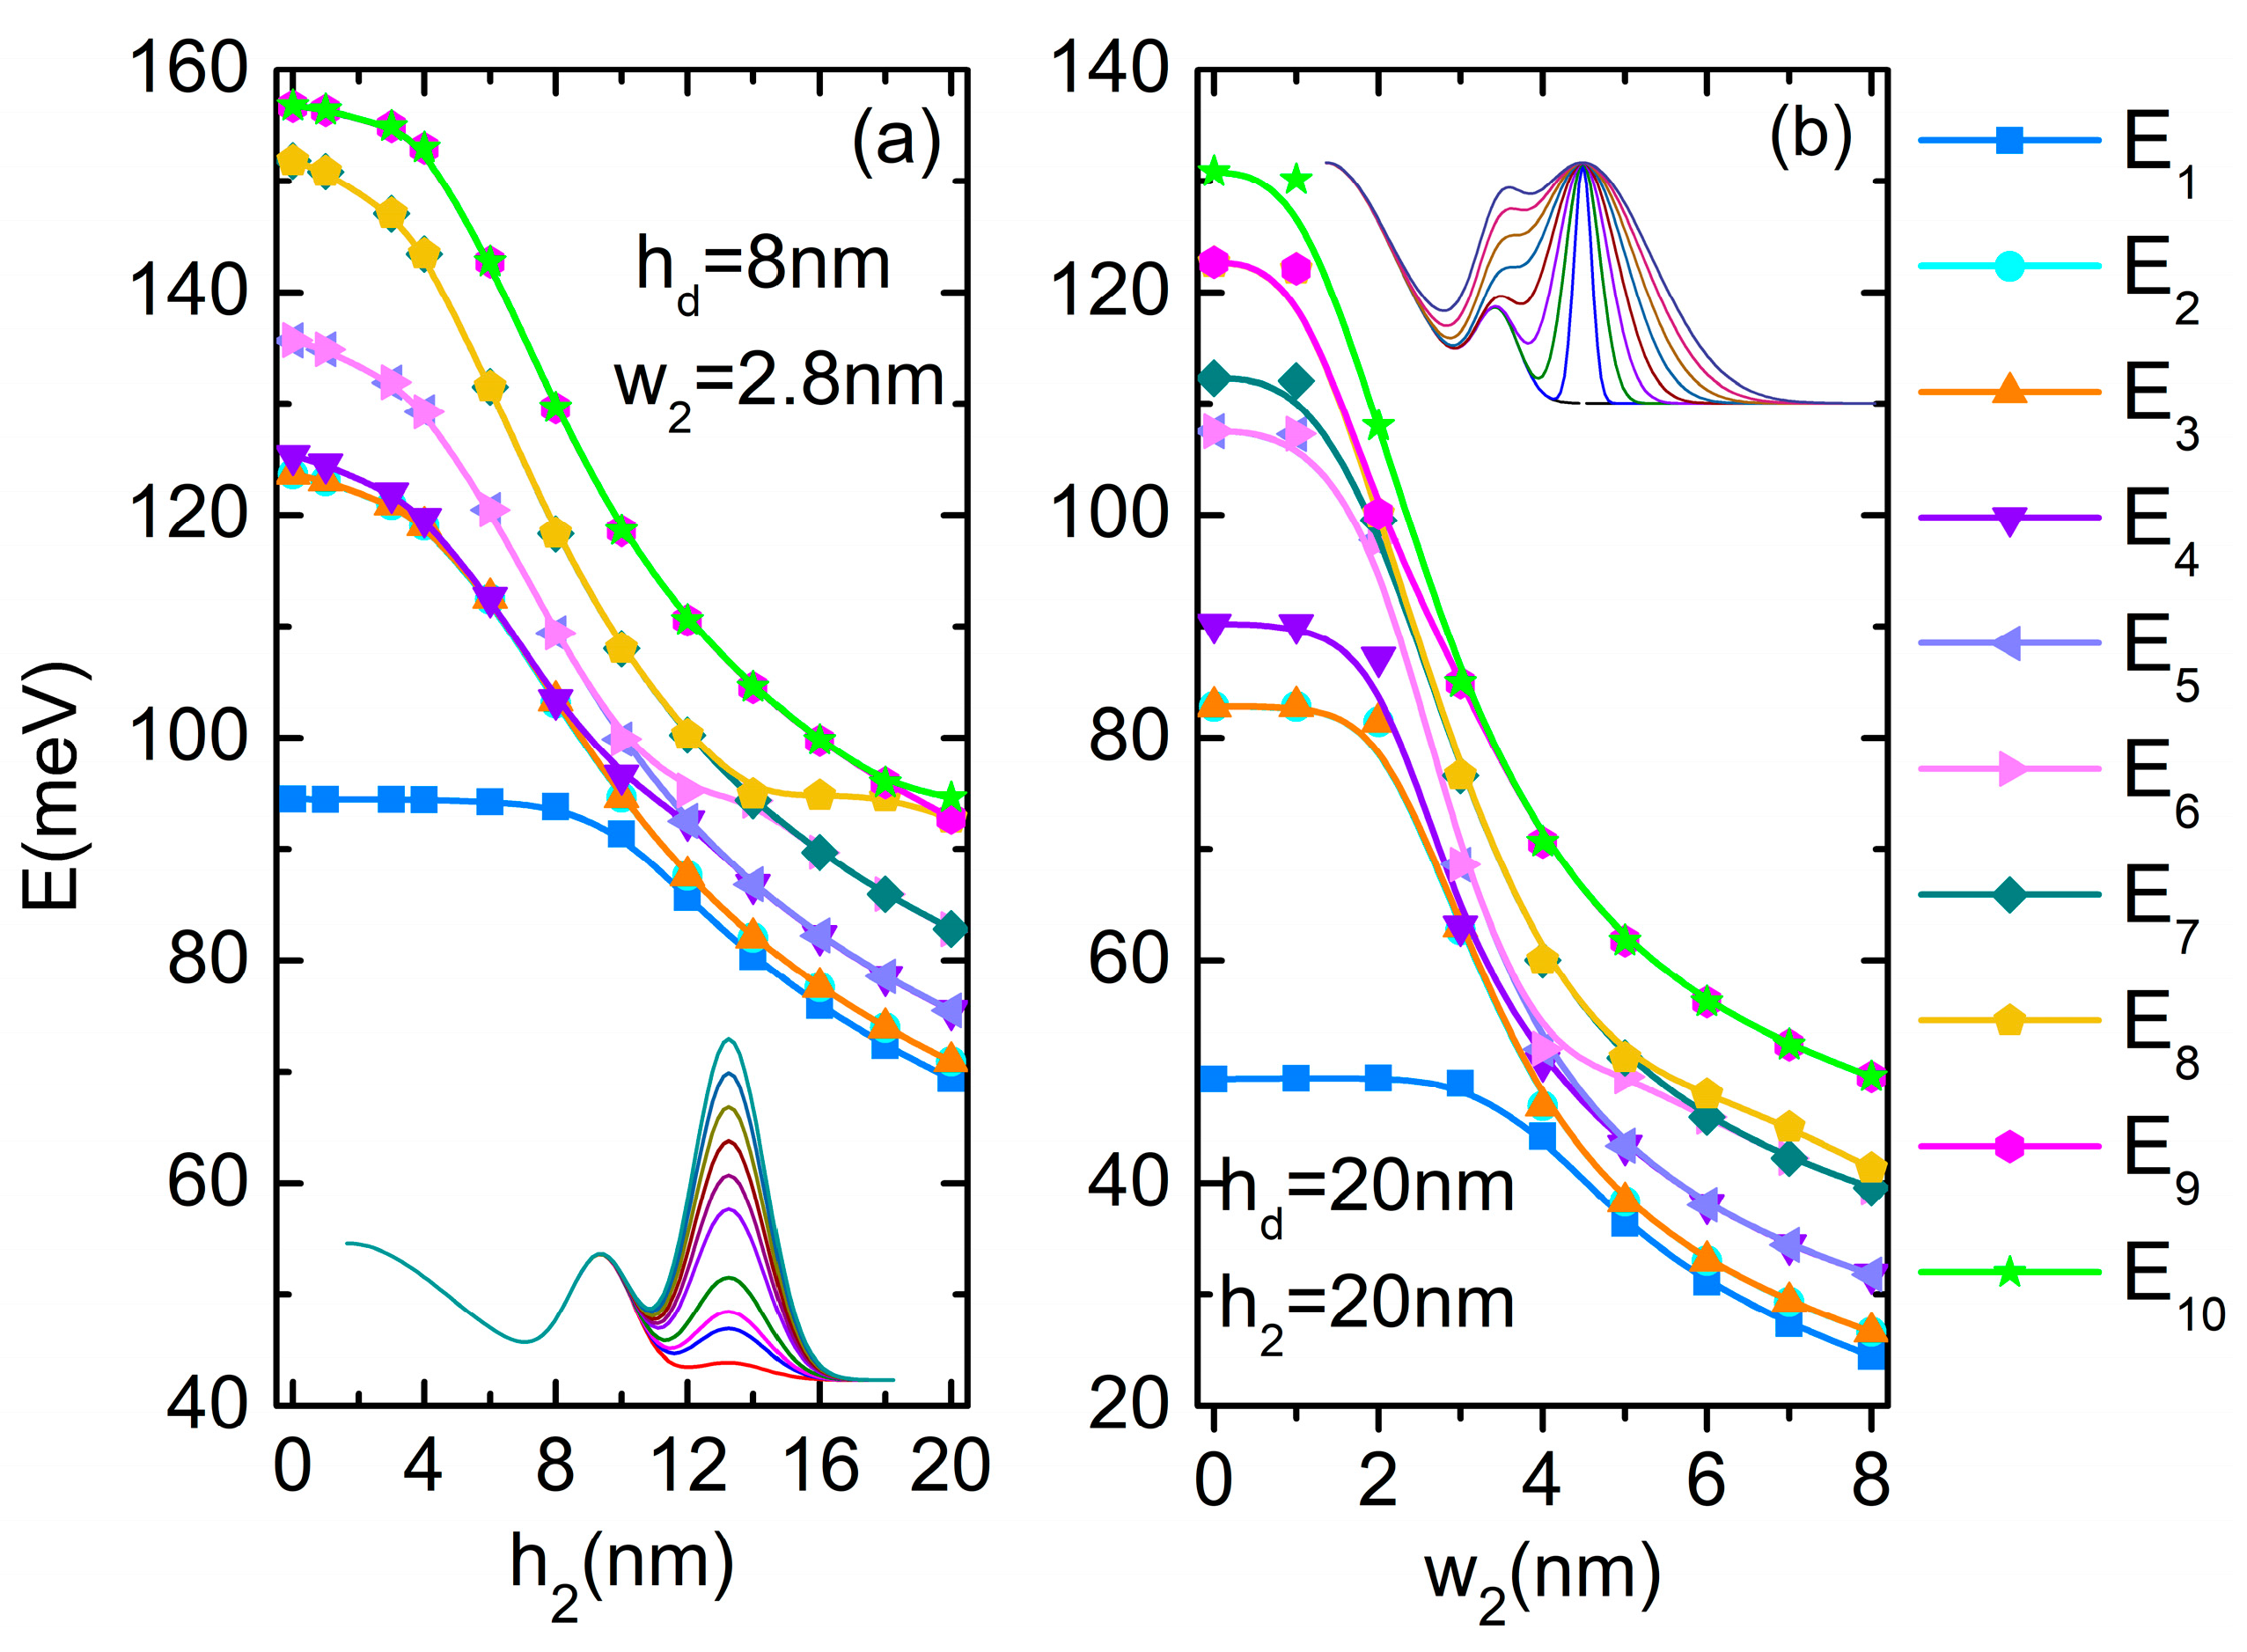
Figure 6a presents the variation of the electron energies as functions of h 2 at w 2 = 2.8 nm and h d = 8 nm. As above, it is discussed in correspondence to WFs from Figure 7a. At h 2 = 0, the structure is a dot coupled with one ring (QR1). The ground level has the energy 94.48 meV, close to the ground state energy of the dot (95.93 meV). The fourth state is single, with the WF minim on QD and maxim on QR1. Excepting E1 and E4, all other levels come into pairs. At h 2 = 6 nm, the energy of the ground state remains constant because its WF is still maxim on the QD. The second state becomes single (Figure 7a, second row). At h 2 = 10 nm, there is a decrease in the energy of the ground state because its WF spreads over the whole structure. The single state is ψ4 leading to new anti-crossings that propagate in the energy spectrum at h2 increment, because of the rather constant energy of this single state (since around 94.5 meV is confined mainly in the QD—Figure 7a, third row), while all other energies decrease. For instance, at h 2 = 12 nm, the single state is the sixth (Figure 7a, fourth row), and for h 2 = 14–18 nm it becomes the eighth state. Finally, at h 2 = 20 nm, ψ10 is confined mainly into the QD, with energy close to the QD ground state, opposite to the lowest nine states, which are confined mainly into the DQR (Figure 7a, last row).
Figure 6b shows the modification of electron energies with w 2 variation for h 2 = h d = 20 nm. We observe similarities with Figure 6a especially in the decreasing tendency, even if the dot height is different. The ground state energy for w 2 = 0 is 49.34 meV, lower than for the QD ground energy (51.09 meV for w d = 8 nm, h d = 20 nm) because of the WF extension over QR1 (Figure 7a, first row). The second single state with a WF minim on QD and maxim on QR1 is ψ4. The upper levels are not all paired because of the appearance of a third single level, E7, a completely symmetrical state with WF maxima on both QD and QR1. At w 2 = 2 nm, E7 comes very close to (E8, E9) but it is not degenerate with them, as can be seen in Figure 7b, second row. Afterward, the energy of this third single state decreases more slowly than E8–E10, going out from the analyzed levels. At w 2 = 3 nm, the second state becomes single (Figure 7b, third row) and, as seen from Figure 6b, its energy decreases quickly up to w 2 = 4 nm, then slowly reduces at the further increment of w 2 . At w 2 = 8 nm, the ground state extends over the whole QDDR, while ψ8 is the second single state, confined mainly in the QD (Figure 7b, last row).

3.2. Optical Properties of the Triple Concentric Quantum Rings

We consider only the transitions starting from the ground state, induced by a probe laser of intensity 5 × 10⁷ W/m2. We discuss the nonlinear optical absorption of QDDR in connection with the oscillator strength that is defined as
O 1 j = 2 m * G a A s Δ E 1 j μ 1 j 2 = 2 m * G a A s Δ E 1 j e 2 ψ 1 x ψ j d x d y d z 2
for the transitions induced by an x-polarized probe laser. Each absorption coefficient is the sum over α 1 j , j = 2–10. The considered transition energies are below 95 meV.
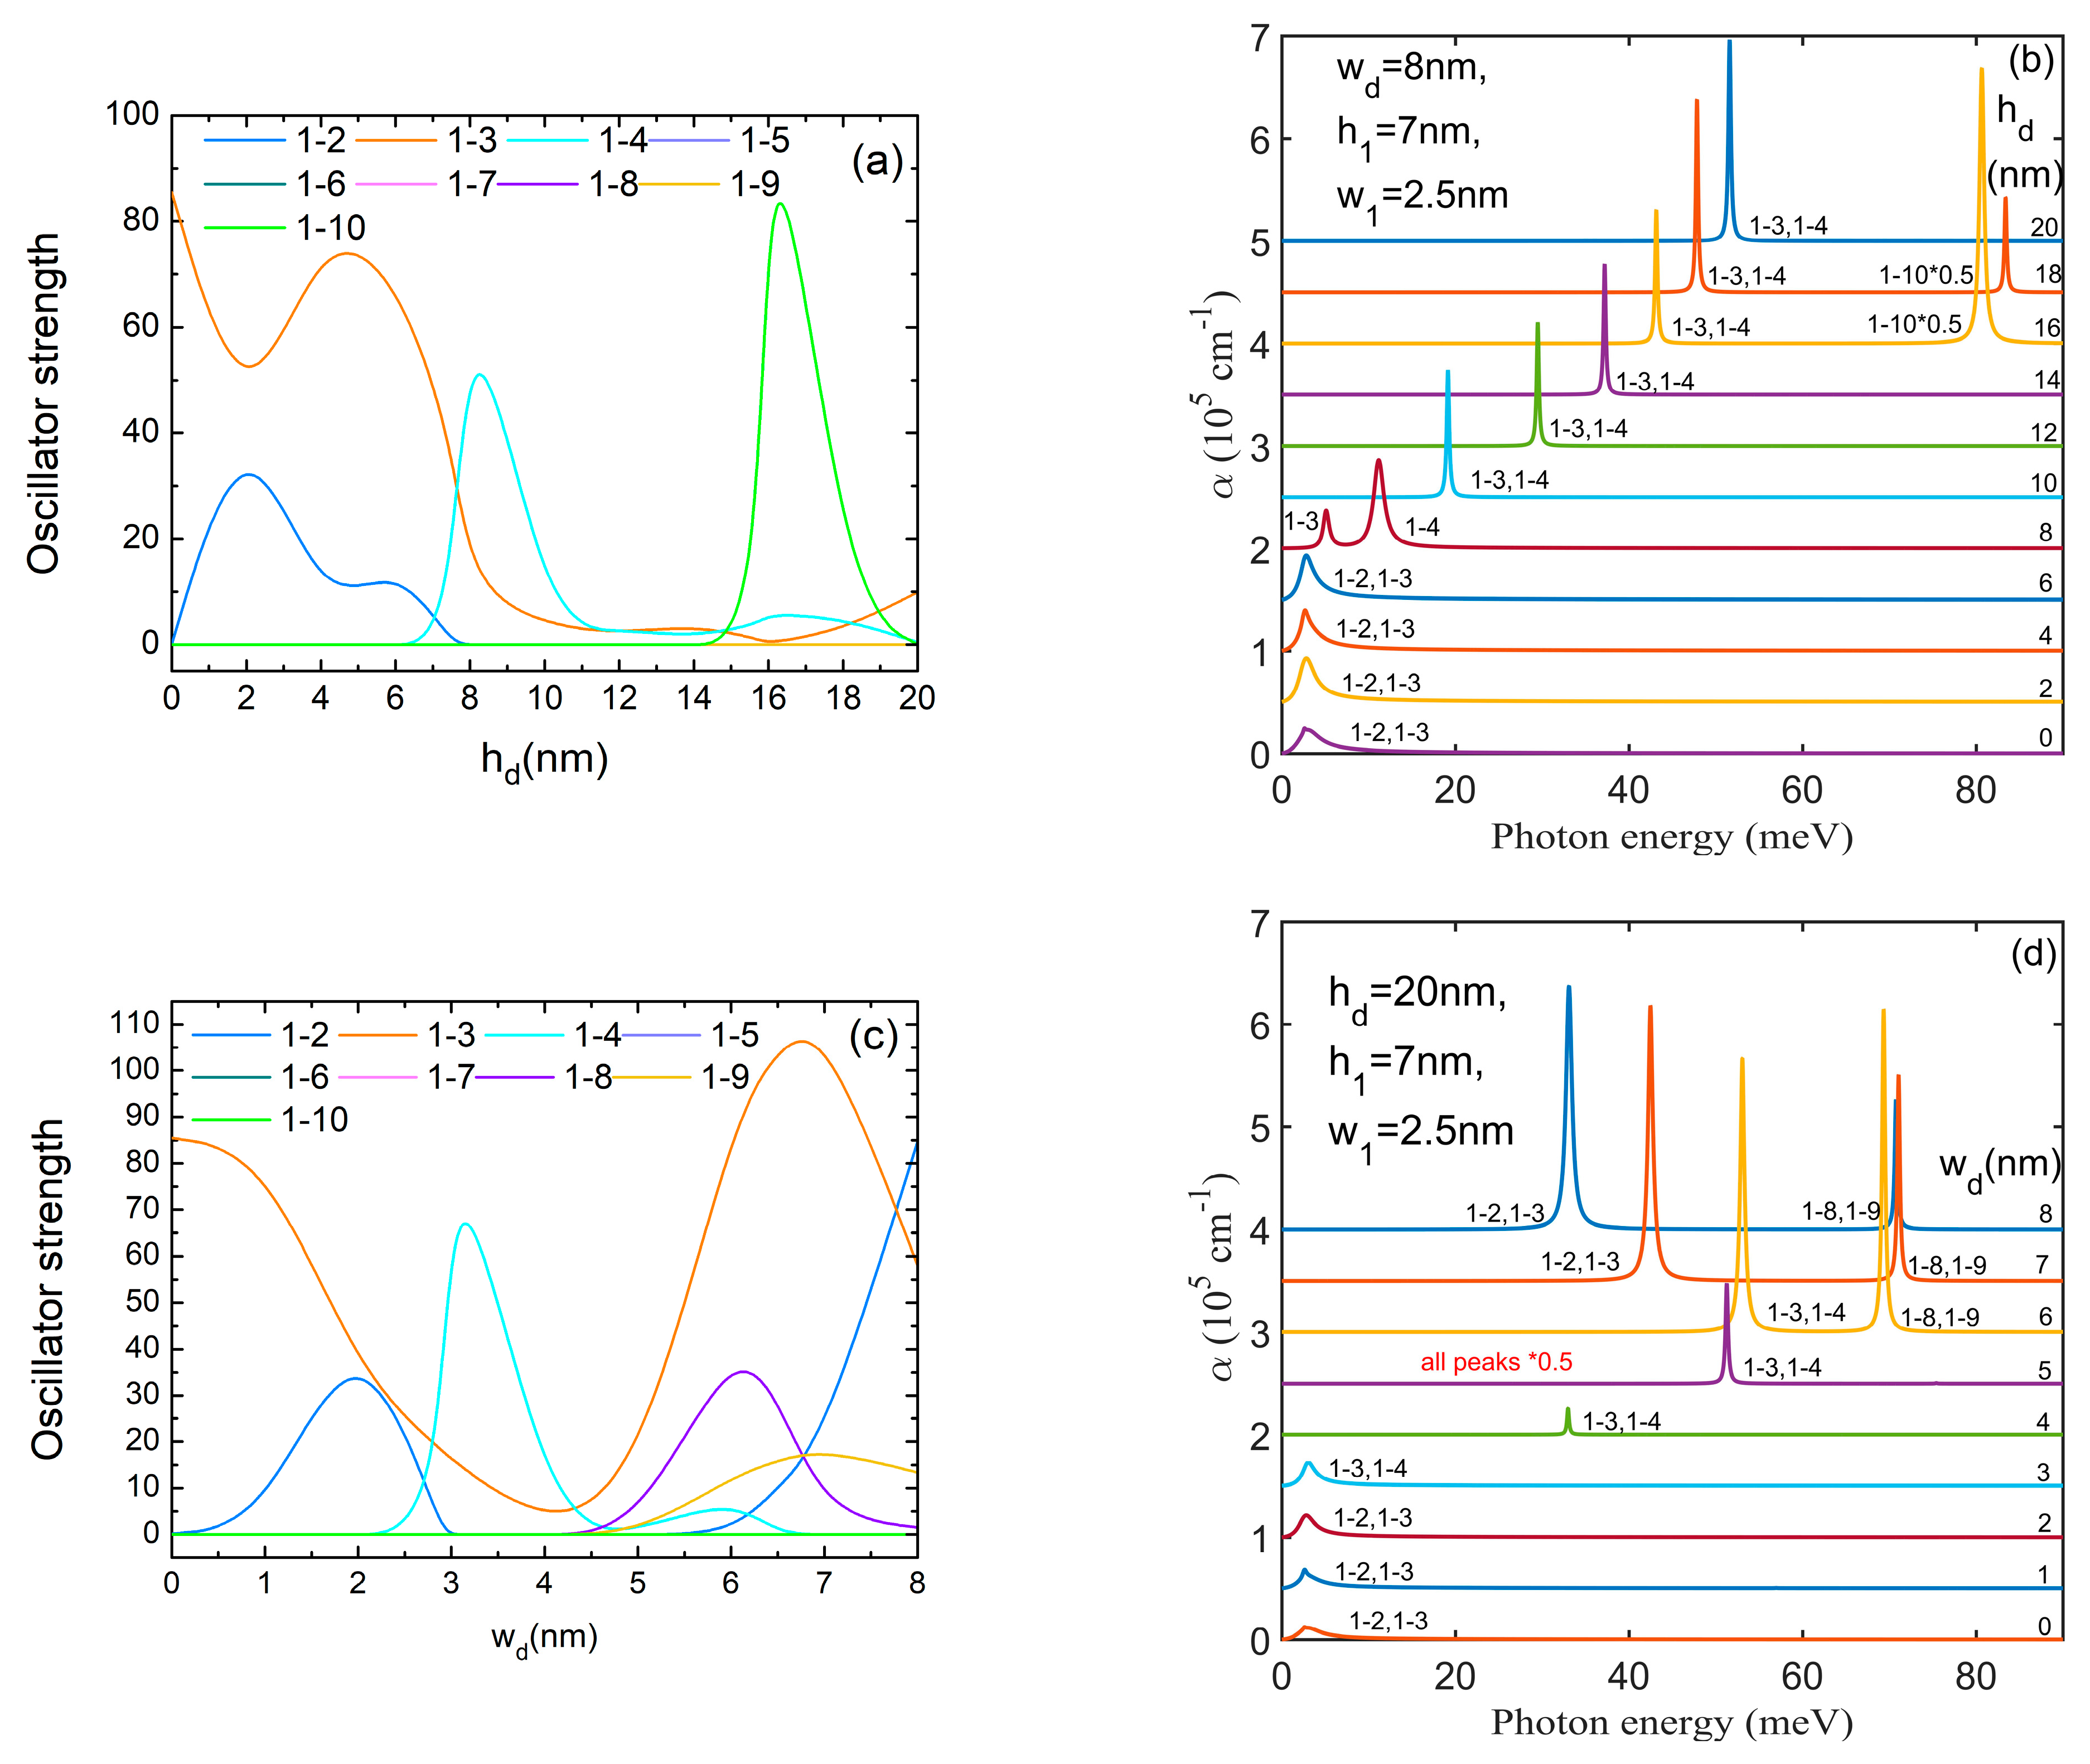
Figure 8a,c present the oscillator strength behavior at h d and w d variations, respectively. In both graphs, we notice that O1–3 takes considerable values on large regions of h d (from 0 to 7 nm) and w d (0–2 nm and 5–8 nm) because ψ1 is completely symmetric relative to the x, y axes, while ψ3 does not have a specific symmetry relative to them. Another non-zero oscillator strength is O1–2 at low values of h d and w d (see Figure 3). At higher values of h d and for w d = 3–6 nm, ψ2 becomes completely symmetric relative to the x, y axes, thus O1–2 = 0 and O1–4 ≠ 0 as (E3, E4) form a pair of non-degenerate levels with ψ3, ψ4 having m = ±1 (see Figure 2 and Figure 3). At higher values of w d , ψ2 again changes its symmetry (Figure 3b) and O1–2 grows again while O1–4 = 0. For h d = 16 nm, O1–3 = 0 because ψ3 is antisymmetric to the x, y axes (Figure 3a, fourth row). Also, for h d = 16–18 nm, O1–10 takes high values because ψ10 is mainly confined into the QD and does not have a specific symmetry relative to the x, y axes. For w d = 5–8 nm, O1–8 and O1–9 take appreciable values because of the good superposition of ψ1 over ψ8, ψ9 (their WFs also have m = ±1, as can be seen in Figure 3b, last row).
Therefore, in the absorption spectra represented in Figure 8b,d, we notice at low h d and w d only the peaks 1 → 2 and 1 → 3. Due to the degeneracy of (E2, E3) levels, they appear as a single peak. Even if the oscillator strengths are large for these transitions, the corresponding peaks are large but not intense, due to the small transition energies. In both figures, these peaks appear at almost constant transition energies, corresponding to rather constant values of E1 and (E2, E3) in Figure 2. Beginning with h d = 8 nm ( w d = 3–6 nm), the peak 1 → 2, 1 → 3 is replaced by 1 → 3, 1 → 4, which has higher energies and a growing intensity with increasing h d (or w d ). This is due to the rapid lowering of the ground state energy while E3, E4 remain constant (Figure 2). The large values of O1–10 in Figure 8a lead to a rather intense absorption peak of 5.4 × 105 cm−1 for h d = 16 nm (reduced 0.5 times in Figure 8b).
Figure 9a,c,e present the oscillator strength behavior with h 1 , w 1 and ρ 1 variations, respectively. Figure 9a,c are dominated by the large values of O1–2 and O1–3, which have an oscillatory and mirror behavior of each other due to fact that the maxima and minima of ψ2 and ψ3 are perpendicularly oriented and make different angles with the x, y axes with increasing h 1 , w 1 . On small domains, O1–7, O1–8 and O1–9, O1–10 take considerable values. For instance, for h 1 = 4 nm, ψ7, ψ8 form a pair of functions with m = ±1, as can be seen in Figure 5a, third row.
On the other hand, in Figure 9e we notice significant values of O1–9, O1–10 for all values of ρ 1 while O1–2, O1–3 are important only for small values. For instance, in Figure 5b, third row, at ρ 1 = 16 nm, ψ1, ψ9, ψ10 are mainly confined into the QD and ψ2–ψ8 are mainly confined in DQR. Moreover, ψ2 is a symmetric function in x, y, so only O1–3, O1–4 take small values. Beginning with ρ 1 = 22 nm, all oscillator strengths are zero, because there is no superposition between the ground state confined in the dot and the excited states confined in DQR.
In the absorption spectra shown in Figure 9b,d, a displacement of all peaks toward lower energy with increasing h 1 , w 1 can be observed. Even if the ground state energy is almost constant at low h 1 , w 1 and decreases at their increment, similar to its behaviour with increasing h d , w d , the transition energy of the 1 → 2, 1 → 3 peak diminishes at low h 1 , w 1 and stabilizes further because of the decrement of the excited states energies. This is in contrast to these peaks’ behaviour at h d , w d increment. The large values of O1–2 and O1–3 traduce in large peaks at great values of h 1 , w 1 where they involve small transition energies and in intense ones at small values of h 1 , w 1 where the transition energies are larger. The intensity is so great that the 1 → 2, 1 → 3 peak is reduced by 0.5 times. The maximum value of 7.28 × 105 cm−1 is obtained for this absorption peak at h 1 = 2 nm. Values of little difference were obtained for the 1 → 9, 1 → 10 peak at h 1 = 8 nm and the 1 → 2, 1 → 3 peak at h 1 = 4 nm. Also, comparable values are found for the 1 → 2, 1 → 3 peak at w 1 = 1 nm and the 1 → 7, 1 → 8 peak at w 1 = 2 nm.
In the absorption spectra from Figure 9f, we notice large maxima for the 1 → 9, 1 → 10 peak that displaces to lower energies at ρ 1 increment, and smaller absorption maxima for the 1 → 2, 1 → 3 peak that moves to higher energies. The largest absorption maximum of about 7.5 × 105 cm−1 was obtained for the 1 → 9, 1 → 10 peak at ρ 1 = 18 and 20 nm.
Figure 10a,c show the oscillator strength behavior at h 2 , w 2 variations, respectively. For similar reasons, we notice again the oscillatory and mirror behavior of O1–2 and O1–3. At low values of h 2 , O1–9, O1–10 take considerable values while at low values of w 2 , O1–8, O1–9 are non-zero because either ψ9, ψ10 or ψ8, ψ9 have WFs with m = ±1, as can be seen in Figure 7. For instance, at h 2 = 10 nm, the WFs ψ5–ψ10 are confined mainly in DQR while ψ4 is a symmetric state, so beginning with this value of h 2 only O1–2, O1–3 ≠ 0 (see Figure 7a, third and fourth rows). A similar behaviour was found for w 2 4 nm.
In the corresponding absorption spectra we observe the displacement of all peaks toward lower energy with increasing h 2 , w 2 similar to the spectra obtained at h 1 , w 1 increment. Beginning with h 2 = 10 nm ( w 2 = 4 nm) the spectrum is represented only by the 1 → 2, 1 → 3 peak placed at very low energy (2–3 meV). The largest absorption maximum of about 6.9 × 105 cm−1 was obtained for the 1 → 9, 1 → 10 peak at h 2 = 3–4 nm.
From the analysis of the absorption spectra presented in Figure 8, Figure 9 and Figure 10, we can say that, either at low values of h d or w d or at large values of h 1 , h 2 or w 2 , the spectra are composed of a single peak of low energy. Otherwise, the spectra are composed of two peaks well separated in energy, some of them of rather high intensity. The increment of QDDR parameters is able to induce a blue-shift of all absorption peaks ( h d ), a red-shift of all peaks ( h 1 , w 1 , h 2 ,   w 2 ) or a blue-shift of the 1 → 2, 1 → 3 peak and a red-shift of the 1 → 9, 1 → 10 peak ( ρ 1 ). This tunability of the absorption spectra can suggest new opportunities in designing new optical devices based on these structures.

4. Conclusions

We have studied the effects of geometry variation on the energy spectra and optical absorption of quantum dot–double quantum ring. We performed 3D numerical computations using a potential build from the cross-sectional profile inferred from a real dot–double ring structure [24].
The profile is mathematically modeled as a superposition of three Gaussian functions, each centered on the position of the dot (QD), inner ring (QR1) and outer ring (QR2). We varied seven independent parameters related to the dot and rings height, width and position and present the most relevant results of our computations.
In the effective mass approximation, we performed a ten-level analysis of the energy, oscillatory strength and absorption spectra. Keeping comparable values for the height of the dot and inner ring, we managed to obtain a significant variation of the ground state energy depending on the rings parameters.
For the physical explanation of the QDDR response to the geometrical constraints, we have used the important support given by the 3D representation of the electron wave functions.
Our results reveal that the energies of QDDR are more sensitive to the width w i variation where i = d, 1, 2. At the increment of each h i , w i , the energy of the ground state is rather constant for small values but decreases almost linearly for higher values due to the lowering of the confinement. However, the energies of the excited states show a different behavior. At the increment of quantum dot height ( h d ), the excited state energies are rather constant with small punctual variations, while at the increment of its width ( w d ), the excited state energies are constant up to a specific value and then decrease. The energy spectra present many anti-crossings due to the lowering of the energy of the state confined into the dot. On the other hand, in the case of manipulation of the QR geometry, the energies of the excited states only decrease with the increment of their height and width. The anti-crossings are now determined by the appearance of a second completely symmetrical state, whose energy first decreases and then stabilizes at a rather constant value.
A different behavior is observed at the increment of the distance between QD and DQR. The energies of the lowest three states increase and then remain constant, but the energies of the upper states decrease, first rapidly and then more slowly.
In the simulation of the absorption, we considered only the transitions starting from the ground state. The spectra were analyzed in relation with the oscillator strength of the transitions involved. Because the ground state and the excited states are differently confined in the semiconductor structure, the spectra consist of either a single peak of low energy or of two peaks well separated in energy, some of them of rather high intensity. The increment of quantum dot height gives a good control of the blue-shift of all absorption peaks. A proper increasing of the dimensions of each of the quantum rings tunes the red-shift of all peaks. The increment of the distance between QD and DQR induces the blue-shift of the low energy peak and the red-shift of the high energy peak.
The structure of the quantum dot–double quantum ring shows an increased versatility compared to the quantum dot–single ring, not only because of the increased number of control parameters that more sensitively adjust the electronic and optical properties. The presence of a second ring facilitates a strong coupling in QDDR structure, generating new single states and more anti-crossings in energy, changing accordingly the localization probability of the electrons, and consequently the transport properties.
Our results show that this type of configuration allows a selective tuning of the geometry to confine the electron density within the dot or within each individual ring, a property which is particularly important to quantum transport and quantum information processing.

Author Contributions

Conceptualization, D.B. and C.S.; methodology, D.B. and C.S.; software, D.B. and C.S.; validation, D.B. and C.S.; formal analysis, D.B. and C.S.; investigation, D.B. and C.S.; writing—original draft preparation, D.B. and C.S; writing—review and editing, D.B. and C.S. All authors have read and agreed to the published version of the manuscript.

Funding

This research received no external funding.

Data Availability Statement

The datasets generated and/or analyzed during the current study are available from the corresponding author on reasonable request.

Conflicts of Interest

The authors declare that they have no known competing financial interests or personal relationships that could have appeared to influence the work reported in this paper.

References

  1. Fomin, V.M. Physics of Quantum Rings; Springer: Berlin/Heidelberg, Germany, 2014. [Google Scholar]
  2. Yachmenev, E.; Khabibullin, R.A.; Ponomarev, D.S. Recent advances in THz detectors based on semiconductor structures with quantum confinement: A review. J. Phys. D Appl. Phys. 2022, 55, 193001. [Google Scholar] [CrossRef]
  3. Yao, D.; Hu, Z.; Su, Y.; Chen, S.; Zhang, W.; Lü, W.; Xu, H. Significant efficiency enhancement of CdSe/Cds quantum-dot sensitized solar cells by black TiO2 engineered with ultrashort filamentating pulses. Appl. Surf. Sci. Adv. 2021, 6, 100142. [Google Scholar] [CrossRef]
  4. Dutta, A.; Medda, A.; Bera, R.; Rawat, A.; De Sarkar, A.; Patra, A. Electronic Band Structure and Ultrafast Carrier Dynamics of Two Dimensional (2D) Semiconductor Nanoplatelets (NPLs) in the Presence of Electron Acceptor for Optoelectronic Applications. J. Phys. Chem. C 2020, 124, 26434–26442. [Google Scholar] [CrossRef]
  5. Won, Y.H.; Cho, O.; Kim, T.; Chung, D.Y.; Kim, T.; Chung, H.; Jang, H.; Lee, J.; Kim, D.; Jang, E. Highly efficient and stable InP/ZnSe/ZnS quantum dot light-emitting diodes. Nature 2019, 575, 634–638. [Google Scholar] [CrossRef] [PubMed]
  6. Michler, P. (Ed.) Quantum Dots for Quantum Information Technologies; Springer International Publishing: Cham, Germany, 2017. [Google Scholar]
  7. Jennings, C.; Ma, X.; Wickramasinghe, T.; Doty, M.; Scheibner, M.; Stinaff, E.; Ware, M. Self-Assembled InAs/GaAs Coupled Quantum Dots for Photonic Quantum Technologies. Adv. Quantum Technol. 2020, 3, 1900085. [Google Scholar] [CrossRef]
  8. Singh, S.; De Sarkar, A.; Kaur, I. A comparative and a systematic study on the effects of B, N doping and C-atom vacancies on the band gap in narrow zig-zag graphene nanoribbons via quantum transport calculations. Mater. Res. Bull. 2017, 87, 167–176. [Google Scholar] [CrossRef]
  9. López Aristizábal, A.M.; Mora Rey, F.; Morales, Á.L.; Vinasco, J.A.; Duque, C.A. Electric and Magnetic Fields Effects in Vertically Coupled GaAs/AlxGa1−xAs Conical Quantum Dots. Condens. Matter 2023, 8, 71. [Google Scholar] [CrossRef]
  10. Sargsian, T.A.; Mantashyan, P.A.; Hayrapetyan, D.B. Effect of Gaussian and Bessel laser beams on linear and nonlinear optical properties of vertically coupled cylindrical quantum dots. Nano-Struct. Nano-Objects 2023, 33, 100936. [Google Scholar] [CrossRef]
  11. Escorcia, R.A.; Gutiérrez, W.; Mikhailov, I.D. Effect of electric field on confined donor states in laterally coupled quantum rings. Appl. Surf. Sci. 2020, 509, 145248. [Google Scholar] [CrossRef]
  12. Planelles, J.; Rajadell, F.; Climente, J.I.; Royo, M.; Movilla, J.L. Electronic states of laterally coupled quantum rings. J. Phys. Conf. Ser. 2007, 61, 936. [Google Scholar] [CrossRef]
  13. Liu, G.; Wang, S.; Wang, D.; Chen, G.; Wu, F.; Liu, Y.; Zheng, Y.; Dai, J.; Guo, K.; Tao, Y.; et al. Floquet engineering of electronic states and optical absorption in laterally-coupled quantum rings under a magnetic field. Opt. Express 2024, 32, 26265–26278. [Google Scholar] [CrossRef]
  14. Marin, J.H.; Rodriguez-Prada, F.A.; Mikhailov, I.D. Vertically coupled non-uniform quantum rings with two separated electrons in threading magnetic field. J. Phys. Conf. Ser. 2010, 245, 012020. [Google Scholar] [CrossRef]
  15. Castrillón, J.D.; Gómez-Ramírez, D.A.J.; Rivera, I.E.; Suaza, Y.A.; Marín, J.H.; Fulla, M.R. Artificial Hydrogen molecule in vertically stacked Ga1−xAlxAs nanoscale rings: Structural and external probes effects on their quantum levels. Phys. E 2020, 117, 113765. [Google Scholar] [CrossRef]
  16. Ospina, D.A.; Duque, D.; Mora-Ramos, M.E.; Vinasco, J.A.; Radu, A.; Restrepo, R.L.; Morales, A.L.; Sierra-Ortega, J.; Escorcia-Salas, G.E.; Giraldo, M.A.; et al. Hopf-link GaAs-AlGaAs quantum ring under geometric and external field settings. Phys. E 2024, 163, 116032. [Google Scholar] [CrossRef]
  17. Khordad, R.; Rastegar Sedehi, H.R. Thermodynamic Properties of a Double Ring-Shaped quantum dot at low and high temperatures. J. Low Temp. Phys. 2018, 190, 200–212. [Google Scholar] [CrossRef]
  18. Baghramyan, H.M.; Barseghyan, M.G.; Kirakosyan, A.A.; Ojeda, J.H.; Bragard, J.; Laroze, D. Modeling of anisotropic properties of double quantum rings by the terahertz laser field. Sci. Rep. 2018, 8, 6145. [Google Scholar] [CrossRef] [PubMed]
  19. Janet Sherly, I.; Nithiananthi, P. Influence of electric field on direct and indirect exciton in a concentrically coupled quantum ring heterostructure embedded in SiO2 matrix. Superlatt. Microstruct. 2020, 137, 106334. [Google Scholar] [CrossRef]
  20. Bejan, D.; Stan, C. Geometry tailored magneto-optical absorption spectra of elliptically deformed double quantum rings. Philos. Mag. 2022, 102, 1755–1777. [Google Scholar]
  21. Bejan, D.; Stan, C. Refraction index of elliptic double quantum rings in magnetic field, UPB Sci. Bull. A Appl. Math. Phys. 2023, 85, 139–150. [Google Scholar]
  22. Bejan, D.; Stan, C. Impurity and geometry effects on the optical rectification spectra of quasi-elliptical double quantum rings. Phys. E 2023, 147, 115598. [Google Scholar] [CrossRef]
  23. Bejan, D.; Radu, A.; Stan, C. Electronic and optical responses of laser dressed triple concentric quantum rings in electric field. Philos. Mag. 2023, 103, 1738–1755. [Google Scholar] [CrossRef]
  24. Bejan, D.; Stan, C. Controlling the interband transitions in triple quantum ring: Effects of intense laser and electric fields. J. Phys. Chem. Solids 2024, 188, 111887. [Google Scholar] [CrossRef]
  25. Somaschini, C.; Bietti, S.; Koguchi, N.; Sanguinetti, S. Coupled quantum dot–ring structures by droplet epitaxy. Nanotechnology 2011, 22, 185602. [Google Scholar] [CrossRef] [PubMed]
  26. Elborg, M.; Noda, T.; Mano, T.; Kuroda, T.; Yao, Y.; Sakuma, Y.; Sakoda, K. Self-assembly of vertically aligned quantum ring-dot structure by Multiple Droplet Epitaxy. J. Cryst. Growth 2017, 477, 239–242. [Google Scholar] [CrossRef]
  27. Zeng, Z.; Garoufalis, C.S.; Baskoutas, S. Linear and nonlinear optical susceptibilities in a laterally coupled quantum-dot-quantum ring system. Phys. Lett. A 2014, 378, 2713–2718. [Google Scholar] [CrossRef]
  28. Barseghyan, M.G. Electronic states of coupled quantum dot-ring structure under lateral electric field with and without a hydrogenic donor impurity. Phys. E 2015, 69, 219–223. [Google Scholar] [CrossRef]
  29. Barseghyan, M.G.; Baghramyan, H.M.; Laroze, D.; Bragard, J.; Kirakosyan, A.A. Impurity-related intraband absorption in coupled quantum dot-ring structure under lateral electric field. Phys. E 2015, 74, 421–425. [Google Scholar] [CrossRef]
  30. Pal, S.; Ghosh, M.; Duque, C.A. Impurity related optical properties in tuned quantum dot/ring systems. Philos. Mag. 2019, 99, 2457–2486. [Google Scholar] [CrossRef]
  31. Barseghyan, M.G.; Manaselyan, A.K.; Laroze, D.; Kirakosyan, A.A. Impurity-modulated Aharonov–Bohm oscillations and intraband optical absorption in quantum dot–ring nanostructures. Phys. E 2016, 81, 31–36. [Google Scholar] [CrossRef]
  32. Hernández, N.; López-Doria, R.A.; Fulla, M.R. Optical and electronic properties of a singly ionized double donor confined in coupled quantum dot-rings. Phys. E 2023, 151, 115736. [Google Scholar] [CrossRef]
  33. Mora-Ramos, M.E.; Vinasco, J.A.; Laroze, D.; Radu, A.; Restrepo, R.L.; Heyn, C.; Tulupenko, V.; Hieu, N.N.; Phuc, H.V.; Ojeda, J.H.; et al. Electronic structure of vertically coupled quantum dot-ring heterostructures under applied electromagnetic probes. A finite-element approach. Sci. Rep. 2021, 11, 4015. [Google Scholar] [CrossRef] [PubMed]
  34. Kurpas, M.; Kedzierska, B.; Janus-Zygmunt, I.; Gorczyca-Goraj, A.; Wach, E.; Zipper, E.; Maska, M.M. Charge transport through a semiconductor quantum dot-ring nanostructure. J. Phys. Condens. Matter. 2015, 27, 265801. [Google Scholar] [CrossRef]
  35. Szafran, B.; Peeters, F.M.; Bednarek, S. Electron spin and charge switching in a coupled quantum-dot-quantum ring system. Phys. Rev. B 2004, 70, 125310. [Google Scholar] [CrossRef]
  36. Chakraborty, T.; Manaselyan, A.; Barseghyan, M. Effective tuning of electron charge and spin distribution in a dot-ring nanostructure at the ZnO interface. Phys. E 2018, 99, 63–66. [Google Scholar] [CrossRef]
  37. Biborski, A.; Kadzielawa, A.P.; Gorczyca-Goraj, A.; Zipper, E.; Maska, M.M.; Spałek, J. Dot-ring nanostructure: Rigorous analysis of many-electron effects. Sci. Rep. 2016, 6, 29887. [Google Scholar] [CrossRef] [PubMed]
  38. Planelles, J.; Climente, J.I.; Rajadell, F. Quantum rings in tilted magnetic fields. Phys. E 2006, 33, 370–375. [Google Scholar] [CrossRef]
  39. Lee, B.C.; Voskoboynikov, O.P.; Lee, C.P. III-V Semiconductors nano-rings. Phys. E 2004, 24, 87–91. [Google Scholar] [CrossRef]
  40. Mano, T.; Koguchi, N. Nanometer-scale GaAs ring structure grown by droplet epitaxy. J. Crys. Growth 2005, 278, 108–112. [Google Scholar] [CrossRef]
  41. YSibirmovskii, D.; Vasil’evskii, I.S.; Vinichenko, A.N.; Eremin, I.S.; Zhigunov, D.M.; Kargin, N.I.; Kolentsova, O.S.; Martyuk, P.A.; Strikhanov, M.N. Photoluminescence of GaAs/AlGaAs Quantum Ring Arrays. Semiconductors 2015, 49, 638–643. [Google Scholar] [CrossRef]
  42. Vinasco, J.A.; Radu, A.; Tiutiunnyk, A.; Restrepo, R.L.; Laroze, D.; Feddi, E.; Mora-Ramos, M.E.; Morales, A.L.; Duque, C.A. Revisiting the adiabatic approximation for bound states calculation in axisymmetric and asymmetrical quantum structures. Superlatt. Microstruct. 2020, 138, 106384. [Google Scholar] [CrossRef]
  43. COMSOL Multiphysics® v. 5.6; COMSOL AB: Stockholm, Sweden. Available online: www.comsol.com (accessed on 16 July 2024).
  44. Paspalakis, E.; Boviatsis, J.; Baskoutas, S. Effects of probe field intensity in nonlinear optical processes in asymmetric semiconductor quantum dots. J. Appl. Phys. 2013, 114, 153107. [Google Scholar] [CrossRef]
  45. Kuroda, T.; Mano, T.; Ochiai, T.; Sanguinetti, S.; Sakoda, K.; Kido, G.; Koguchi, N. Optical transitions in quantum ring complexes. Phys. Rev. B 2005, 72, 205301. [Google Scholar] [CrossRef]
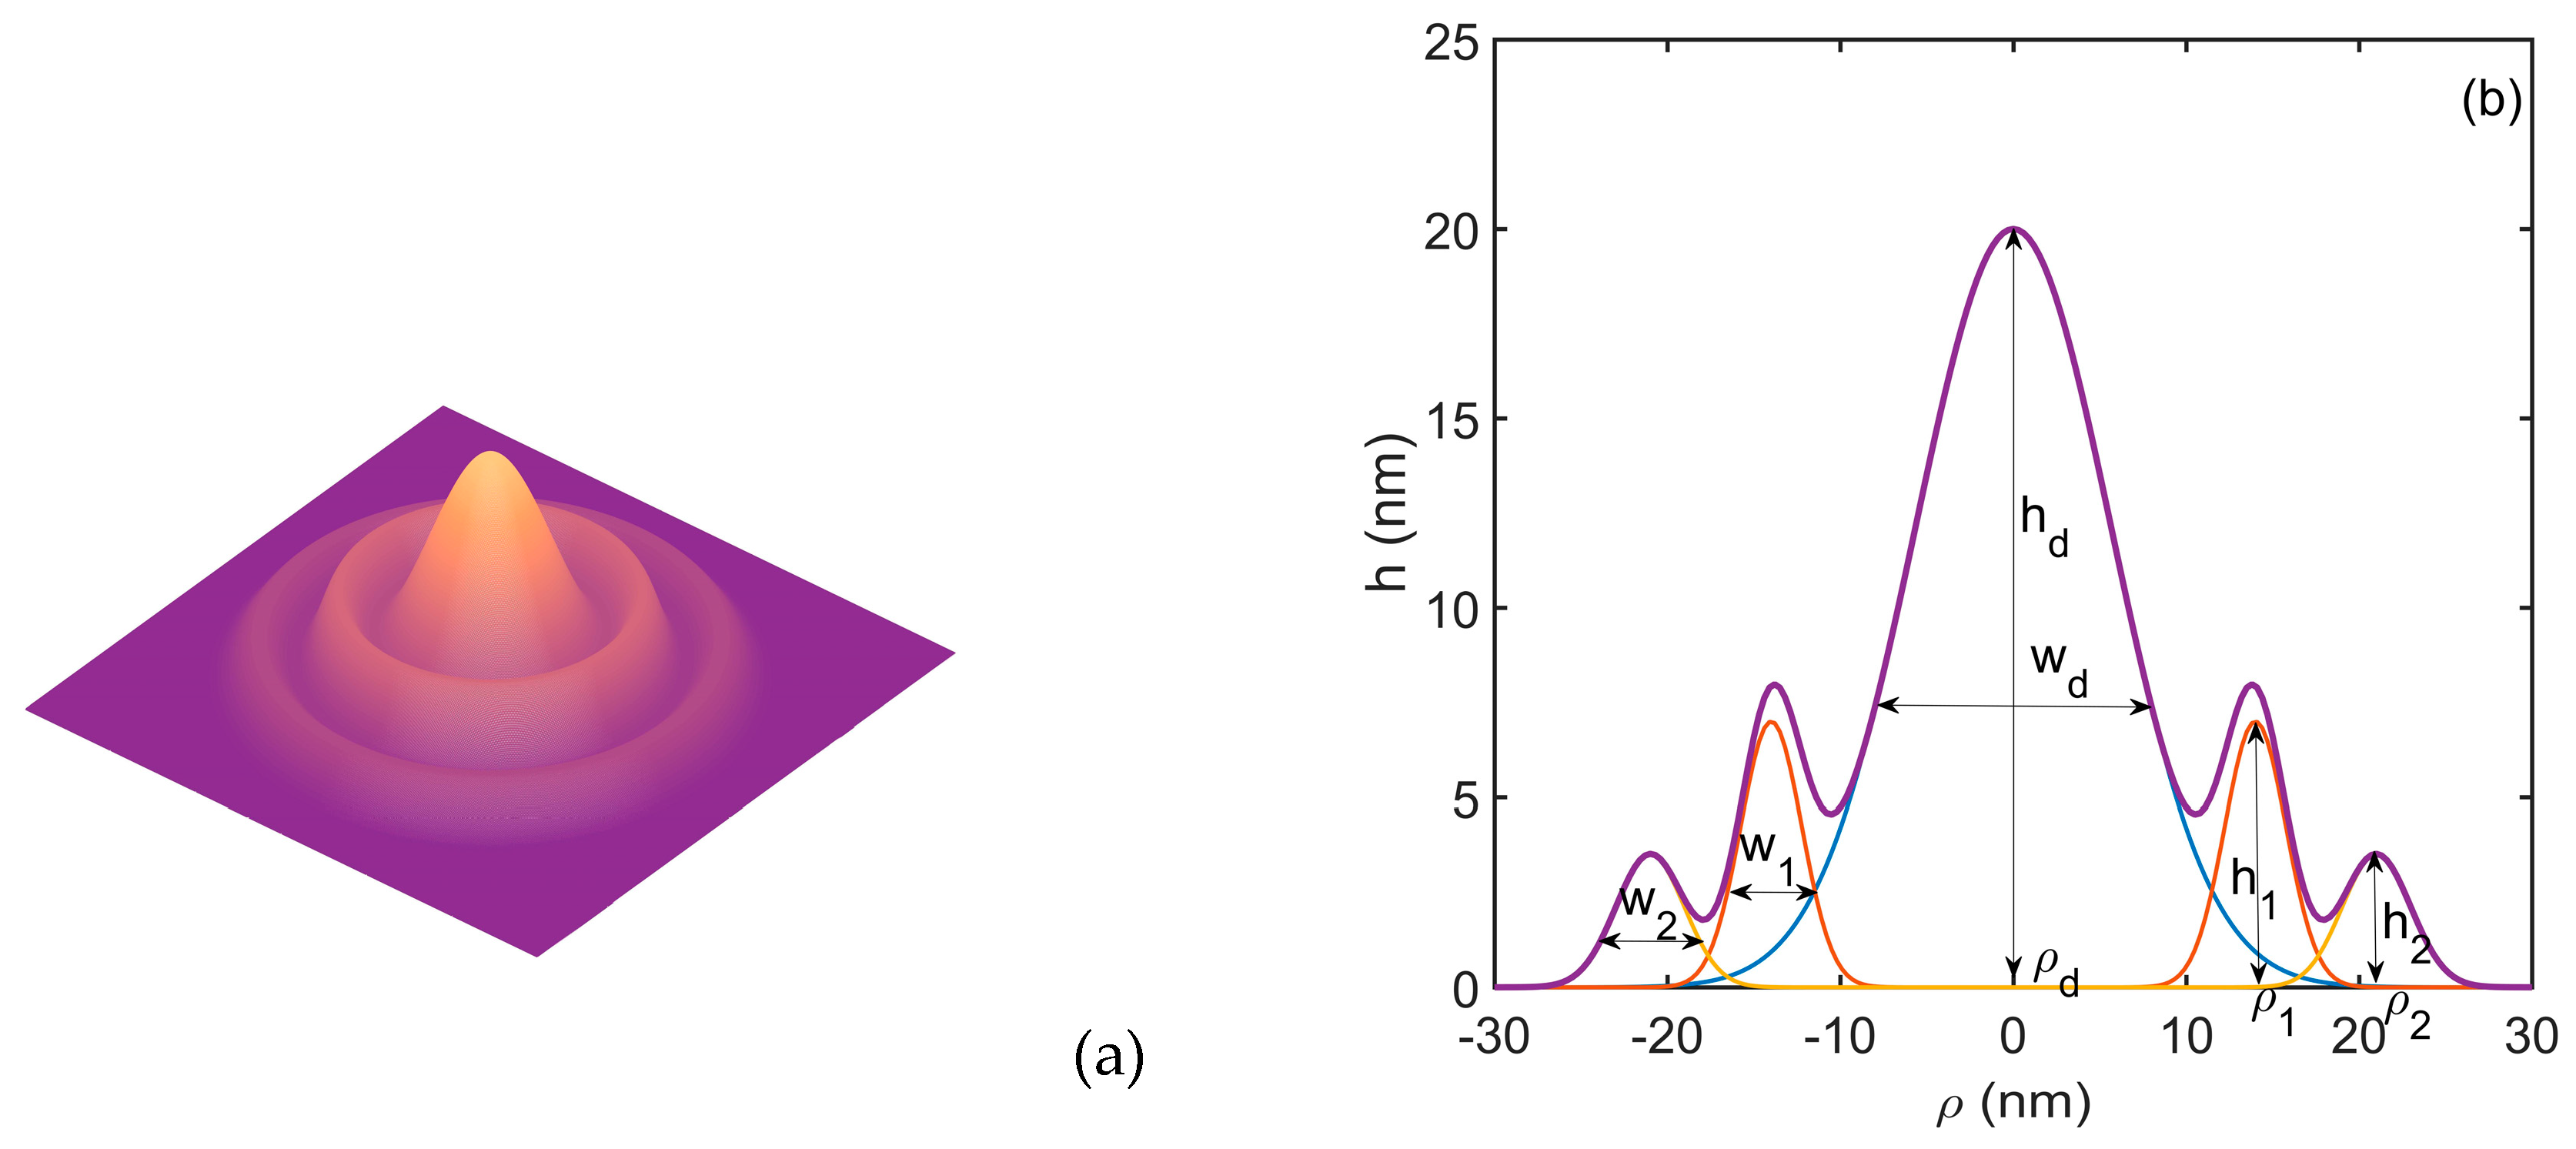
Figure 1. The 3D QDDR structure (a) is built by revolving around the z-axis the height profile modelled in (b) as a superposition of three gaussian functions with specified parameters.
Nanomaterials 14 01337 g001
Figure 2. The energies of the ten lowest states of the electron in DDQR: (a) as functions of hd; (b) as functions of wd. The insets represent the variation of the height profile on the positive values of ρ.
Nanomaterials 14 01337 g002
Figure 3. The 3D representation of the QDDR wave functions ordered horizontally in ascending order of energies: (a) at different values of hd for wd = 5 nm and (b) at different values of wd for hd = 20 nm. At each hd and wd values are indicated the corresponding wave functions.
Nanomaterials 14 01337 g003
Figure 4. The energies of the ten lowest states of the electron in QDDR: (a) as functions of h1; (b) as functions of w1; (c) as functions of ρ1. The insets represent the variation of the height profile on the positive values of ρ.
Nanomaterials 14 01337 g004
Figure 5. The 3D representation of the QDDR wave functions ordered horizontally in ascending order of energies: (a) at different values of h1 for w1 = 2.5 nm; (b) at different values of ρ1 for h1 = 7 nm, w1 = 2.5 nm and ρ2 = ρ1 + 7 nm. At each h1 and ρ1 value, the corresponding wave functions are indicated.
Nanomaterials 14 01337 g005
Figure 6. The energies of the ten lowest states of the electron in QDDR: (a) as functions of h2, w d = 8 nm; (b) as functions of w2. The insets represent the variation of the height profile on the positive values of ρ.
Nanomaterials 14 01337 g006
Figure 7. The 3D representation of the QDDR wave functions ordered horizontally in ascending order of energies: (a) at different values of h2 for w2 = 2.8 nm; (b) at different values of w2 for h2 = 20 nm. At each h2 and w2 value, the corresponding wave functions are indicated.
Nanomaterials 14 01337 g007
Figure 8. (a) The oscillator strengths as functions of hd; (b) the absorption spectra at different values of hd; (c) the oscillator strengths as functions of wd; (d) the absorption spectra at different values of wd. The transitions are indexed as 1–j, from the ground level to the excited j level. To avoid spectra overlapping, each spectrum is translated on the vertical axis.
Nanomaterials 14 01337 g008
Figure 9. (a) The oscillator strengths as functions of h1; (b) the absorption spectra at different values of h1; (c) the oscillator strengths as functions of w1; (d) the absorption spectra at different values of w1; (e) the oscillator strengths as functions of ρ1; (f) the absorption spectra at different values of ρ1. The transitions are indexed as 1–j, from the ground level to the excited j level. To avoid spectra overlapping, each spectrum is translated on the vertical axis.
Nanomaterials 14 01337 g009
Figure 10. (a) The oscillator strengths as functions of h2; (b) the absorption spectra at different values of h2; (c) the oscillator strengths as functions of w2; (d) the absorption spectra at different values of w2. The transitions are indexed as 1–j, from the ground level to the excited j level. To avoid spectra overlapping, each spectrum is translated on the vertical axis.
Nanomaterials 14 01337 g010
Disclaimer/Publisher’s Note: The statements, opinions and data contained in all publications are solely those of the individual author(s) and contributor(s) and not of MDPI and/or the editor(s). MDPI and/or the editor(s) disclaim responsibility for any injury to people or property resulting from any ideas, methods, instructions or products referred to in the content.