
Interventional Effect of Zinc Oxide Nanoparticles with Zea mays L. Plants When Compensating Irrigation Using Saline Water

 , , , and
Abstract
1. Introduction
2. Materials and Methods
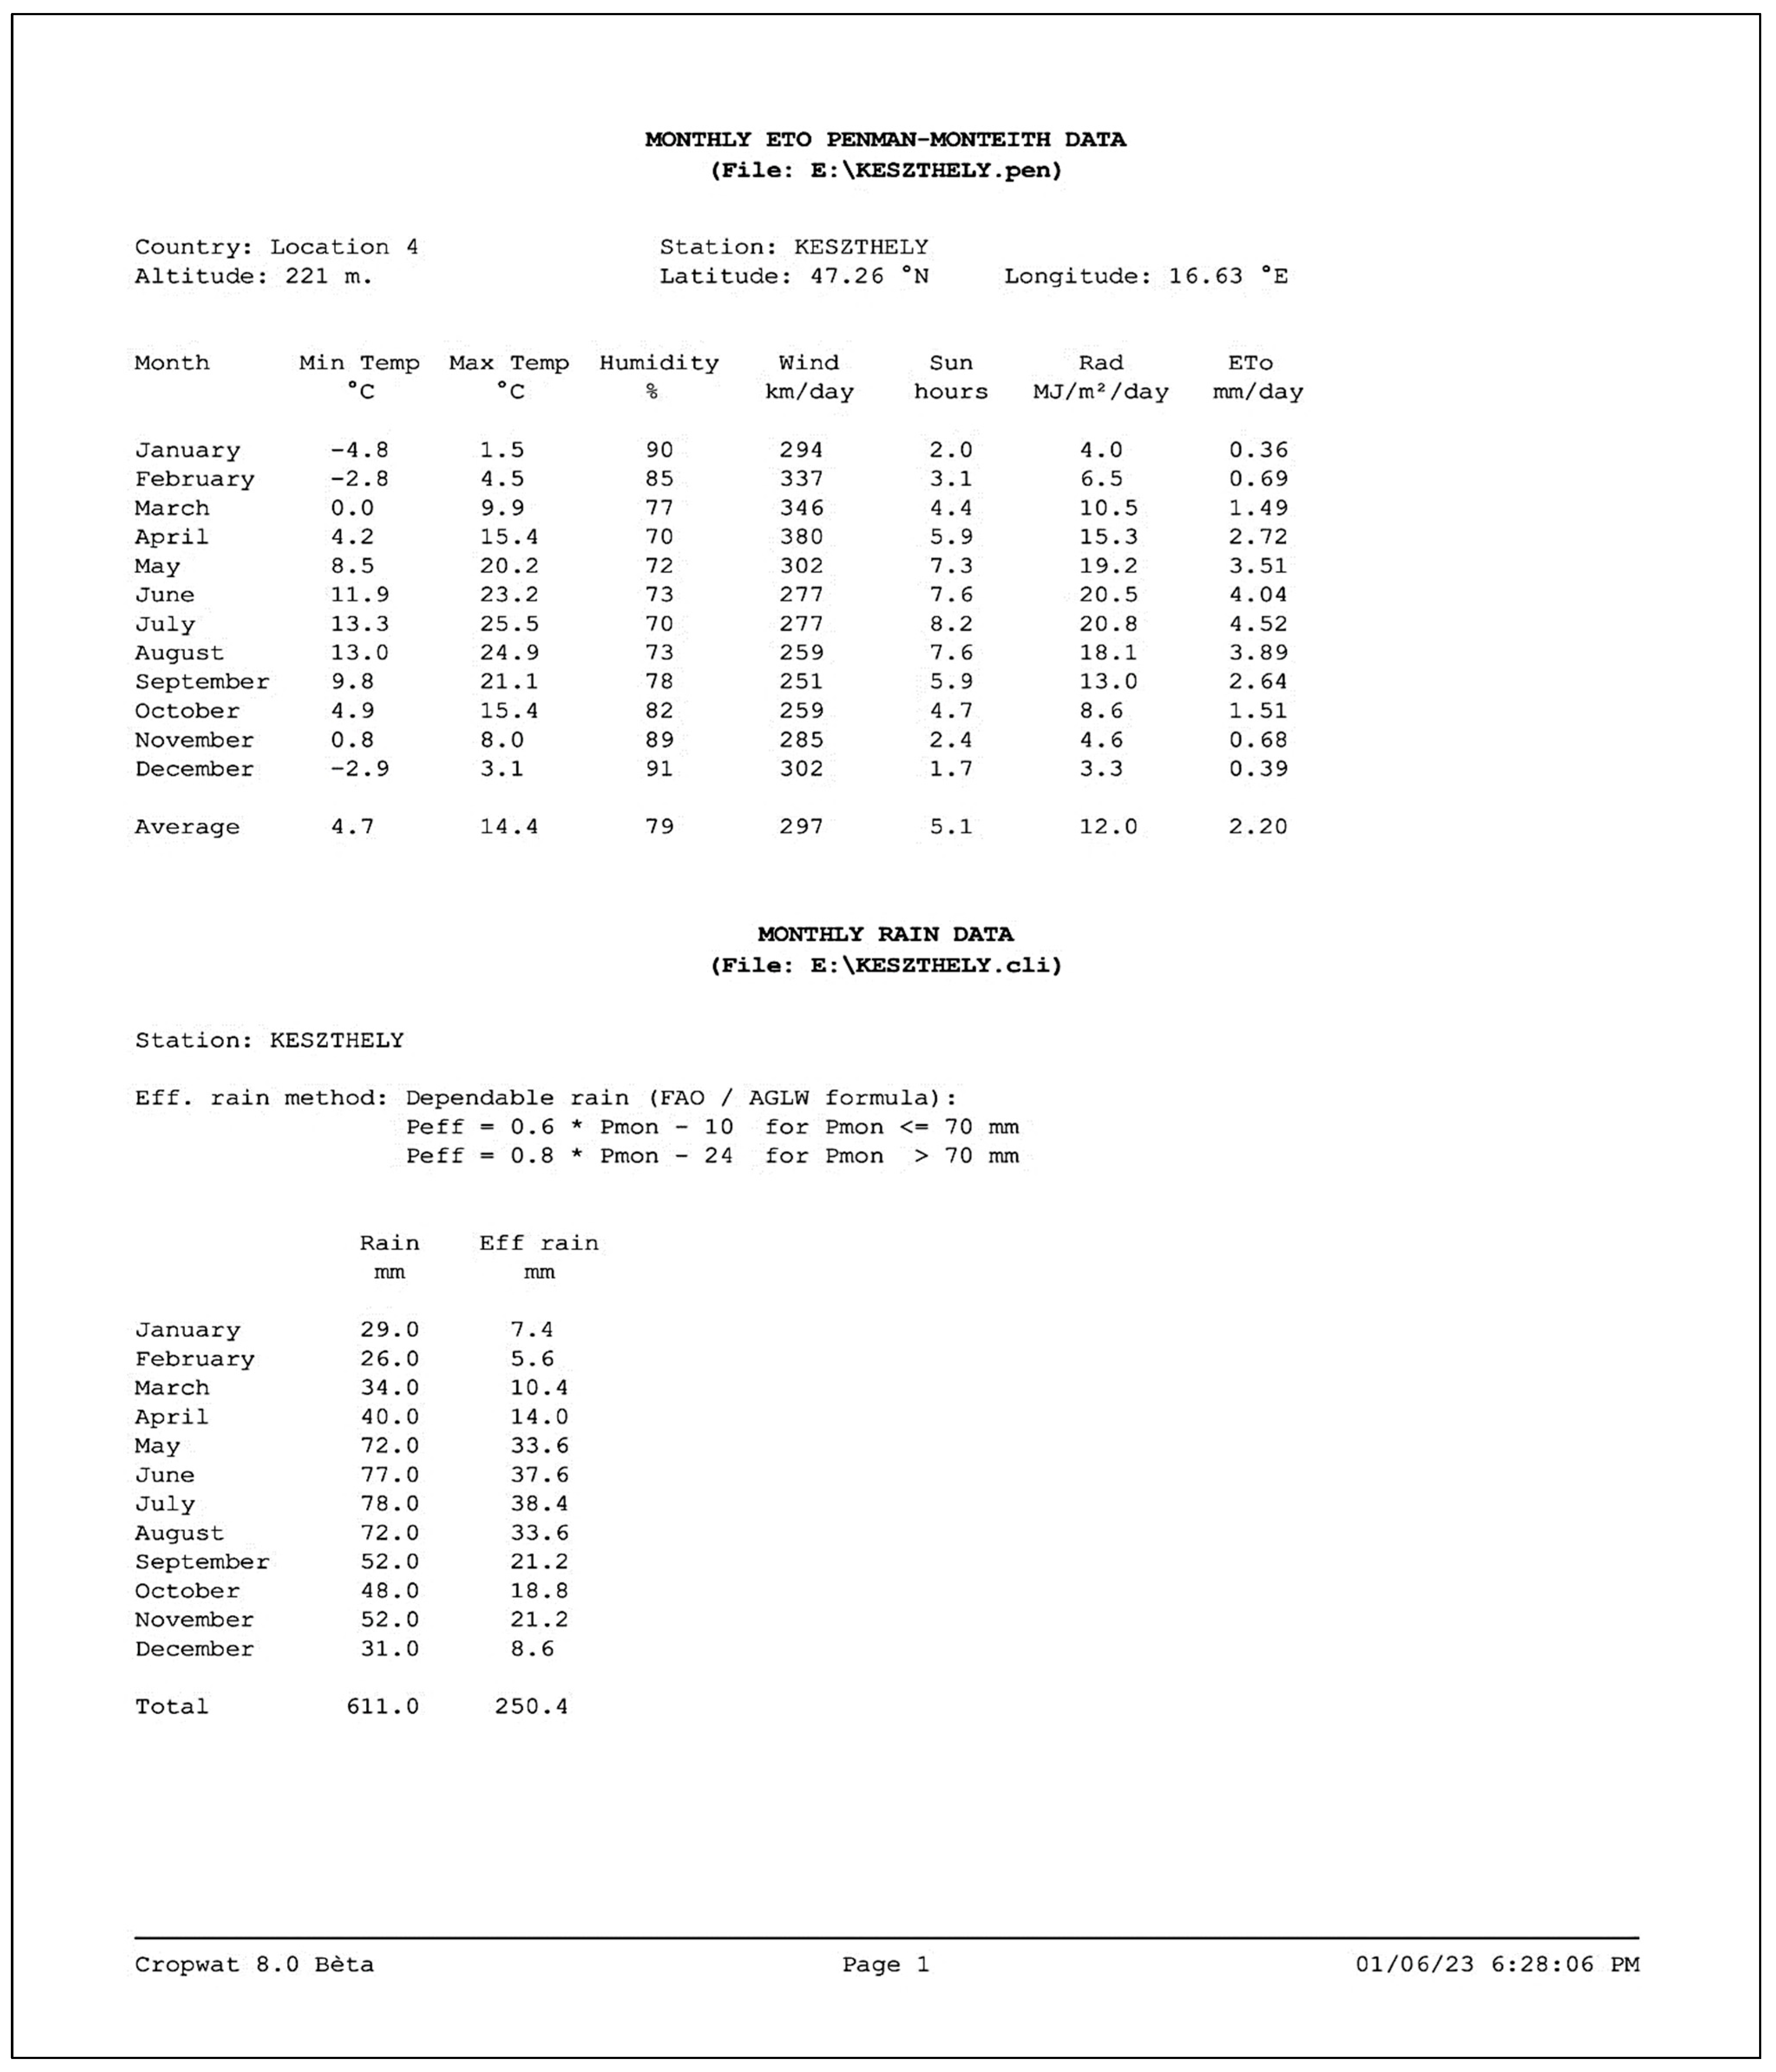
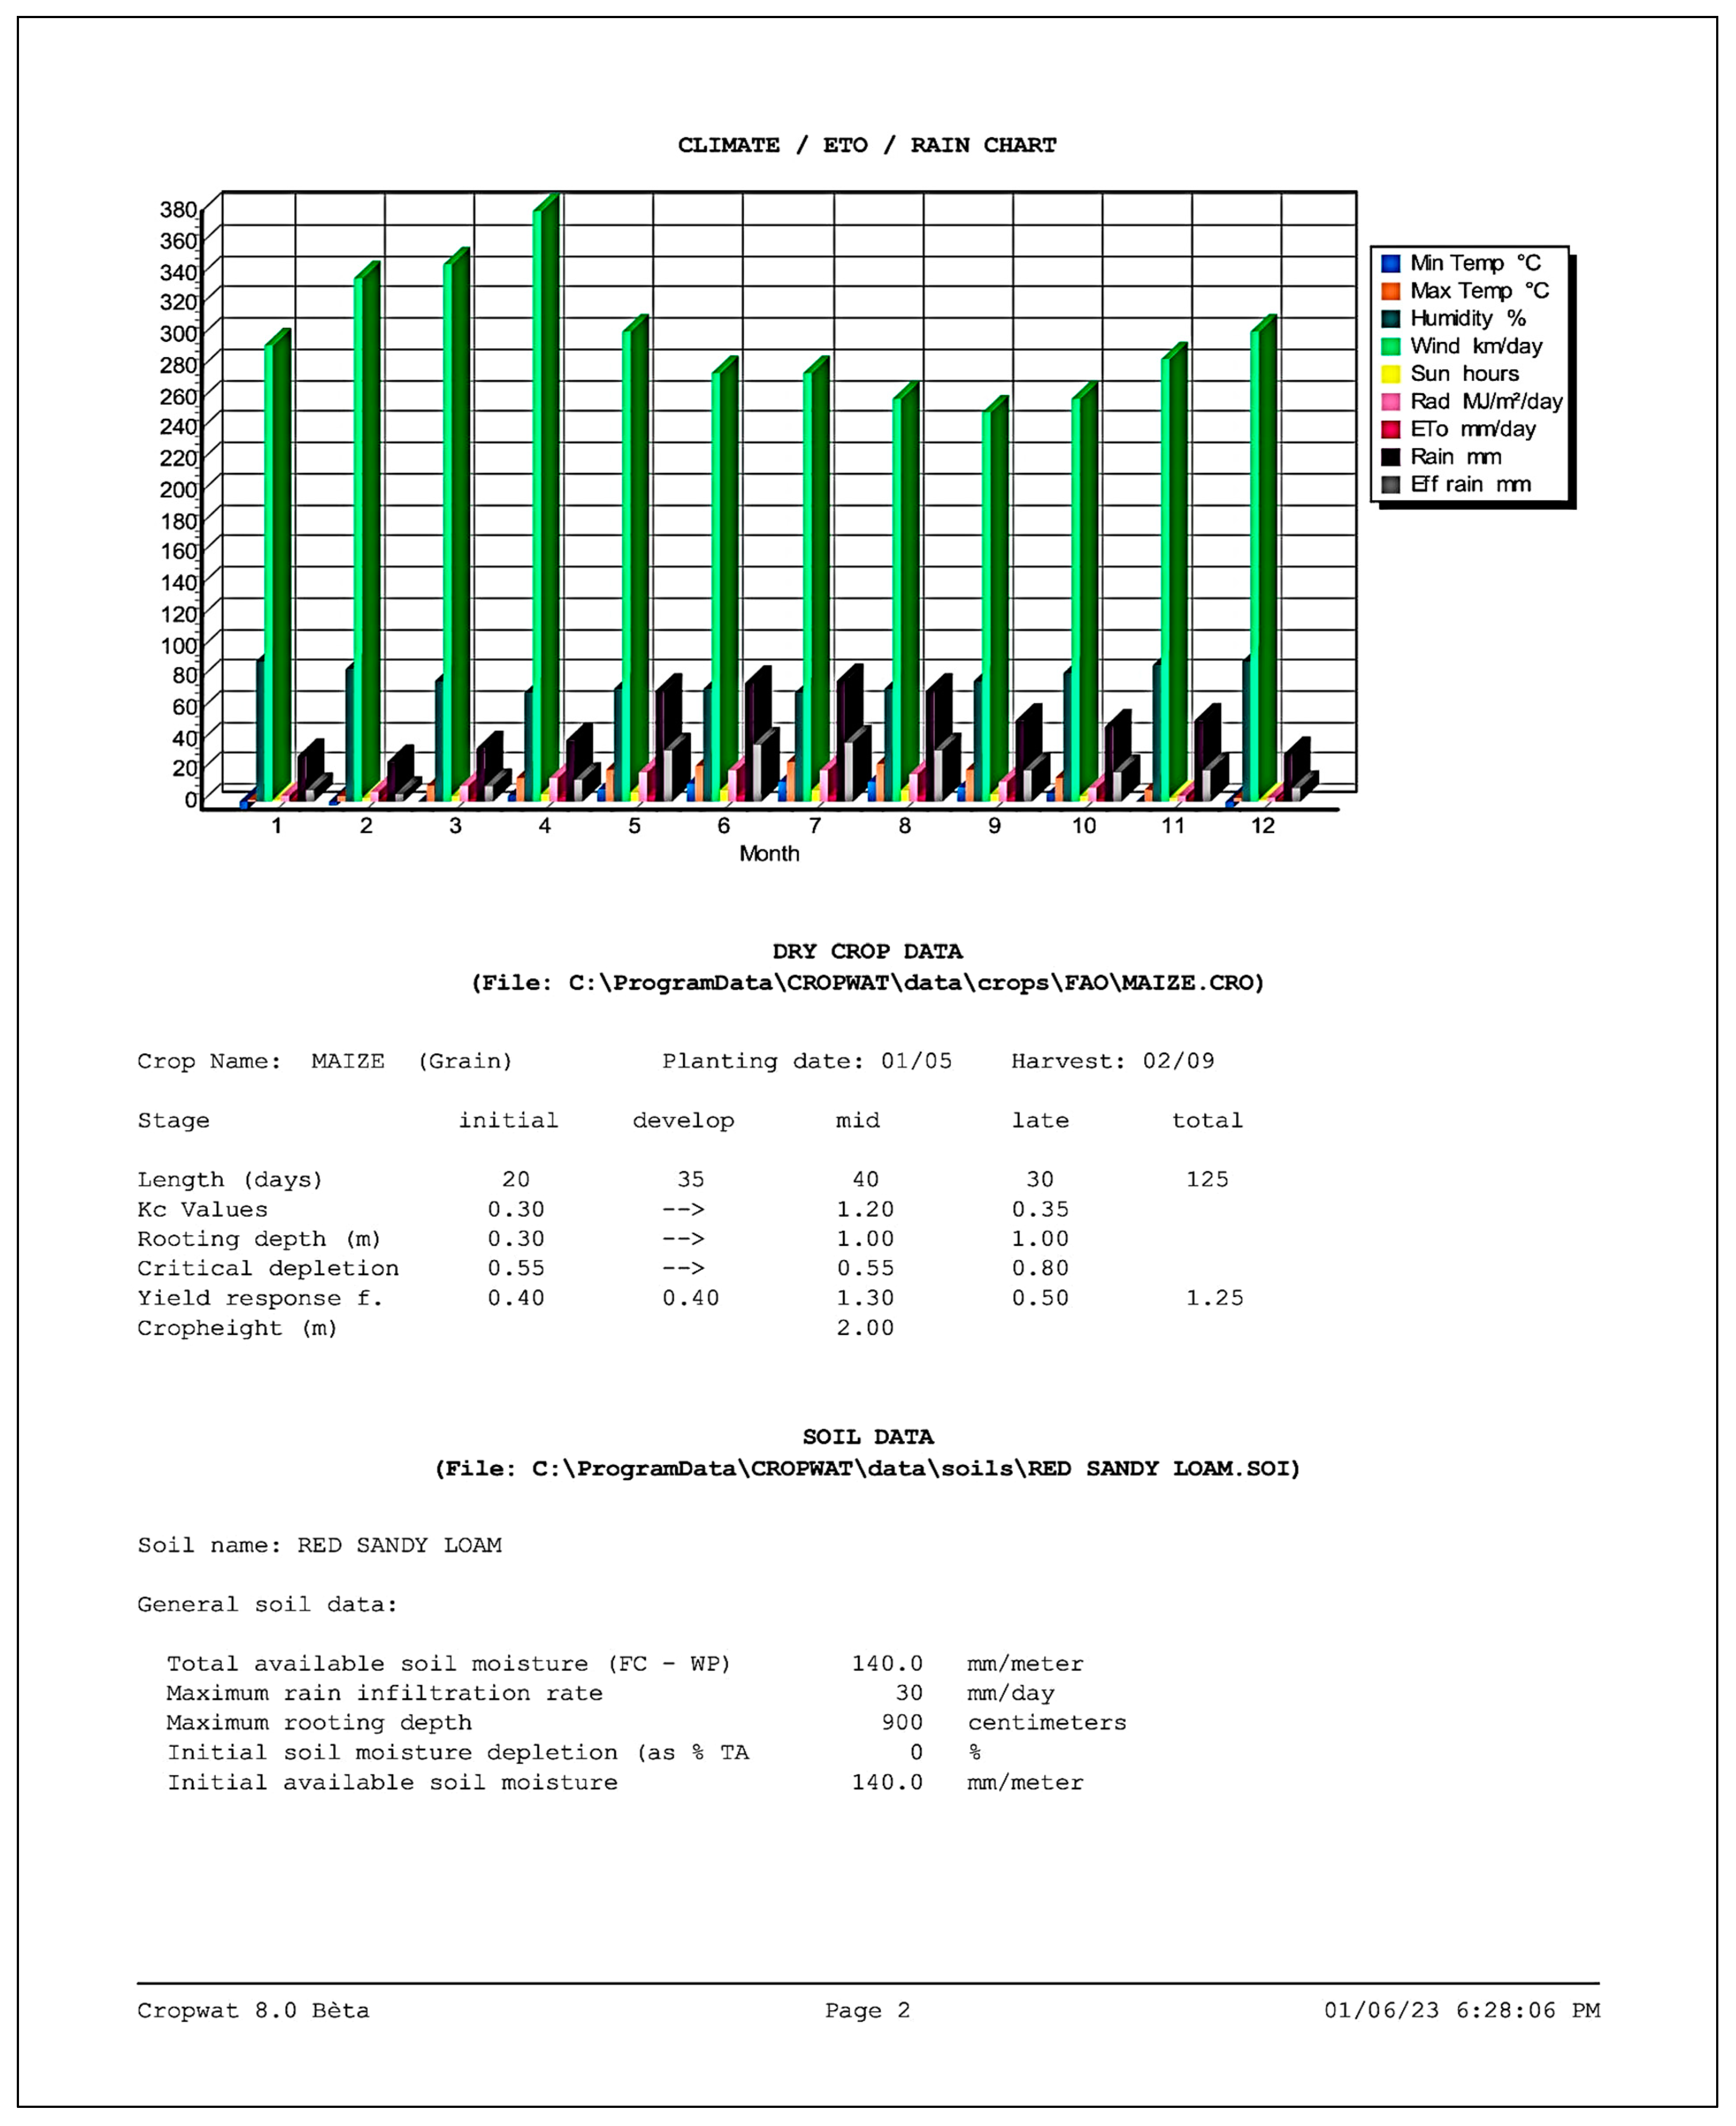
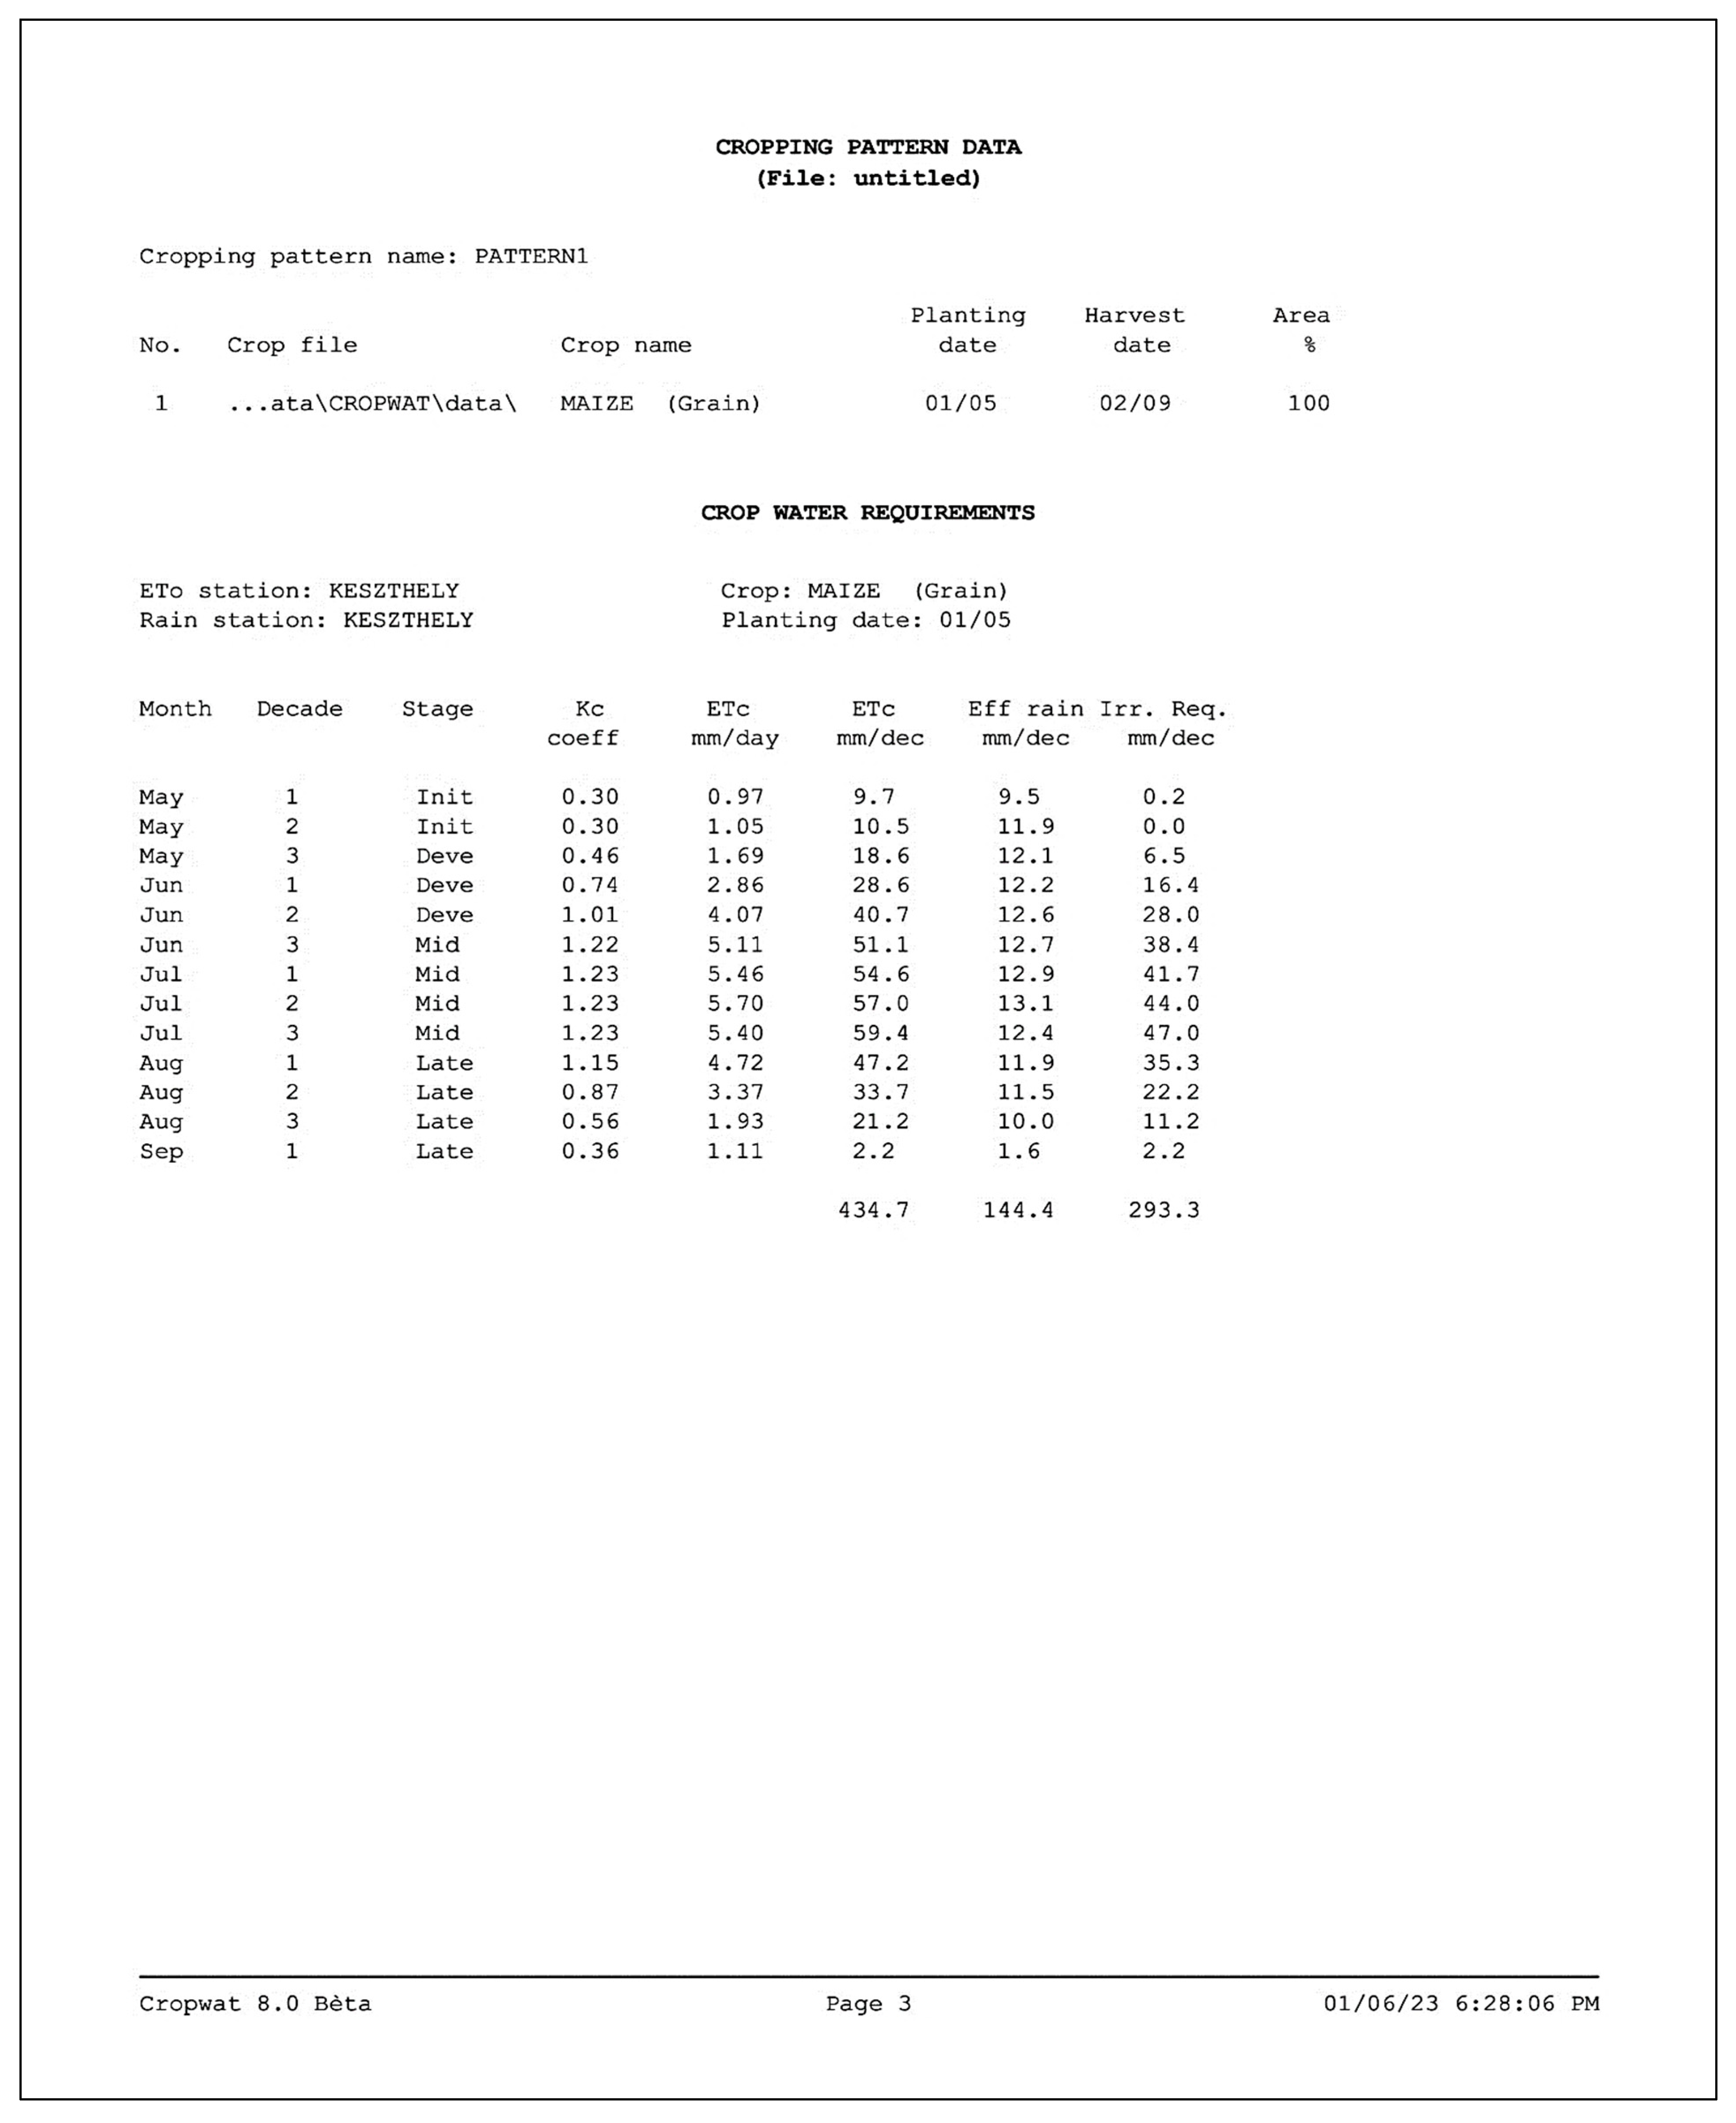
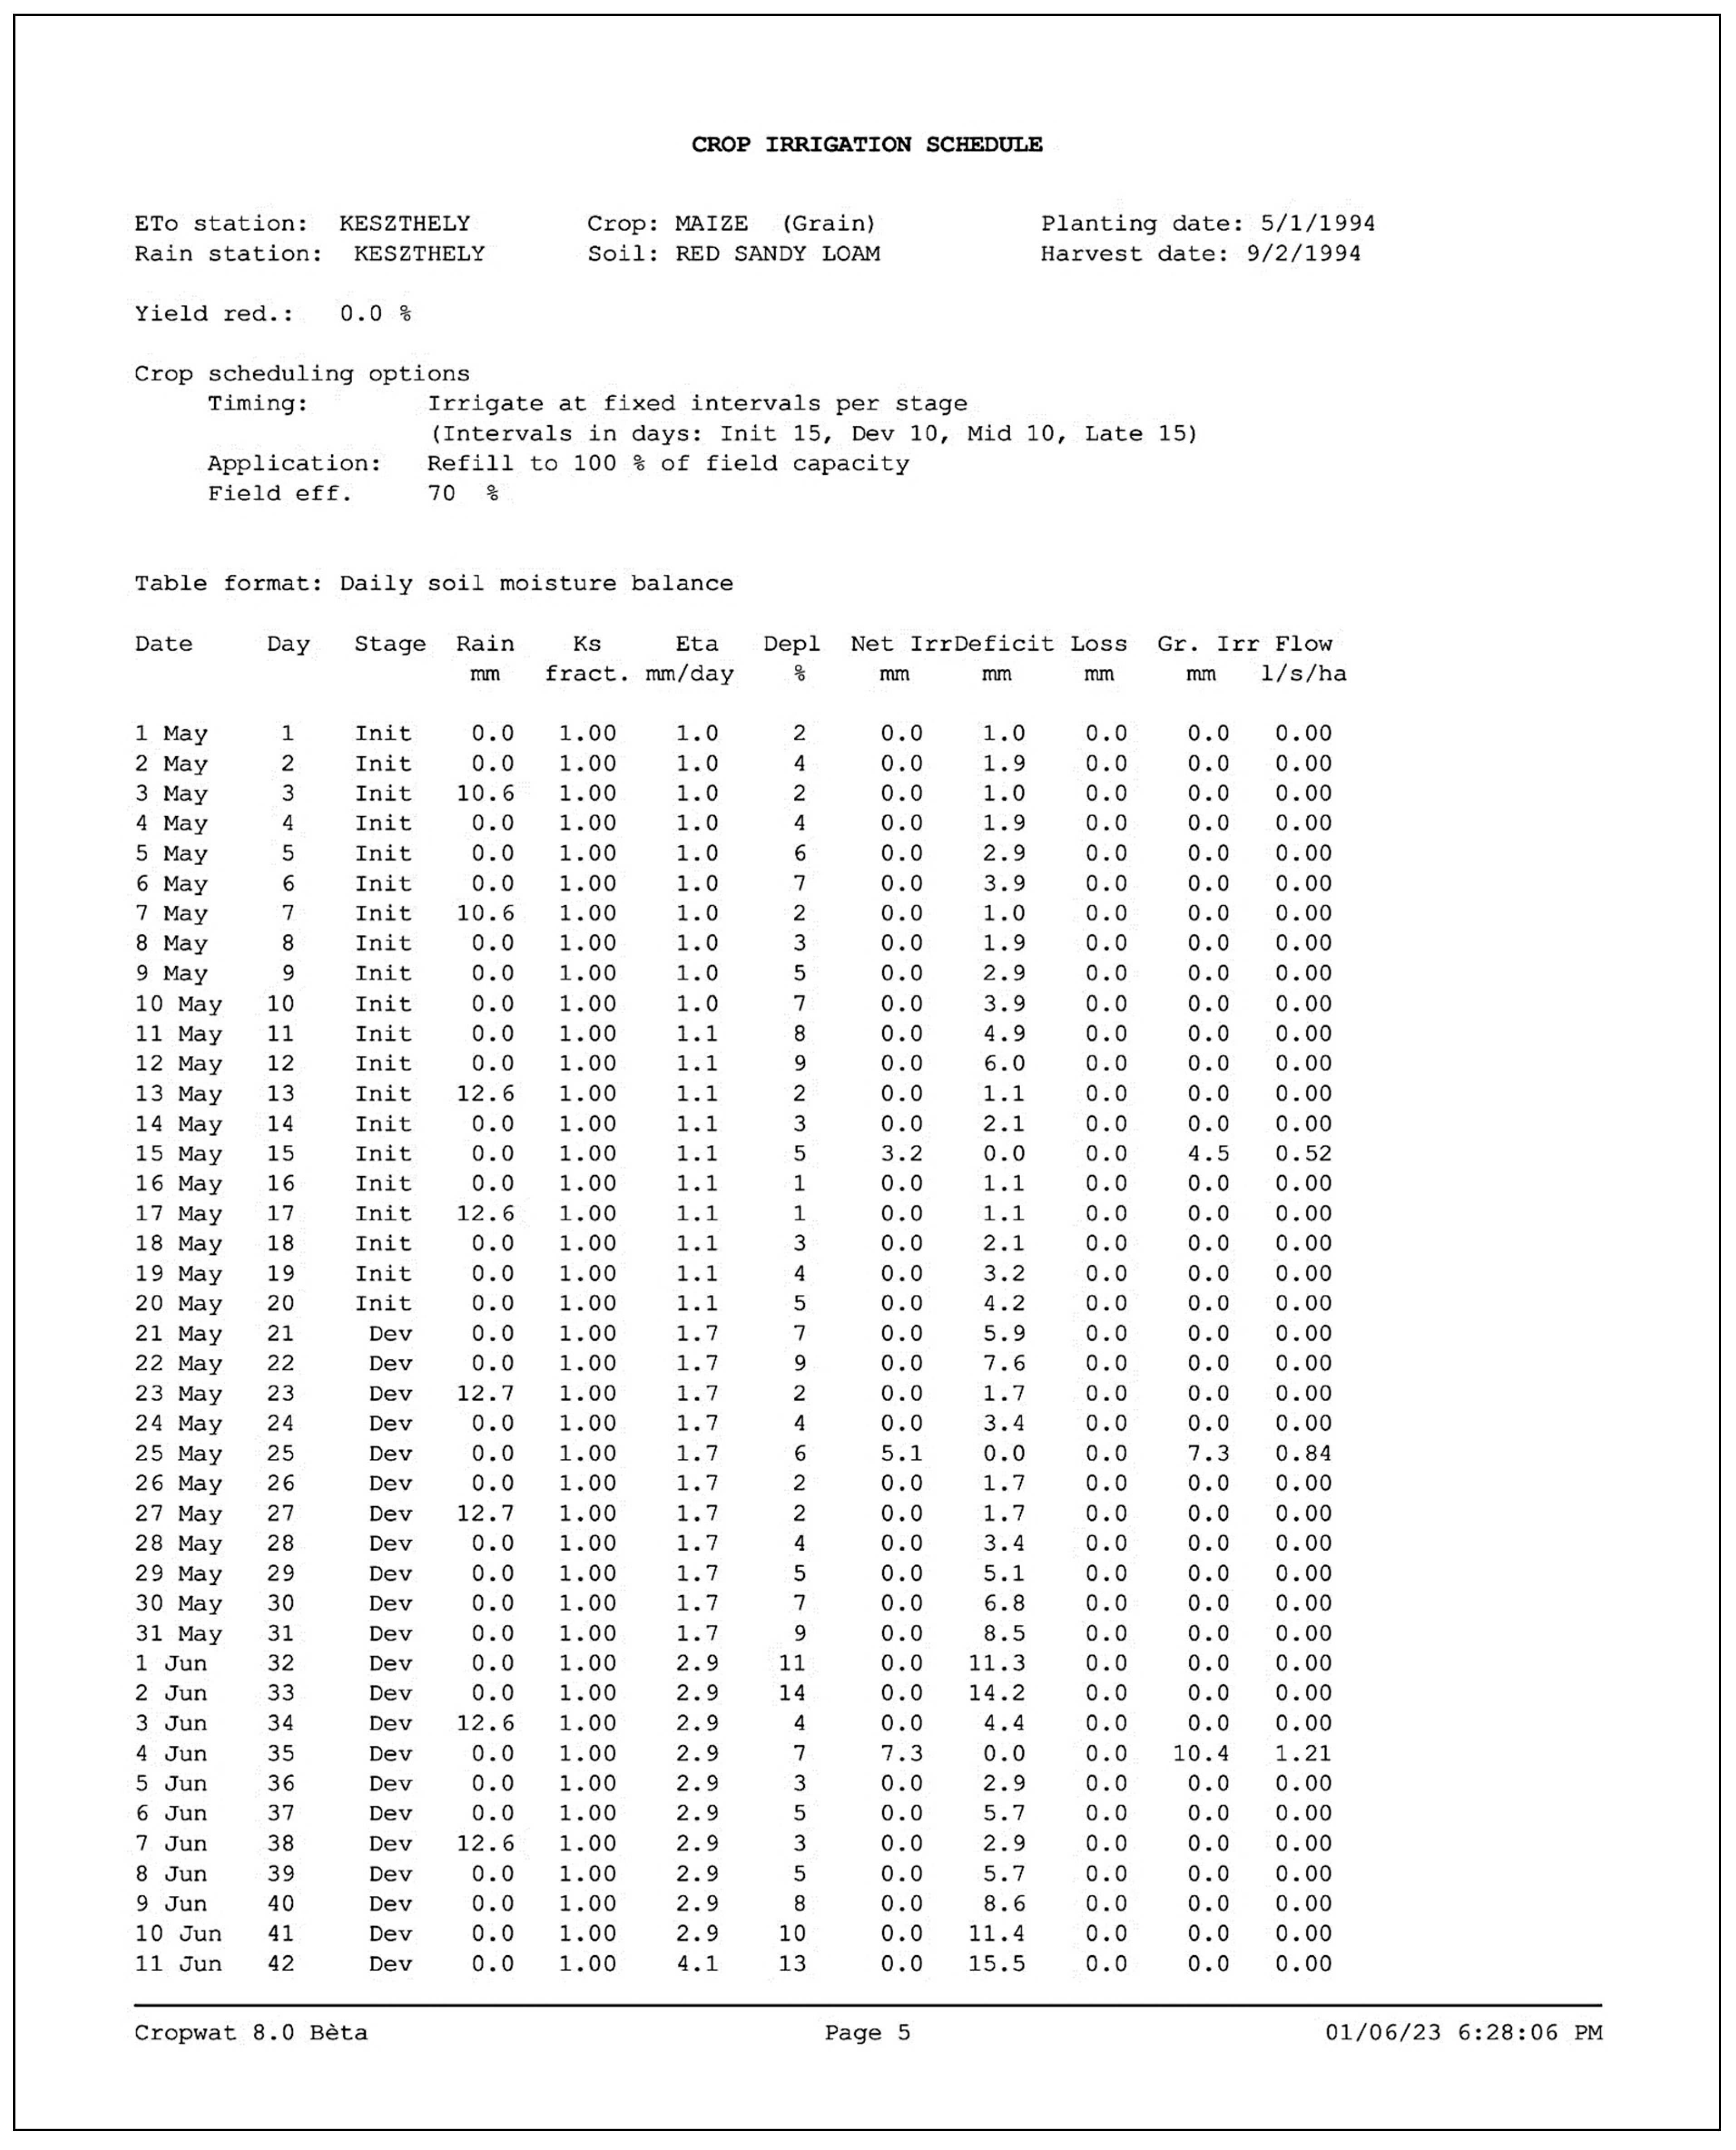
2.1. Layout, Scheduling, and Implements for Growing Maize Plants
- 1st time, in the vegetative phase (60 DAS).
- 2nd time, in the vegetative phase (71 DAS).
- 3rd time, in the reproductive development stages (87 DAS).
- 4th time, by the end of the generative phase (100 DAS).
2.2. Synthesis and Analysis of the Characteristics of Zinc Oxide NPs
2.3. Analysis of Chlorophyll Concentration and Morphological Characteristics
2.4. Determination of Proline Content
2.5. Protein Content Analysis
2.6. Quantification of the Concentration of Unbound Amino Acids
2.7. Determination of Total Soluble (Hydrolyzable) Sugars
2.8. Assessment of Malondialdehyde (MDA)
2.9. Determination of Hydrogen Peroxide (H2O2)
2.10. Fatty Acids Profile; Gas Liquid Chromatography (GLC) Analysis
2.11. Using NIRS™ DS 2500 FOSS to Assess Dry Matter, Protein, Neutral and Acid Detergent Fibers (NDF and ADF), and Ash in Maize Leaves and Assess the Moisture Content, Crude Protein, Crude Fat, Crude Ash, and Starch in Maize Grains (Seeds)
2.12. Statistical Analysis
3. Results
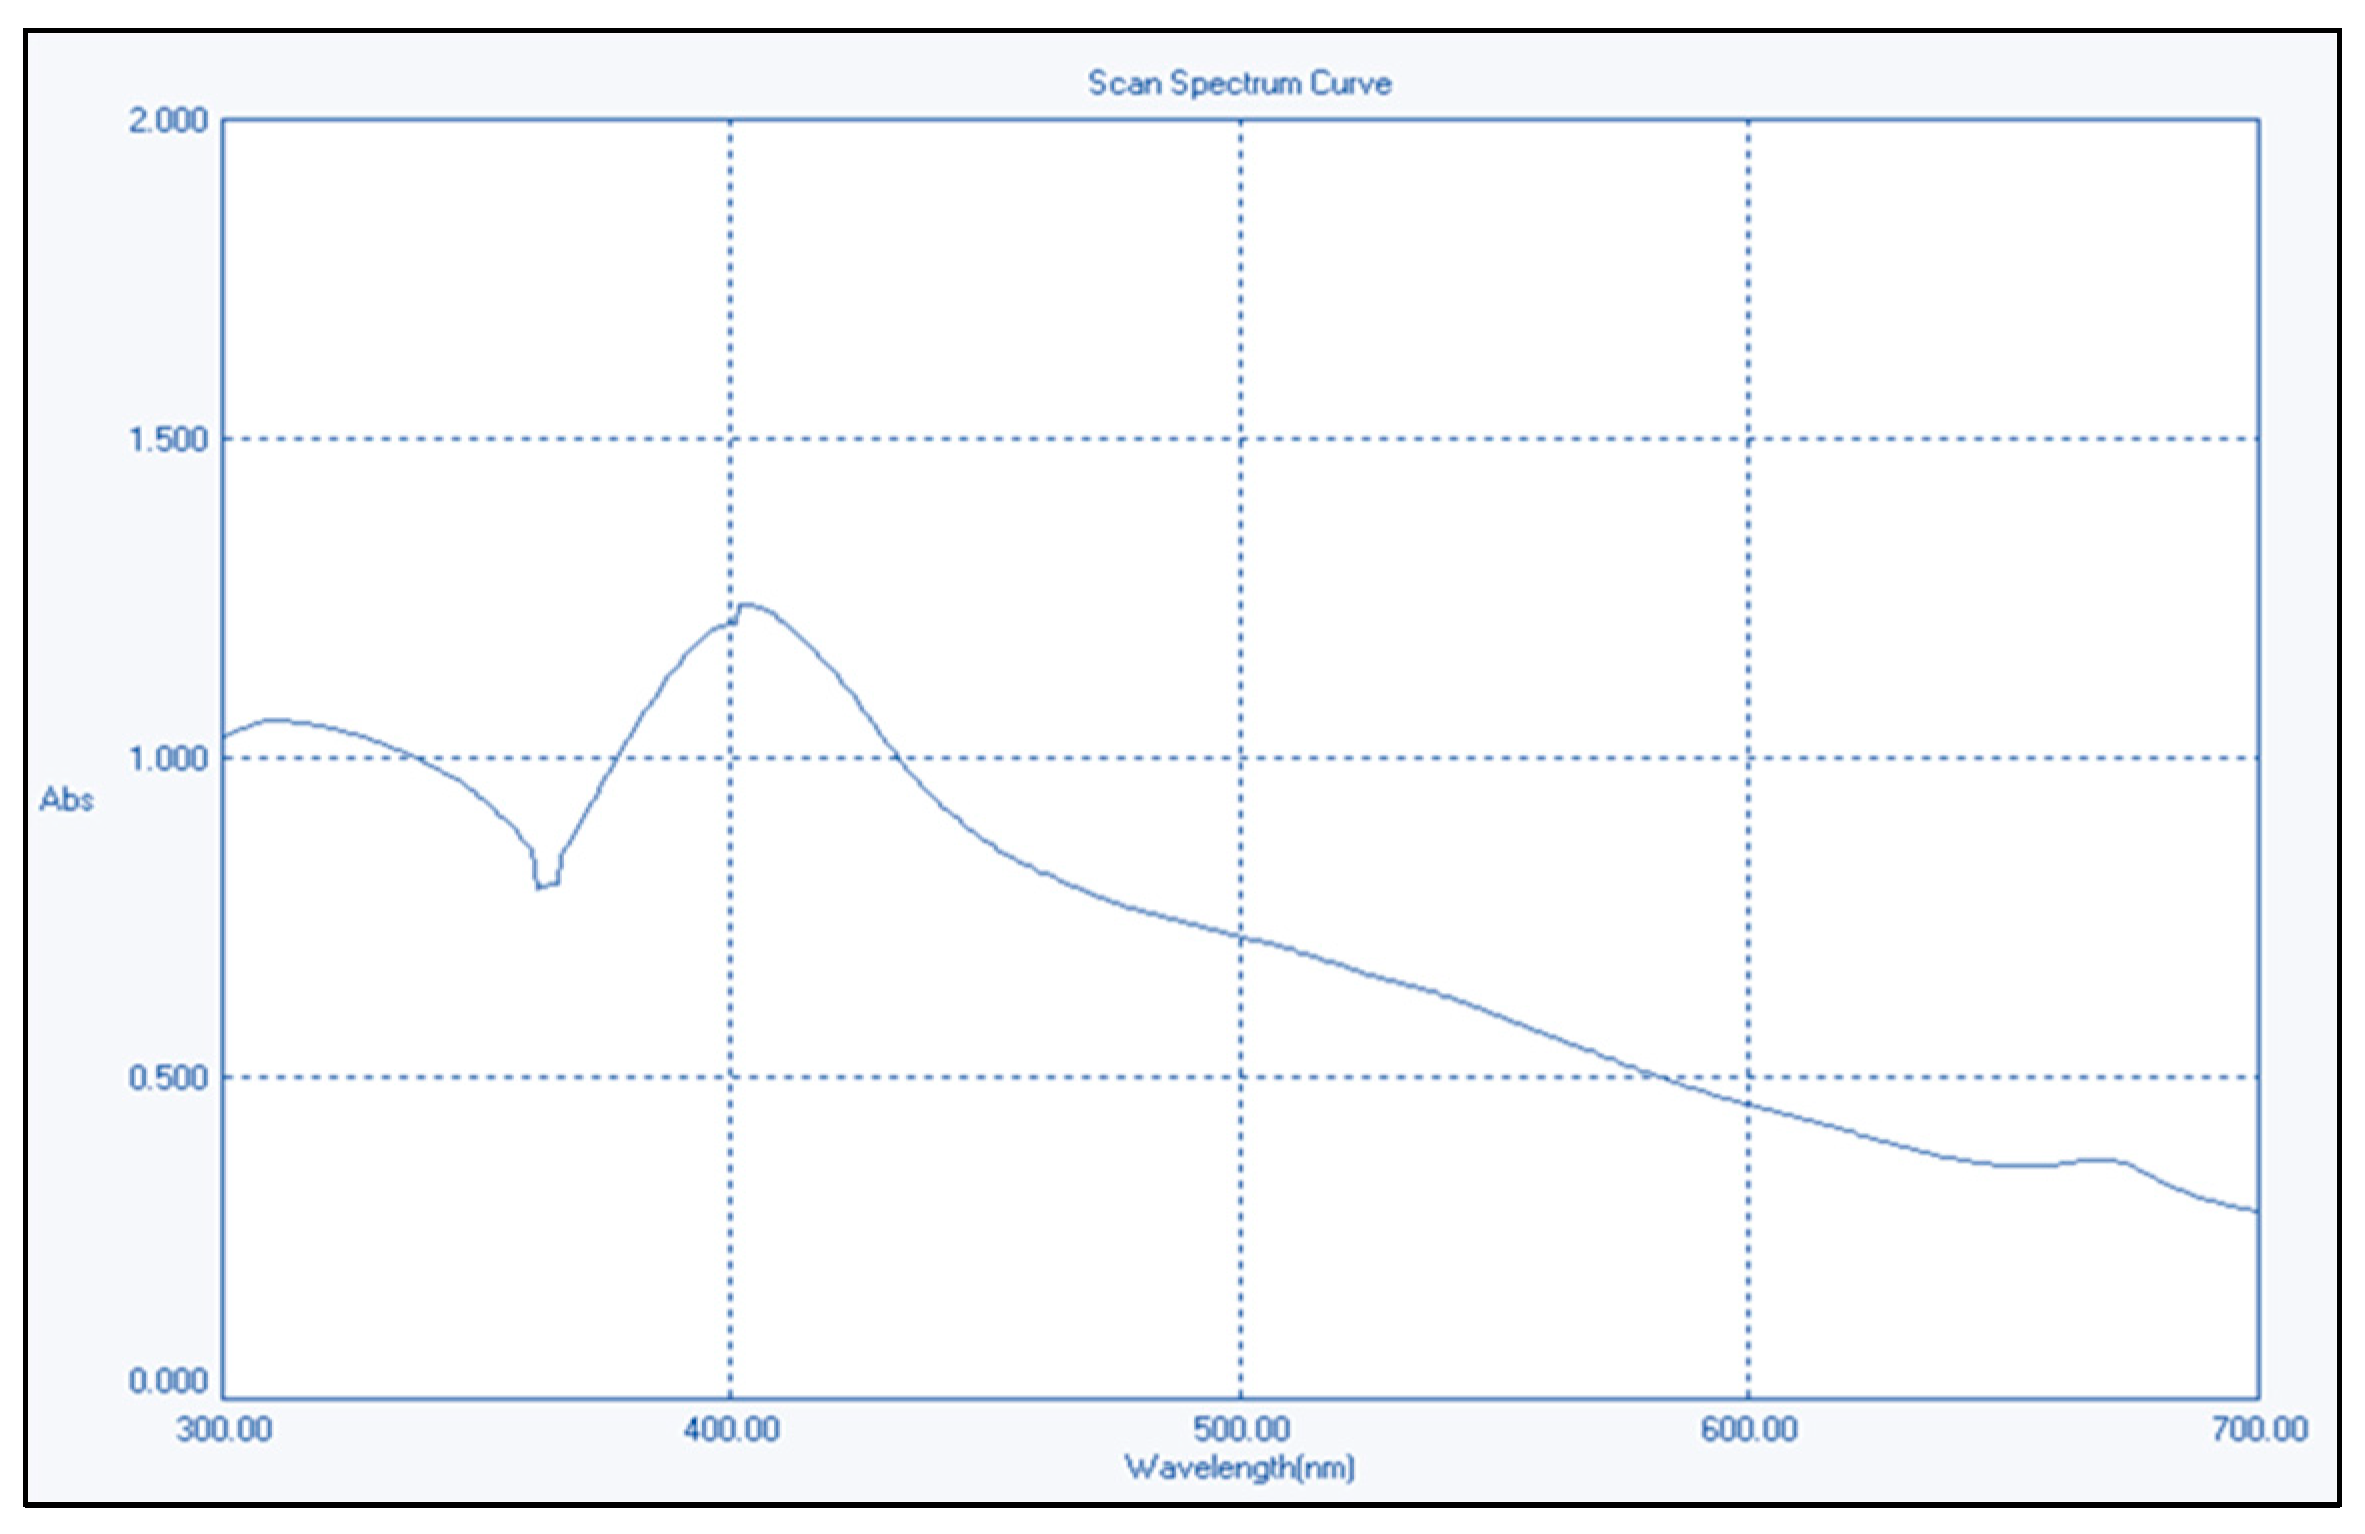
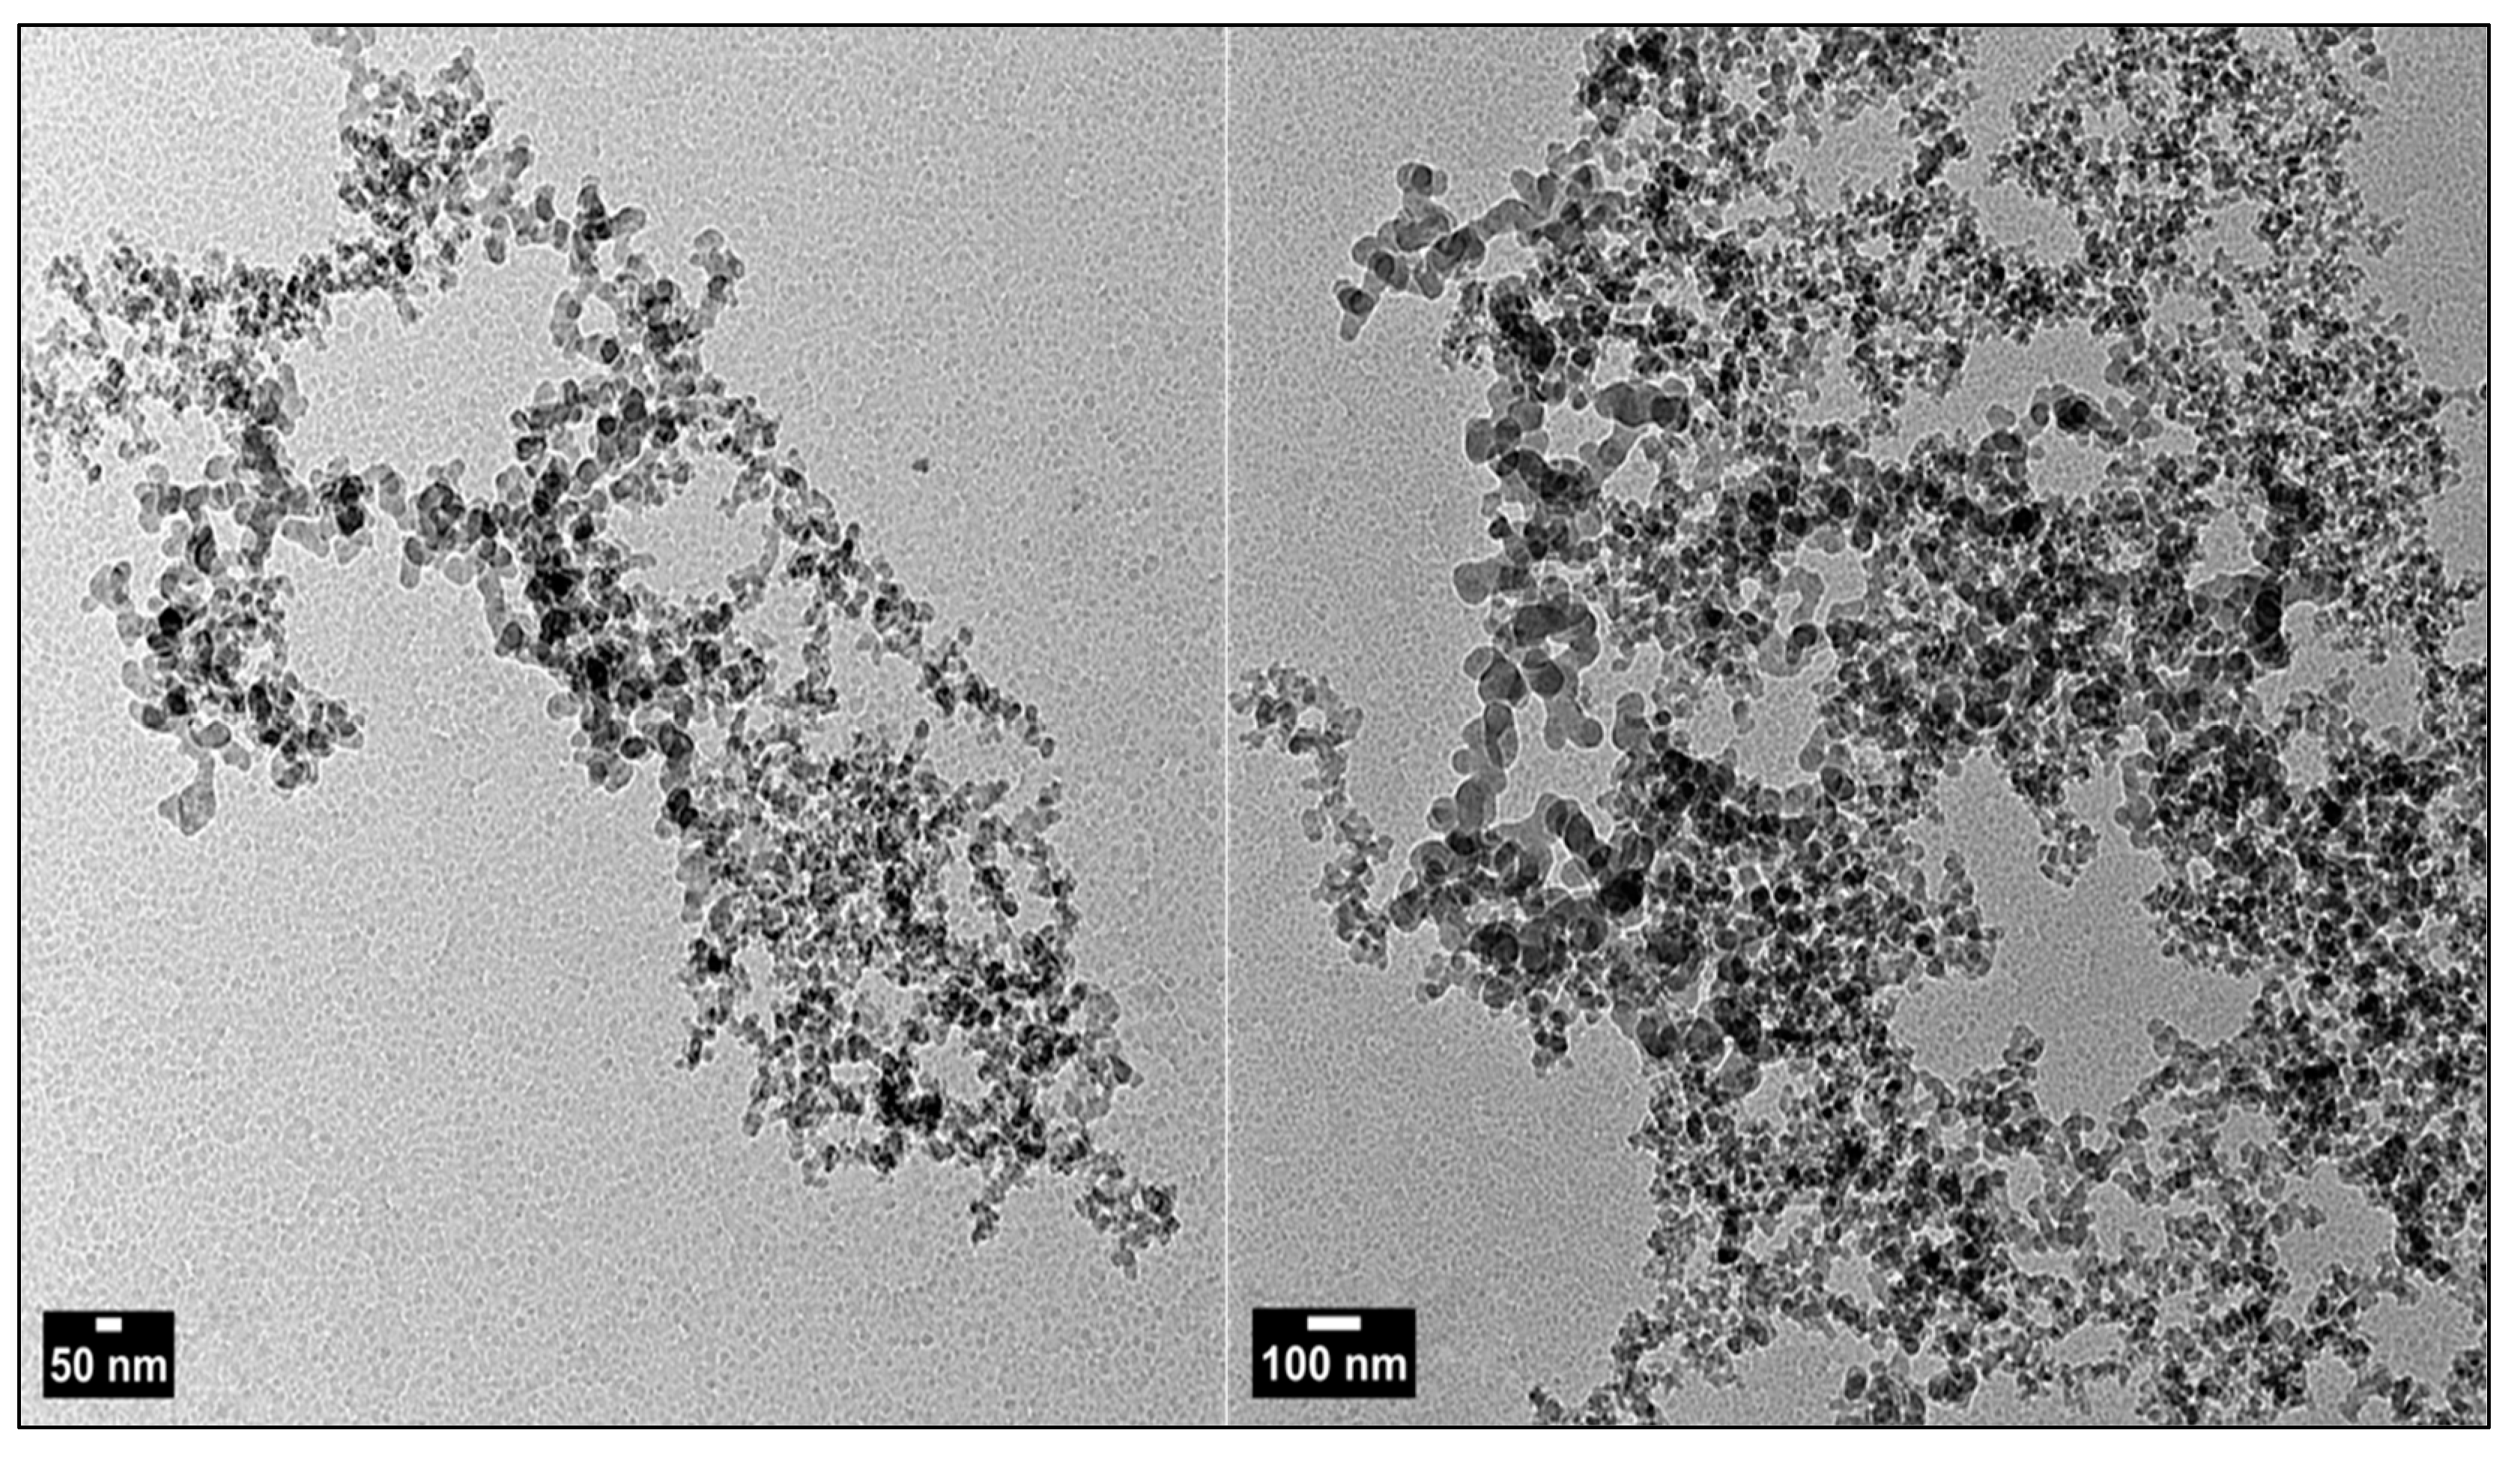
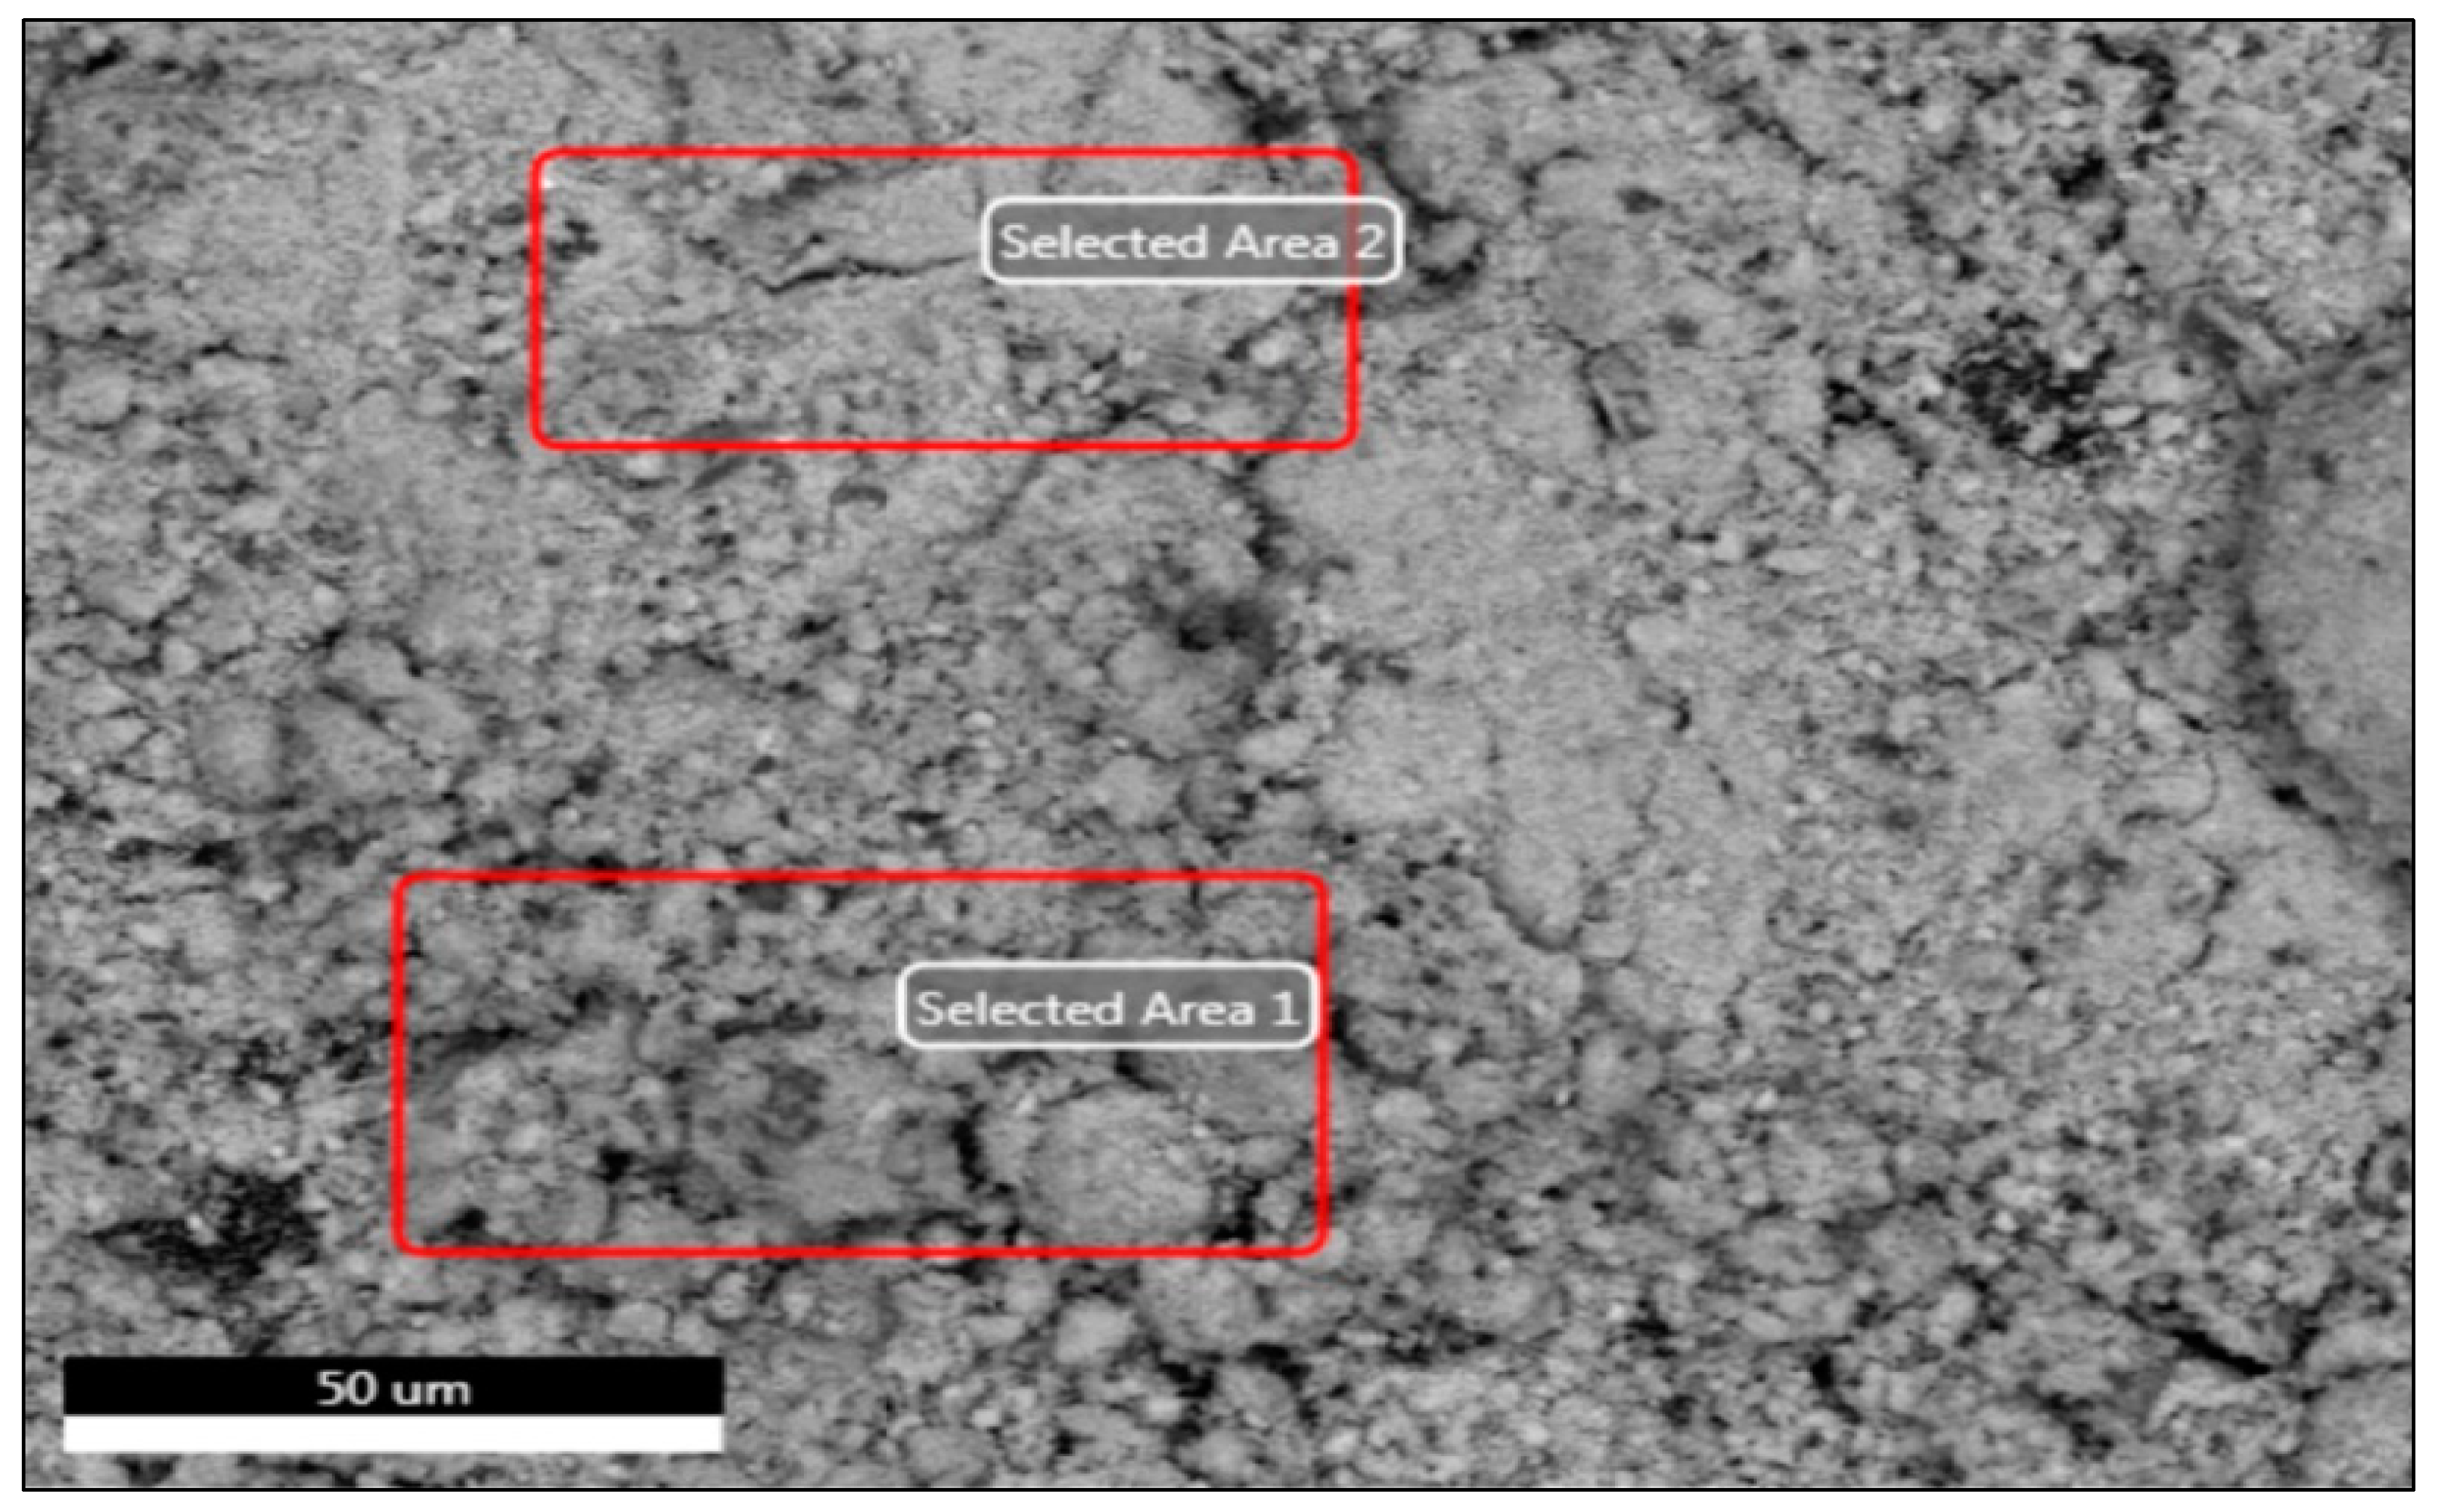
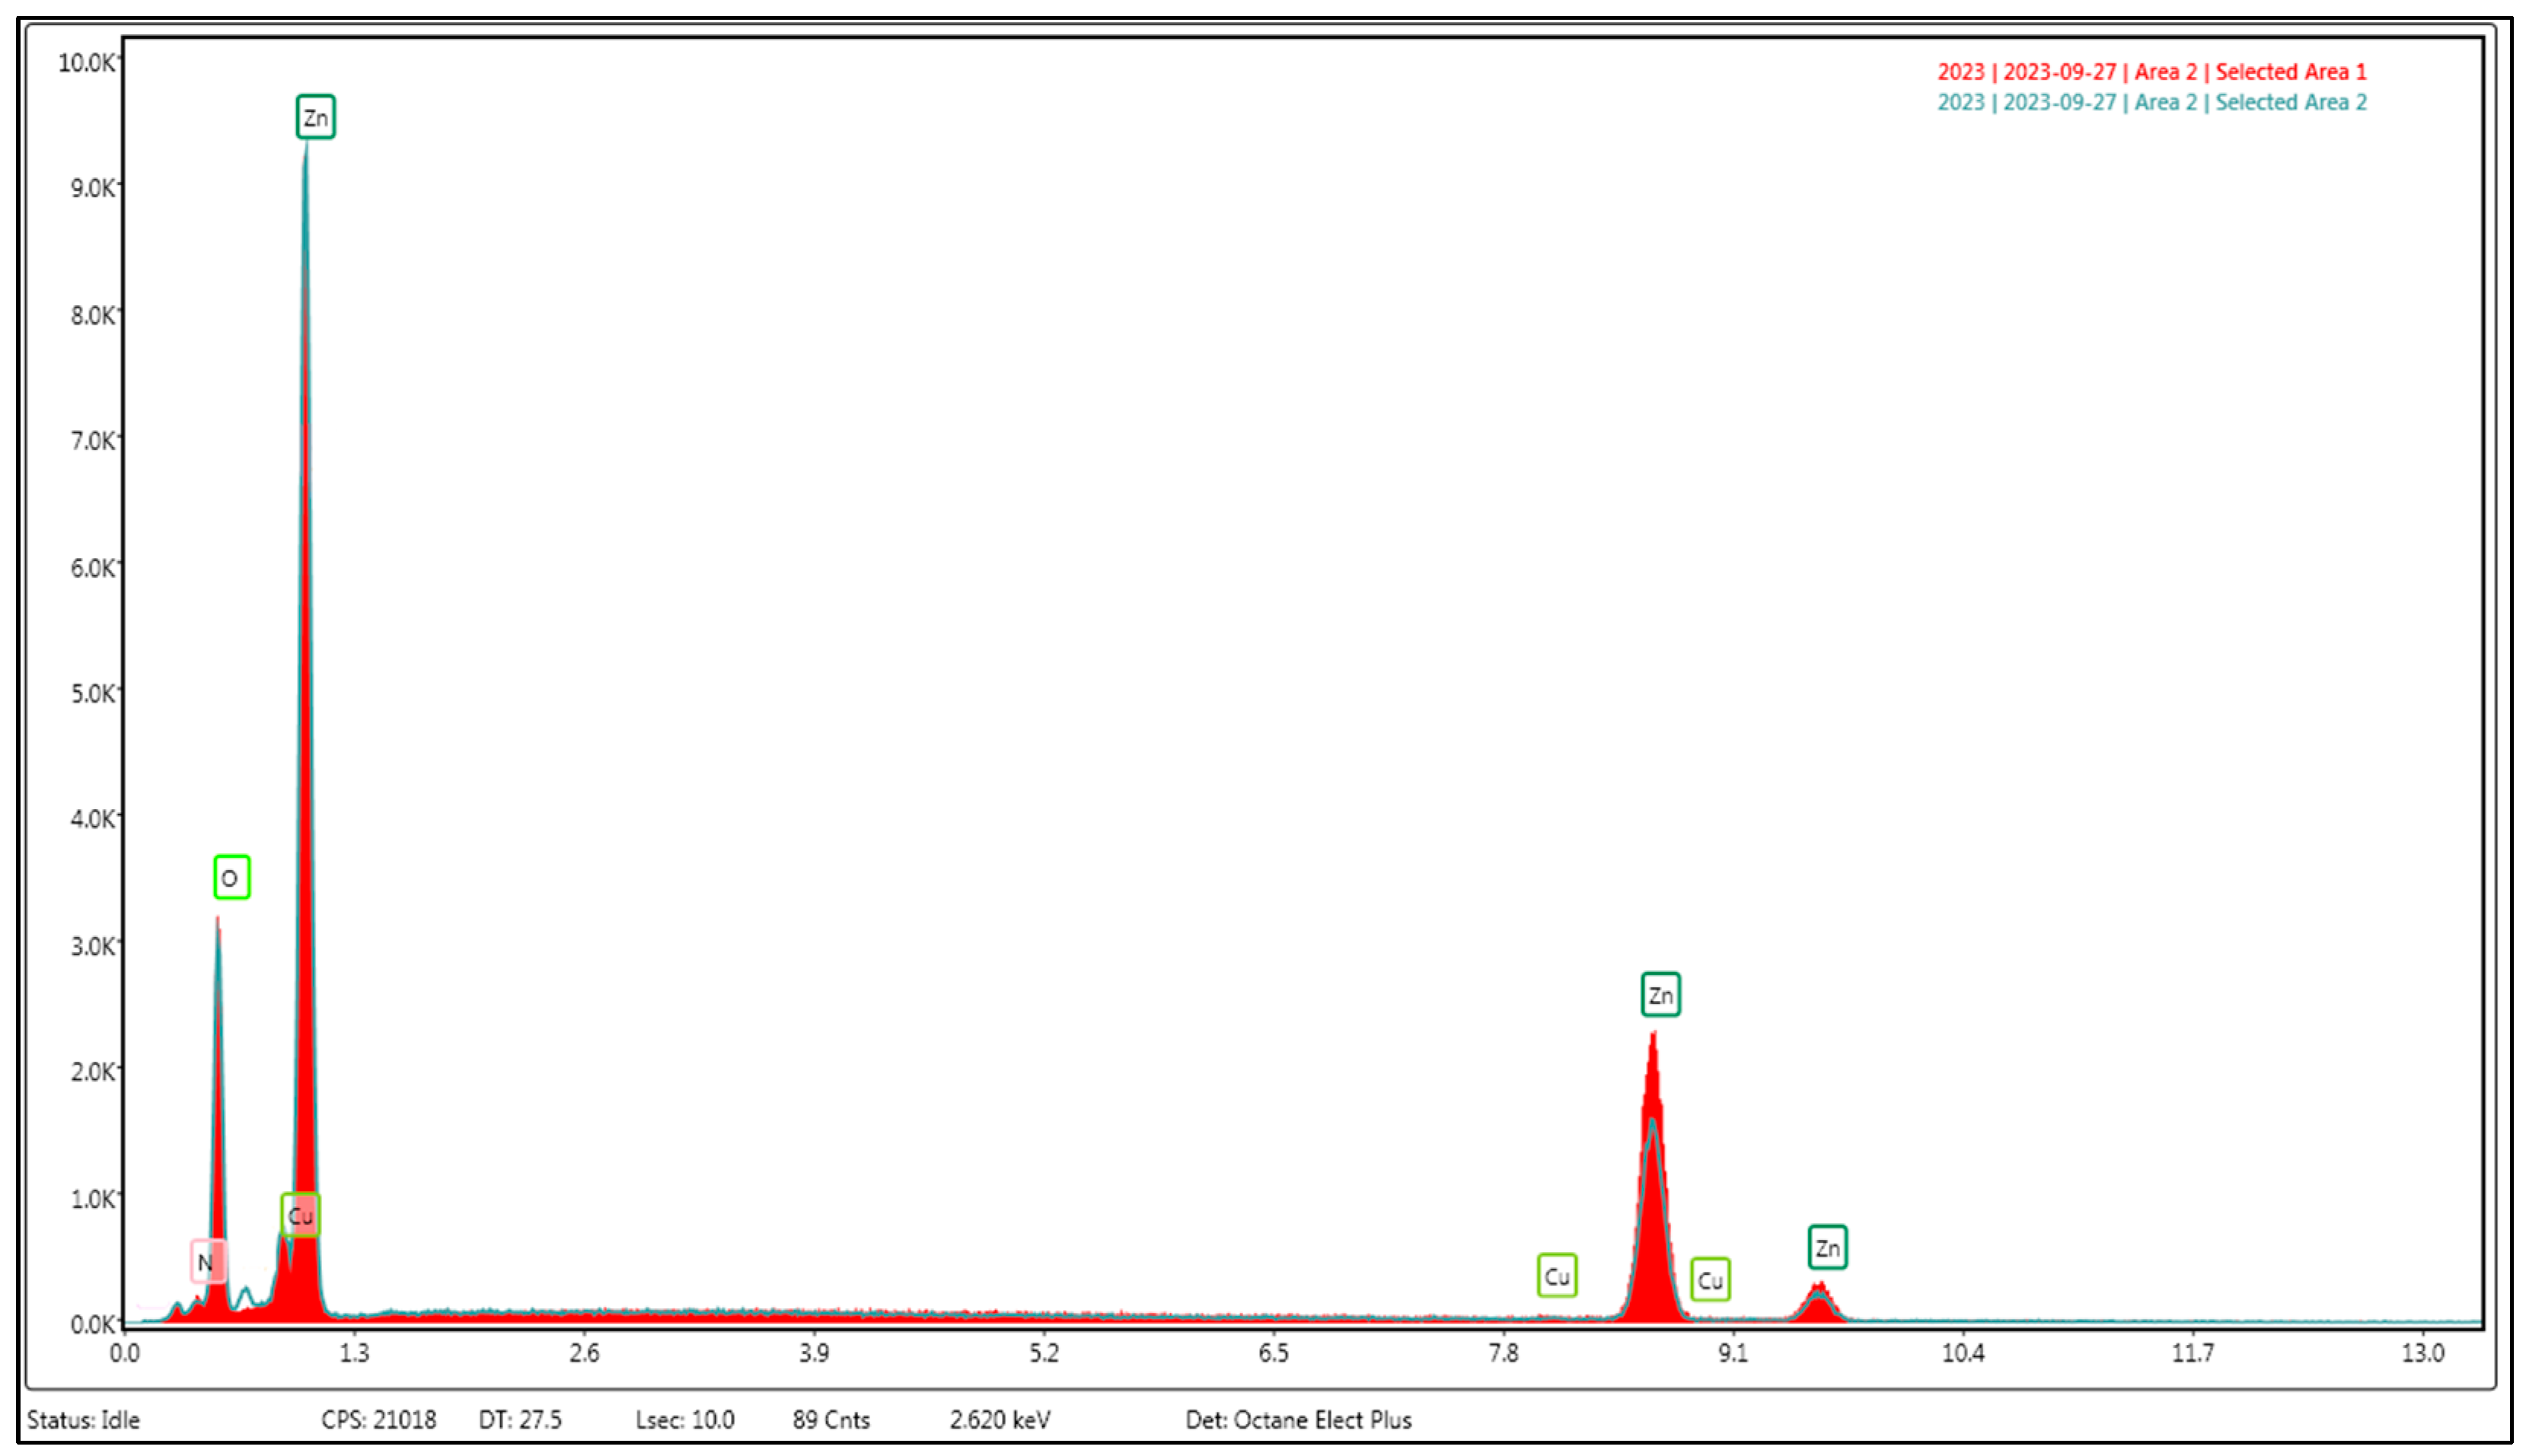
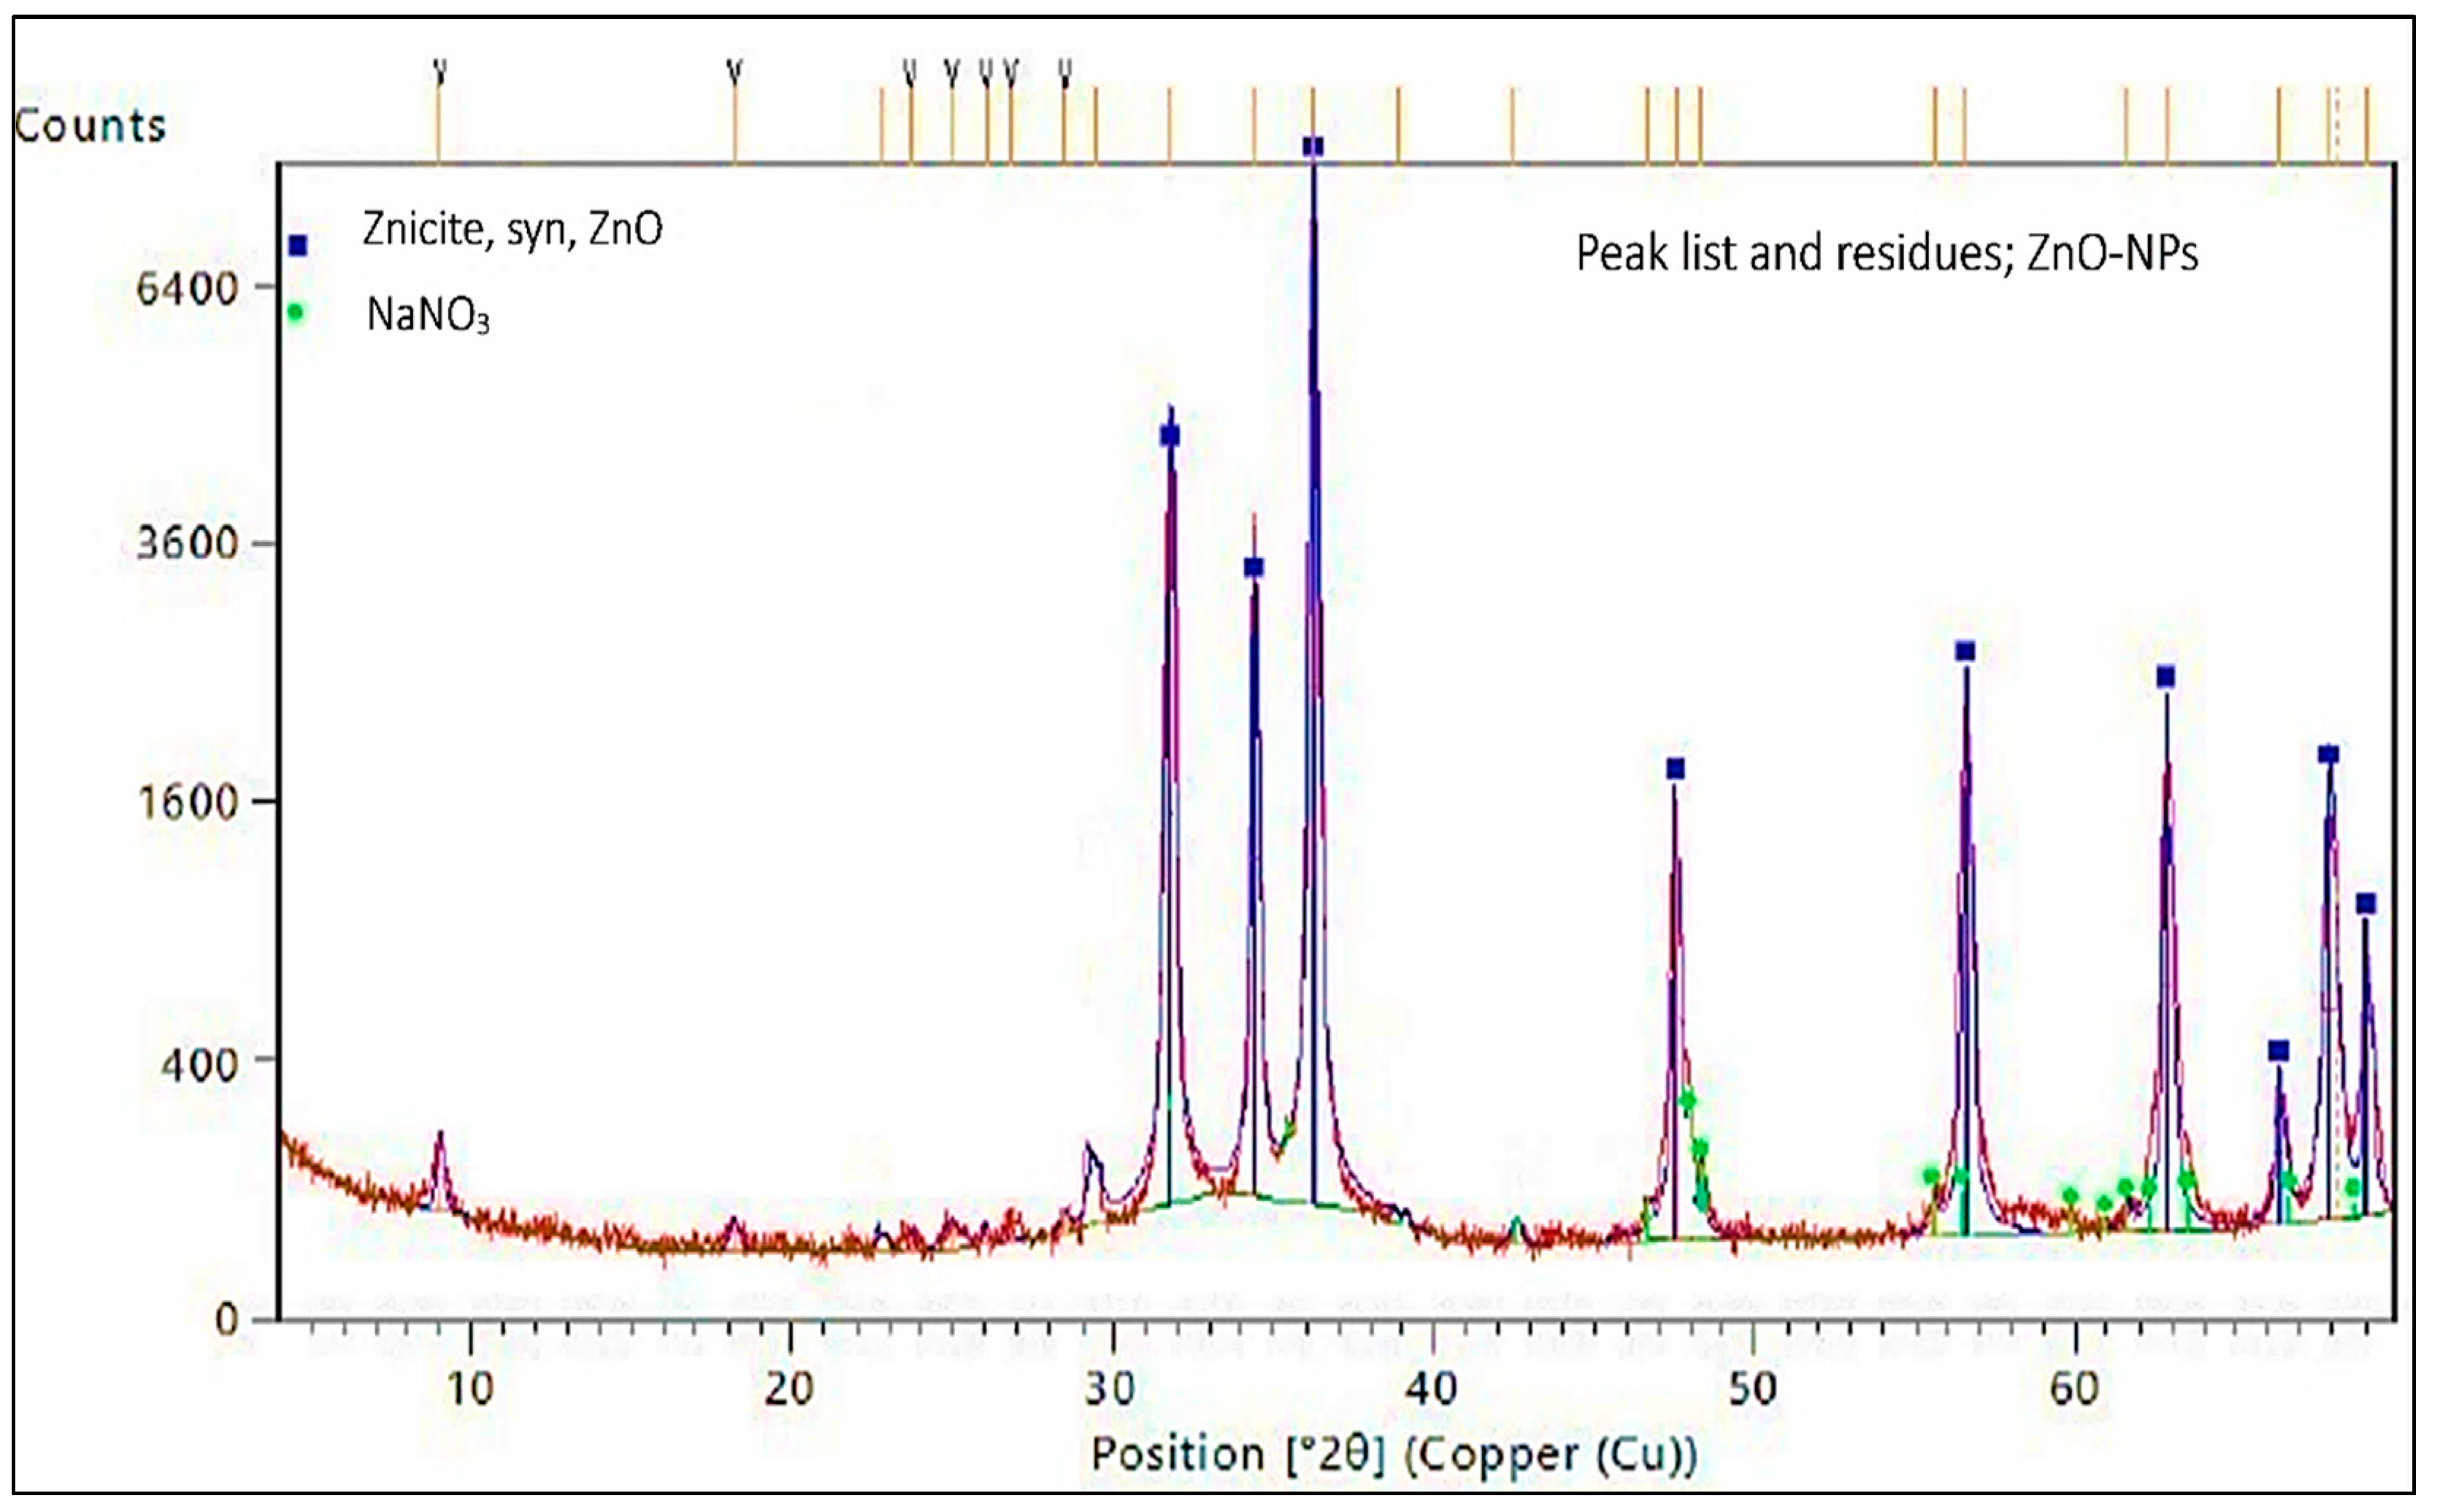
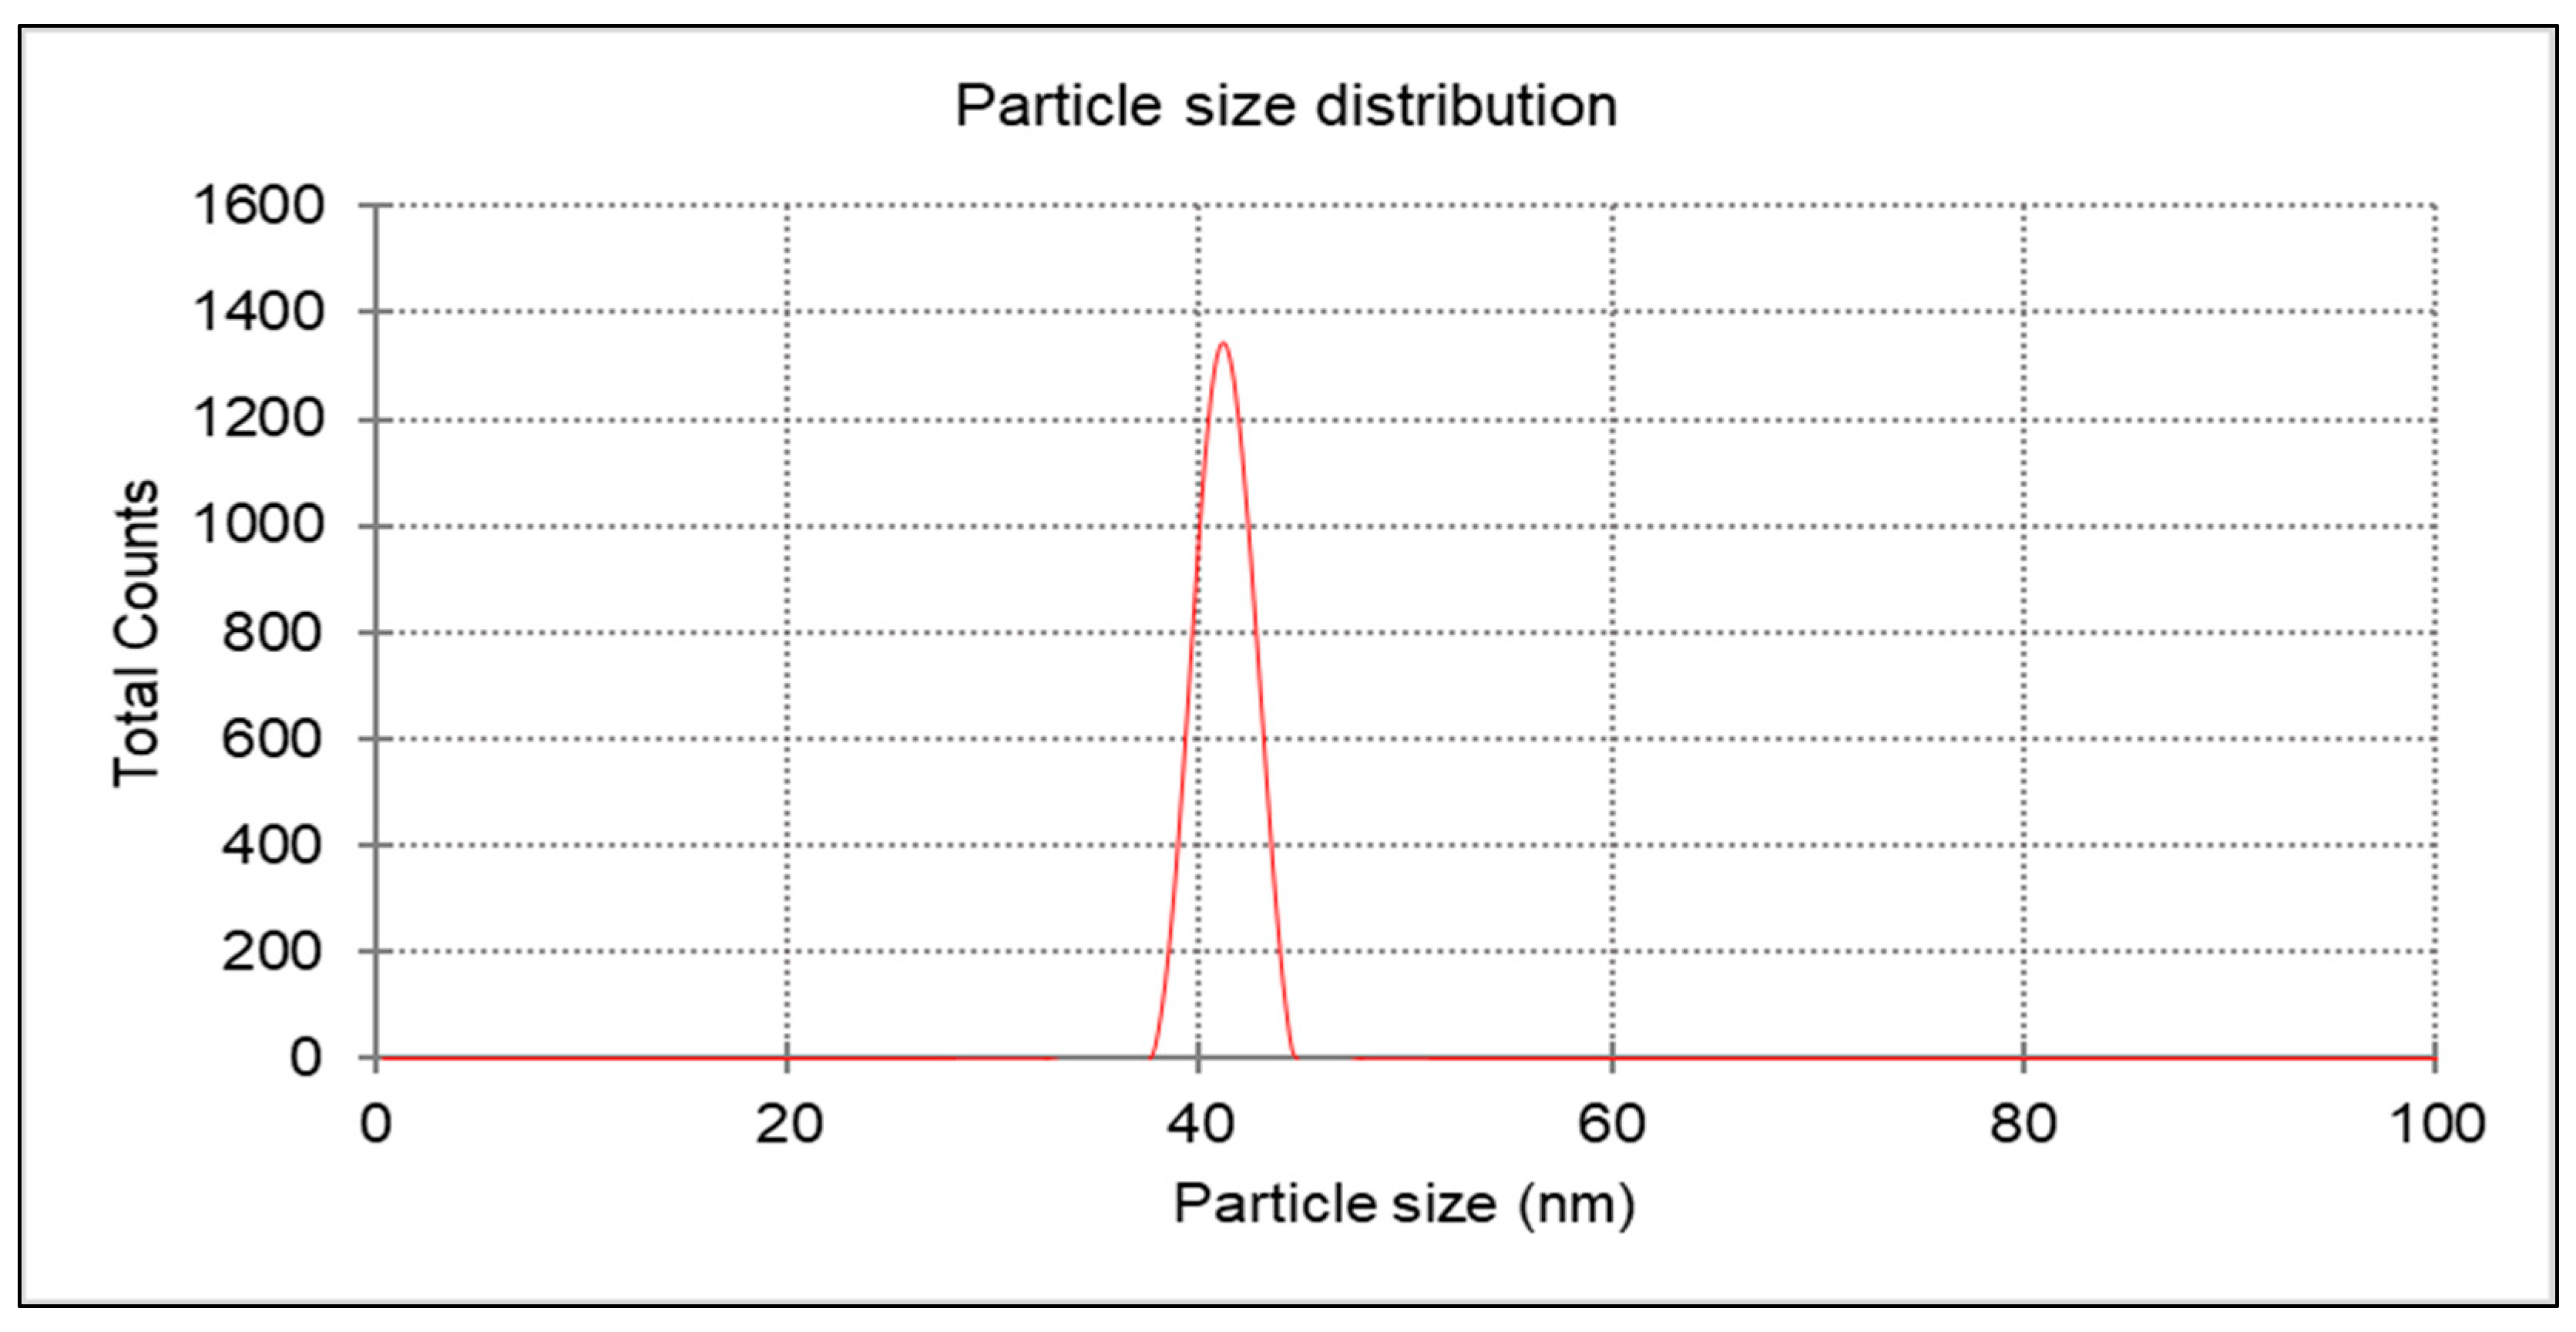
3.1. Characterization and Investigation of Chemically Generated Zinc Oxide NPs
3.2. Evaluation of the Chlorophyll and Growth Characteristics in Various Treatments of Maize
3.3. Analysis of Maize Leaves That Were Submitted to a Variety of Treatments to Identify Several Biochemical and Stress Parameters
3.4. Finding Various Post-Harvest Parameters in Maize Seeds and Leaves from Diverse Treatments
3.5. Analyzing the Dry Matter, Protein, and Acid and Neutral Detergent Fibers in Maize Leaves and the Water Content, Protein, Fat, and Starch in Maize Grains (Seeds)
3.6. Gas Chromatographic (GC) Analysis of Long-Chain Fatty Acids (LCFA) in Maize Seeds (Grains)
4. Discussion
4.1. Characterization of Chemically Generated Zinc Oxide NPs
4.2. Analyzing the Effects of Various Maize Treatments on Growth and Chlorophyll Levels
4.3. Analysis of Various Biochemical and Stress Indicators in Variously Treated Maize Leaves
4.4. Determination of Different Post-Harvest Measurements in the Leaves and Seeds from Different Treatments of Maize
4.5. Assessment of Dry Matter, Protein, Neutral and Acid Detergent Fibers in Maize Leaves, and the Moisture Content, Protein, Fat, and Starch in Maize Grains (Seeds)
4.6. Gas Chromatographic (GC) Analysis of Long-Chain Fatty Acids (LCFA) in Maize Grains (Seeds)
5. Conclusions
Author Contributions
Funding
Data Availability Statement
Acknowledgments
Conflicts of Interest
Appendix A

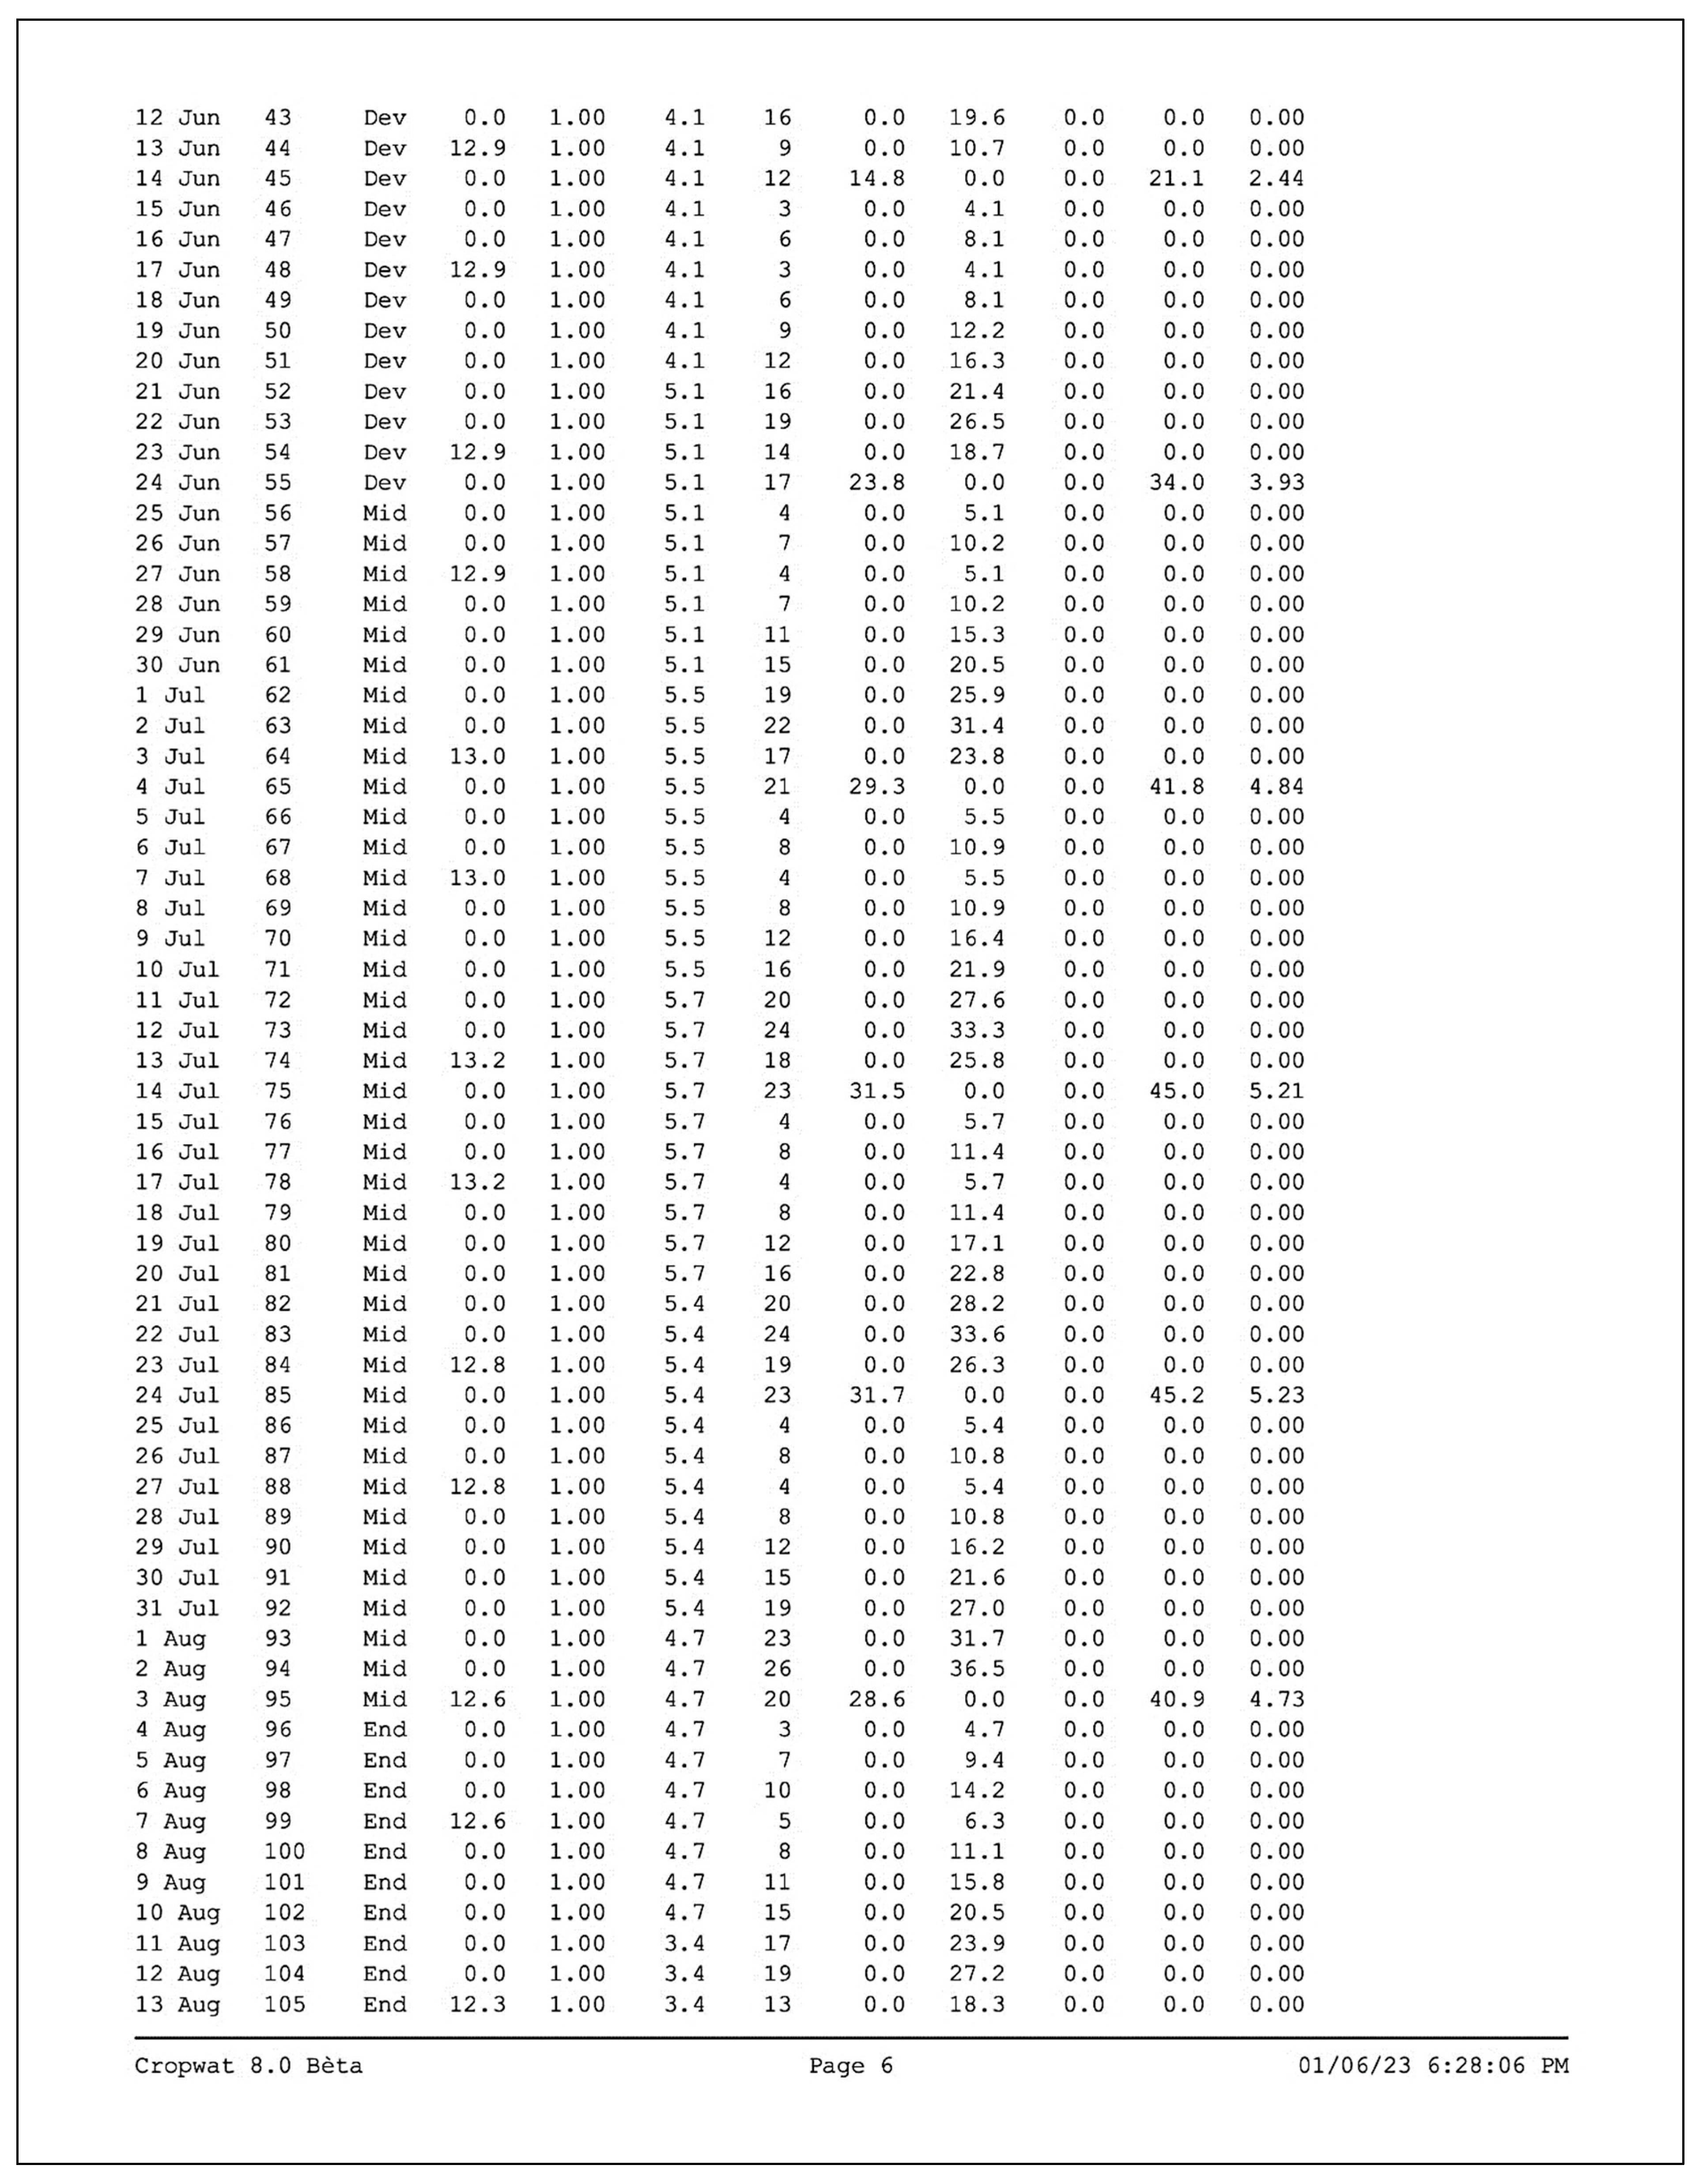
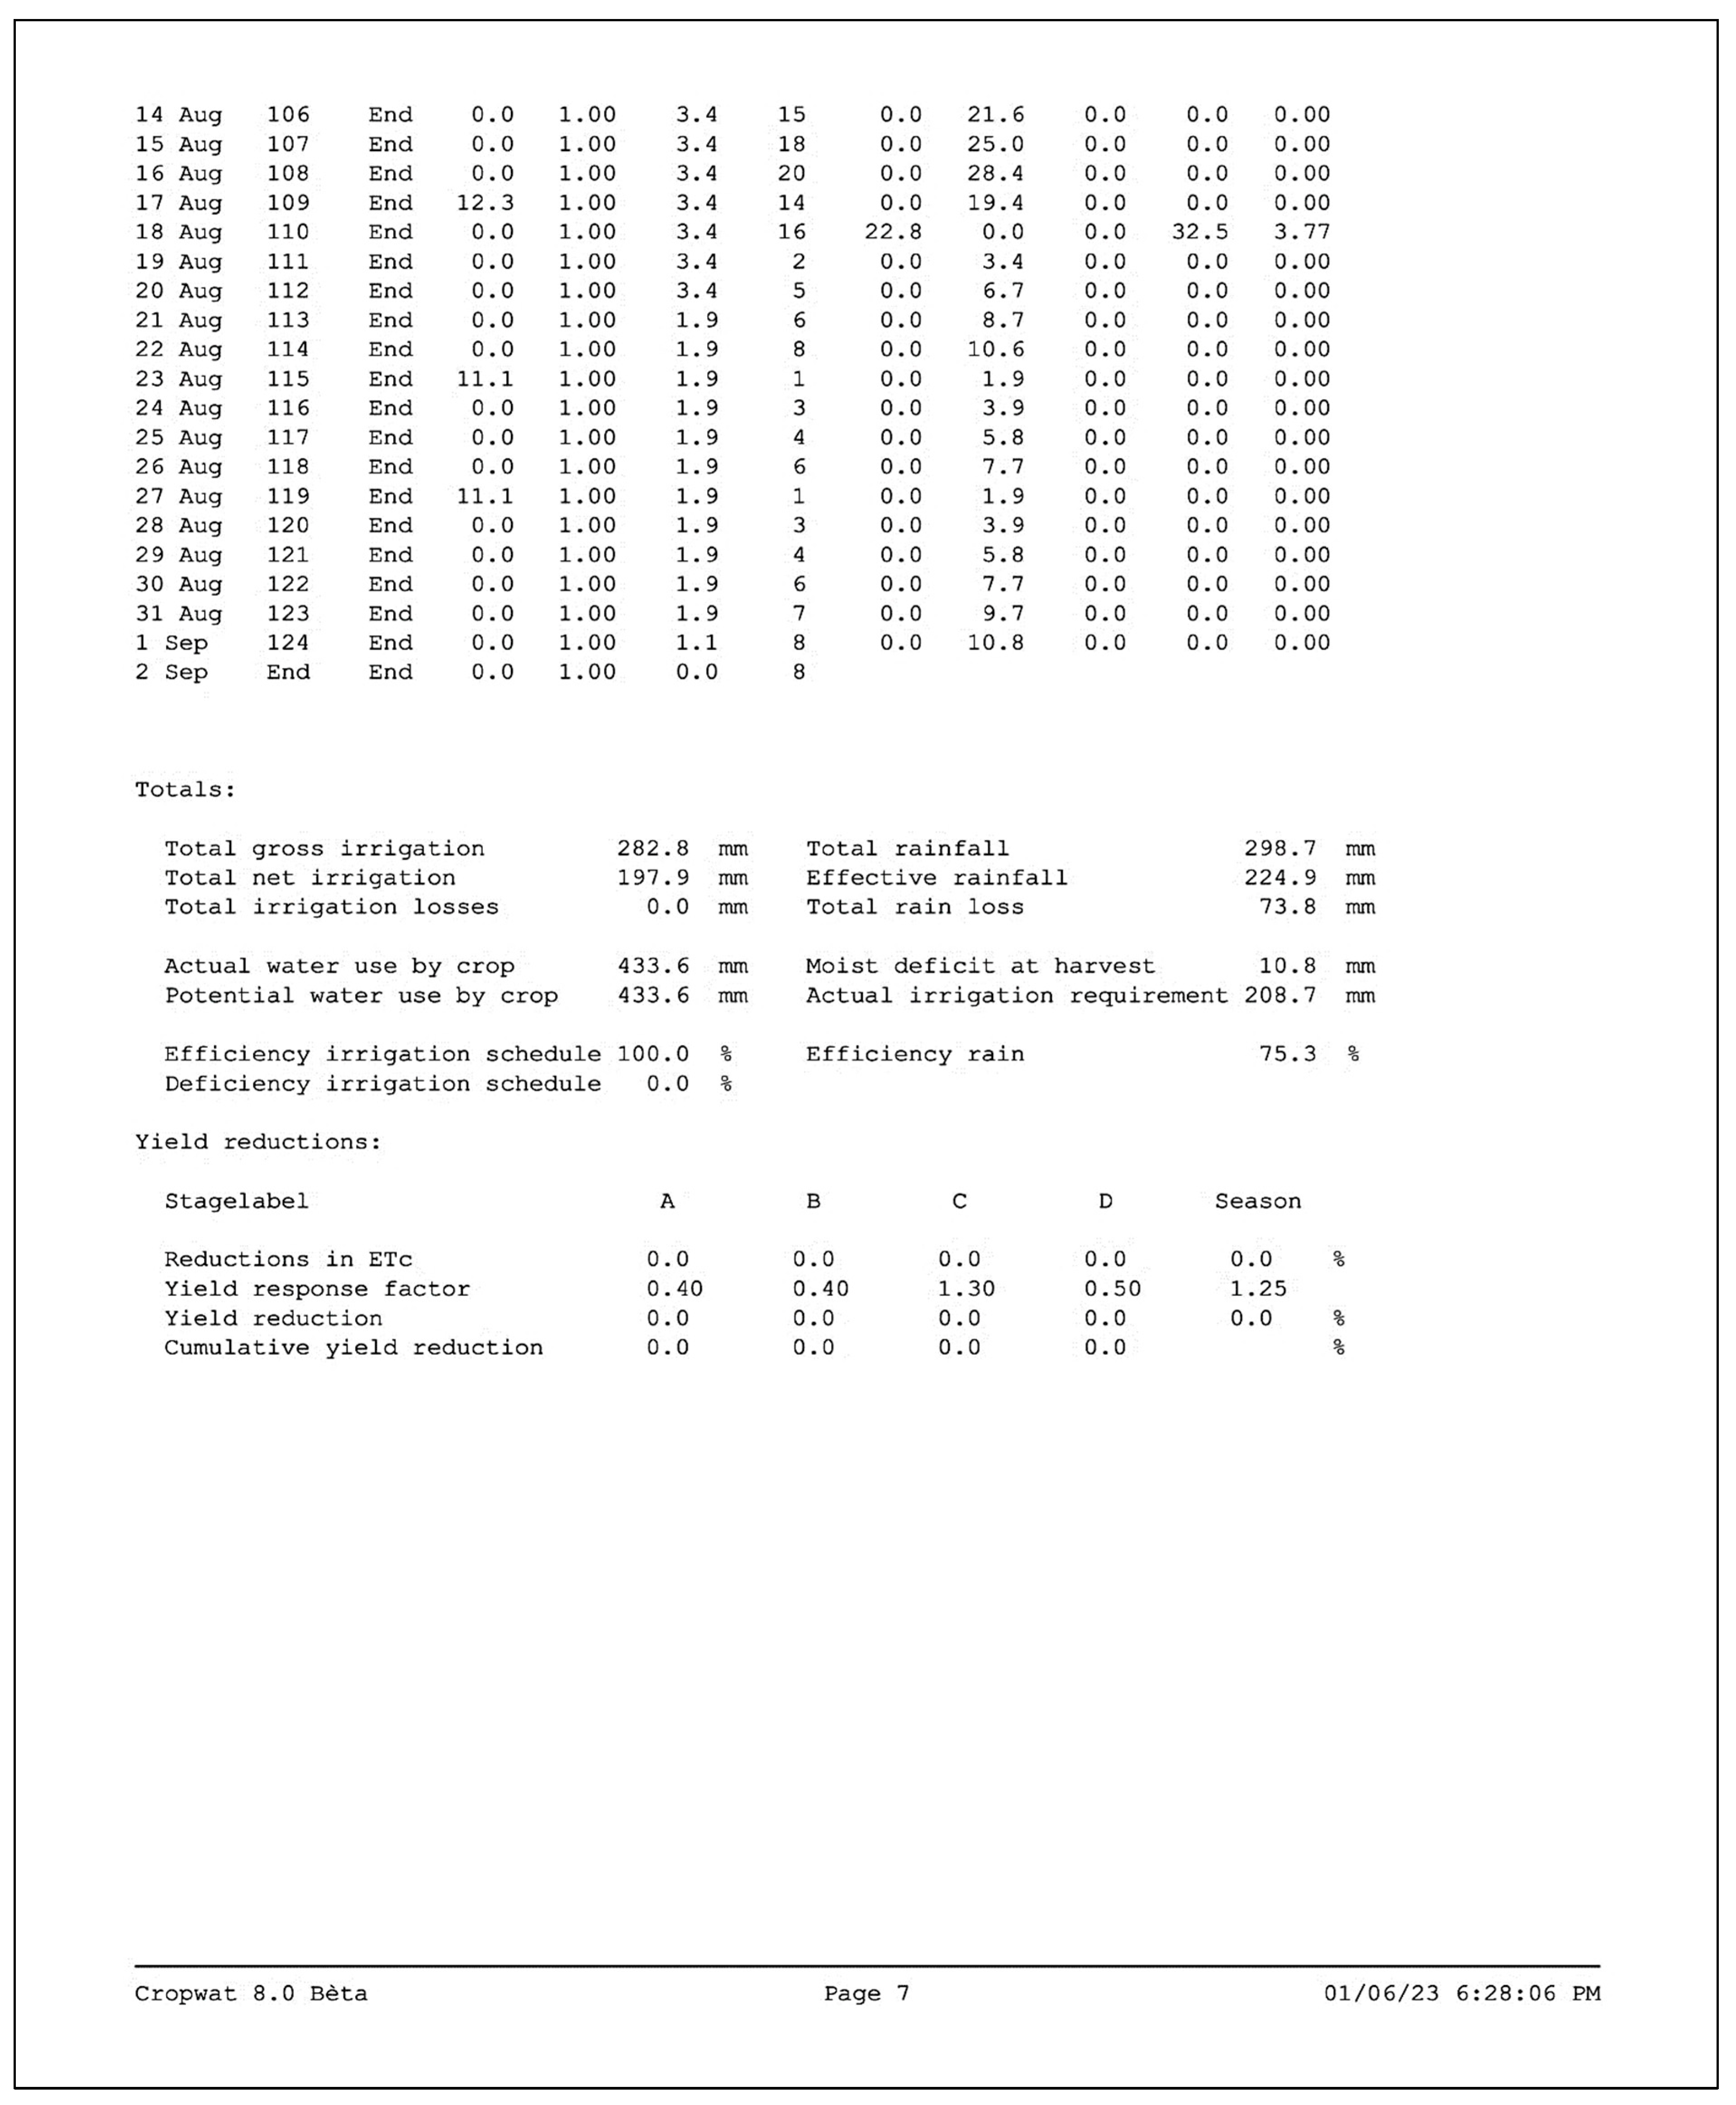
| Day after Sowing | Month | WR for Each Plant (mm/Specific Period) | WR for One Plant (L/Specific Period) | WR for One Subplot (L/Specific Period) | Water is Needed for the Whole Day of Irrigation |
|---|---|---|---|---|---|
| 1–35 | 1 May–4 June | The plants left for rainfall irrigation during the first three weeks | |||
| Volume of required water at each period = Depth of water (m) × Area needed to be irrigated (m2) [79] Notes: Plant density was supposed to be 12 plant/1 m2 The area occupied by one plant is 0.3 × 0.3 = 0.09 m2 Each subplot contains 3 rows and each row contains 15 plants, so the subplot contains 45 plants | |||||
| 36–46 | 5–15 June | 10.4 mm | 0.936 mL | 0.936 × 45 = 42.12 L | 336.96 L for saline and the same for non-saline treatments = 673.92 L/day |
| 47–57 | 15–25 June | 21.1 mm | 1.89 L | 1.89 × 45 = 85.45 | 683.64 L for saline and the same for non-saline = 1367.28 L/day |
| 58–68 | 25 June–5 July | 34.00 mm | 3.06 L | 3.06 × 45 = 137.7 | 1106.6 L for saline and the same for non-saline treatments = 2123.2 L/day |
| 69–79 | 5–15 July | 41.8 mm | 3.06 L | 3.06 × 45 = 137.7 | 1106.6 L for saline and the same for non-saline treatments = 2123.2 L/day |
| 80–90 | 15–25 July | 45.00 mm | 3.06 L | 3.06 × 45 = 137.7 | 1106.6 L for saline and the same for non-saline treatments = 2123.2 L/day |
| 91–101 | 25 July–4 August | 45.2 mm | 3.06 L | 3.06 × 45 = 137.7 | 1106.6 L for saline and the same for non-saline treatments = 2123.2 L/day |
| 102–112 | 4–14 August | 45.2 mm | 3.06 L | 3.06 × 45 = 137.7 | 1106.6 L for saline and the same for non-saline treatments = 2123.2 L/day |
| 113–123 | 14–24 August | 45.2 mm | 3.06 L | 3.06 × 45 = 137.7 | 1106.6 L for saline and the same for non-saline treatments = 2123.2 L/day |
| 124–134 | 24 August–2 September | 45.2 mm | 3.06 L | 3.06 × 45 = 137.7 | 1106.6 L for saline and the same for non-saline treatments = 2123.2 L/day |
References
- Ahmed, M.; Tóth, Z.; Decsi, K. The Impact of Salinity on Crop Yields and the Confrontational Behavior of Transcriptional Regulators, Nanoparticles, and Antioxidant Defensive Mechanisms under Stressful Conditions: A Review. Int. J. Mol. Sci. 2024, 25, 2654. [Google Scholar] [CrossRef] [PubMed]
- Atta, K.; Mondal, S.; Gorai, S.; Singh, A.P.; Kumari, A.; Ghosh, T.; Roy, A.; Hembram, S.; Gaikwad, D.J.; Mondal, S.; et al. Impacts of Salinity Stress on Crop Plants: Improving Salt Tolerance through Genetic and Molecular Dissection. Front. Plant Sci. 2023, 14, 1241736. [Google Scholar] [CrossRef] [PubMed]
- Gul, Z.; Tang, Z.-H.; Arif, M.; Ye, Z. An Insight into Abiotic Stress and Influx Tolerance Mechanisms in Plants to Cope in Saline Environments. Biology 2022, 11, 597. [Google Scholar] [CrossRef]
- Mukhopadhyay, R.; Sarkar, B.; Jat, H.S.; Sharma, P.C.; Bolan, N.S. Soil Salinity under Climate Change: Challenges for Sustainable Agriculture and Food Security. J. Environ. Manag. 2021, 280, 111736. [Google Scholar] [CrossRef] [PubMed]
- Akmal, M.A.; Mirzakamol, A.; Mukhtor, M.D.; Sardor, N.; Akramjon, M.; Ilhomjon, B.; Naim, N.K.; Ildiko, M.; Zabardast, T.B.; Ibrokhim, Y.A. Chemical Interventions to Alleviate Salt Stress in Cotton Plants: A Review. Plant Sci. Today 2023, 10, 297–303. [Google Scholar] [CrossRef]
- Sah, R.P.; Chakraborty, M.; Prasad, K.; Pandit, M.; Tudu, V.K.; Chakravarty, M.K.; Narayan, S.C.; Rana, M.; Moharana, D. Impact of Water Deficit Stress in Maize: Phenology and Yield Components. Sci. Rep. 2020, 10, 2944. [Google Scholar] [CrossRef] [PubMed]
- Pandit, M.; Chakraborty, M.; Haider, Z.A.; Pande, A.; Sah, R.P.; Sourav, K. Genetic Diversity Assay of Maize (Zea mays L.) Inbreds Based on Morphometric Traits and SSR Markers. AJAR 2016, 11, 2118–2128. [Google Scholar] [CrossRef]
- Chaudhary, D.; Kumar, A.; Kumar, R.; Singode, A.; Mukri, G.; Sah, R.; Tiwana, U.; Kumar, B. Evaluation of Normal and Specialty Corn for Fodder Yield and Quality Traits. Range Manag. Agrofor. 2016, 37, 79–83. [Google Scholar]
- Sah, R.; Ahmed, S.; Malaviya, D.; Saxena, P. Identification of Consistence Performing Dual Purpose Maize (Zea mays L.) Genotypes under Semi-Arid Condition. Range Manag. Agrofor. 2016, 37, 162–166. [Google Scholar]
- Manigopa, C.; Sah, R. Genetic Component in Baby Corn (Zea mays L.). Plant Arch. 2012, 12, 291–294. [Google Scholar]
- FAOStat. FAO Stat; FAO: Rome, Italy, 2021. [Google Scholar]
- Ren, X.; Jia, Z.; Chen, X. Rainfall Concentration for Increasing Corn Production under Semiarid Climate. Agric. Water Manag. 2008, 95, 1293–1302. [Google Scholar] [CrossRef]
- Ahmed, M.; Decsi, K.; Tóth, Z. Different Tactics of Synthesized Zinc Oxide Nanoparticles, Homeostasis Ions, and Phytohormones as Regulators and Adaptatively Parameters to Alleviate the Adverse Effects of Salinity Stress on Plants. Life 2022, 13, 73. [Google Scholar] [CrossRef] [PubMed]
- Ahmed, M.; Marrez, D.A.; Abdelmoeen, N.M.; Mahmoud, E.A.; Abdel-Shakur Ali, M.; Decsi, K.; Tóth, Z. Proximate Analysis of Moringa Oleifera Leaves and the Antimicrobial Activities of Successive Leaf Ethanolic and Aqueous Extracts Compared with Green Chemically Synthesized Ag-NPs and Crude Aqueous Extract against Some Pathogens. Int. J. Mol. Sci. 2023, 24, 3529. [Google Scholar] [CrossRef]
- Ahmed, M.; Marrez, D.A.; Mohamed Abdelmoeen, N.; Abdelmoneem Mahmoud, E.; Ali, M.A.-S.; Decsi, K.; Tóth, Z. Studying the Antioxidant and the Antimicrobial Activities of Leaf Successive Extracts Compared to the Green-Chemically Synthesized Silver Nanoparticles and the Crude Aqueous Extract from Azadirachta Indica. Processes 2023, 11, 1644. [Google Scholar] [CrossRef]
- Seleiman, M.F.; Ahmad, A.; Battaglia, M.L.; Bilal, H.M.; Alhammad, B.A.; Khan, N. Zinc Oxide Nanoparticles: A Unique Saline Stress Mitigator with the Potential to Increase Future Crop Production. South Afr. J. Bot. 2023, 159, 208–218. [Google Scholar] [CrossRef]
- Solaiman, M.A.; Ali, M.A.; Abdel-Moein, N.M.; Mahmoud, E.A. Synthesis of Ag-NPs Developed by Green-Chemically Method and Evaluation of Antioxidant Activities and Anti-Inflammatory of Synthesized Nanoparticles against LPS-Induced NO in RAW 264.7 Macrophages. Biocatal. Agric. Biotechnol. 2020, 29, 101832. [Google Scholar] [CrossRef]
- Alabdallah, N.M.; Alzahrani, H.S. The Potential Mitigation Effect of ZnO Nanoparticles on [Abelmoschus esculentus L. Moench] Metabolism under Salt Stress Conditions. Saudi J. Biol. Sci. 2020, 27, 3132–3137. [Google Scholar] [CrossRef] [PubMed]
- Ahmed, M.; Marrez, D.A.; Rizk, R.; Zedan, M.; Abdul-Hamid, D.; Decsi, K.; Kovács, G.P.; Tóth, Z. The Influence of Zinc Oxide Nanoparticles and Salt Stress on the Morphological and Some Biochemical Characteristics of Solanum lycopersicum L. Plants. Plants 2024, 13, 1418. [Google Scholar] [CrossRef]
- Faizan, M.; Bhat, J.A.; Chen, C.; Alyemeni, M.N.; Wijaya, L.; Ahmad, P.; Yu, F. Zinc Oxide Nanoparticles (ZnO-NPs) Induce Salt Tolerance by Improving the Antioxidant System and Photosynthetic Machinery in Tomato. Plant Physiol. Biochem. 2021, 161, 122–130. [Google Scholar] [CrossRef] [PubMed]
- Food and Agriculture Organization. Crop Evapo-Transpiration—Guidelines for Computing Crop Water Requirements—FAO Irrigation and Drainage Paper 56; FAO: Rome, Italy, 1998. [Google Scholar]
- Nejati, K.; Rezvani, Z.; Pakizevand, R. Synthesis of ZnO Nanoparticles and Investigation of the Ionic Template Effect on Their Size and Shape. Int. Nano Lett. 2011, 1, 75–81. [Google Scholar]
- Sakalova, G.V. Environment and Experimental of Plant Growth; Elsevier: Amsterdam, The Netherlands, 1979. [Google Scholar]
- Musa, U.; Hassan, U. Leaf Area Determination for Maize (Zea mays L.), Okra (Abelmoschus esculentus L.) and Cowpea (Vigna unguiculata L.) Crops using Linear Measurements. J. Biol. Agric. Heal. 2016, 6, 104–111. [Google Scholar]
- Bates, L.S.; Waldren, R.P.; Teare, I.D. Rapid Determination of Free Proline for Water-Stress Studies. Plant Soil 1973, 39, 205–207. [Google Scholar] [CrossRef]
- Bradford, M.M. A Rapid and Sensitive Method for the Quantitation of Microgram Quantities of Protein Utilizing the Principle of Protein-Dye Binding. Anal. Biochem. 1976, 72, 248–254. [Google Scholar] [CrossRef] [PubMed]
- Prud’homme, M.-P.; Gonzalez, B.; Billard, J.-P.; Boucaud, J. Carbohydrate Content, Fructan and Sucrose Enzyme Activities in Roots, Stubble and Leaves of Ryegrass (Lolium perenne L.) as Affected by Source/Sink Modification after Cutting. J. Plant Physiol. 1992, 140, 282–291. [Google Scholar] [CrossRef]
- Heath, R.L.; Packer, L. Photoperoxidation in Isolated Chloroplasts. I. Kinetics and Stoichiometry of Fatty Acid Peroxidation. Arch. Biochem. Biophys. 1968, 125, 189–198. [Google Scholar] [CrossRef]
- Alexieva, V.; Sergiev, I.; Mapelli, S.; Karanov, E. The Effect of Drought and Ultraviolet Radiation on Growth and Stress Markers in Pea and Wheat. Plant Cell Environ. 2001, 24, 1337–1344. [Google Scholar] [CrossRef]
- Cequier-Sánchez, E.; Rodríguez, C.; Ravelo, Á.G.; Zárate, R. Dichloromethane as a Solvent for Lipid Extraction and Assessment of Lipid Classes and Fatty Acids from Samples of Different Natures. J. Agric. Food Chem. 2008, 56, 4297–4303. [Google Scholar] [CrossRef]
- EN ISO 12966-1:2014/AC:2015; Animal and Vegetable Fats and Oils-Gas Chromatography of Fatty Acid Methyl Esters. Part 1. Guidelines on Modern Gas Chromatography of Fatty Acid Methyl Esters. Polish Committee for Standardization: Warsaw, Poland, 2015.
- Stępień, A.; Wojtkowiak, K.; Kolankowska, E.; Pietrzak-Fiećko, R. Corn Grain Fatty Acid Contents in Response to Organic Fertilisers from Meat Industry Waste. Sustainability 2024, 16, 952. [Google Scholar] [CrossRef]
- Van Soest, P.J.; Robertson, J.B.; Lewis, B.A. Methods for Dietary Fiber, Neutral Detergent Fiber, and Nonstarch Polysaccharides in Relation to Animal Nutrition. J. Dairy Sci. 1991, 74, 3583–3597. [Google Scholar] [CrossRef]
- AOAC. Official Methods of Analysis of the Association of Official Analytical Chemists: Official Methods of Analysis of AOAC International; AOCO: Rockville, MD, USA, 2019. [Google Scholar]
- Jangam, A.K.; Thali, P. WASP-Web Agri Stat Package; ICAR Research Complex for Goa, Ela: Old Goa, India, 2004. [Google Scholar]
- Maher, S.; Nisar, S.; Aslam, S.M.; Saleem, F.; Behlil, F.; Imran, M.; Assiri, M.A.; Nouroz, A.; Naheed, N.; Khan, Z.A.; et al. Synthesis and Characterization of ZnO Nanoparticles Derived from Biomass (Sisymbrium irio) and Assessment of Potential Anticancer Activity. ACS Omega 2023, 8, 15920–15931. [Google Scholar] [CrossRef]
- Mahamuni, P.P.; Patil, P.M.; Dhanavade, M.J.; Badiger, M.V.; Shadija, P.G.; Lokhande, A.C.; Bohara, R.A. Synthesis and Characterization of Zinc Oxide Nanoparticles by Using Polyol Chemistry for Their Antimicrobial and Antibiofilm Activity. Biochem. Biophys. Rep. 2019, 17, 71–80. [Google Scholar] [CrossRef]
- Amin, Z.S.; Afzal, M.; Ahmad, J.; Ahmed, N.; Zeshan, B.; Hashim, N.H.H.N.; Yean, C.Y. Synthesis, Characterization and Biological Activities of Zinc Oxide Nanoparticles Derived from Secondary Metabolites of Lentinula Edodes. Molecules 2023, 28, 3532. [Google Scholar] [CrossRef]
- Badawy, S.A.; Zayed, B.A.; Bassiouni, S.M.A.; Mahdi, A.H.A.; Majrashi, A.; Ali, E.F.; Seleiman, M.F. Influence of Nano Silicon and Nano Selenium on Root Characters, Growth, Ion Selectivity, Yield, and Yield Components of Rice (Oryza sativa L.) under Salinity Conditions. Plants 2021, 10, 1657. [Google Scholar] [CrossRef]
- Gerona, M.E.B.; Deocampo, M.P.; Egdane, J.A.; Ismail, A.M.; Dionisio-Sese, M.L. Physiological Responses of Contrasting Rice Genotypes to Salt Stress at Reproductive Stage. Rice Sci. 2019, 26, 207–219. [Google Scholar] [CrossRef]
- Ahmad, A.; Tola, E.; Alshahrani, T.S.; Seleiman, M.F. Enhancement of Morphological and Physiological Performance of Zea mays L. under Saline Stress Using ZnO Nanoparticles and 24-Epibrassinolide Seed Priming. Agronomy 2023, 13, 771. [Google Scholar] [CrossRef]
- Yang, Z.; Li, J.-L.; Liu, L.-N.; Xie, Q.; Sui, N. Photosynthetic Regulation Under Salt Stress and Salt-Tolerance Mechanism of Sweet Sorghum. Front. Plant Sci. 2020, 10. [Google Scholar] [CrossRef] [PubMed]
- Seleiman, M.F.; Al-Selwey, W.A.; Ibrahim, A.A.; Shady, M.; Alsadon, A.A. Foliar Applications of ZnO and SiO2 Nanoparticles Mitigate Water Deficit and Enhance Potato Yield and Quality Traits. Agronomy 2023, 13, 466. [Google Scholar] [CrossRef]
- Cakmak, I. Enrichment of Cereal Grains with Zinc: Agronomic or Genetic Biofortification? Plant Soil 2008, 302, 1–17. [Google Scholar] [CrossRef]
- El-Badri, A.M.; Batool, M.; Mohamed, I.A.; Khatab, A.; Sherif, A.; Wang, Z. Modulation of Salinity Impact on Early Seedling Stage via Nano-Priming Application of Zinc Oxide on Rapeseed (Brassica napus L.). Plant Physiol. Biochem. 2021, 166, 376–392. [Google Scholar] [CrossRef]
- Anjum, N.A.; Gill, S.S.; Corpas, F.J.; Ortega-Villasante, C.; Hernandez, L.E.; Tuteja, N.; Sofo, A.; Hasanuzzaman, M.; Fujita, M. Editorial: Recent Insights Into the Double Role of Hydrogen Peroxide in Plants. Front. Plant Sci. 2022, 13. [Google Scholar] [CrossRef]
- Naseer, I.; Javad, S.; Iqbal, S.; Shah, A.A.; Alwutayd, K.; AbdElgawad, H. Deciphering the Role of Zinc Oxide Nanoparticles on Physiochemical Attributes of Zea mays Exposed to Saline Conditions through Modulation in Antioxidant Enzyme Defensive System. South Afr. J. Bot. 2023, 160, 469–482. [Google Scholar] [CrossRef]
- Raliya, R.; Tarafdar, J.C. ZnO Nanoparticle Biosynthesis and Its Effect on Phosphorous-Mobilizing Enzyme Secretion and Gum Contents in Clusterbean (Cyamopsis tetragonoloba L.). Agric. Res. 2013, 2, 48–57. [Google Scholar] [CrossRef]
- Mahawar, L.; Živčák, M.; Barboricova, M.; Kovár, M.; Filaček, A.; Ferencova, J.; Vysoká, D.M.; Brestič, M. Effect of Copper Oxide and Zinc Oxide Nanoparticles on Photosynthesis and Physiology of Raphanus sativus L. under Salinity Stress. Plant Physiol. Biochem. 2024, 206, 108281. [Google Scholar] [CrossRef] [PubMed]
- Rai-Kalal, P.; Jajoo, A. Priming with Zinc Oxide Nanoparticles Improve Germination and Photosynthetic Performance in Wheat. Plant Physiol. Biochem. 2021, 160, 341–351. [Google Scholar] [CrossRef] [PubMed]
- Tavanti, T.R.; Melo, A.A.R.D.; Moreira, L.D.K.; Sanchez, D.E.J.; Silva, R.D.S.; Silva, R.M.D.; Reis, A.R.D. Micronutrient Fertilization Enhances ROS Scavenging System for Alleviation of Abiotic Stresses in Plants. Plant Physiol. Biochem. 2021, 160, 386–396. [Google Scholar] [CrossRef] [PubMed]
- Mogazy, A.M.; Hanafy, R.S. Foliar Spray of Biosynthesized Zinc Oxide Nanoparticles Alleviate Salinity Stress Effect on Vicia Faba Plants. J. Soil Sci. Plant Nutr. 2022, 22, 2647–2662. [Google Scholar] [CrossRef]
- Raddy, R.; Salimath, M.; Geetha, K.N.; Shankar, A. ZnO Nanoparticle Improves Maize Growth, Yield and Seed Zinc under High Soil pH Condition. Int. J. Curr. Microbiol. Appl. Sci. 2018, 7, 1593–1601. [Google Scholar] [CrossRef]
- Tondey, M.; Kalia, A.; Singh, A.; Dheri, G.S.; Taggar, M.S.; Nepovimova, E.; Krejcar, O.; Kuca, K. Seed Priming and Coating by Nano-Scale Zinc Oxide Particles Improved Vegetative Growth, Yield and Quality of Fodder Maize (Zea mays). Agronomy 2021, 11, 729. [Google Scholar] [CrossRef]
- Satdev, V.J.; Chavda, B.N.; Saini, L.K. Effect of Nano ZnO on Growth and Yield of Sweet Corn under South Gujarat Condition. Int. J. Chem. Stud. 2020, 8, 2020–2023. [Google Scholar] [CrossRef]
- Zhou, D.; Jin, S.; Li, L.; Wang, Y.; Weng, N. Quantifying the Adsorption and Uptake of CuO Nanoparticles by Wheat Root Based on Chemical Extractions. J. Environ. Sci. 2011, 23, 1852–1857. [Google Scholar] [CrossRef]
- Lin, D.; Xing, B. Root Uptake and Phytotoxicity of ZnO Nanoparticles. Environ. Sci. Technol. 2008, 42, 5580–5585. [Google Scholar] [CrossRef] [PubMed]
- Vago, M.E.; Jaurena, G.; Estevez, J.M.; Castro, M.A.; Zavala, J.A.; Ciancia, M. Salt Stress on Lotus tenuis Triggers Cell Wall Polysaccharide Changes Affecting Their Digestibility by Ruminants. Plant Physiol. Biochem. 2021, 166, 405–415. [Google Scholar] [CrossRef] [PubMed]
- Beauchemin, K.A. Using ADF and NDF in Dairy Cattle Diet Formulation—A Western Canadian Perspective. Anim. Feed Sci. Technol. 1996, 58, 101–111. [Google Scholar] [CrossRef]
- Boga, M.; Yurtseven, S.; Kilic, U.; Aydemir, S.; Polat, T. Determination of Nutrient Contents and in Vitro Gas Production Values of Some Legume Forages Grown in the Harran Plain Saline Soils. Asian Australas. J. Anim. Sci. 2014, 27, 825–831. [Google Scholar] [CrossRef] [PubMed]
- Ben-Ghedalia, D.; Solomon, R.; Miron, J.; Yosef, E.; Zomberg, Z.; Zukerman, E.; Greenberg, A.; Kipnis, T. Effect of Water Salinity on the Composition and in Vitro Digestibility of Winter-Annual Ryegrass Grown in the Arava Desert. Anim. Feed Sci. Technol. 2001, 91, 139–147. [Google Scholar] [CrossRef]
- De Lima, R.B.; Dos Santos, T.B.; Vieira, L.G.E.; De Lourdes Lúcio Ferrarese, M.; Ferrarese-Filho, O.; Donatti, L.; Boeger, M.R.T.; De Oliveira Petkowicz, C.L. Salt Stress Alters the Cell Wall Polysaccharides and Anatomy of Coffee (Coffea arabica L.) Leaf Cells. Carbohydr. Polym. 2014, 112, 686–694. [Google Scholar] [CrossRef] [PubMed]
- Kerepesi, I.; Galiba, G. Osmotic and Salt Stress-Induced Alteration in Soluble Carbohydrate Content in Wheat Seedlings. Crop Sci. 2000, 40, 482–487. [Google Scholar] [CrossRef]
- Khatkar, D.; Kuhad, M.S. Short-Term Salinity Induced Changes in Two Wheat Cultivars at Different Growth Stages. Biol. Plant. 2000, 43, 629–632. [Google Scholar] [CrossRef]
- Sabagh, A.E.; Hossain, A.; Iqbal, M.A.; Barutçular, C.; Islam, M.S.; Çiğ, F.; Erman, M.; Sytar, O.; Brestic, M.; Wasaya, A.; et al. Maize Adaptability to Heat Stress under Changing Climate. In Plant Stress Physiology; IntechOpen: London, UK, 2020; ISBN 978-1-83962-527-5. [Google Scholar]
- Weinberg, Z.G.; Yan, Y.; Chen, Y.; Finkelman, S.; Ashbell, G.; Navarro, S. The Effect of Moisture Level on High-Moisture Maize (Zea mays L.) under Hermetic Storage Conditions—In Vitro Studies. J. Stored Prod. Res. 2008, 44, 136–144. [Google Scholar] [CrossRef]
- Li, J.; Chen, J.; Jin, J.; Wang, S.; Du, B. Effects of Irrigation Water Salinity on Maize (Zea may L.) Emergence, Growth, Yield, Quality, and Soil Salt. Water 2019, 11, 2095. [Google Scholar] [CrossRef]
- Kang, Y.; Wan, S. Effect of Soil Water Potential on Radish (Raphanus sativus L.) Growth and Water Use under Drip Irrigation. Sci. Hortic. 2005, 106, 275–292. [Google Scholar] [CrossRef]
- Gogna, M.; Choudhary, A.; Mishra, G.; Kapoor, R.; Bhatla, S.C. Changes in Lipid Composition in Response to Salt Stress and Its Possible Interaction with Intracellular Na+-K+ Ratio in Sunflower (Helianthus annuus L.). Environ. Exp. Bot. 2020, 178, 104147. [Google Scholar] [CrossRef]
- Kumar, D.; Yusuf, M.A.; Singh, P.; Sardar, M.; Sarin, N.B. Modulation of Antioxidant Machinery in α-Tocopherol-Enriched Transgenic Brassica Juncea Plants Tolerant to Abiotic Stress Conditions. Protoplasma 2013, 250, 1079–1089. [Google Scholar] [CrossRef] [PubMed]
- Noreen, S.; Ashraf, M. Modulation of Salt (NaCl)-Induced Effects on Oil Composition and Fatty Acid Profile of Sunflower (Helianthus annuus L.) by Exogenous Application of Salicylic Acid. J. Sci. Food Agric. 2010, 90, 2608–2616. [Google Scholar] [CrossRef] [PubMed]
- Di Caterina, R.; Giuliani, M.M.; Rotunno, T.; De Caro, A.; Flagella, Z. Influence of Salt Stress on Seed Yield and Oil Quality of Two Sunflower Hybrids. Ann. Appl. Biol. 2007, 151, 145–154. [Google Scholar] [CrossRef]
- Hong, Y.; Zhao, J.; Guo, L.; Kim, S.-C.; Deng, X.; Wang, G.; Zhang, G.; Li, M.; Wang, X. Plant Phospholipases D and C and Their Diverse Functions in Stress Responses. Prog. Lipid Res. 2016, 62, 55–74. [Google Scholar] [CrossRef] [PubMed]
- Liu, X.; Ma, D.; Zhang, Z.; Wang, S.; Du, S.; Deng, X.; Yin, L. Plant Lipid Remodeling in Response to Abiotic Stresses. Environ. Exp. Bot. 2019, 165, 174–184. [Google Scholar] [CrossRef]
- Yu, D.; Boughton, B.A.; Hill, C.B.; Feussner, I.; Roessner, U.; Rupasinghe, T.W.T. Insights Into Oxidized Lipid Modification in Barley Roots as an Adaptation Mechanism to Salinity Stress. Front. Plant Sci. 2020, 11, 1. [Google Scholar] [CrossRef]
- Yu, B.J.; Gong, H.M.; Liu, Y.L. Effects of Exogenous Fatty Acids on H+-ATPase Activity and Lipid Composition of Plasma Membrane Vesicles Isolated from Roots of Barley Seedlings under Salt Stress. J. Plant Physiol. 1999, 155, 646–651. [Google Scholar] [CrossRef]
- Paulucci, N.S.; Medeot, D.B.; Dardanelli, M.S.; De Lema, M.G. Growth Temperature and Salinity Impact Fatty Acid Composition and Degree of Unsaturation in Peanut-Nodulating Rhizobia. Lipids 2011, 46, 435–441. [Google Scholar] [CrossRef]
- Elinder, F.; Liin, S.I. Actions and Mechanisms of Polyunsaturated Fatty Acids on Voltage-Gated Ion Channels. Front. Physiol. 2017, 8, 43. [Google Scholar] [CrossRef]
- Doorenbos, J.; Pruitt, W.O. Crop Water Requirements. In FAO Irrigation and Drainage Paper 24; FAO: Rome, Italy, 1977; p. 144. [Google Scholar]
| Treatments | Chlorophyll Levels at Various Growth Phases | |||
|---|---|---|---|---|
| 20 June 2023 | 3 July 2023 | 15 July 2023 | 1 August 2023 | |
| T1 Control (tap water) | 56.58 ± 0.27 ns | 60.54 ± 2.26 a | 64.00 ± 0.72 a | 63.62 ± 0.87 a |
| T2 (NaCl 150 mM) | 53.76 ± 0.20 ns | 49.11 ± 1.30 c | 50.66 ± 0.15 b | 50.58 ± 0.15 b |
| T3 (NaCl 150 mM + ZnO-NPs 2 g/L) | 56.26 ± 0.37 ns | 55.40 ± 0.64 b | 55.24 ± 1.53 b | 63.96 ± 1.05 a |
| T4 (tap water + ZnO-NPs 2 g/L) | 55.44 ± 1.97 ns | 58.40 ± 1.92 ab | 61.21 ± 2.39 a | 64.08 ± 0.90 a |
| LSD (0.01) | ND | 6.821 | 6.848 | 3.388 |
| LSD (0.05) | ND | 4.950 | 4.970 | 2.459 |
| Coefficient of variation | 4.093 | 6.610 | 6.416 | 3.027 |
| Treatments | Plant Height (cm) at Various Growth Phases | |||
|---|---|---|---|---|
| 20 June 2023 | 3 July 2023 | 15 July 2023 | 1 August 2023 | |
| T1 Control (tap water) | 93.20 ± 0.41 b | 186.10 ± 2.76 b | 233.50 ± 1.87 b | 233.50 ± 1.87 b |
| T2 (NaCl 150 mM) | 80.23 ± 2.37 d | 162.64 ± 3.85 c | 208.43 ± 5.93 c | 209.71 ± 6.56 c |
| T3 (NaCl 150 mM + ZnO-NPs 2 g/L) | 86.00 ± 0.84 c | 191.60 ± 1.89 ab | 238.40 ± 1.44 ab | 238.80 ± 1.24 ab |
| T4 (tap water + ZnO-NPs 2 g/L) | 97.80 ± 1.55 a | 199.00 ± 1.52 a | 246.80 ± 1.36 a | 246.80 ± 1.36 a |
| LSD (0.01) | 6.154 | 10.891 | 13.471 | 14.590 |
| LSD (0.05) | 4.467 | 7.904 | 9.777 | 10.589 |
| Coefficient of variation | 3.730 | 3.189 | 3.146 | 3.401 |
| Treatments | Stem Width (cm) at Various Growth Phases | |||
|---|---|---|---|---|
| 20 June 2023 | 3 July 2023 | 15 July 2023 | 1 August 2023 | |
| T1 Control (tap water) | 2.57 ± 0.07 a | 2.86 ± 0.09 a | 2.86 ± 0.09 a | 2.88 ± 0.08 bc |
| T2 (NaCl 150 mM) | 2.26 ± 0.05 b | 2.44 ± 0.12 b | 2.64 ± 0.09 b | 2.76 ± 0.02 c |
| T3 (NaCl 150 mM + ZnO-NPs 2 g/L) | 2.60 ± 0.03 a | 2.77 ± 0.05 a | 2.90 ± 0.00 a | 2.92 ± 0.02 b |
| T4 (tap water + ZnO-NPs 2 g/L) | 2.69 ± 0.07 a | 2.98 ± 0.00 a | 3.02 ± 0.04 a | 3.05 ± 0.03 a |
| LSD (0.01) | 0.226 | 0.359 | 0.266 | 0.173 |
| LSD (0.05) | 0.164 | 0.261 | 0.193 | 0.125 |
| Coefficient of variation | 4.831 | 7.040 | 5.045 | 3.220 |
| Treatments | Area of Leaves (cm2) at Various Growth Phases | |||
|---|---|---|---|---|
| 20 June 2023 | 3 July 2023 | 15 July 2023 | 1 August 2023 | |
| T1 Control (tap water) | 7271.28 ± 243.49 a | 9800.28 ± 201.28 b | 12,130.32 ± 275.13 a | 13,646.61 ± 309.52 a |
| T2 (NaCl 150 mM) | 5378.72 ± 135.50 c | 7389.00 ± 175.33 c | 10,296.00 ± 293.78 b | 11,668.80 ± 309.87 b |
| T3 (NaCl 150 mM + ZnO-NPs 2 g/L) | 6320.505 ± 205.30 b | 9441.18 ± 66.56 b | 12,348.33 ± 168.74 a | 13,963.05 ± 168.59 a |
| T4 (tap water + ZnO-NPs 2 g/L) | 6789.675 ± 58.62 ab | 10,447.215 ± 153.33 a | 12,411.6 ± 149.86 a | 14,495.22 ± 321.29 a |
| LSD (0.01) | 725.064 | 350.517 | 953.109 | 1174.721 |
| LSD (0.05) | 526.236 | 472.131 | 691.746 | 852.587 |
| Coefficient of variation | 6.113 | 3.810 | 4.396 | 4.751 |
| Treatments | Concentrations/Treatments | |||||
|---|---|---|---|---|---|---|
| Total Hydrolazable Sugars (mg/g) | Total Free Amino Acids (mg/g) | Protein Content (mg/g) | Proline Content (mg/g) | H2O2 (mg/g) | MDA (mmols/mL) | |
| T1 Control (tap water) | 177.50 ± 5.60 bc | 53.83 ± 1.23 c | 1.56 ± 0.03 b | 0.22 ± 0.00 b | 1.02 ± 0.01 d | 5.16 ± 0.46 c |
| T2 (NaCl 150 mM) | 228.49 ± 2.17 a | 74.35 ± 1.19 a | 0.93 ± 0.01 c | 0.32 ± 0.03 a | 1.78 ± 0.02 a | 13.06 ± 1.61 a |
| T3 (NaCl 150 mM + ZnO-NPs 2 g/L) | 186.31 ± 4.32 b | 56.71 ± 0.72 c | 0.98 ± 0.02 c | 0.31 ± 0.00 a | 1.35 ± 0.03 b | 9.35 ± 0.56 b |
| T4 (tap water + ZnO-NPs 2 g/L) | 170.76 ± 2.86 c | 60.83 ± 1.28 b | 2.39 ± 0.03 a | 0.23 ± 0.00 b | 1.19 ± 0.01 c | 5.97 ±0.41 c |
| LSD (0.01) | 17.136 | 4.861 | 0.491 | 3.206 | 0.086 | 3.913 |
| LSD (0.05) | 12.223 | 3.476 | 0.350 | 2.341 | 0.062 | 2.791 |
| Coefficient of variation | 4.158 | 3.663 | 16.112 | 2.938 | 2.985 | 21.594 |
| Treatments | Weight of the Humid Leaves (g) | Weight of the Dried Leaves (g) | Weight of the Humid Stalk (g) | Weight of the Dried Stalk (g) | Weight of the Humid Cob (g) | Weight of Humid 100 Seeds (g) | Weight of Dried 100 Seeds (g) | Weight of Humid All Seeds (g) | Weight of Dried All Seeds (g) | Moisture in Corn Seeds (g) | No. of Rows/Cob | No. of Seeds/Row |
|---|---|---|---|---|---|---|---|---|---|---|---|---|
| T1 Control (tap water) | 36.83 ± 1.17 a | 32.25 ± 0.81 b | 197.42 ± 8.38 bc | 73.22 ± 1.71 b | 314.98 ± 25.16 a | 40.00 ± 1.16 ab | 34.09 ± 1.20 bc | 239.85 ± 12.28 a | 204.20 ± 8.99 a | 0.15 ± 0.01 ns | 16 ± 0.33 ns | 40 ± 0.33 a |
| T2 (NaCl 150 mM) | 27.10 ± 0.78 b | 23.27 ± 1.02 c | 150.78 ± 14.58 c | 59.98 ± 1.86 b | 211.98 ± 13.75 b | 36.03 ± 2.53 b | 31.12 ± 1.32 c | 184.15 ± 11.78 b | 159.12 ± 5.64 b | 0.13 ± 0.02 ns | 16 ± 1.15 ns | 36 ± 1.86 b |
| T3 (NaCl 150 mM + ZnO-NPs 2 g/L) | 39.58 ± 1.28 a | 35.23 ± 0.59 a | 247.33 ± 21.53 ab | 115.88 ± 11.54 a | 301.57 ± 2.09 a | 43.58 ± 1.72 a | 38.46 ± 1.91 ab | 241.98 ± 11.44 a | 213.57 ± 12.16 a | 0.12 ± 0.01 ns | 16 ± 1.15 ns | 41 ± 1.33 a |
| T4 (tap water + ZnO-NPs 2 g/L) | 41.15 ± 1.20 a | 36.27 ± 0.95 a | 265.45 ± 29.18 a | 128.10 ± 8.44 a | 307.53 ± 3.50 a | 45.75 ± 2.63 a | 41.07 ± 1.48 a | 254.02 ± 1.06 a | 228.63 ± 5.92 a | 0.10 ± 0.02 ns | 15 ± 0.67 ns | 43 ± 0.33 a |
| LSD (0.01) | 6.552 | 4.078 | ND | 34.445 | 68.712 | ND | 7.124 | 48.699 | 40.776 | ND | ND | ND |
| LSD (0.05) | 4.503 | 2.803 | 65.185 | 23.675 | 47.228 | 6.845 | 4.897 | 33.473 | 28.027 | ND | ND | 3.805 |
| Coefficient of variation | 6.659 | 4.688 | 16.084 | 13.035 | 8.832 | 8.793 | 7.187 | 7.729 | 7.392 | 25.784 | 9.767 | 5.031 |
| Treatments | Concentrations (g/100 g Dry Weight) | |||
|---|---|---|---|---|
| Dry Matter | Crude Protein | Acid Detergent Fiber (ADF) | Neutral Detergent Fiber (NDF) | |
| T1 Control (tap water) | 78.83 ± 0.41 ns | 6.87 ± 0.00 b | 21.17 ± 0.20 a | 34.53 ± 0.49 a |
| T2 (NaCl 150 mM) | 78.08 ± 0.70 ns | 6.05 ± 0.23 c | 19.82 ± 0.02 b | 31.42 ± 0.11 b |
| T3 (NaCl 150 mM + ZnO-NPs 2 g/L) | 78.56 ± 0.73 ns | 7.26 ± 0.08 a | 20.21 ± 0.33 b | 32.53 ± 0.73 b |
| T4 (tap water + ZnO-NPs 2 g/L) | 78.92 ± 1.01 ns | 7.35 ± 0.02 a | 21.57 ± 0.37 a | 34.60 ± 0.48 a |
| LSD (0.01) | ND | 0.539 | 1.140 | 2.181 |
| LSD (0.05) | ND | 0.384 | 0.813 | 1.555 |
| Coefficient of variation | 1.894 | 3.624 | 2.551 | 3.034 |
| Treatments | Concentrations (g/100 g Dry Weight) | |||
|---|---|---|---|---|
| Moisture | Crude Protein | Crude Fat | Starch | |
| T1 Control (tap water) | 5.58 ± 0.09 d | 8.57 ± 0.15 b | 3.60 ± 0.02 ns | 68.84 ± 0.03 b |
| T2 (NaCl 150 mM) | 6.77 ± 0.12 b | 7.43 ± 0.06 c | 3.64 ± 0.04 ns | 68.21 ± 0.04 c |
| T3 (NaCl 150 mM + ZnO-NPs 2 g/L) | 7.07 ± 0.05 a | 7.79 ± 0.25 c | 3.54 ± 0.01 ns | 69.55 ± 0.12 a |
| T4 (tap water + ZnO-NPs 2 g/L) | 6.40 ±0.07 c | 9.20 ± 0.17 a | 3.60 ± 0.02 ns | 68.19 ± 0.02 c |
| LSD (0.01) | 0.383 | 0.730 | ND | 0.299 |
| LSD (0.05) | 0.273 | 0.521 | ND | 0.2131 |
| Coefficient of variation | 2.749 | 4.101 | 1.331 | 0.201 |
| Compounds to Be Detected | Concentrations (g/100 g)/Treatments | |||
|---|---|---|---|---|
| T1 | T2 | T3 | T4 | |
| Myristic acid | 0.04 | 0.07 | 0.06 | 0.06 |
| Palmitic acid | 13.32 | 13.66 | 12.9 | 13.3 |
| Palmitoleic acid | 0.05 | 0.05 | 0.05 | 0.04 |
| Stearic acid | 2.43 | 2.67 | 2.62 | 2.54 |
| Oleic acid | 27.09 | 27.84 | 27.76 | 27.53 |
| Vaccenic acid | 0.34 | 0.30 | 0.32 | 0.33 |
| Linoleic acid | 50.54 | 51.79 | 51.29 | 51.09 |
| γ-linolenic acid | 0.05 | 0.06 | 0.07 | 0.05 |
| α-linolenic acid | 0.93 | 0.95 | 0.95 | 0.7 |
| Ecosenoic acid | 0.10 | 0.13 | 0.11 | 0.10 |
| Arachidonic acid | 0.03 | 0.03 | 0.03 | 0.02 |
| Eicosapentaenoic acid (EPA) | 0 | 0 | 0 | 0 |
| Docosadienoic acid | 0 | 0 | 0 | 0 |
| Docosapentaenoic acid | 0 | 0 | 0 | 0 |
| Docosahexaenoic acid (DHA) | 0.02 | 0.01 | 0.02 | 0.02 |
| Total | 94.94 | 97.56 | 96.00 | 95.78 |
Disclaimer/Publisher’s Note: The statements, opinions and data contained in all publications are solely those of the individual author(s) and contributor(s) and not of MDPI and/or the editor(s). MDPI and/or the editor(s) disclaim responsibility for any injury to people or property resulting from any ideas, methods, instructions or products referred to in the content. |
© 2024 by the authors. Licensee MDPI, Basel, Switzerland. This article is an open access article distributed under the terms and conditions of the Creative Commons Attribution (CC BY) license (https://creativecommons.org/licenses/by/4.0/).
Share and Cite
Ahmed, M.; Marrez, D.A.; Rizk, R.; Abdul-Hamid, D.; Tóth, Z.; Decsi, K. Interventional Effect of Zinc Oxide Nanoparticles with Zea mays L. Plants When Compensating Irrigation Using Saline Water. Nanomaterials 2024, 14, 1341. https://doi.org/10.3390/nano14161341
Ahmed M, Marrez DA, Rizk R, Abdul-Hamid D, Tóth Z, Decsi K. Interventional Effect of Zinc Oxide Nanoparticles with Zea mays L. Plants When Compensating Irrigation Using Saline Water. Nanomaterials. 2024; 14(16):1341. https://doi.org/10.3390/nano14161341
Chicago/Turabian StyleAhmed, Mostafa, Diaa Attia Marrez, Roquia Rizk, Donia Abdul-Hamid, Zoltán Tóth, and Kincső Decsi. 2024. "Interventional Effect of Zinc Oxide Nanoparticles with Zea mays L. Plants When Compensating Irrigation Using Saline Water" Nanomaterials 14, no. 16: 1341. https://doi.org/10.3390/nano14161341
APA StyleAhmed, M., Marrez, D. A., Rizk, R., Abdul-Hamid, D., Tóth, Z., & Decsi, K. (2024). Interventional Effect of Zinc Oxide Nanoparticles with Zea mays L. Plants When Compensating Irrigation Using Saline Water. Nanomaterials, 14(16), 1341. https://doi.org/10.3390/nano14161341