Article

Influence of the Structure of Hydrothermal-Synthesized TiO2 Nanowires Formed by Annealing on the Photocatalytic Reduction of CO2 in H2O Vapor

by
Andrey M. Tarasov
1,
Larisa I. Sorokina
1,
Daria A. Dronova
1,
Olga Volovlikova
1,
Alexey Yu. Trifonov
1,2,
Sergey S. Itskov
1,
Aleksey V. Tregubov
3,
Elena N. Shabaeva
3,
Ekaterina S. Zhurina
3,
Sergey V. Dubkov
1,
Dmitry V. Kozlov
3 and
Dmitry Gromov
1,4,*
1
Institute of Advanced Materials and Technologies, National Research University of Electronic Technology MIET, Bld. 1, Shokin Square, Zelenograd, 124498 Moscow, Russia
2
National Research Centre “Kurchatov Institute”, 1 Kurchatov Square, 123182 Moscow, Russia
3
S.P. Kapitsa Scientific Technological Research Institute, Ulyanovsk State University, 42 Leo Tolstoy Street, 432017 Ulyanovsk, Russia
4
Institute for Bionic Technologies and Engineering, I.M. Sechenov First Moscow State Medical University, Bolshaya Pirogovskaya 2, 119435 Moscow, Russia
*
Author to whom correspondence should be addressed.
Nanomaterials 2024, 14(16), 1370; https://doi.org/10.3390/nano14161370
Submission received: 31 July 2024 / Revised: 17 August 2024 / Accepted: 20 August 2024 / Published: 21 August 2024
(This article belongs to the Section Energy and Catalysis)

Abstract

:
The present study investigates the photocatalytic properties of hydrothermally synthesized TiO2 nanowires (NWs) for CO2 reduction in H2O vapor. It has been demonstrated that TiO2 NWs, thermally treated at 500–700 °C, demonstrate an almost tenfold higher yield of products compared to the known commercial powder TiO2 P25. It has been found that the best material is a combination of anatase, TiO2-B and rutile. The product yield increases with increasing heat treatment temperature of TiO2 NWs. This is associated with an increase in the degree of crystallinity of the material. It is shown that the best product yield of the CO2 reduction in H2O vapor is achieved when the TiO2 NW photocatalyst is heated to 100 °C.

1. Introduction

TiO2 is a semiconductor material that is widely used in photocatalysis. It is distinguished by its chemical stability, superhydrophilicity, durability, low cost, lack of toxicity to humans and transparency in the visible range of the spectrum. The photocatalytic properties of TiO2 are explained by the formation of charge carriers when exposed to photons with a wavelength of less than 400 nm, which is due to the optical band gap of about 3.2 eV [1]. TiO2 finds its application in self-cleaning surfaces [2,3], it is used to purify water [4,5] and air [6,7], as well as in the decomposition of water into oxygen and hydrogen [8,9]. The strong oxidizing properties of TiO2 make it possible to use it for the decomposition of many organic compounds [10]. In addition to the ability to oxidize a number of substances on its surface, TiO2 is capable of reducing CO2 to a number of hydrocarbons [11,12].
The morphology of TiO2 nanoparticles can have a great influence on the properties of the resulting structures. Among the many variations of morphology are nanospheres [13,14], nanowires [15,16], nanotubes [17,18] and nanosheets [19,20]. It is known that the following parameters are important for a nanostructure used in photocatalysis: the shape of the nanostructure [21,22], the specific surface area [23,24], the crystalline phase [25,26] and the lifetime of charge carriers [27,28].
One of the most interesting structures for use in photocatalysis are nanowires, which combine the advantages of zero- and two-dimensional objects [29]. Compared to zero-dimensional objects, nanowires have a high aspect ratio, which increases the efficiency of absorption of incident radiation by a single crystal. In addition, the long length and high crystallinity reduce the probability of charge carrier recombination, and the geometry promotes diffusion-free transport of charge carriers along the axial direction of the crystal [30,31]. As a result, it has been repeatedly shown that one-dimensional TiO2 exhibits higher photocatalytic activity than TiO2 powders [32,33]. However, there is also evidence indicating the opposite results, where nanoparticles demonstrate higher photocatalytic activity [33]. These conflicting results highlight the complexity and diversity of factors affecting photocatalytic activity and the need for further research to gain a deeper understanding of these processes.
In this work, TiO2 nanowires were used for artificial photosynthesis—the reduction of CO2 when interacting with water under the influence of light. It is demonstrated that TiO2 nanowires formed by the hydrothermal method are more effective for this purpose than commercial TiO2 P25. However, this efficiency depends on the crystal structure of the nanowires, determined by the high-temperature post-processing conditions.

2. Materials and Methods

TiO2 nanowires were obtained by hydrothermal synthesis. A total of 50 mL of a 10 M aqueous NaOH solution was placed in a stainless autoclave with a 100 mL Teflon container. Then, 0.6 g of commercial TiO2 powder P25 (Evonik, Hanau, Germany) was added to the prepared solution and stirred using a magnetic stirrer for 30 min. After stirring, the autoclave was heated in a muffle furnace to 250 °C and kept there for 9 h. The autoclave cooled to room temperature inside the muffle furnace. The resulting nanowires were placed in 400 mL of deionized water and stirred with heating to 60 °C. Then, 50 mL HCl was added and stirred for 20 min. The nanowires were washed repeatedly in deionized water using vacuum filtration until a neutral pH was reached. Drying of the nanowires was carried out in air at a temperature of 100 °C.
Temperature post-processing of the samples was carried out by annealing in air at temperatures of 350, 500, 700 and 900 °C. Annealing was carried out for 4 h.
Adsorption–desorption isotherms were obtained using the instrument Quantachrome Nova 3200e (software NovaWin V.11.03 1994—2013 Quantachrome Instr., Boynton Beach, FL, USA). Specific surface area was calculated using the BET (Brunauer–Emmett–Teller) method in the relative pressure range from 0.05 to 0.25. The samples were preliminarily degassed at 300 °C for 3 h.
To perform photocatalytic studies, a layer of TiO2 nanowires with an area of 7 cm2 and a specific mass of about 1.5 mg/cm2 was deposited onto a titanium foil substrate using the drop method (Figure 1a). The drop method of forming layers of TiO2 nanowires involved applying an aqueous suspension onto titanium foil. For this purpose, a suspension was prepared consisting of 1.5 mL of deionized water and about 15 mg of TiO2 nanowires. The suspension was treated in an ultrasonic bath for 30 s. After preparation, the suspension was placed in a medical syringe and applied to the surface of the prepared titanium foil. To prevent the suspension from spreading, a silicone ring with an internal diameter of about 30 mm was used. Then, the suspension was dried on a heating table at a temperature of about 85 °C. Titanium foil was preliminarily degreased by ultrasonic treatment in a mixture of acetone/isopropyl alcohol (1:1) for 30 min. After degreasing, the foil was etched in a solution HF:HNO3:H2O (30:20:150).
The photocatalytic activity of the samples was studied in a thermally stabilized flow reactor with a volume of 25 cm2 with a quartz window and two gas inlets (Figure 1b). The samples were irradiated using two 35 W xenon lamps. The measurements were carried out at temperatures of 40, 70, 100 and 125 °C. The incoming reaction gas mixture consisted of 40 vol.% CO2 and 60 vol.% H2O and was supplied at a gas flow rate of 3 mL/min. Helium was used as the carrier gas. The amount of water entering the reactor was estimated using a gas humidity sensor DV2TSM V. Humidity was changed by passing a CO2 flow through a bubbler (Figure 1c). The gas flow regulator controlled the flow of CO2. The Crystal 5000 gas chromatograph analyzed the products of the photocatalytic reaction. The chromatograph was equipped with an Agilent HP PLOT Q capillary column and a plasma ionization detector. The reaction products were identified by the exit time. The product concentration was estimated from the peak area. Before studying the sample, the reactor was heated to 60 °C and purged for one hour. After installing the sample into the reactor, the product yield was recorded in the dark three times in a row. The resulting base values were subtracted when further calculating the product yield.
The morphology of nanowires was studied using a Helios G4 CX (FEI company, Hillsboro, OR, USA) scanning electron microscope (SEM). The measurements were carried out at an accelerating voltage of about 5 kV and a current of 21 pA.
X-ray diffraction (XRD) analysis was carried out using the diffractometer Rigaku MiniFlex 600 (Rigaku Corporation, Tokyo, Japan) with radiation source Cu Kα (λ = 1.5418 Å). The Bragg angle 2θ ranged from 10° to 60°.
Transmission electron microscopy (TEM) studies were carried out using an Tecnai G2 microscope (FEI company, Hillsboro, OR, USA) with an accelerating voltage of 200 kV with an EDAX energy dispersive X-ray analysis attachment.
Raman spectroscopy of the samples was performed using a high-precision Confotec MR200 microscope (SOL instruments, Minsk, Belarus). The sample was targeted using a near-focus MPlanFL N 40× objective (Olympus, Tokyo, Japan). A laser with a wavelength of 532 nm and a power of 440 μW was used for the measurements. The diameter of the focused laser beam was 1.5 μm. A diffraction grating of 600 lines/mm and a registration pinhole of 100 μm were used for the measurements. The measurements were performed in the mapping mode in the area of 10 × 10 μm, the number of measurement points was 5 × 5 (25 in total), the step between the points was 2 μm, and the spectrum acquisition time at each point was 1 s. After the measurement was completed, the aggregated spectrum from all measured points was saved.

3. Results

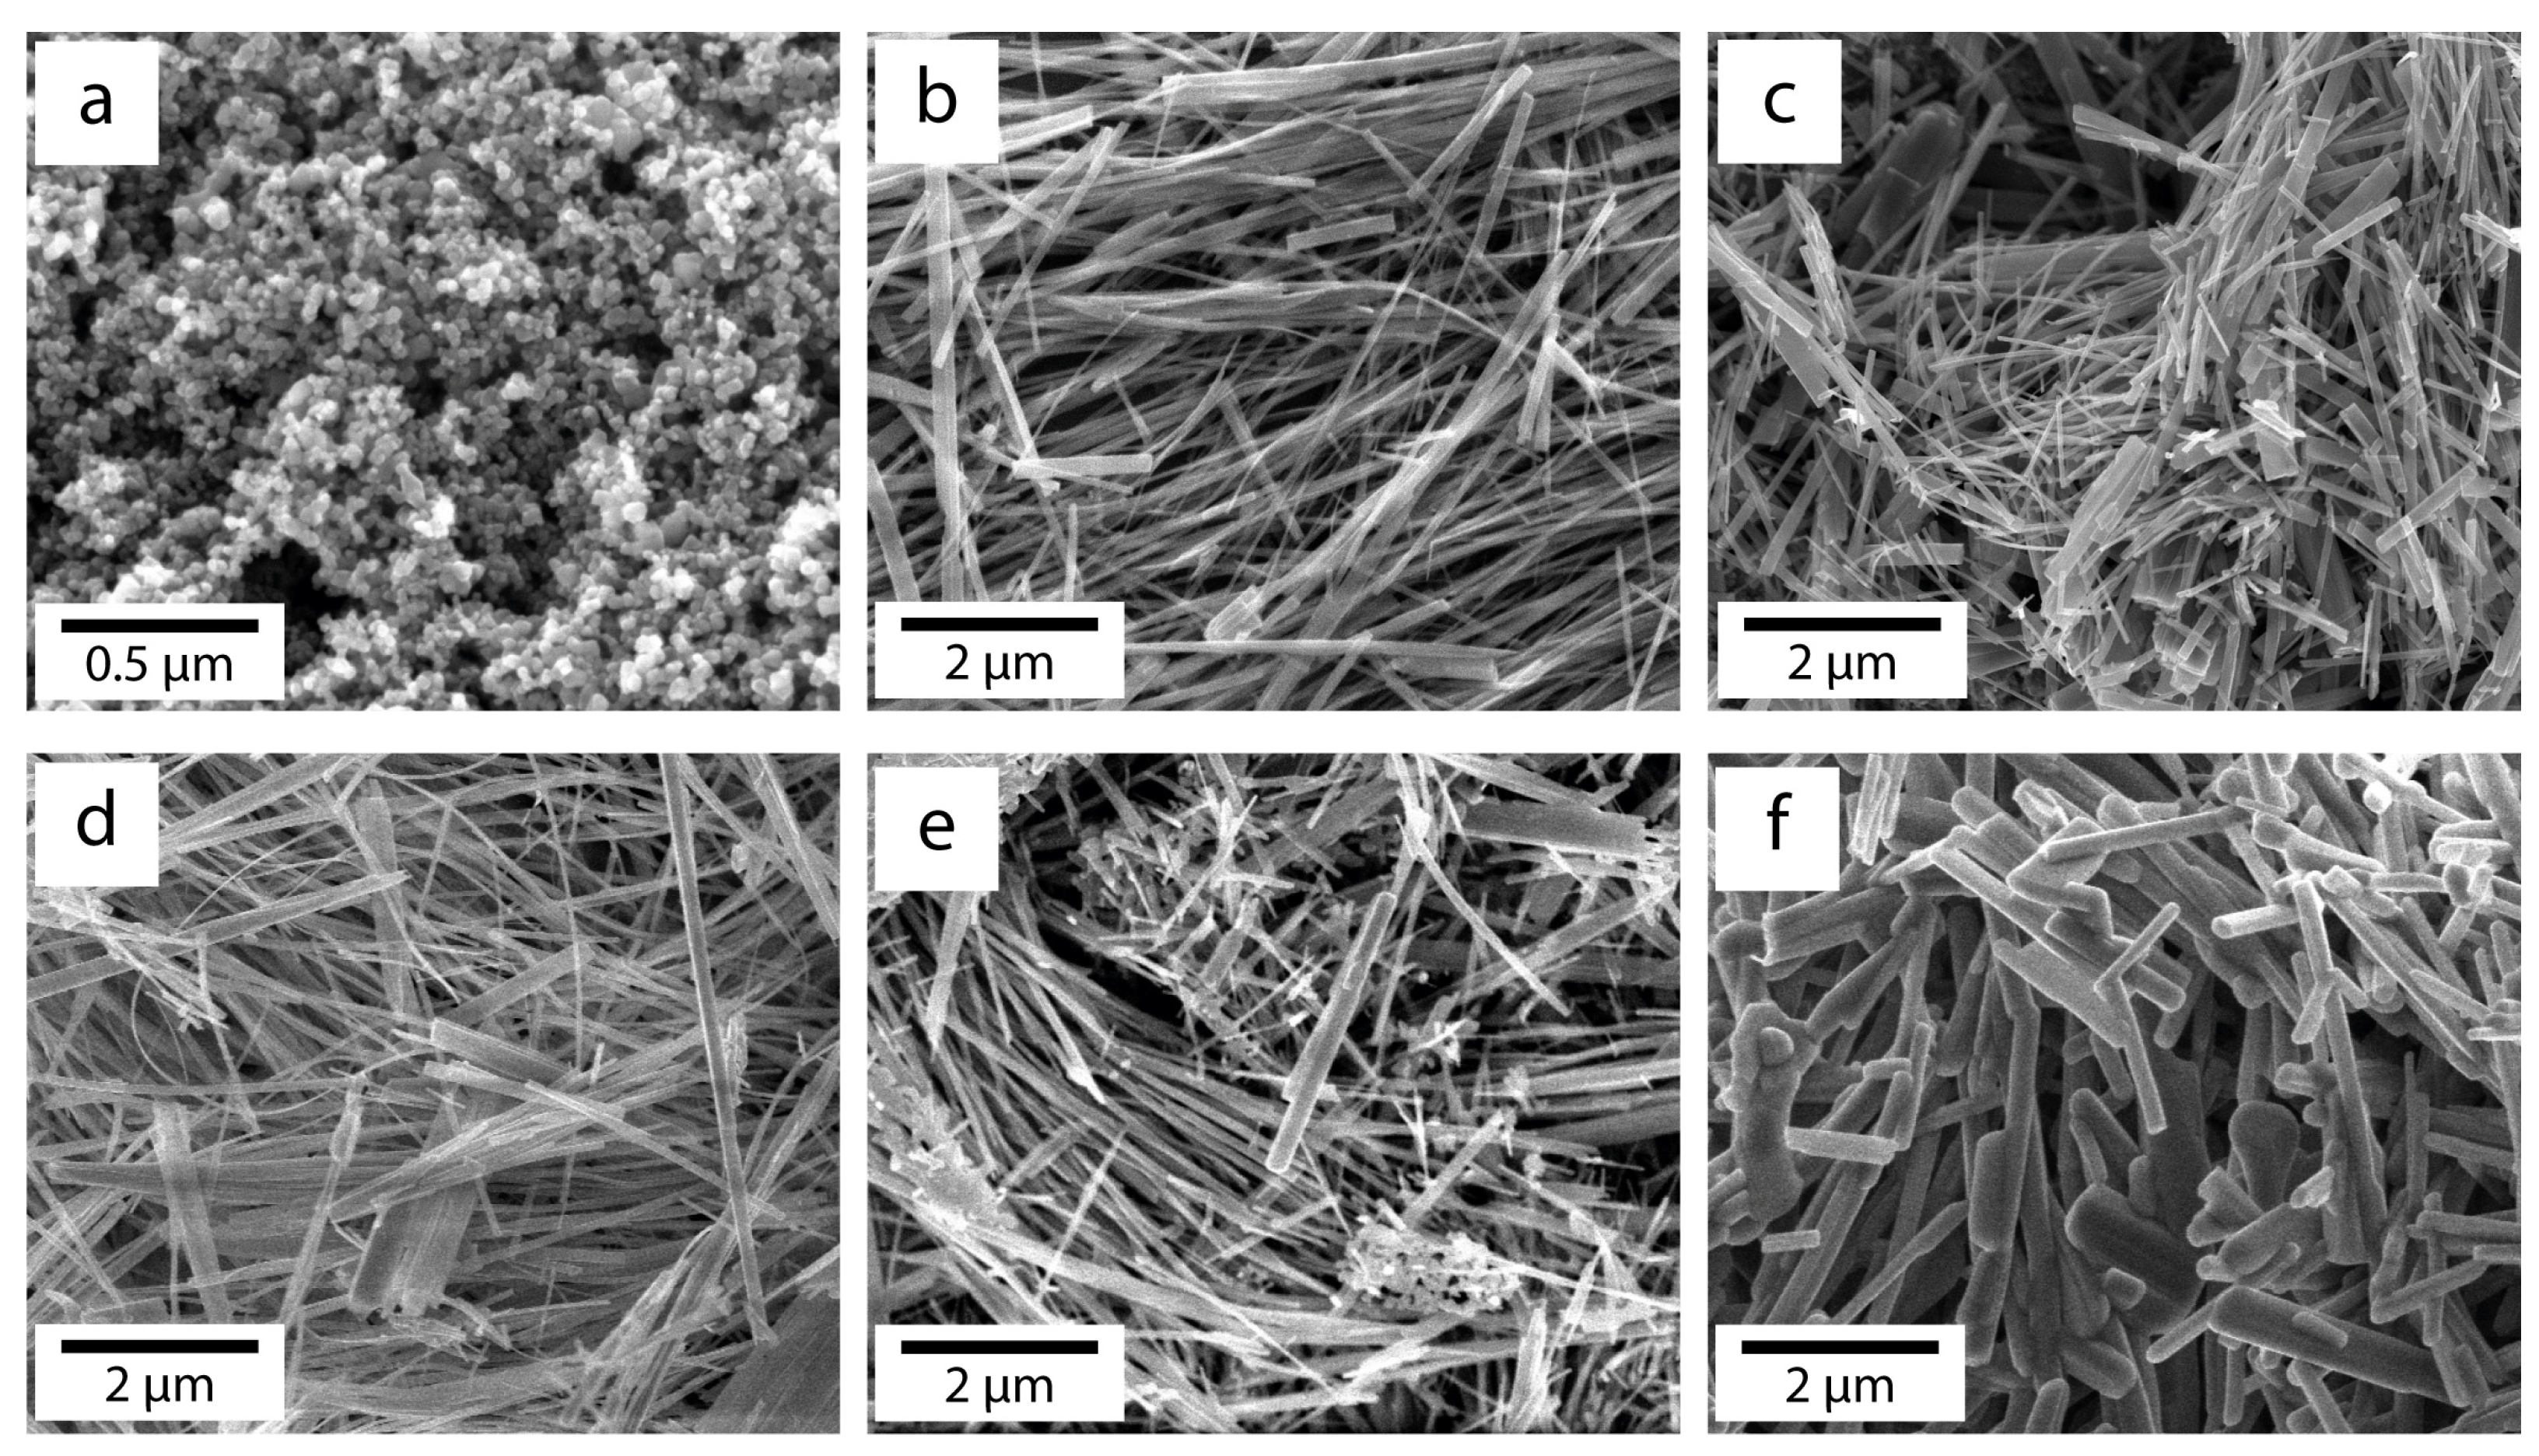
3.1. SEM Study of Morphology of Experimental Samples

SEM images of commercial TiO2 P25 and nanowires obtained by hydrothermal reaction and subjected to heat treatment at different temperatures are shown in Figure 2. Commercial powder P25 (Figure 2a) consists of spherical particles with an average size of about 25 nm. The synthesized nanowires have lengths ranging from 6 to 10 μm and thicknesses from 30 to 300 nm. Heat treatment at temperatures ranging from 350 to 700 °C leads to insignificant changes in morphology. The most noticeable modification is observed in nanowires annealed at 900 °C for 4 h. As can be seen in Figure 2e, in this case, the diameter of the nanowires increases, and the ends of the nanowires take a more rounded shape.

3.2. XRD Studies of Phase Composition of Experimental Samples

Figure 3 shows X-ray diffraction patterns of TiO2 nanowires, initial and heat-treated at different temperatures. After synthesis and washing in acid, nanowires have low crystallinity. The X-ray diffraction pattern of this sample contains almost one pronounced peak at 12°, which is usually identified as titanate or H2TiO3 [34]. After the initial nanowires were subjected to heat treatment at 350 °C for 4 h, the appearance of weakly intense and broadened peaks of different phases of titanium dioxide is observed: TiO2-B (“bronze”), anatase and rutile. Heat treatment in the range of 350–700 °C does not cause a change in the phase composition but leads to the fact that the peaks of the TiO2-B, anatase and rutile phases become more pronounced, and their intensity increases. A change in the phase composition is observed after heat treatment at 900 °C. Reflections of the TiO2-B phase completely disappear. The rutile phase becomes predominant. However, weak peaks characteristic of anatase still remain.

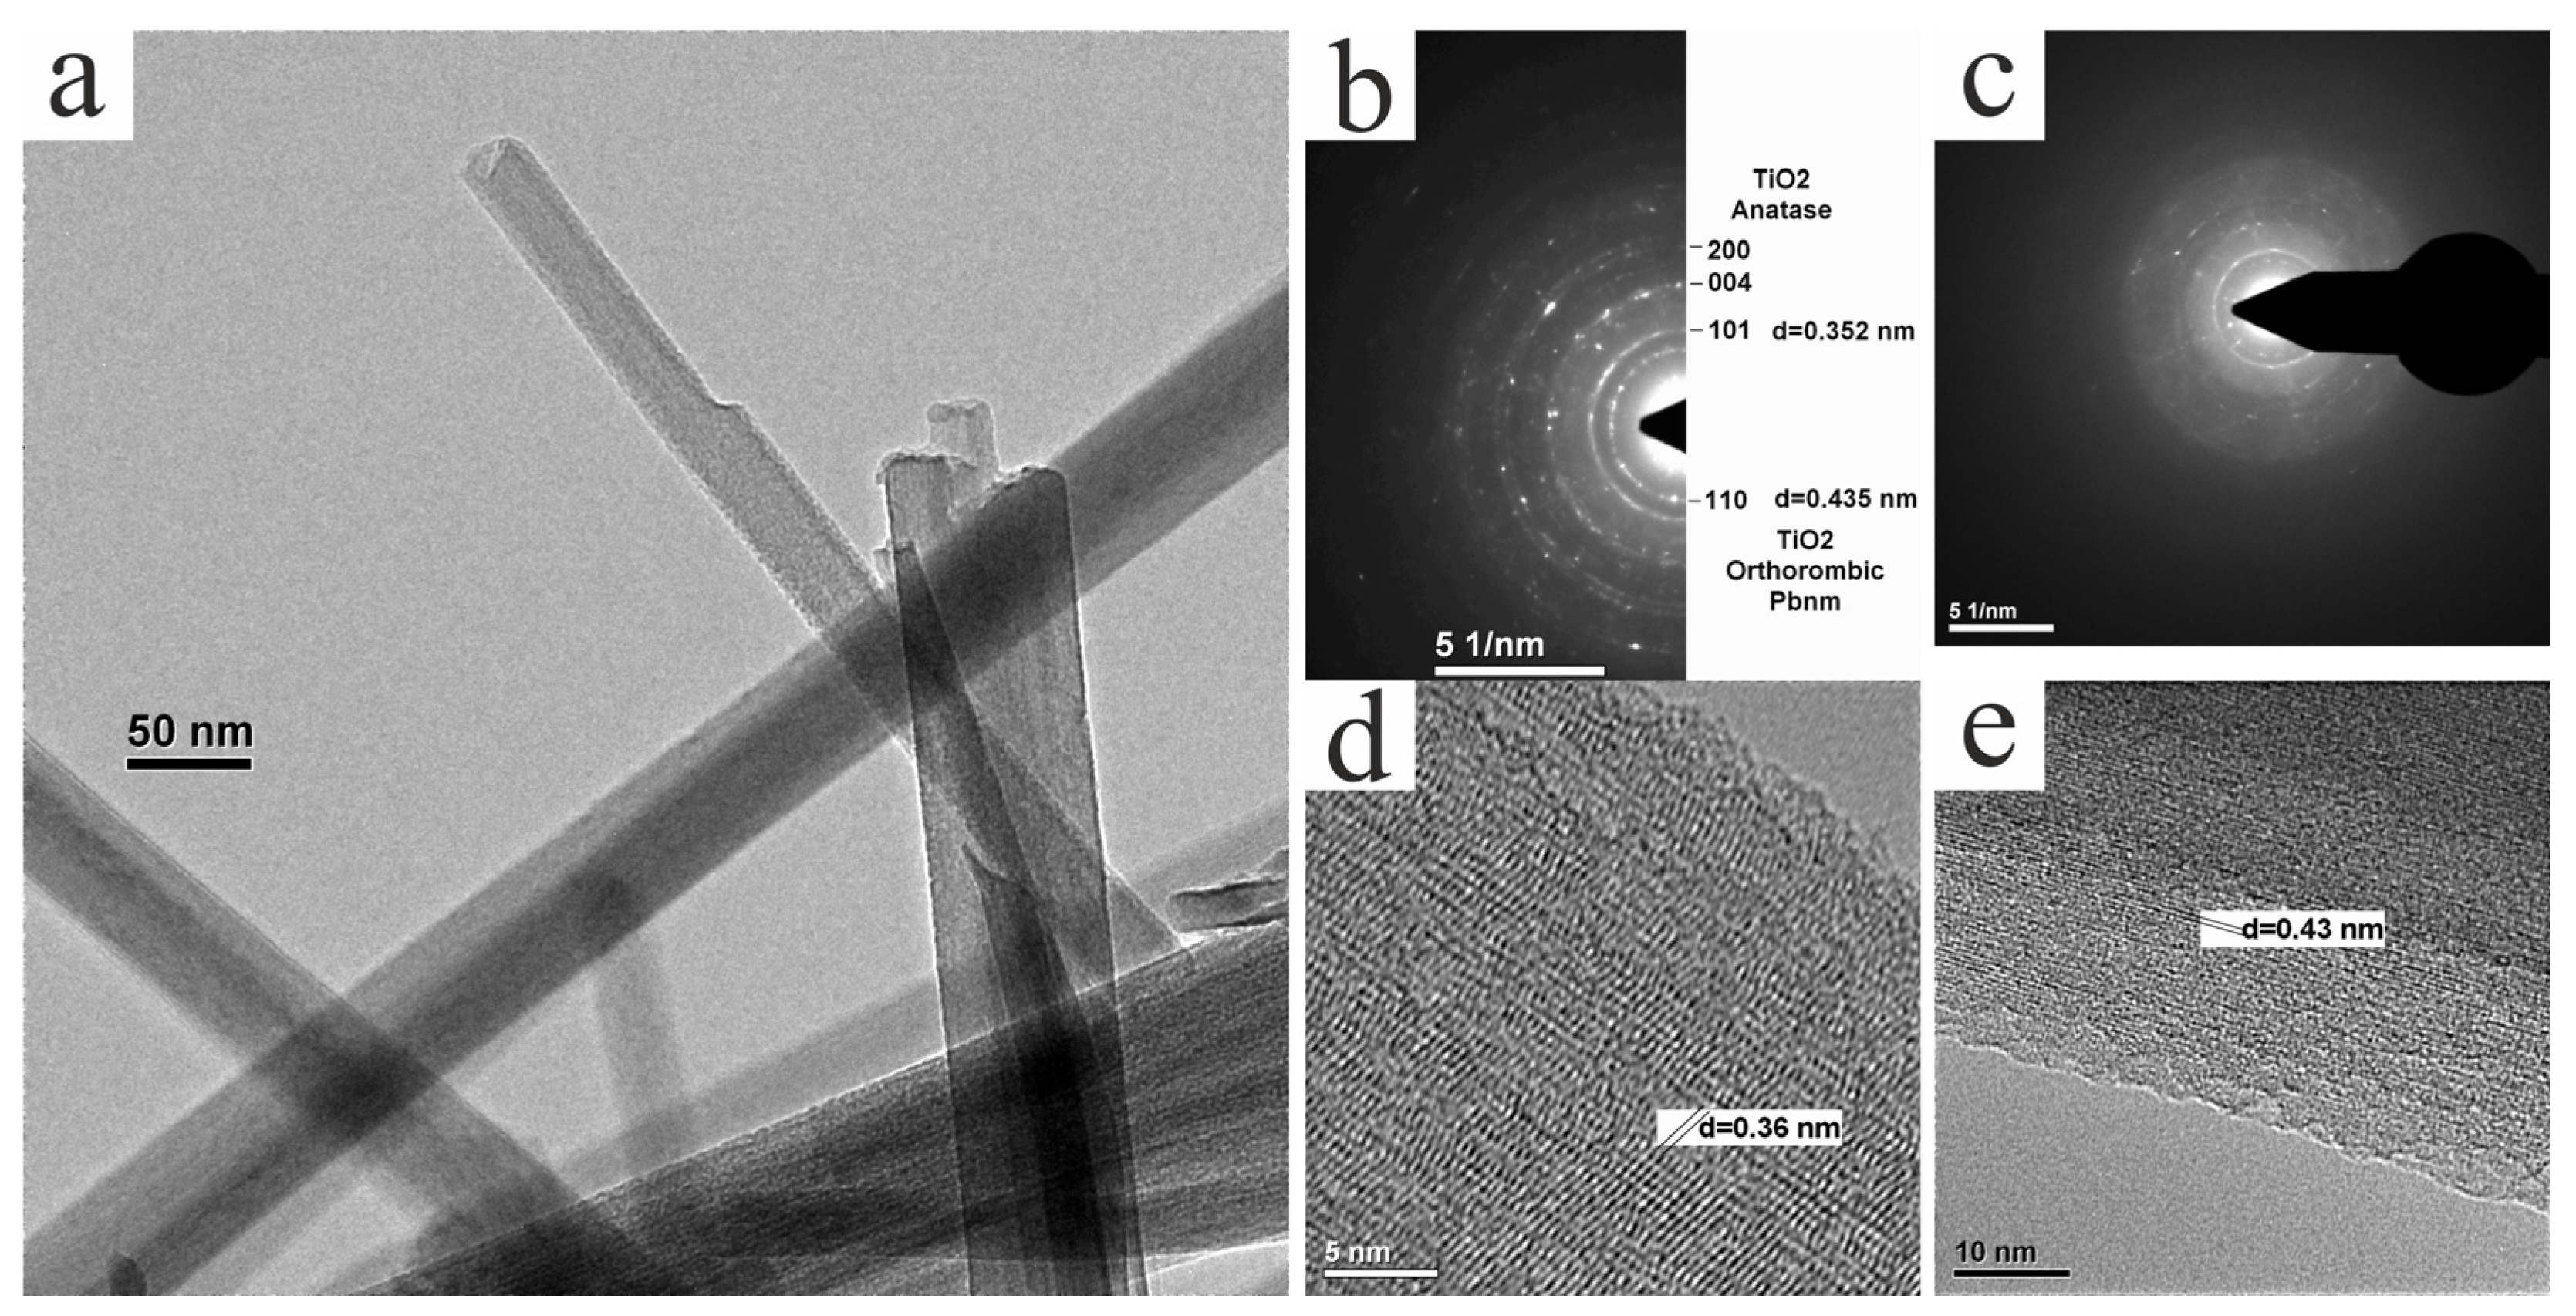
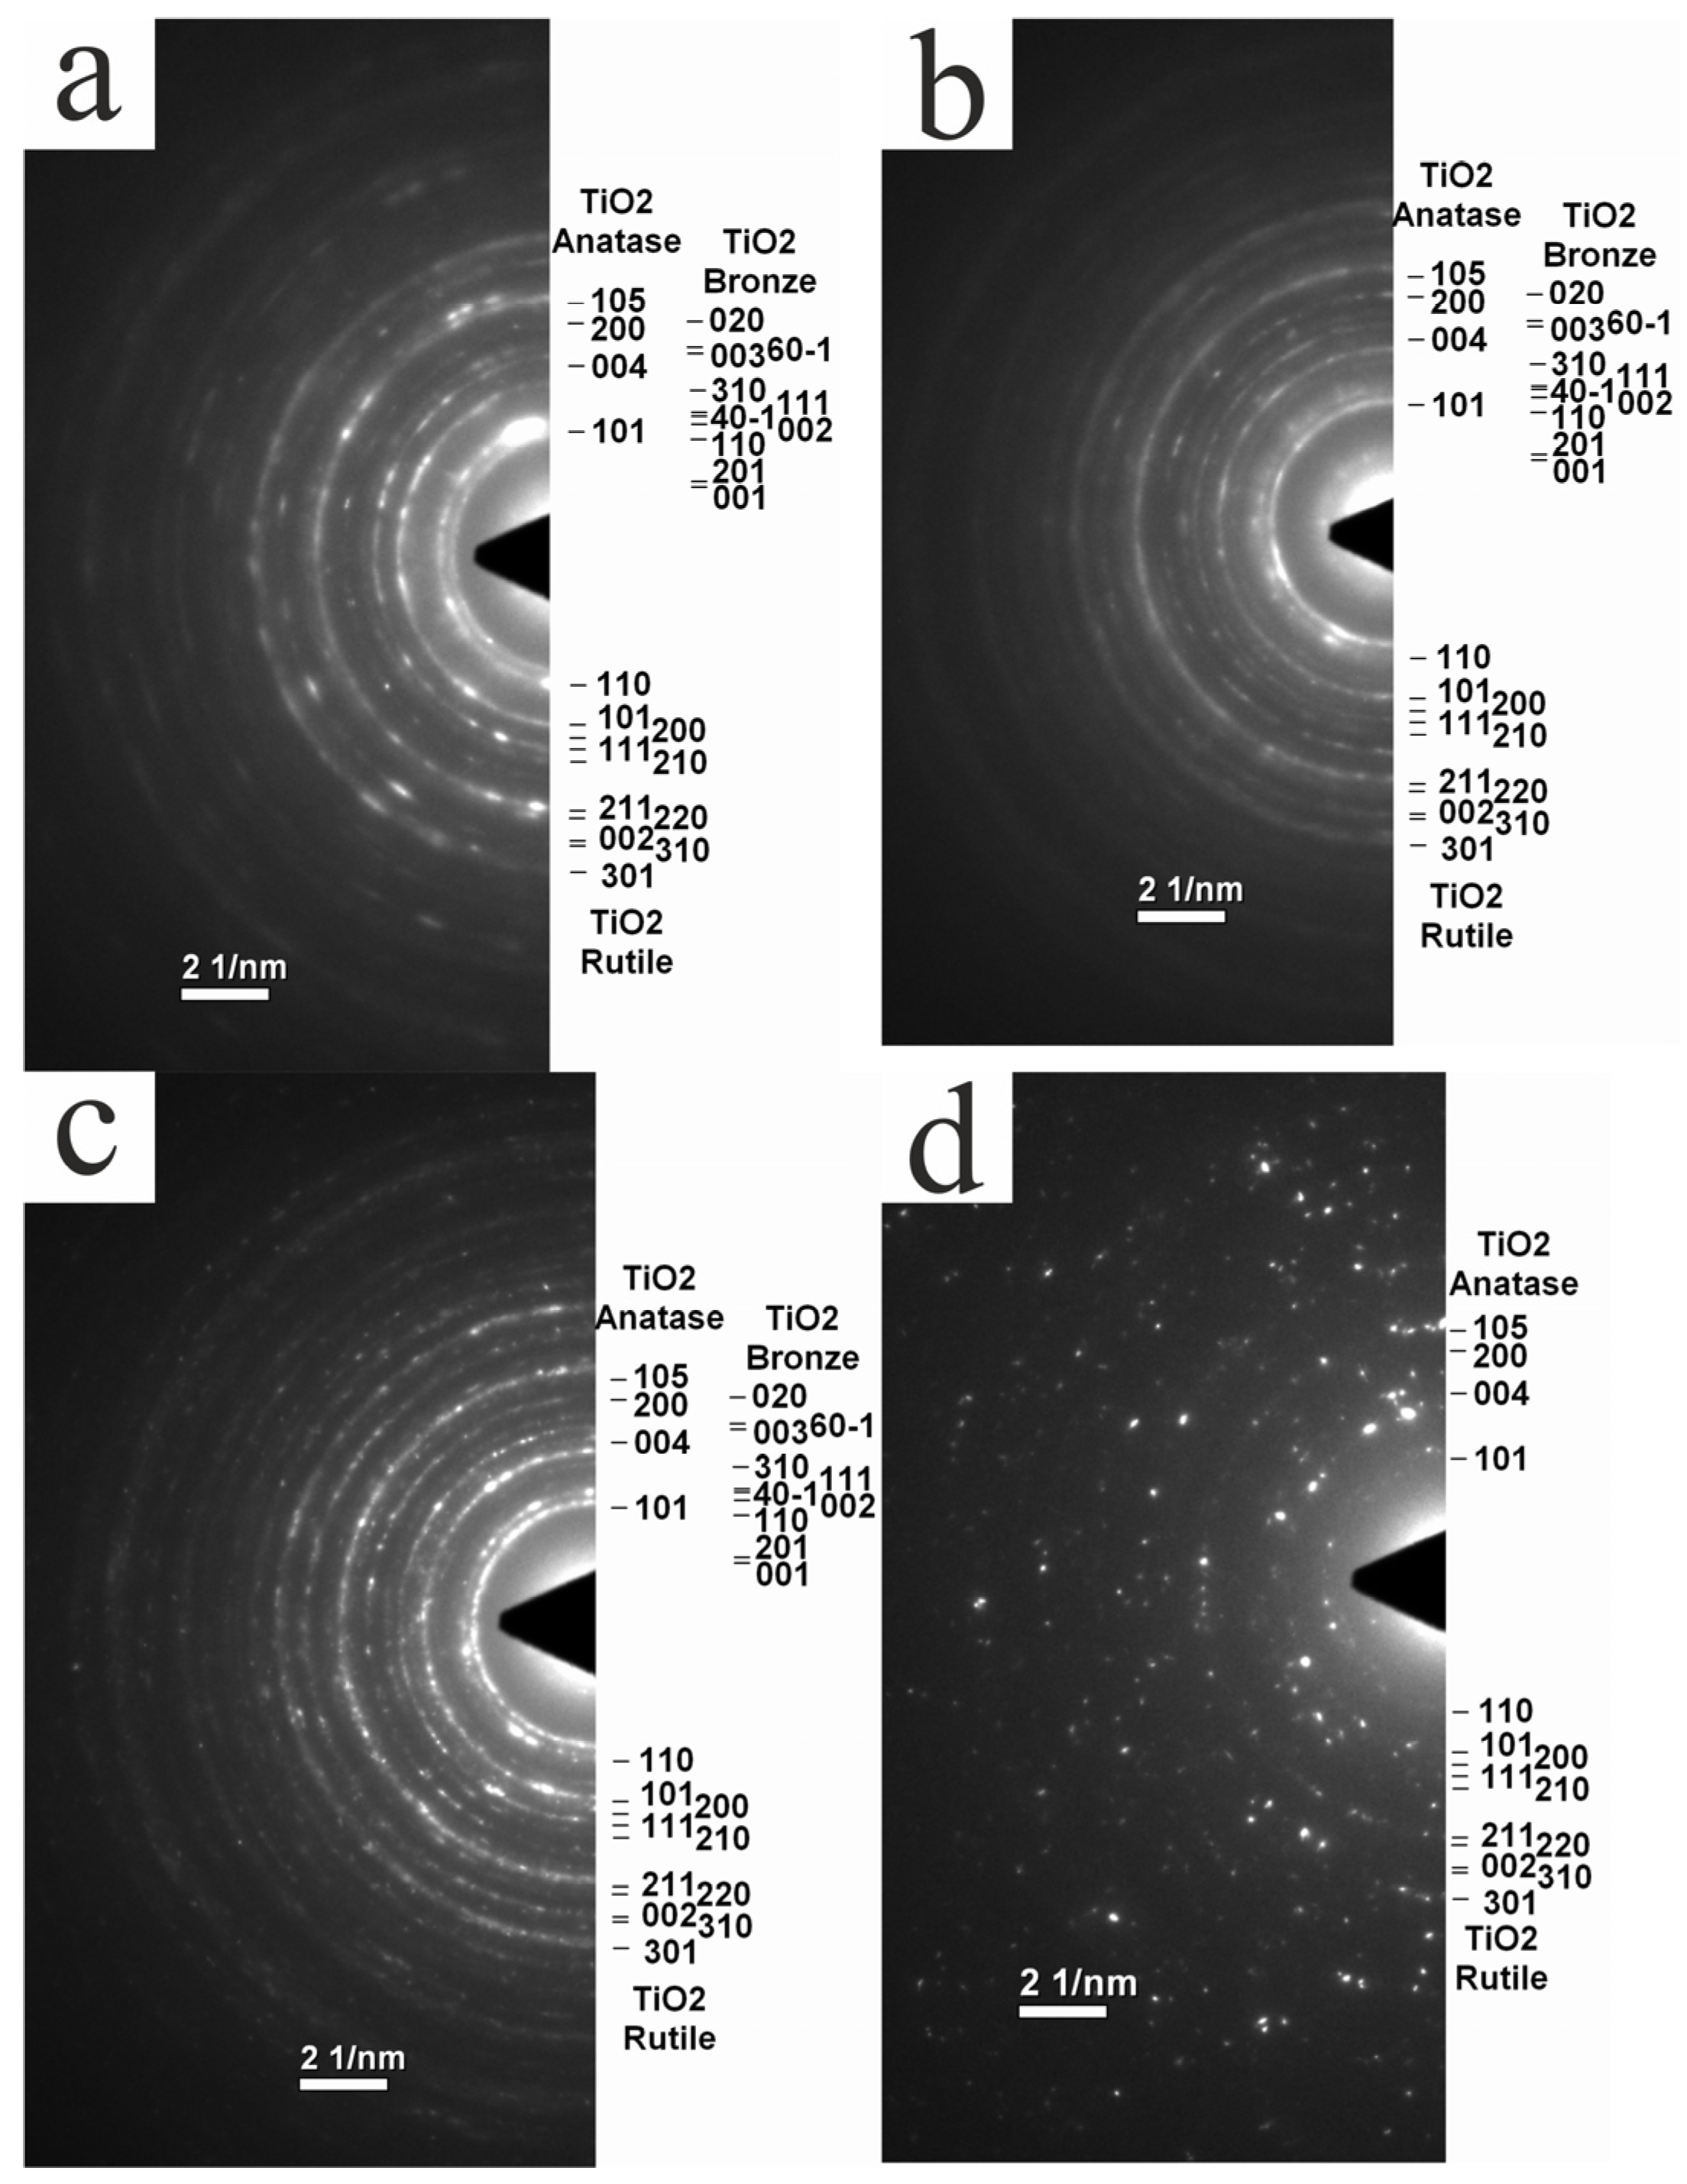
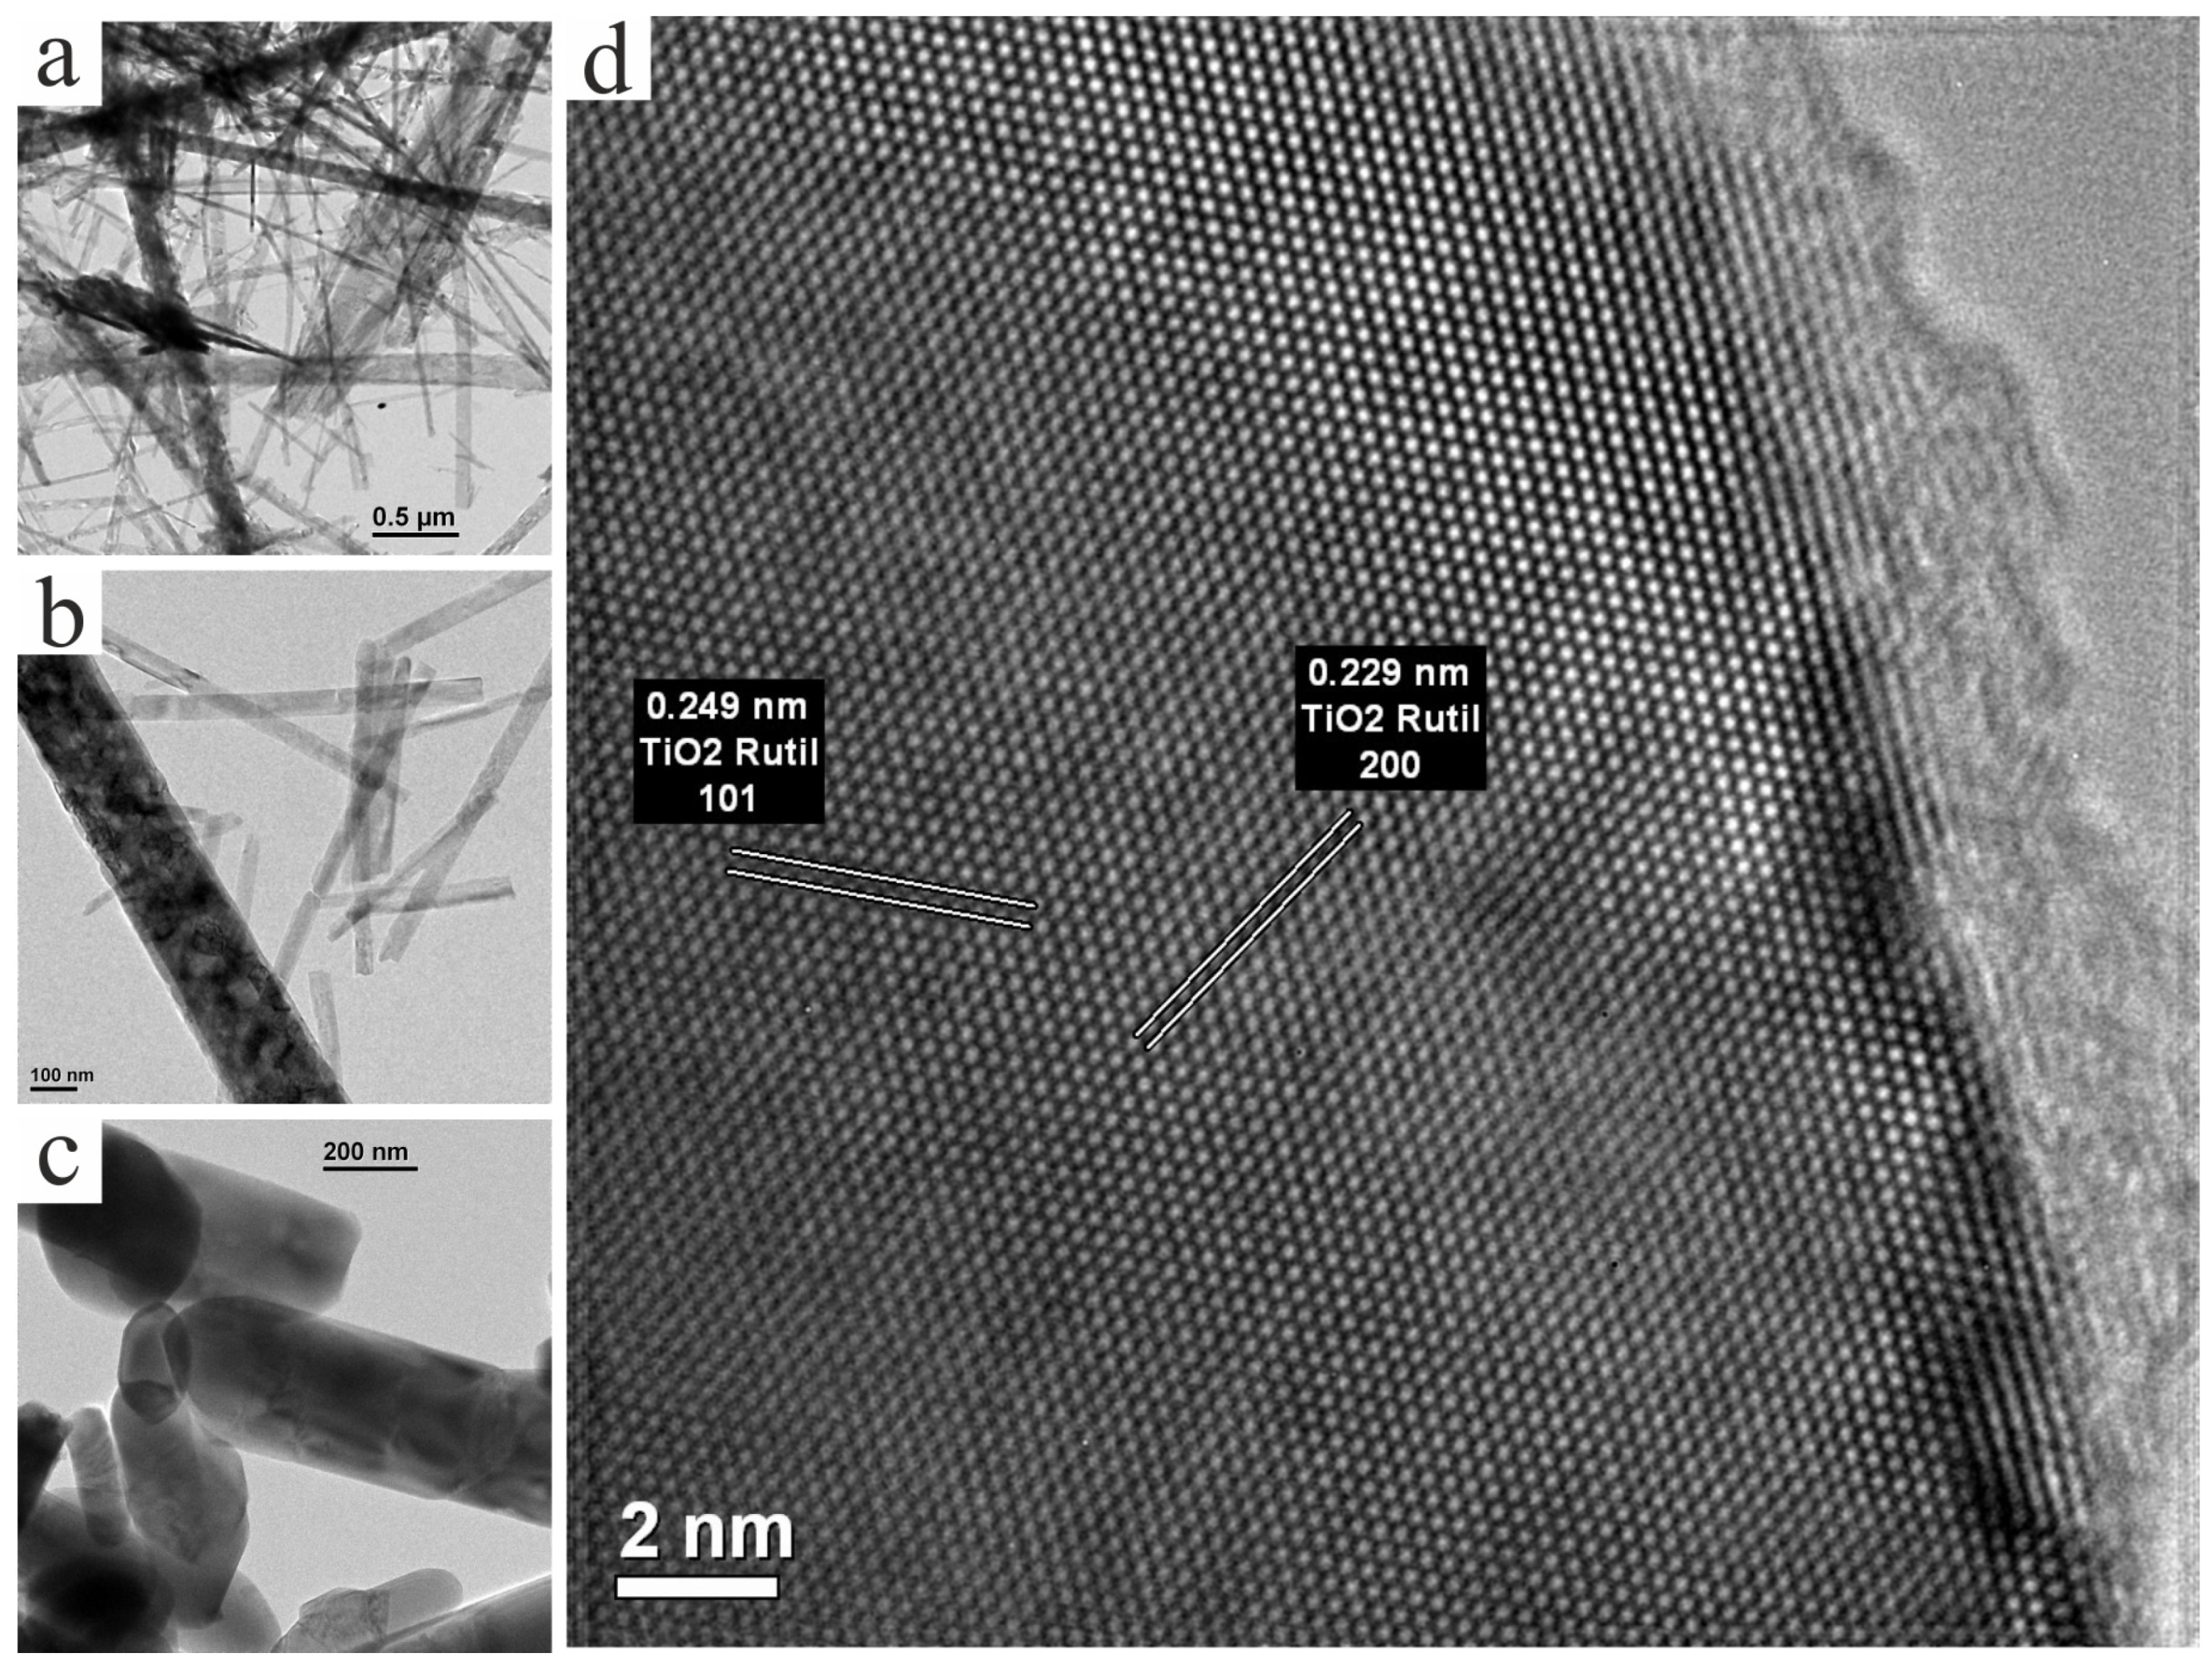
3.3. TEM Study of Structure and Phase Composition of Experimental Samples

Figure 4, Figure 5, Figure 6 and Figure 7 show the results of the studies of the initial and annealed samples using transmission electron microscopy.
Elemental analysis of the initial synthesized nanowires by the EDX method showed that the spectrum contains only peaks corresponding to titanium and oxygen. In the diffraction patterns of this sample (Figure 4c,d), reflections corresponding to two interplanar spaces, ~0.35 nm and ~0.43 nm, are most pronounced. The first of them corresponds to the most intense planes (101) of the tetragonal structure of anatase: d = 0.352 nm. Anatase crystallites are also visible in the high-resolution images in Figure 4d,e.
Among the numerous modifications of titanium oxide, the interplanar spacing d = 0.435 nm is typical only for the (110) planes of the orthorhombic phase TiO2 with the symmetry group Pbnm [35]. All other diffraction reflections in this structure have very low intensity; therefore, in the diffraction patterns in Figure 4, only planes (110) are indexed. The high-resolution image in Figure 4e shows that these planes are oriented along nanowires.
The diffraction pattern in Figure 4b is slightly different from the XRD data. In particular, there are no reflections characteristic of hydrogen titanate. This may be caused by the low stability of titanate and may also be associated with both a long period of exposure of the samples to air and exposure to a high-energy electron beam of the microscope. It should be noted that after a long stay of this sample under the electron beam, reflections with high indices almost disappear in the diffraction pattern (Figure 4c), and diffuse rings corresponding to the amorphous phase become more intense.
Selected area diffraction patterns (SADPs) shown in Figure 5 demonstrate the evolution of the crystal structure of the samples after annealing. In samples annealed at 350, 500 and 700 °C, the diffraction pattern consists of rings corresponding to the crystal lattices of anatase, rutile and TiO2-B, as well as diffuse rings of the amorphous phase. The rings corresponding to TiO2-B appear rather weakly, and the contribution of the amorphous phase weakens as the temperature increases. The diffraction pattern in a sample heated to 900 °C has a different character: instead of rings, it has a system of individual diffraction spots, which generally correspond to the crystal lattice of rutile. This result is quite consistent with TEM and HRTEM images of this sample (Figure 6c,d). Its nanostructures are rutile single crystals elongated along the [001] crystalline axis.
As for the nanostructures of the samples annealed at 350, 500 and 700 °C, they are similar to each other. Their typical appearance is shown in Figure 6a,b. It can be seen that the material under study can be considered as a mixture of thin fibers and thick nanowires. Studying these objects in a dark-field mode (Figure 7) allows us to conclude that thin fibers in their mass have an anatase crystalline structure, and large nanowires have a rutile structure.

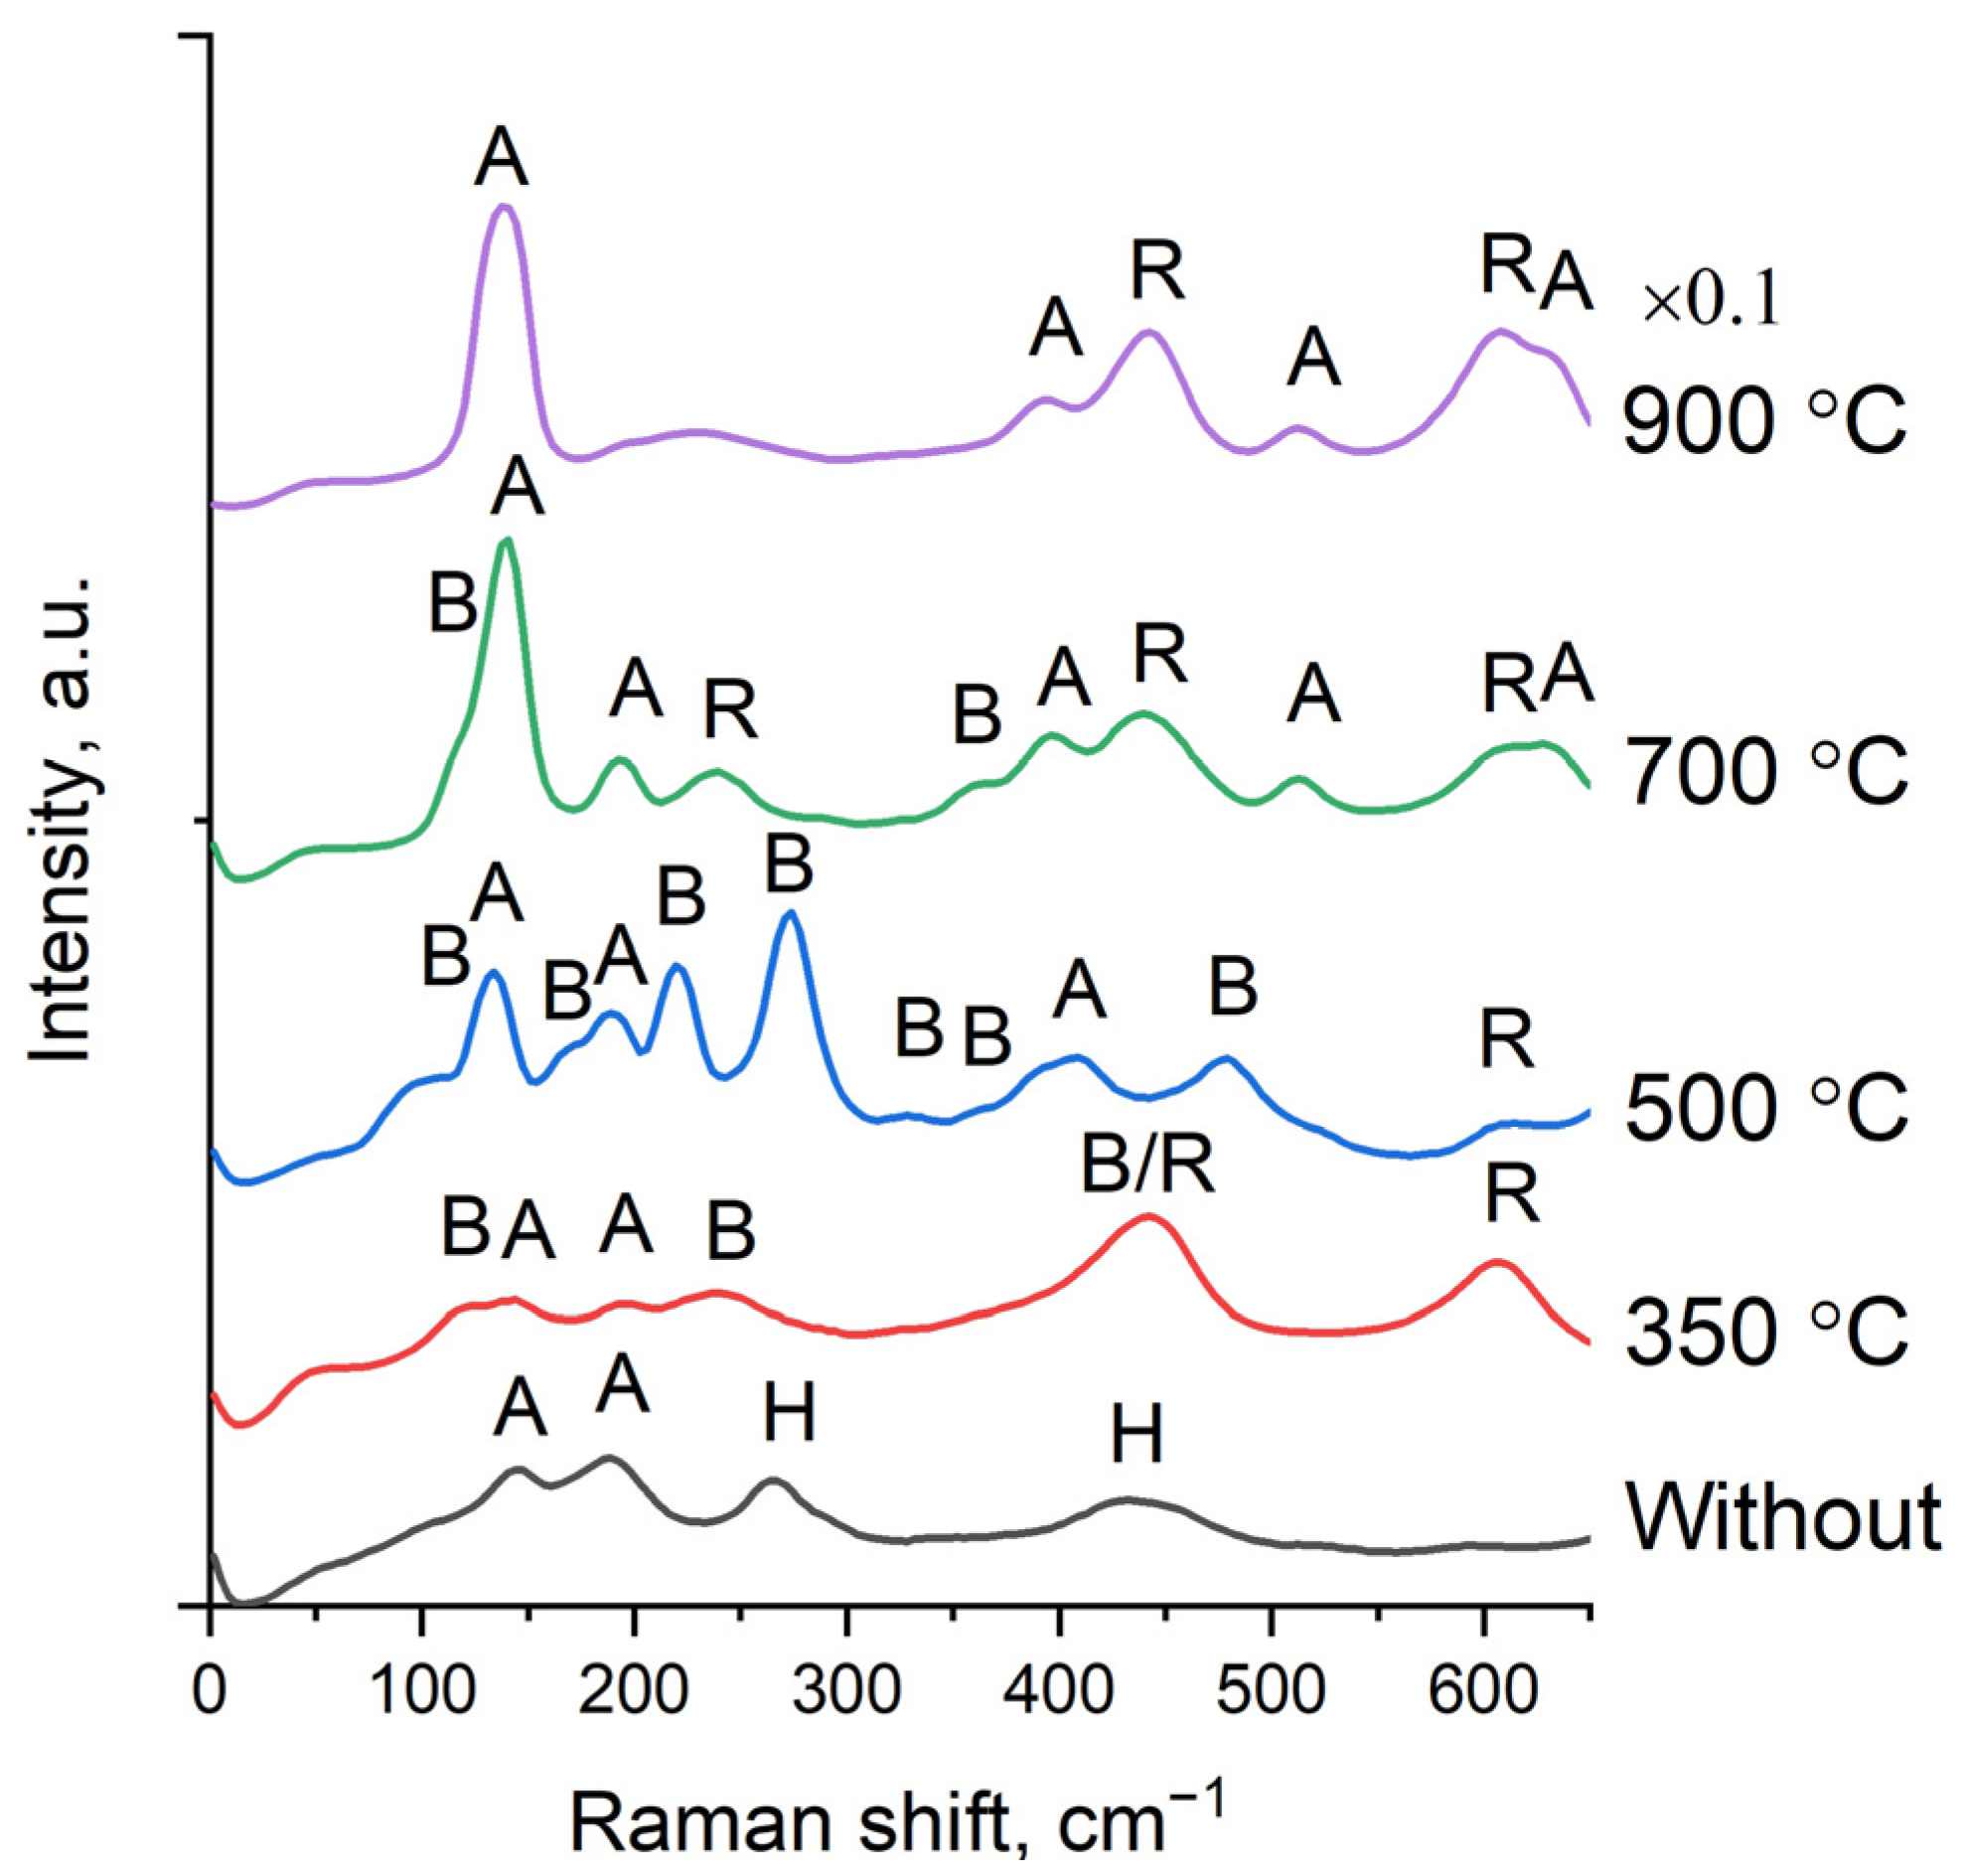
3.4. Raman Studies of the Phase Composition of Experimental Samples

Figure 8 shows the Raman spectra of TiO2 nanowires, both original and thermally treated at different temperatures. The sample that has not been subjected to heat treatment is characterized by low-intensity peaks. The observed peaks are identified as hydrogen titanate [36] and anatase [37]. After heat treatment, the hydrogen titanate peaks disappear. At the same time, peaks characteristic of rutile [37], anatase and bronze [38] appear. The highest intensity of the peaks is observed after annealing at 900 °C, which is due to the highest crystallinity of the nanowires. At this temperature, only anatase and rutile peaks are present. The Raman spectroscopy results generally confirm the results obtained using XRD and TEM.

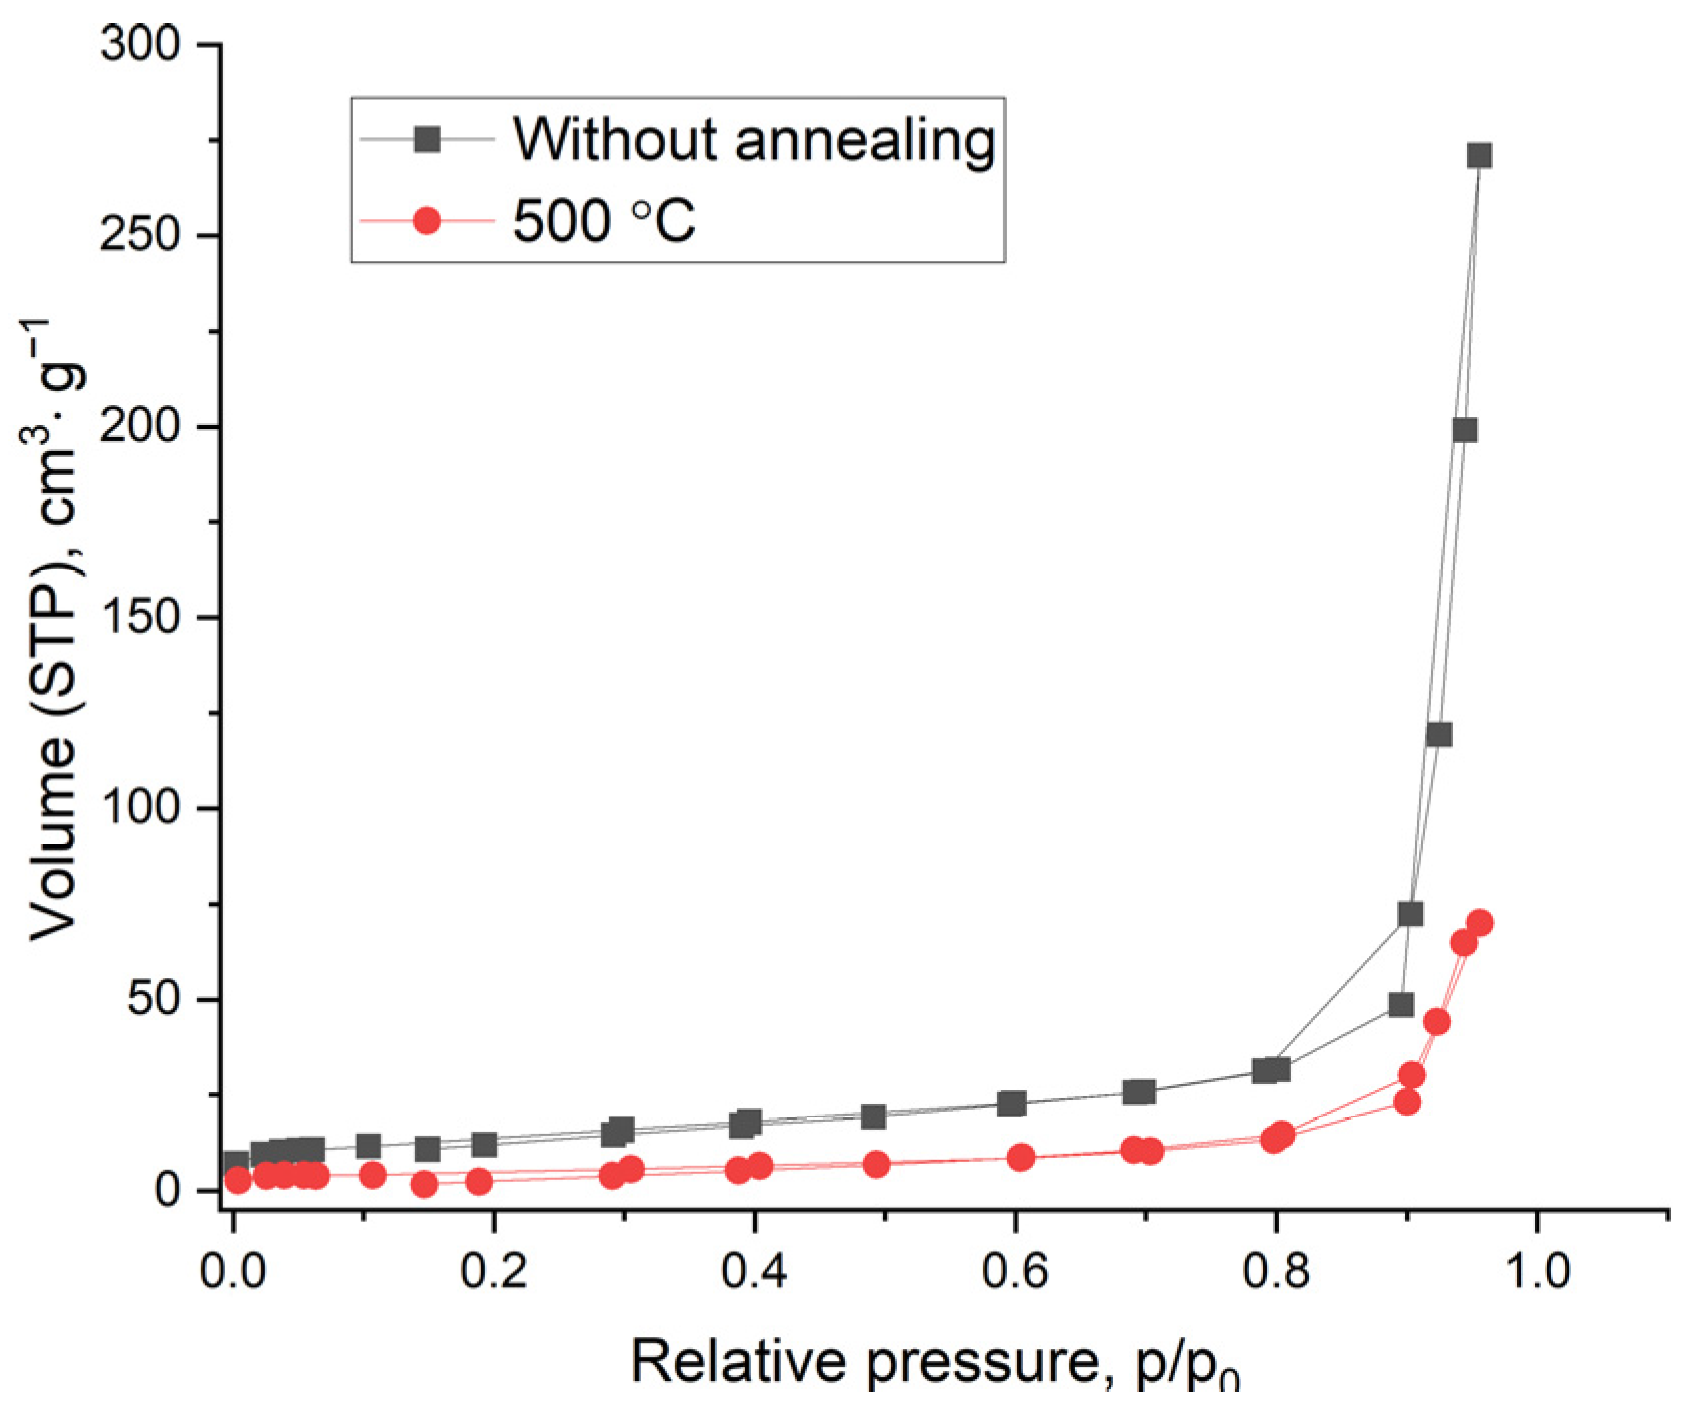
3.5. BET Studies of the Specific Surface Area of Experimental Samples

To analyze the specific surface area of TiO2 nanowires, the samples were studied by the capillary nitrogen condensation method. Figure 9 shows nitrogen adsorption–desorption isotherms at 77 K for the initial sample of TiO2 nanowires and after annealing at 500 °C. Capillary condensation hysteresis on isotherms indicates the presence of mesopores in TiO2 nanowires.
Table 1 presents the values of the specific surface area S calculated based on the analysis of isotherms using the BET method.
The commercial TiO2 P25 shows the highest specific surface area. At the same time, the specific surface area of TiO2 nanowires is lower and decreases with increasing annealing temperature. Synthesized nanowires that have not undergone heat treatment have the largest surface area. After heat treatment at a temperature of 900 °C, the specific surface area decreases by 15 times.

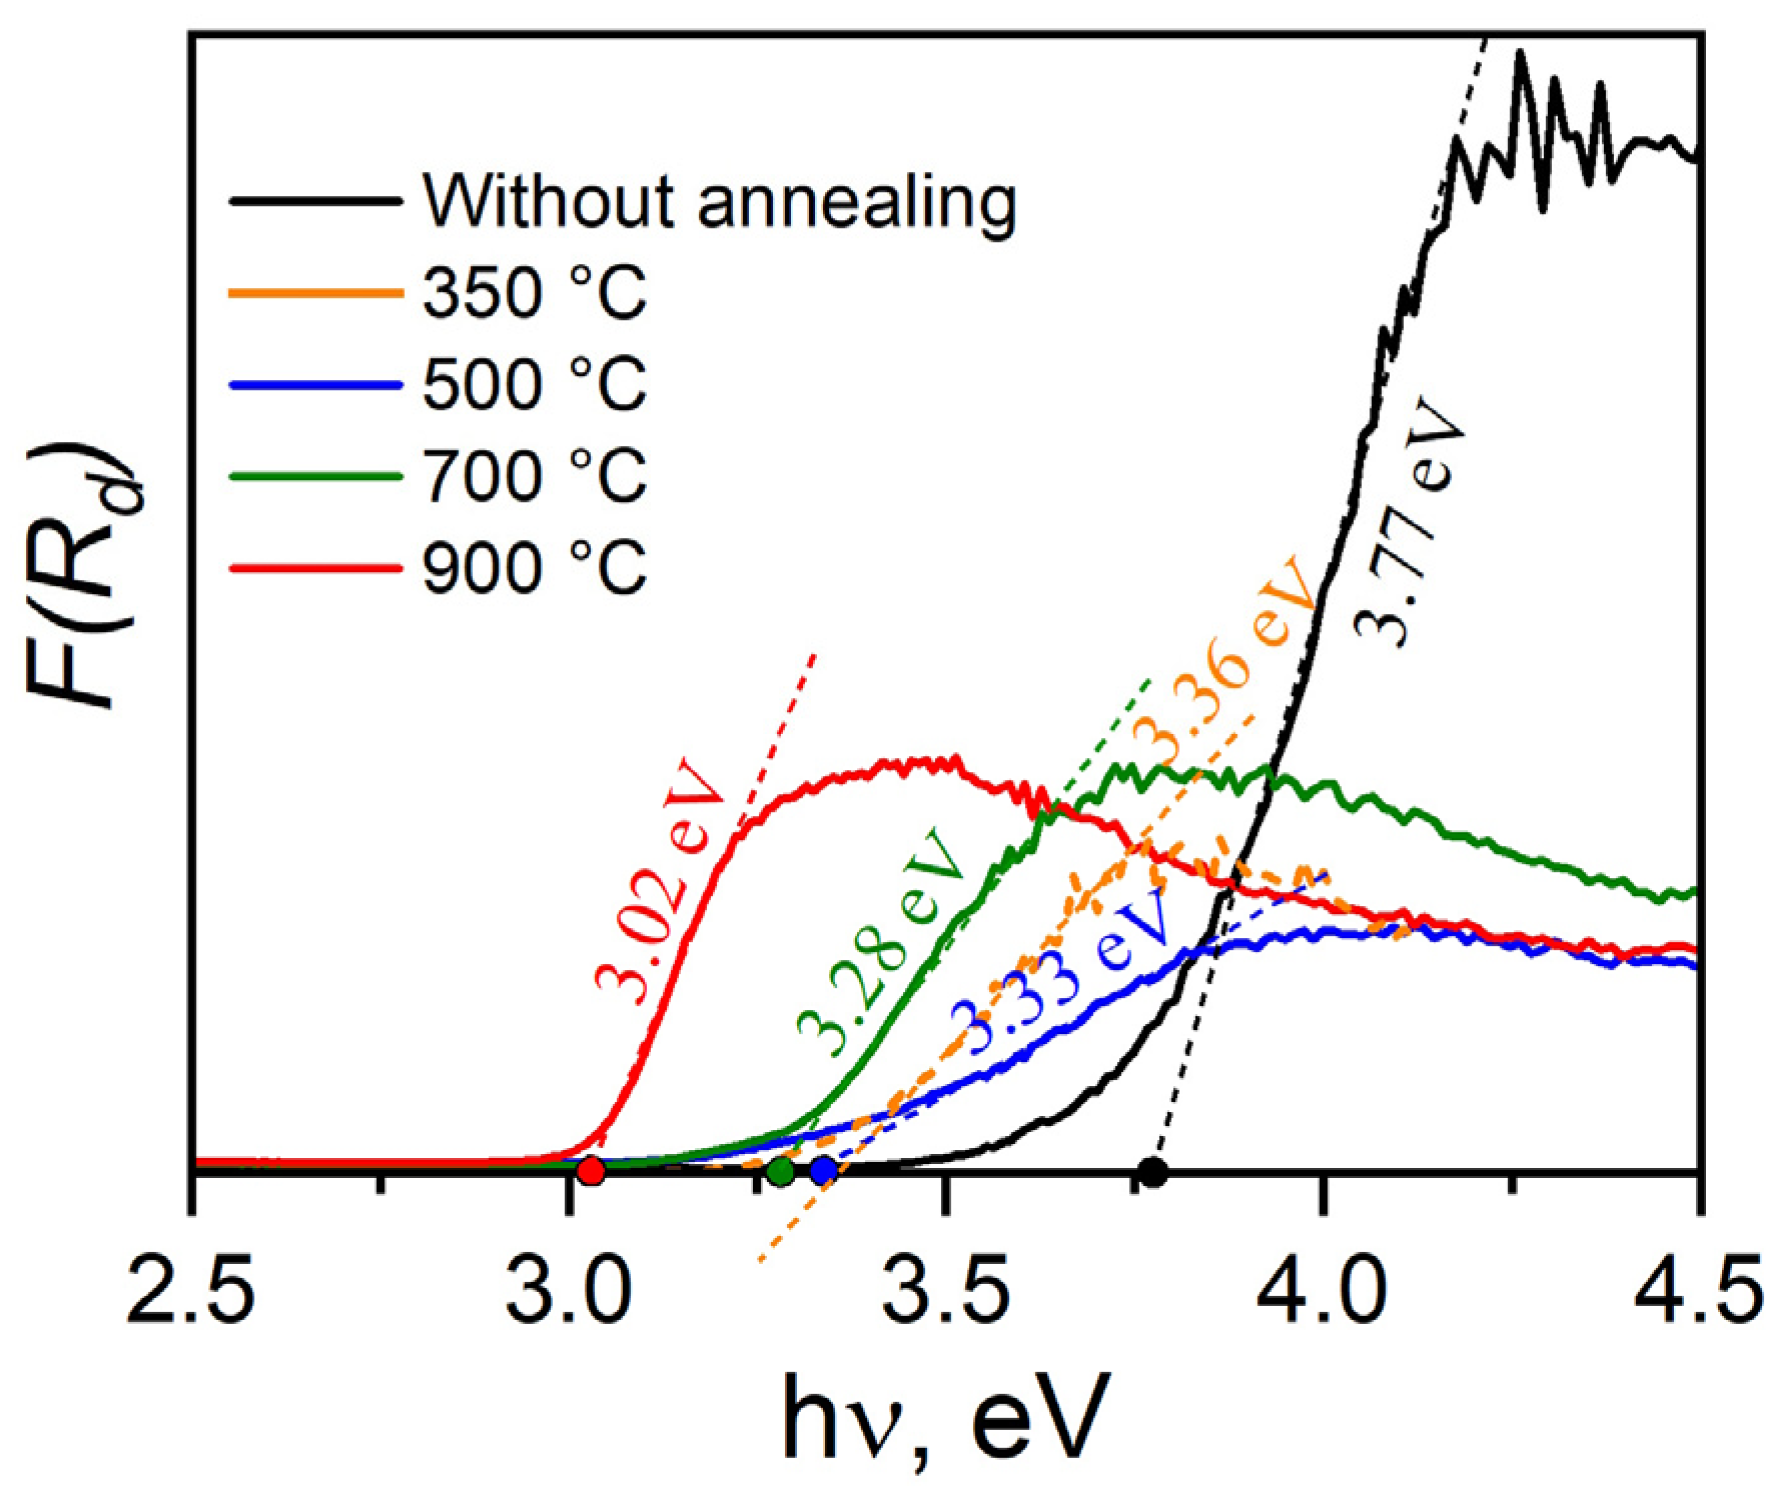
3.6. Optical Properties

The optical properties of TiO2 nanowire samples were studied by measuring the spectral dependences of diffuse reflectance in the UV and visible regions of the spectrum. From the diffuse reflectance data, the spectral absorption dependences of the samples were obtained using the Kubelka–Munk function [39]:
F R d = ( 1 R d ) 2 2 R d
where Rd is the diffuse reflection coefficient, and F(Rd) is a value proportional to the absorption coefficient. The optical band gap of all samples was estimated by determining the point of intersection of the tangent drawn to the linear portion of the dependence of F(Rd) on energy with the abscissa axis as shown in Figure 10.
The original nanowires have the largest optical band gap. A similar value was obtained for hydrogen titanate [40]. For annealed samples, a noticeable decrease in the optical band gap is observed. However, as can be seen in Figure 9, in the heat treatment range of 350–700 °C, it does not change so noticeably within the range of 3.36–3.28 eV. Obviously, this is due to the appearance of a mixture of crystalline phases of TiO2-B, rutile and anatase. However, the optical band gap still remains larger than that of any of these emerging crystalline phases, having an Eg of 2.8, 3.0 and 3.2 eV, respectively. [38,39,40,41,42,43]. Only the sample annealed at 900 °C showed an optical band gap of 3.02 eV, which is close to pure rutile.

3.7. Analysis of Structural Characterization of TiO2 Nanowire Samples

A comprehensive comparison of research results using various methods allows us to obtain a completely clear picture of the structure of the synthesized TiO2 nanowires and their changes as a result of heat treatment at different temperatures (Table 2).
Despite some discrepancies in the XRD and TEM data for the initially synthesized nanowires, it can be concluded that as a material they are weakly crystalline, highly defective and unstable. This material has the largest optical band gap, but at the same time, the largest specific surface area compared to heat-treated samples. One can hardly expect stable properties and reliable operation from such a material.
Thermal treatment of the material in the range of 350–700 °C leads to the formation of multiphase TiO2 nanowires containing anatase, bronze and rutile phases. At the same time, we believe that after such treatment, the amorphous phase remains in some quantity. This is indicated by the optical band gap of these samples, which turns out to be larger than that of anatase, rutile or bronze (Table 2). An increase in the material processing temperature in the specified range generally does not change the phase composition of TiO2 NWs but changes the quantitative ratio of the phases and increases the crystallinity of the material. This is evidenced by an increase in the intensity of the XRD peaks and the sharpness of the TEM diffraction pattern (the transformation of continuous diffuse diffraction rings into sharp rings consisting of a set of point reflections)
In this regard, from the X-ray diffraction patterns of the samples (Figure 3), the average crystallite size of the material was estimated using the Scherrer formula:
D p = 0.94 · λ β · cos θ
where Dp—average crystallite size, β—line broadening in radians, θ—Bragg angle, and λ—X-ray wavelength. The calculation results are presented in Table 2. It can be seen that the average crystallite size increases with increasing temperature of the heat treatment of the material.
Thus, increasing the heat treatment temperature in the range of 350–700 °C positively improves the crystal structure of the material, but in a negative way reduces its specific surface area (Table 2).
Analysis of the results of the sample annealed at atemperature of 900 °C shows that it is highly crystalline TiO2 NWs, in which the rutile phase predominates with some residual anatase content. However, at the same time, this material has the smallest specific surface area.

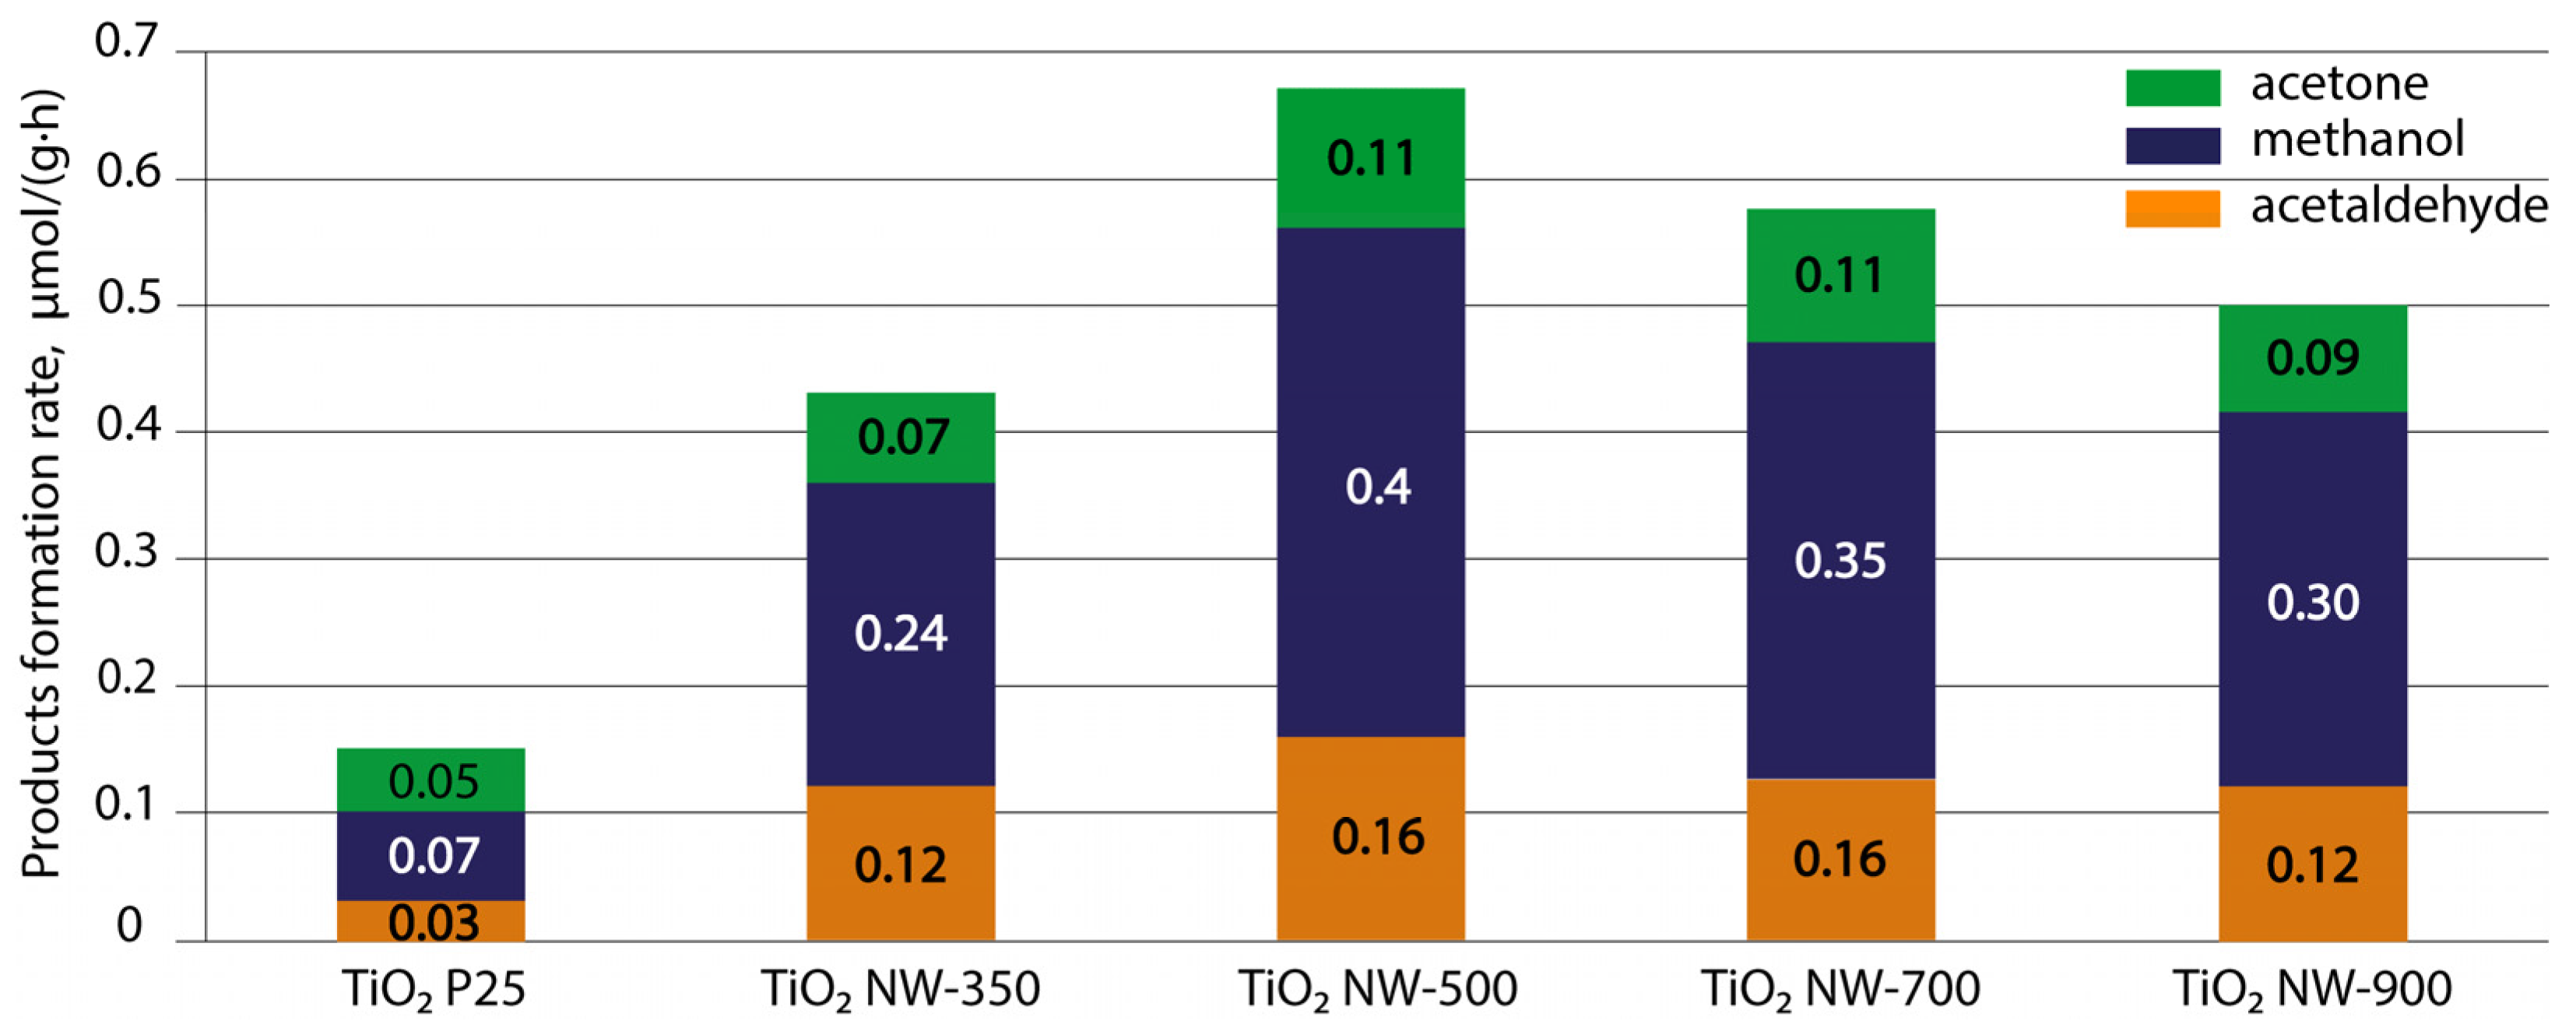
3.8. Photocatalytic Studies

We used the obtained TiO2 NWs as a photocatalyst for the photocatalytic reduction of CO2 in H2O vapor. A series of TiO2 NW samples, thermally treated in the considered temperature range of 350–900 °C, were prepared by the drop method to study photocatalytic activity. The SEM image of the deposited layer of TiO2 NW-500 on titanium foil is shown in Figure 11. The figure shows that the layer has a pronounced, developed relief containing many mesopores.
Figure 12 shows the change in the yield of CO2 photoreduction reaction products in the presence of water vapor depending on the mode of formation of the TiO2 NW photocatalyst materials. For comparison, the figure also shows the results obtained using the commercial TiO2 P25 powder photocatalyst.
It was found that the main products of CO2 photoreduction on the surface of TiO2 NWs and TiO2 P25 are methanol, acetone and acetaldehyde. In all cases, the predominant reaction product is methanol. As can be seen in Figure 11, the first thing that attracts attention is that the yield of CO2 photoreduction products when using TiO2 NWs as a photocatalyst is noticeably higher than when using commercial TiO2 P25, despite the higher specific surface area of the latter.
The second thing, as you can see in Figure 12, is that with increasing processing temperature, the yield of products first increased, reaching the highest value of 0.67 µmol/(g·h) for the TiO2 NW-500 sample, and then, with an increase in temperature to 900 °C (TiO2 NW-900), it decreased to 0.5 µmol/(g·h).
In the photocatalytic reduction of CO2 on TiO2, products are formed through the direct generation of VB-CB electron–hole pairs under the influence of UV light. In particular, methanol is formed under the influence of UV light according to the following scheme [44]:
H 2 O + h + H + + O H ·
C O 2 + 6 H + + 6 e C H 3 O H + H 2 O
We attribute the higher yield of products on TiO2 NWs to two factors. Firstly, it is believed that one-dimensional TiO2 structures have higher charge carrier mobility and more efficient charge carrier transport along the axial direction. This fact was confirmed by DFT modeling for TiO2 nanobelts [45] and nanowires [31]. It was also demonstrated that TiO2 nanofibers generated three times higher photocurrent compared to nanoparticles and also exhibited enhanced photocatalytic activity for hydrogen production [32].
Secondly, the yield of photocatalytic process products is influenced by the heterostructural state of the material, when several phases with different band gap widths are in contact, which promotes the separation and accumulation of charge carriers, increases their lifetime and reduces the probability of recombination. It is known that the combination of different phases of titanium dioxide demonstrates significantly improved photocatalytic properties compared to single-phase titanium dioxide [46,47]. In our case, the best photocatalytic activity was demonstrated by the NW-500 TiO2 sample, which is a combination of anatase, rutile, bronze and amorphous phases. Some studies show an increase in photocatalytic activity in the presence of the bronze phase compared to the rutile/anatase combination [38]. Besides that, this kind of temperature dependence in Figure 12 can also be associated with the influence of two differently directed factors: an increase in crystallinity, which decreases the charge carrier recombination probability, on the one hand, and a decrease in the specific surface area on the other (Table 2). Thus, there is a certain optimum corresponding to a high degree of crystallinity, a large surface area and the presence of a heterophase transition. We believe that due to the described set of properties, the TiO2 NW-500 sample demonstrates the highest performance in the photocatalytic reduction of CO2.
Since the sample of TiO2 NW-500 proved to be the best photocatalyst, it was used to study the effect of the sample temperature in the reactor on the process of CO2 reduction in water vapor. The results of this study are shown in Figure 13.
Figure 13 shows that as the reactor temperature increases to 100 °C, photocatalytic activity increases, and with a further increase in temperature, the activity decreases. With an increase in temperature from 40 °C to 100 °C, the total yield of reaction products increased by 2.5 times. This trend of changes in photocatalytic activity with changes in temperature can be associated with a shift in the dynamic equilibrium between the adsorption and desorption of CO2 molecules and reaction products. Elevated temperature facilitates the desorption of products, providing a pathway for CO2 to adsorb onto vacant sites, resulting in increased reaction rates [48,49,50]. However, increasing the temperature to 125 °C already leads to a decrease in product yield. A similar character of the temperature dependence was found earlier in the study of RuNi/TiO2 for CO-tolerant toluene hydrogenation [51], in the investigation of the performances of Pd/TiO2 catalysts in the steam reduction of CO2 and TiO2 [52], and in the research of Pd/TiO2 photocatalysts using the example of methylene blue decomposition in water [53]. Taking into account these observations, we believe that this may be due to an unfavorable ratio of adsorption of precursors under conditions of simultaneous exposure of the surface to radiation, which leads to their insufficiency for the reaction. Thus, for TiO2 NWs synthesized and thermally treated at 500 °C, the highest catalytic activity is observed at a reactor temperature of 100 °C.

4. Conclusions

The present study shows that the hydrothermally synthesized TiO2 nanowire photocatalyst is much more effective for CO2 reduction in H2O vapor than the known powder commercial photocatalyst P25 (Evonik). This is determined by a combination of one-dimensional TiO2 structures, phase composition, crystallinity and the specific surface area of the material, which are controlled by thermal post-treatment of the initially synthesized TiO2 nanowires. In our case, the best result of the photocatalytic reduction of CO2 in H2O vapor is achieved at 500 °C annealing due to the storage of relatively high specific surface areas, the presence of the TiO2-B phase and high enough crystallinity. In addition, the photoreduction process itself of CO2 in H2O vapor should be optimized by both the irradiation and the surface temperature. Obviously, this combination of irradiation and temperature determines the conditions for the separation of pairs of charge carriers generated in TiO2 NWs under the irradiation, their lifetime and the conditions for the adsorption–desorption of reagents and products. In our study, using xenon lamp irradiation, the highest photocatalytic activity of TiO2 NWs is observed at the reactor temperature of 100 °C. Thus, expanding the understanding of the influence of the structural features of a material on its photocatalytic properties is useful for the development of green technologies, such as artificial photosynthesis.

Author Contributions

Conceptualization, A.M.T., S.V.D. and D.G.; methodology, A.M.T., L.I.S., D.A.D., O.V., A.Y.T., A.V.T., E.N.S. and E.S.Z.; validation, D.G. and S.V.D.; formal analysis, S.V.D., A.V.T. and L.I.S.; investigation, A.M.T., L.I.S., D.A.D., O.V., A.Y.T., S.S.I., A.V.T., E.N.S. and E.S.Z.; resources, D.V.K.; data curation, D.V.K., S.V.D. and D.G.; writing—original draft preparation, A.M.T. and D.G.; writing—review and editing, A.Y.T., A.M.T. and D.G.; visualization, A.M.T. and L.I.S.; supervision, D.G. All authors have read and agreed to the published version of the manuscript.

Funding

This research was funded by the Russian Science Foundation No. 22-19-00654 https://rscf.ru/project/22-19-00654/ (accessed on 12 May 2022).

Data Availability Statement

The data presented in this study are available upon request from the corresponding author.

Conflicts of Interest

The authors declare no conflicts of interest.

References

  1. Fujishima, A.; Rao, T.N.; Tryk, D.A. Titanium Dioxide Photocatalysis. J. Photochem. Photobiol. C Photochem. Rev. 2000, 1, 1–21. [Google Scholar] [CrossRef]
  2. Kumar, A.; Saxena, V.K.; Thangavel, R.; Nandi, B.K. A Dual Effect of Surface Roughness and Photocatalysis of Crystalline TiO2-Thin Film for Self-Cleaning Application on a Photovoltaic Covering Glass. Mater. Chem. Phys. 2022, 289, 126427. [Google Scholar] [CrossRef]
  3. Bai, X.; Yang, S.; Tan, C.; Jia, T.; Guo, L.; Song, W.; Jian, M.; Zhang, X.; Zhang, Z.; Wu, L.; et al. Synthesis of TiO2 Based Superhydrophobic Coatings for Efficient Anti-Corrosion and Self-Cleaning on Stone Building Surface. J. Clean. Prod. 2022, 380, 134975. [Google Scholar] [CrossRef]
  4. Perović, K.; Dela Rosa, F.M.; Kovačić, M.; Kušić, H.; Štangar, U.L.; Fresno, F.; Dionysiou, D.D.; Loncaric Bozic, A. Recent Achievements in Development of TiO2-Based Composite Photocatalytic Materials for Solar Driven Water Purification and Water Splitting. Materials 2020, 13, 1338. [Google Scholar] [CrossRef]
  5. Armaković, S.J.; Savanović, M.M.; Armaković, S. Titanium Dioxide as the Most Used Photocatalyst for Water Purification: An Overview. Catalysts 2022, 13, 26. [Google Scholar] [CrossRef]
  6. Chen, X.-F.; Jiao, C.-J. A Photocatalytic Mortar Prepared by Tourmaline and TiO2 Treated Recycled Aggregates and Its Air-Purifying Performance. Case Stud. Constr. Mater. 2022, 16, e01073. [Google Scholar] [CrossRef]
  7. Mamaghani, A.H.; Haghighat, F.; Lee, C.-S. Role of Titanium Dioxide (TiO2) Structural Design/Morphology in Photocatalytic Air Purification. Appl. Catal. B Environ. 2020, 269, 118735. [Google Scholar] [CrossRef]
  8. Liu, R.; Fang, S.-Y.; Dong, C.-D.; Tsai, K.-C.; Yang, W.-D. Enhancing Hydrogen Evolution of Water Splitting under Solar Spectra Using Au/TiO2 Heterojunction Photocatalysts. Int. J. Hydrogen Energy 2021, 46, 28462–28473. [Google Scholar] [CrossRef]
  9. Li, H.; Wu, S.; Hood, Z.D.; Sun, J.; Hu, B.; Liang, C.; Yang, S.; Xu, Y.; Jiang, B. Atomic Defects in Ultra-Thin Mesoporous TiO2 Enhance Photocatalytic Hydrogen Evolution from Water Splitting. Appl. Surf. Sci. 2020, 513, 145723. [Google Scholar] [CrossRef]
  10. Chen, D.; Cheng, Y.; Zhou, N.; Chen, P.; Wang, Y.; Li, K.; Huo, S.; Cheng, P.; Peng, P.; Zhang, R.; et al. Photocatalytic Degradation of Organic Pollutants Using TiO2-Based Photocatalysts: A Review. J. Clean. Prod. 2020, 268, 121725. [Google Scholar] [CrossRef]
  11. Kreft, S.; Wei, D.; Junge, H.; Beller, M. Recent Advances on TiO2-Based Photocatalytic CO2 Reduction. EnergyChem 2020, 2, 100044. [Google Scholar] [CrossRef]
  12. Zhang, T.; Han, X.; Nguyen, N.T.; Yang, L.; Zhou, X. TiO2-Based Photocatalysts for CO2 Reduction and Solar Fuel Generation. Chin. J. Catal. 2022, 43, 2500–2529. [Google Scholar] [CrossRef]
  13. Thakur, N.; Thakur, N.; Kumar, K. Phytochemically and PVP Stabilized TiO2 Nano spheres for Enhanced Photocatalytic and Antioxidant Efficiency. Mater. Today Commun. 2023, 35, 105587. [Google Scholar] [CrossRef]
  14. Zhang, S.; Zhao, L.; Huang, B.; Li, X. Enhanced Sensing Performance of Au-Decorated TiO2 Nanospheres with Hollow Structure for Formaldehyde Detection at Room Temperature. Sens. Actuators B Chem. 2022, 358, 131465. [Google Scholar] [CrossRef]
  15. Hoang, S.; Guo, Y.; Binder, A.J.; Tang, W.; Wang, S.; Liu, J.; Tran, H.; Lu, X.; Wang, Y.; Ding, Y.; et al. Activating Low-Temperature Diesel Oxidation by Single-Atom Pt on TiO2 Nanowire Array. Nat. Commun. 2020, 11, 1062. [Google Scholar] [CrossRef]
  16. Tshabalala, Z.P.; Mokoena, T.P.; Jozela, M.; Tshilongo, J.; Hillie, T.K.; Swart, H.C.; Motaung, D.E. TiO2 Nanowires for Humidity-Stable Gas Sensors for Toluene and Xylene. ACS Appl. Nano Mater. 2021, 4, 702–716. [Google Scholar] [CrossRef]
  17. Ikreedeegh, R.R.; Hossen, M.A.; Tahir, M.; Aziz, A.A. A Comprehensive Review on Anodic TiO2 Nanotube Arrays (TNTAs) and Their Composite Photocatalysts for Environmental and Energy Applications: Fundamentals, Recent Advances and Applications. Coord. Chem. Rev. 2024, 499, 215495. [Google Scholar] [CrossRef]
  18. Feng, Y.; Rijnaarts, H.H.M.; Yntema, D.; Gong, Z.; Dionysiou, D.D.; Cao, Z.; Miao, S.; Chen, Y.; Ye, Y.; Wang, Y. Applications of Anodized TiO2 Nanotube Arrays on the Removal of Aqueous Contaminants of Emerging Concern: A Review. Water Res. 2020, 186, 116327. [Google Scholar] [CrossRef]
  19. Han, Q.; Wu, C.; Jiao, H.; Xu, R.; Wang, Y.; Xie, J.; Guo, Q.; Tang, J. Rational Design of High-Concentration Ti3+ in Porous Carbon-Doped TiO2 Nanosheets for Efficient Photocatalytic Ammonia Synthesis. Adv. Mater. 2021, 33, 2008180. [Google Scholar] [CrossRef]
  20. Wang, Y.; Zhang, Y.; Zhu, X.; Liu, Y.; Wu, Z. Fluorine-Induced Oxygen Vacancies on TiO2 Nanosheets for Photocatalytic Indoor VOCs Degradation. Appl. Catal. B Environ. 2022, 316, 121610. [Google Scholar] [CrossRef]
  21. Cao, S.; Tao, F.F.; Tang, Y.; Li, Y.; Yu, J. Size-and Shape-Dependent Catalytic Performances of Oxidation and Reduction Reactions on Nanocatalysts. Chem. Soc. Rev. 2016, 45, 4747–4765. [Google Scholar] [CrossRef]
  22. Hwang, Y.J.; Yang, S.; Lee, H. Surface Analysis of N-Doped TiO2 Nanorods and Their Enhanced Photocatalytic Oxidation Activity. Appl. Catal. B Environ. 2017, 204, 209–215. [Google Scholar] [CrossRef]
  23. Tian, J.; Zhao, Z.; Kumar, A.; Boughton, R.I.; Liu, H. Recent Progress in Design, Synthesis, and Applications of One-Dimensional TiO2 Nanostructured Surface Heterostructures: A Review. Chem. Soc. Rev. 2014, 43, 6920–6937. [Google Scholar] [CrossRef]
  24. Bianchi, C.L.; Gatto, S.; Pirola, C.; Naldoni, A.; Di Michele, A.; Cerrato, G.; Crocellà, V.; Capucci, V. Photocatalytic Degradation of Acetone, Acetaldehyde and Toluene in Gas-Phase: Comparison between Nano and Micro-Sized TiO2. Appl. Catal. B Environ. 2014, 146, 123–130. [Google Scholar] [CrossRef]
  25. Tichapondwa, S.M.; Newman, J.P.; Kubheka, O. Effect of TiO2 Phase on the Photocatalytic Degradation of Methylene Blue Dye. Phys. Chem. Earth Parts A/B/C 2020, 118–119, 102900. [Google Scholar] [CrossRef]
  26. Luís, A.M.; Neves, M.C.; Mendonça, M.H.; Monteiro, O.C. Influence of Calcination Parameters on the TiO2 Photocatalytic Properties. Mater. Chem. Phys. 2011, 125, 20–25. [Google Scholar] [CrossRef]
  27. Qian, R.; Zong, H.; Schneider, J.; Zhou, G.; Zhao, T.; Li, Y.; Yang, J.; Bahnemann, D.W.; Pan, J.H. Charge Carrier Trapping, Recombination and Transfer during TiO2 Photocatalysis: An Overview. Catal. Today 2019, 335, 78–90. [Google Scholar] [CrossRef]
  28. Ozawa, K.; Yamamoto, S.; Mase, K.; Matsuda, I. A Surface Science Approach to Unveiling the TiO2 Photocatalytic Mechanism: Correlation between Photocatalytic Activity and Carrier Lifetime. E-J. Surf. Sci. Nanotechnol. 2019, 17, 130–147. [Google Scholar] [CrossRef]
  29. Ge, M.; Cao, C.; Huang, J.; Li, S.; Chen, Z.; Zhang, K.-Q.; Al-Deyab, S.S.; Lai, Y. A Review of One-Dimensional TiO2 Nanostructured Materials for Environmental and Energy Applications. J. Mater. Chem. A 2016, 4, 6772–6801. [Google Scholar] [CrossRef]
  30. Adachi, M.; Murata, Y.; Takao, J.; Jiu, J.; Sakamoto, M.; Wang, F. Highly Efficient Dye-Sensitized Solar Cells with a Titania Thin-Film Electrode Composed of a Network Structure of Single-Crystal-like TiO2 Nanowires Made by the “Oriented Attachment” Mechanism. J. Am. Chem. Soc. 2004, 126, 14943–14949. [Google Scholar] [CrossRef]
  31. Huang, S.; Kilin, D.S. Anatase TiO2 Nanowires, Thin Films, and Surfaces: Ab Initio Studies of Electronic Properties and Non-Adiabatic Excited State Dynamics. MRS Proc. 2014, 1659, 129–134. [Google Scholar] [CrossRef]
  32. Choi, S.K.; Kim, S.; Lim, S.K.; Park, H. Photocatalytic Comparison of TiO2 Nanoparticles and Electrospun TiO2 Nanofibers: Effects of Mesoporosity and Interparticle Charge Transfer. J. Phys. Chem. C 2010, 114, 16475–16480. [Google Scholar] [CrossRef]
  33. Wu, H.B.; Hng, H.H.; Lou, X.W.D. Direct Synthesis of Anatase TiO2 Nanowires with Enhanced Photocatalytic Activity. Adv. Mater. 2012, 24, 2567–2571. [Google Scholar] [CrossRef] [PubMed]
  34. Yoshida, R.; Suzuki, Y.; Yoshikawa, S. Syntheses of TiO2(B) Nanowires and TiO2 Anatase Nanowires by Hydrothermal and Post-Heat Treatments. J. Solid State Chem. 2005, 178, 2179–2185. [Google Scholar] [CrossRef]
  35. Akimoto, J.; Gotoh, Y.; Oosawa, Y.; Nonose, N.; Kumagai, T.; Aoki, K.; Takei, H. Topotactic Oxidation of Ramsdellite-Type Li0.5TiO2, a New Polymorph of Titanium Dioxide: TiO2(R). J. Solid State Chem. 1994, 113, 27–36. [Google Scholar] [CrossRef]
  36. Sun, J.; Wu, J.-M. A Comparative Study on Photocatalytic Activity of Titania Nanowires Subjected to High-Temperature Calcination and Low-Temperature HCl Treatment. Sci. Adv. Mat. 2013, 5, 549–556. [Google Scholar] [CrossRef]
  37. Hardcastle, F.D.; Ishihara, H.; Sharma, R.; Biris, A.S. Photoelectroactivity and Raman Spectroscopy of Anodized Titania (TiO2) Photoactive Water-Splitting Catalysts as a Function of Oxygen-Annealing Temperature. J. Mater. Chem. 2011, 21, 6337–6345. [Google Scholar] [CrossRef]
  38. Makal, P.; Das, D. Self-Doped TiO2 Nanowires in TiO2-B Single Phase, TiO2-B/Anatase and TiO2-Anatase/Rutile Heterojunctions Demonstrating Individual Superiority in Photocatalytic Activity under Visible and UV Light. Applied Surface Science 2018, 455, 1106–1115. [Google Scholar] [CrossRef]
  39. Simmons, E.L. Diffuse Reflectance Spectroscopy: A Comparison of the Theories. Appl. Opt. 1975, 14, 1380–1386. [Google Scholar] [CrossRef]
  40. Elsayed, W.; Abdalla, S.; Seriani, N. Quasiparticle and Optical Properties of Hydrogen Titanate and Its Defective Systems: An Investigation by Density Functional Theory with Hubbard Correction, Many-Body Perturbation Theory, and Bethe–Salpeter Equation. Phys. Status Solidi (b) 2020, 257, 1900054. [Google Scholar] [CrossRef]
  41. Makal, P.; Das, D. Superior Photocatalytic Dye Degradation under Visible Light by Reduced Graphene Oxide Laminated TiO2-B Nanowire Composite. J. Environ. Chem. Eng. 2019, 7, 103358. [Google Scholar] [CrossRef]
  42. Hanaor, D.A.H.; Sorrell, C.C. Review of the Anatase to Rutile Phase Transformation. J. Mater. Sci 2011, 46, 855–874. [Google Scholar] [CrossRef]
  43. López, R.; Gómez, R. Band-Gap Energy Estimation from Diffuse Reflectance Measurements on Sol–Gel and Commercial TiO2: A Comparative Study. J. Sol-Gel Sci. Technol. 2012, 61, 1–7. [Google Scholar] [CrossRef]
  44. Nguyen, T.P.; Nguyen, D.L.T.; Nguyen, V.-H.; Le, T.-H.; Vo, D.-V.N.; Trinh, Q.T.; Bae, S.-R.; Chae, S.Y.; Kim, S.Y.; Le, Q.V. Recent Advances in TiO2-Based Photocatalysts for Reduction of CO2 to Fuels. Nanomaterials 2020, 10, 337. [Google Scholar] [CrossRef]
  45. Wu, N.; Wang, J.; Tafen, D.N.; Wang, H.; Zheng, J.-G.; Lewis, J.P.; Liu, X.; Leonard, S.S.; Manivannan, A. Shape-Enhanced Photocatalytic Activity of Single-Crystalline Anatase TiO2 (101) Nanobelts. J. Am. Chem. Soc. 2010, 132, 6679–6685. [Google Scholar] [CrossRef]
  46. Zaw, Y.Y.; Channei, D.A.D.; Threrujirapapong, T.; Khanitchaidecha, W.; Nakaruk, A. Effect of Anatase/Rutile Phase Ratio on the Photodegradation of Methylene Blue under UV Irradiation. MSF 2020, 998, 78–83. [Google Scholar] [CrossRef]
  47. Su, R.; Bechstein, R.; Sø, L.; Vang, R.T.; Sillassen, M.; Esbjörnsson, B.; Palmqvist, A.; Besenbacher, F. How the Anatase-to-Rutile Ratio Influences the Photoreactivity of TiO2. J. Phys. Chem. C 2011, 115, 24287–24292. [Google Scholar] [CrossRef]
  48. Tan, S.S.; Zou, L.; Hu, E. Kinetic Modelling for Photosynthesis of Hydrogen and Methane through Catalytic Reduction of Carbon Dioxide with Water Vapour. Catal. Today 2008, 131, 125–129. [Google Scholar] [CrossRef]
  49. Zhang, Q.-H.; Han, W.-D.; Hong, Y.-J.; Yu, J.-G. Photocatalytic Reduction of CO2 with H2O on Pt-Loaded TiO2 Catalyst. Catal. Today 2009, 148, 335–340. [Google Scholar] [CrossRef]
  50. Ali, S.; Flores, M.C.; Razzaq, A.; Sorcar, S.; Hiragond, C.B.; Kim, H.R.; Park, Y.H.; Hwang, Y.; Kim, H.S.; Kim, H.; et al. Gas Phase Photocatalytic CO2 Reduction, “A Brief Overview for Benchmarking”. Catalysts 2019, 9, 727. [Google Scholar] [CrossRef]
  51. Wang, Z.; Dong, C.; Tang, X.; Qin, X.; Liu, X.; Peng, M.; Xu, Y.; Song, C.; Zhang, J.; Liang, X.; et al. CO-Tolerant RuNi/TiO2 Catalyst for the Storage and Purification of Crude Hydrogen. Nat. Commun. 2022, 13, 4404. [Google Scholar] [CrossRef] [PubMed]
  52. Vaiano, V.; Sannino, D.; Ciambelli, P. Steam Reduction of CO2 on Pd/TiO2 Catalysts: A Comparison between Thermal and Photocatalytic Reactions. Photochem. Photobiol. Sci. 2015, 14, 550–555. [Google Scholar] [CrossRef] [PubMed]
  53. Chen, Y.-W.; Hsu, Y.-H. Effects of Reaction Temperature on the Photocatalytic Activity of TiO2 with Pd and Cu Cocatalysts. Catalysts 2021, 11, 966. [Google Scholar] [CrossRef]
Figure 1. A photograph of nanowire samples on a titanium substrate (a), the reactor appearance (b) and a diagram of the stand for measuring the photocatalytic activity of the samples (c).
Nanomaterials 14 01370 g001
Figure 2. SEM photo of morphology of TiO2. (a) Commercial P25, TiO2 nanowires; (b) original sample; (c) after annealing at 350 °C; (d) after annealing at 500 °C; (e) after annealing at 700 °C; and (f) after annealing at 900 °C.
Nanomaterials 14 01370 g002
Figure 3. XRD patterns of TiO2 nanowire samples. Phase designation: H—hydrogen titanate, A—anatase, R—rutile, and B—bronze (TiO2-B).
Nanomaterials 14 01370 g003
Figure 4. Results of TEM studies of initially synthesized nanowires: (a) TEM image of nanowires; (b) selected area diffraction pattern (SADP); (c) SADP after 10 min of exposure to high-intensity electron beam; and (d,e) high-resolution TEM (HRTEM) images.
Nanomaterials 14 01370 g004
Figure 5. Selected area diffraction patterns (SADPs) of nanowire samples after temperature treatment: (a) 350 °C; (b) 500 °C; (c) 700 °C; and (d) 900 °C.
Nanomaterials 14 01370 g005
Figure 6. TEM images of samples after temperature treatment: (a) 700 °C at 7k× magnification; (b) 700 °C at 20k× magnification; (c) 900 °C at 20k× magnification; and (d) 900 °C at 1M× magnification.
Nanomaterials 14 01370 g006
Figure 7. TEM images of sample fragments annealed at 700 °C in bright-field mode (a) and dark-field mode in electrons scattered by (101) planes of anatase (b) and (110) planes of rutile (c).
Nanomaterials 14 01370 g007
Figure 8. Raman spectra of TiO2 nanowire samples. Phase designation: H—hydrogen titanate, A—anatase, R—rutile, and B—bronze (TiO2-B).
Nanomaterials 14 01370 g008
Figure 9. Nitrogen adsorption–desorption isotherms at 77 K of TiO2 nanowires without annealing and after annealing at 500 °C.
Nanomaterials 14 01370 g009
Figure 10. Results of Kubelka–Munk theory calculations for TiO2 nanowires.
Nanomaterials 14 01370 g010
Figure 11. SEM images of a TiO2 NW-500 layer formed by the drop method: top (a) and side (b) views.
Nanomaterials 14 01370 g011
Figure 12. Average yield of CO2 photoreduction reaction products for layers of TiO2 NWs annealed at different temperatures and commercial TiO2 P25.
Nanomaterials 14 01370 g012
Figure 13. Average product yield in µmol/(g·h) for TiO2 NW-500.
Nanomaterials 14 01370 g013
Table 1. Values of specific surface area of TiO2 nanowires at different annealing temperatures.
Annealing ModeP25No Annealing350 °C500 °C700 °C900 °C
S, m2/g57.049.039.017.312.33.2
Table 2. Summary of research results.
Annealing Sample DesignationSurface Area, m2/gOptical Band Gap, eVCrystallite Size, nmPhases
No annealingAs-synthesized TiO2 NW49.03.77~12Titanate, amorphous, anatase
350 °CTiO2 NW-35039.03.36~13Amorphous, anatase, bronze, rutile
500 °CTiO2 NW-50017.33.33~16Amorphous, anatase, bronze, rutile
700 °CTiO2 NW-70012.33.28~26Amorphous, anatase, bronze, rutile
900 °CTiO2 NW-9003.23.02~63Anatase, rutile
Disclaimer/Publisher’s Note: The statements, opinions and data contained in all publications are solely those of the individual author(s) and contributor(s) and not of MDPI and/or the editor(s). MDPI and/or the editor(s) disclaim responsibility for any injury to people or property resulting from any ideas, methods, instructions or products referred to in the content.

