Abstract
Titanium dioxide (TiO2) is a prevalent food additive, yet comprehensive data on particle size and dietary exposure are lacking in China. Transmission electron microscopy results revealed that the quantitative proportion of nanoparticles (NPs) in food-additive TiO2 was 37.7%, with a mass fraction of 9.89%. Laboratory test results showed that among the domestic products surveyed, candies excluding gum-based candies contained the highest content of TiO2. Using consumption data from the China Health and Nutrition Survey in 2018, the average dietary exposure for TiO2 and TiO2 NPs in the Chinese population were calculated at 34.84 and 3.44 μg/kg bw/day, respectively. The primary dietary sources were puffed food and powdered drinks. Exposure varied significantly across age and region, with children and Inner Mongolia residents having the highest intake. TiO2 NP exposure showed a negative correlation with age. Despite this, the dietary exposure risk of TiO2 NPs for the Chinese population remains deemed acceptable.
1. Introduction
Titanium dioxide (TiO2) is widely used in various applications, including food, cosmetics, pharmaceuticals, and paints, primarily due to its coloring, photocatalytic, and biocidal properties [1,2]. The European Union refers to food-additive TiO2 as E171. E171 is found in higher concentrations in foods such as chewing gum, candies, and puddings, as it is commonly used as a coating for confectionery products [3,4,5]. Nevertheless, recent years have seen a notable decline in its utilization, partly due to growing concerns regarding its safety [6].
Studies have suggested that nanoparticle (NPs) within TiO2 particles may pose potential risks to human health. The nature and magnitude of the damage caused by TiO2 NPs are influenced by their physical and chemical properties. Additionally, the reactivity and bioavailability of TiO2 NPs are determined by these specific characteristics [7,8]. Oral exposure to E171 can alter the gut microbiota of experimental animals, leading to changes in colon pH, significantly increasing oxidative stress and inflammatory responses [9,10]. Multiple studies have demonstrated that following oral or inhalation exposure to TiO2 NPs, accumulation can occur in vital organs such as the gastrointestinal system, lungs, heart, and liver [11,12]. Furthermore, TiO2 NPs have the potential to induce genotoxic effects including DNA damage or chromosomal instability [13,14,15], as well as cytotoxicity [16]. This is mainly due to the production of reactive oxygen species, which leads to cellular damage, inflammation, genotoxicity, and adverse immune responses [17,18,19,20].
Consequently, regulatory agencies and industries in various nations have actively engaged in assessing and addressing the concerns surrounding the use and safety of TiO2. In 2021, the European Food Safety Authority (EFSA) released a report concluding that TiO2 particles may induce DNA strand breaks and chromosomal damage, although they did not induce gene mutations. Consequently, the use of E171 as a food additive is no longer considered safe, and the sale of foods containing TiO2 is banned in Europe [21]. However, entities such as the Health Canada [22] and the UK Food Standards Agency [23] reviewed related research and found no evidence to suggest that dietary intake of food-grade TiO2 was harmful to human health. Existing domestic research offers limited and outdated data on the systematic assessment of dietary intake of TiO2.
In this study, electron microscopy was utilized to characterize and examine food-additive TiO2 to obtain the percentage of NPs in both quantity and mass. The TiO2 content in various food categories was determined using detection methods compliant with national food safety standards. The study aims to provide the most recent dietary exposure assessment results for TiO2 and TiO2 NPs in the Chinese population with updated consumption survey data. The differences in population characteristics and primary dietary sources were further identified. These findings are crucial for improving the regulatory framework for food-additive TiO2 and prioritizing the protection of high-risk populations.
2. Materials and Methods
2.1. Study Design
This study chose food-additive TiO2 samples available in domestic markets and analyzed particle size using electron microscopy. Statistical software and calculation formulas were employed to determine the numerical percentage and mass fractions of NPs. The TiO2 content in food products sold in various provinces in China was detected using standard laboratory methods. In conjunction with consumption data from the Chinese Resident Food Consumption Survey in 2018, the daily exposure levels of TiO2 in the Chinese population were assessed. The exposure risk of TiO2 NPs was determined by multiplying the mass fraction of NPs. Furthermore, population characteristic differences were used to identify high-risk age groups, genders, and regions. Contribution rates of different food categories were analyzed to confirm the primary dietary sources.
2.2. Particle Size Distributions of Food-Additive TiO2 by Transmission Electron Microscopy (TEM)
TiO2 samples were from two leading companies in China that produce food-additive TiO2: Jiangsu Hushen Titanium White Technology Co., Ltd. (Jiangsu, China) and Tianjin Duofuyuan Industrial Co., Ltd. (Tianjin, China). A total of 10 samples from different production batches of each company were randomly selected. Additionally, a sample was provided by the China National Center for Food Safety Risk Assessment. The sources and batch numbers of the samples are specified in Table S1.
The TiO2 powder was weighed to a precise mass of 10.00 ± 0.25 mg for each sample, followed by its transformation into a TiO2 suspension through ultrasonic treatment. The size and morphology of the particles were characterized using TEM (model HT7700, Hitachi, Japan). TEM images of TiO2 were obtained at parameters of an accelerating voltage of 10.0 kV, a working distance of 500 nm, and a magnification of 20,000. The procedure for the preparation of samples and the detection of particle size for food-additive TiO2 is shown in Supplementary Material S1. The TEM images of maximum and minimum Feret diameters measured in the TiO2 samples are shown in Figure S1.
To determine the quantitative proportions of NPs, the percentage of TiO2 particles with a minimum Feret diameter smaller than 100 nm was calculated from the TEM image for each sample, using the ImageJ 1.53t software. Following the analysis methods for the identification and characterization of NPs in food additives developed by EFSA [24], we further determined the mass fraction of NPs. The short (a-axis) and long axes (c-axis) of the ellipse fitted to the 2D projection of each constituent particle were measured as proxies of their minimum and maximum Feret dimensions, respectively. Assuming that the particles are prolate ellipsoids (a-axis = b-axis < c-axis), the volume (V) of each particle was estimated as:
The mass (M) of each particle was calculated as:
ρ = the calculated bulk density of anatase TiO2 = 3.89 g cm−3 (the crystal type of the TiO2 samples supplied was anatase).
The mass fraction (M%) was given by the following formula:
MNPs is the mass of NPs and MTiO2 is the mass of all TiO2 particles.
2.3. Determination of TiO2 Content by ICP-AES and DMC
Based on National Food Safety Standard—Standard for the Use of Food Additives (GB 2760-2014), we identified the food categories in which TiO2 is used as a food additive. Specific categories surveyed included jams, preserved surface-drying fruit, preserved plum, fried nuts and seeds (TiO2 is used in Chinese and European nut products primarily to enhance visual appeal by providing a bright white color, ensuring uniformity, and protecting against discoloration from light exposure. In China, common fried nuts and seeds include fried peanuts, charcoal roasted cashews, chia-chia melon seeds, etc.), cocoa products, chocolate and chocolate products, gum-based candy, other candies excluding gum-based candies, mayonnaise, salad dressing, powdered drinks (powdered drinks include soy milk powder, protein powder, coffee powder, etc.), jelly, and puffed food (puffed food includes potato chips, French fries, potpourri, shrimp chips, etc.). Corresponding products were chosen at random from markets in various provinces across the country.
The local Centers for Disease Control and Prevention were responsible for testing the levels of TiO2 in food and beverages. The testing methods followed the National Food Safety Standard—Determination of Titanium Dioxide in Food (GB 5009.246-2016), which includes the Inductively Coupled Plasma-Atomic Emission Spectrometry (ICP-AES) method and the Diantipyryl Methane Colorimetry (DMC) method (the natural Ti content in food is extremely low, often below the detection limits of standard laboratory testing instruments. The detectable Ti levels in our tests are primarily due to the addition of food-additive TiO2.). The detection results under both testing methods showed no statistically significant difference. Specific testing methods and details can be found in Supplementary Material S2.
2.4. Dietary Exposure of TiO2 and TiO2 NPs
To assess dietary exposure to TiO2, we utilized the most recent consumption data available, which came from the Chinese Resident Food Consumption Survey in 2018 by the China National Center for Food Safety Risk Assessment. The survey was conducted in 32 urban survey sites in 18 provinces (autonomous regions and municipalities) in China. The target population was the Chinese population aged 3 years and above. A non-consecutive 3-day, 24 h retrospective method was utilized, aiming to collect comprehensive data on the consumption of various food items for each respondent. After excluding participants with missing or anomalous basic information, a total of 13,585 participants were included in the study, with the consumer group comprising 14.1% of the total. Powdered drinks had the highest average consumption, followed by jelly and puffed foods. The distribution of participant characteristics and consumption levels is provided in Tables S2 and S3.
The following equation is used to calculate daily intake of TiO2:
EDIi (mg/kg bw/day) is the estimated daily intake of TiO2 of individual i. Fi,k is the amount of the kth food consumed by individual i which was averaged to grams per day over the 3 recording days (g/day). Ck is the average content of TiO2 in the kth food (mg/g). BWi is the body weight of individual i (kg), and n denotes the number of food categories.
Due to the safety concerns surrounding TiO2 NPs, we estimated the dietary exposure to TiO2 NPs by multiplying the daily intake of TiO2 by the mass fraction of NPs.
At present, there are no established recommended intake levels for food-additive TiO2 in both domestic and international regulations. Therefore, the Margin of Safety (MoS) approach was used to assess the exposure risk of TiO2 and TiO2 NPs [25]. The formula for calculating MoS values is as follows [25]:
MoS is the Margin of Safety, with values ≥ 100 indicating that the dietary risk of food-additive TiO2 is within the acceptable range, while values < 100 indicate that TiO2 poses a dietary risk to human health [26]. NOAEL is the no observed adverse effect level for TiO2, and it was determined to be 1000 mg/kg BW/day based on the results of a reproductive developmental toxicity study [27]. EDI is the dietary exposure to TiO2, and, in this study, the mean and P95 of exposure were used for the calculation.
2.5. Statistical Analysis
The Kruskal–Wallis rank-sum test was employed to analyze differences in daily intake of TiO2 and TiO2 NPs between groups using the mean. Linear regression analysis was used to assess the association between exposure levels and age. The statistical analyses were conducted by R 4.1.3. All statistical tests were 2-tailed, and differences were considered statistically significant when p < 0.05.
3. Results
3.1. Size Distribution of Food-Additive TiO2 and Proportion of TiO2 NPs
As depicted in Figure 1, the TEM images revealed an irregular shape for food-additive TiO2. The TiO2 particles within the size range of 100–125 nm exhibited the highest frequency, comprising 26.0% of the total particle count. Additionally, NPs with a minimum Feret diameter smaller than 100 nm accounted for 37.7%.
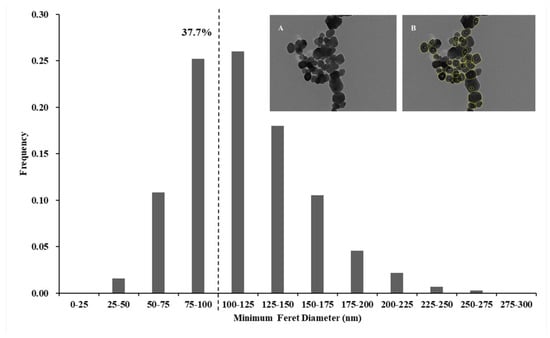
Figure 1.
The frequency histogram of particle size distribution of food-additive TiO2 samples. The quantitative proportion of TiO2 NPs was 37.7%. The TEM images of food-additive TiO2 particles showed the primary particle distribution by TEM (A) and particle size analysis by ImageJ (B) of the TiO2 sample.
The statistical results in Table 1 showed that a total of 7647 particles were counted from 21 food-additive TiO2 samples. The minimum Feret diameters of the particles contained in the 21 samples ranged from 26.8–291.7 nm, with mean values between 103.3–129.1 nm, and an average of 116.4 ± 38.5 nm. The maximum Feret diameters ranged from 33.6–413.6 nm, with mean values between 124.6–159.2 nm, and an average of 143.0 ± 49.8 nm. Based on the mass calculation formula for particles, the estimated mass fraction of nanoparticles was 9.89%.

Table 1.
Statistical results of particle size of food-additive TiO2 samples 1.
3.2. Content Determination of TiO2 in Food Categories
Table 2 presents the content of TiO2 in 11 kinds of food categories detected by ICP-AES and DMC. The highest detection rate of TiO2 was found in fried nuts and seeds (92.37%), while the lowest was in jam (21.74%). Three categories of food exceeded the permissible limits; namely, cocoa products, chocolate and chocolate products (1.87%), mayonnaise, salad dressing (1.85%), and puffed food (0.34%). The highest content was found in other candies excluding gum-based candies. On average, the content of TiO2 measured 186.46 mg/kg, with a median of 0.75 mg/kg. Puffed food emerged as the second highest category, with the average and median values of TiO2 content being 146.01 mg/kg and 0.86 mg/kg, respectively. Following closely were cocoa products, chocolate, and chocolate products, with an average content of 140.52 mg/kg for TiO2.
Table 2.
Content of TiO2 in different food categories 1.
3.3. Dietary Exposure of TiO2 and TiO2 NPs and Differences by Demographic Characteristics
Table 3 shows that the average exposure levels of TiO2 and TiO2 NPs in the total population were 34.84 μg/kg bw/day and 3.44 μg/kg bw/day, respectively. The P95 values were 161.24 μg/kg bw/day for TiO2 and 15.94 μg/kg bw/day for TiO2 NPs.
Table 3.
Dietary exposure of TiO2 and TiO2 NPs by demographic characteristics in the Chinese population (μg/kg bw/day) 1.
Statistically significant differences were observed among distinct age groups (p < 0.001), with the average exposure levels ranking from highest to lowest for children, adolescents, adults, and the elderly. Notably, children displayed the highest intake, with average values of 90.27 μg/kg bw/day for TiO2 and 8.93 μg/kg bw/day for TiO2 NPs. Gender-based exposure comparisons revealed no significant variations (p = 0.846). The daily average intake of males was 33.90 μg/kg bw/day for TiO2 and 3.35 μg/kg bw/day for TiO2 NPs, while for females, the corresponding figures were 35.68 μg/kg bw/day for TiO2 and 3.53 μg/kg bw/day for TiO2 NPs. Furthermore, there were significant variations in intake among different provinces (p < 0.001), with Inner Mongolia exhibiting the highest exposure levels. The average exposure to TiO2 for the Inner Mongolia population was 61.86 μg/kg bw/day, and for TiO2 NPs, it was 6.12 μg/kg bw/day.
Table 4 presents the MoS values for different age groups. Under the NOAEL of 1000 mg/kg bw/day, the calculated lowest MoS was higher than 100, indicating a low safety risk.
Table 4.
MoS values calculated based on the exposure estimated in six population groups 1.
3.4. Age and Regional Distribution and Food Contribution of TiO2 NP Exposure
The relationship between age and TiO2 NP exposure was examined using linear regression analysis. The results indicated that the regression model was statistically significant (p < 0.001). The regression coefficient, which was less than 0, implied a negative correlation between age and TiO2 NP exposure. This suggested that, as age increased, the exposure to TiO2 NPs tended to decrease (Figure 2A). Based on Figure 2B, it was evident that puffed food and powdered drinks were the primary dietary sources of TiO2 NP exposure across various age groups, with contributions ranging from 26.08% to 45.89% for puffed food and 23.81% to 50.82% for powdered drinks. Specifically, for children aged 3-9 years, their main dietary sources included puffed food (45.89%), powdered drinks (23.81%), and jams (14.74%). On the other hand, for adolescents aged 10-17 years, their primary dietary sources were powdered drinks (50.82%), puffed food (26.08%), and fried nuts and seeds (13.55%).
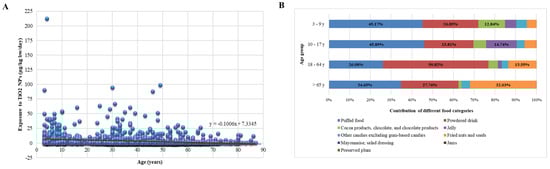
Figure 2.
(A) The scatter plot of age and TiO2 NP exposure in the Chinese population. The linear regression curve equation was given as y = −0.1006x + 7.3345. (B) The contribution of different food categories to TiO2 NP exposure in various age groups. Puffed food and powdered drinks were identified as the primary dietary sources.
Figure 3 displays a heat map of TiO2 NP exposure in China. Participants residing in Inner Mongolia, Jiangsu, and Hebei regions had higher intakes of TiO2 NPs compared to other areas. Among these regions, puffed food contributed the most to TiO2 NP exposure for residents of Inner Mongolia, accounting for 91.16% of the exposure. This was followed by jams (5.68%) and mayonnaise, salad dressing (1.75%).
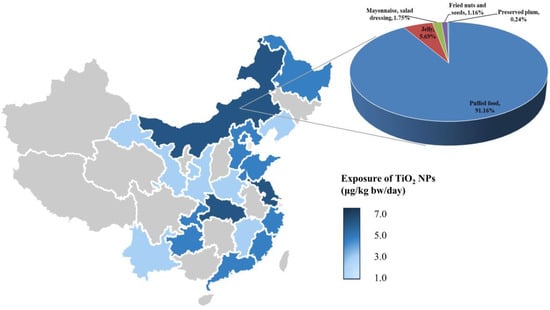
Figure 3.
The heat map of TiO2 NP exposure in China. Deeper shades of blue on the map indicated higher dietary exposure to TiO2 NPs. The pie chart represented the contribution of different food categories to TiO2 NP exposure in the Inner Mongolia region.
4. Discussion
The research findings indicated that in food-additive TiO2, the quantitative proportion and the mass fraction of NPs were 37.7% and 9.89%, respectively. Among products available in the Chinese market, other candies, excluding gum-based candies, had the highest content of TiO2. The average dietary exposure of the Chinese population to TiO2 and TiO2 NPs was 34.84 μg/kg bw/day and 3.44 μg/kg bw/day, respectively. Significant differences in dietary exposure were observed among different age groups and regions (p < 0.001). Specifically, children aged 3–9 years and residents of Inner Mongolia had the highest average dietary intake. Linear regression analysis revealed a significant negative correlation between TiO2 NP exposure and age, with children being at higher dietary exposure risk. The main dietary sources of TiO2 NPs were puffed food and powdered drinks. MoS values indicated the dietary exposure risk of TiO2 NPs for the Chinese population is acceptable.
The content of TiO2 in food or beverages varies among different countries. Domestic research has found the highest concentration of TiO2 in dried fig preserves (3409.3 mg/kg), followed by chewing gum and chocolate beans. The content data were significantly higher than the detection data in this study, possibly due to a bias of the limited number of food items and sample size in the study by He et al. [30]. A survey in Turkey revealed high concentrations of TiO2 in candy products such as almond nougat (2400 mg/kg), cake decorations (2373 mg/kg), and syrups (2008 mg/kg) [26]. In South Korea, ICP testing of titanium-containing candies found higher levels in chocolate, candies, and chewing gum, with the highest levels being 814 mg/kg, 355 mg/kg, and 42 mg/kg, respectively [31]. TiO2 is often used as a whitening agent added to candy coatings, so the TiO2 content in candy products typically remains at relatively high levels [32].
Food-additive TiO2 produced domestically and internationally was observed by TEM for the particle size distribution and the percentage of NPs. The findings of He et al. [30], which detected NPs in food-additive TiO2 in China with quantitative proportion and mass fractions of 34.7% and 10.87%, respectively, were close to the results of our study. The EFSA report in 2016 on the particle size analysis of commercially available TiO2 samples under TEM found that the particle diameter ranged from 80–180 nm, with a median diameter of 113 nm. The mass percentage range of nanoparticles was from 0.0% to 3.2%. Approximately 36% of the particles had a diameter smaller than 100 nm [33]. In the 2022 Australia and New Zealand report, it was mentioned that for E171-E, which had the highest nanoparticle content, the median particle size was 104 nm. Approximately 36–45% of the particles had a diameter less than 100 nm [34]. It can be observed that the quantitative proportion of TiO2 NPs ranges from 34% to 45%, while the mass fraction may be influenced by the particle crystalline structure and its corresponding density.
TiO2 NPs have the potential to accumulate in the body, but their oral bioavailability is low. Following oral ingestion, TiO2 NPs are primarily distributed in the liver, spleen, and lungs [35,36]. Studies conducted by Kreyling et al. [36] involved administering TiO2 NP suspensions to rats via gavage and observed a slow process of TiO2 NP absorption and elimination. Individuals exposed to TiO2 NPs over the long term may experience particle accumulation in specific cells and organs. In the study of TiO2 NPs given by gavage to rats the highest Ti concentration was detected in the liver, followed by the spleen and small intestine. The oral bioavailability was found to be approximately 0.00021% [37]. Furthermore, research by Chaudhry et al. indicated that the accumulation of TiO2 NPs in organs following oral exposure depends on the age of the exposed individuals. Younger individuals have higher intestinal permeability, leading to increased absorption of TiO2 NPs [38].
The daily intake of TiO2 NPs is influenced by food categories and eating habits in different countries, with higher exposure risks for children. A study investigated the intake of TiO2 and its NPs in the Dutch population aged 2 to over 70 years from food, food supplements, and toothpaste. The estimated average intake of TiO2 NPs was 0.19 μg/kg bw/day for the elderly, 0.55 μg/kg bw/day for those aged 7–69, and 2.16 μg/kg bw/day for toddlers. Products contributing most to TiO2 dietary intake included toothpaste (limited to toddlers) and candies [39]. An Italian study found that the daily intake of TiO2 NPs through chewing gum among the European population ranged from 0.28 to 112.40 mg/kg bw/day, with children ingesting more nano-TiO2 than adolescents and adults [40]. In 2016, EFSA estimated the dietary intake of NPs at a mass fraction of 3.2%. In a non-brand-loyal exposure scenario, the average daily exposure for infants, adolescents, adults, and the elderly was 0.01 mg/kg bw/day, while children had a daily exposure of 0.18 mg/kg bw/day. Among these groups, 3–9-year-old children had the highest average exposure, with their main dietary sources being candies, sauces, fine bakery wares, and salads [33]. The reasons for the differences in exposure levels between children and adults may be attributed to two factors. First, products containing high levels of food-additive TiO2, such as candies, cakes, and other sweets, are highly favored by children. Second, children consume more food than adults when measured in kilograms of body weight [41].
However, in this study, the primary dietary sources of TiO2 NP exposure for the Chinese population were found to be puffed food and powdered drinks rather than candies. This difference can be attributed to the food consumption data used in this study. We compared the results of dietary exposure to TiO2 for Chinese residents based on the consumption data of the China Health and Nutrition Survey in 2011. Their results indicated significantly higher exposure levels compared to the results of this study. Moreover, sweet foods (such as sugar, chocolate, and cakes) were identified as the largest contributors to TiO2 NP intake, accounting for at least 65% of the total intake [30]. A study examining snack consumption patterns in the central and western regions of China observed that approximately 40% of primary and middle school students consume puffed food, with nuts, candies, and chocolates following closely [42]. We reasonably speculate that the consumption of sweet foods in China may have decreased in recent years, while the consumption of puffed food and nut-based products has gradually increased.
Although this study tested a wide range of food categories where the addition of TiO2 is permitted in China and conducted the latest dietary exposure assessment, there are still some limitations to consider. First, the study did not take into account TiO2 in food supplements or food packaging materials. However, the impact of such sources is likely to be minimal due to low concentrations and low consumption populations. Secondly, other exposure routes such as dermal exposure and inhalation were not included in the analysis, despite the widespread use of TiO2 in cosmetics, personal care products, and other applications. Once the toxic effects and safety limits of TiO2 NPs are determined, a multi-route risk assessment will be necessary. Lastly, for the assessment of TiO2 intake in the Chinese population, it is important to incorporate updated consumption survey data. This will enable real-time monitoring of exposure dynamics and facilitate timely implementation of population intervention measures and regulation of TiO2 as a food additive.
5. Conclusions
The study represents the first comprehensive assessment of various food categories permitted to be added with TiO2 in the Chinese domestic market, providing the latest exposure assessment for TiO2 and its NPs in the Chinese population. The highest content of TiO2 was found in other candies excluding gum-based candies. Based on the mass fraction of NPs in food-additive TiO2 (9.89%), the estimated average dietary exposure for TiO2 and TiO2 NPs in the Chinese population was 34.84 μg/kg bw/day and 3.44 μg/kg bw/day, respectively. Children aged 3–9 years and residents of Inner Mongolia face the highest exposure risks. However, the estimated intake of TiO2 NPs in this study was far below the levels that could potentially cause harm.
Supplementary Materials
The following supporting information can be downloaded at: https://www.mdpi.com/article/10.3390/nano14171427/s1, Table S1. Sources and weighing of food additive TiO2 samples. Figure S1. Maximum and minimum Feret diameters measured on TiO2 samples under TEM. The particle size of each particle was determined by ImageJ 1.53t software. Table S2. Number and percentage of Chinese consumers by demographic characteristics in 2018. Table S3. Consumption of different food categories in Chinese consumers in 2018 (g/day) 1.
Author Contributions
Methodology, Y.C., T.O., L.Y., X.X., H.S., D.J. and Z.L.; Software, Y.C.; Investigation, Y.C., H.W., C.L. and Q.L.; Resources, H.W., C.L. and Q.L.; Data curation, Y.C.; Writing—original draft, Y.C.; Writing—review & editing, Y.S. and S.W.; Project administration, Y.S.; Funding acquisition, Y.S. All authors have read and agreed to the published version of the manuscript.
Funding
This research was funded by [Risk Assessment Project of Dietary Intake of Titanium Dioxide in China] grant number [No. 2024-C05].
Data Availability Statement
Data is contained within the article.
Conflicts of Interest
The authors declare no conflict of interest.
References
- Geiss, O.; Ponti, J.; Senaldi, C.; Bianchi, I.; Mehn, D.; Barrero, J.; Gilliland, D.; Matissek, R.; Anklam, E. Characterisation of food grade titania with respect to nanoparticle content in pristine additives and in their related food products. Food Addit. Contam. Part. A Chem. Anal. Control Expo. Risk Assess. 2020, 37, 239–253. [Google Scholar] [CrossRef]
- Ropers, M.-H.; Terrisse, H.; Mercier-Bonin, M.; Humbert, B. Titanium Dioxide as Food Additive. Appl. Titan. Dioxide 2017, 10. [Google Scholar] [CrossRef]
- Dudefoi, W.; Moniz, K.; Allen-Vercoe, E.; Ropers, M.H.; Walker, V.K. Impact of food grade and nano-TiO(2) particles on a human intestinal community. Food Chem. Toxicol. 2017, 106, 242–249. [Google Scholar] [CrossRef] [PubMed]
- Peters, R.J.; van Bemmel, G.; Herrera-Rivera, Z.; Helsper, H.P.; Marvin, H.J.; Weigel, S.; Tromp, P.C.; Oomen, A.G.; Rietveld, A.G.; Bouwmeester, H. Characterization of titanium dioxide nanoparticles in food products: Analytical methods to define nanoparticles. J. Agric. Food Chem. 2014, 62, 6285–6293. [Google Scholar] [CrossRef] [PubMed]
- Bachler, G.; von Goetz, N.; Hungerbuhler, K. Using physiologically based pharmacokinetic (PBPK) modeling for dietary risk assessment of titanium dioxide (TiO2) nanoparticles. Nanotoxicology 2015, 9, 373–380. [Google Scholar] [CrossRef]
- Boutillier, S.; Fourmentin, S.; Laperche, B. History of titanium dioxide regulation as a food additive: A review. Environ. Chem. Lett. 2022, 20, 1017–1033. [Google Scholar] [CrossRef]
- Baranowska-Wojcik, E.; Szwajgier, D.; Oleszczuk, P.; Winiarska-Mieczan, A. Effects of Titanium Dioxide Nanoparticles Exposure on Human Health-a Review. Biol. Trace Elem. Res. 2020, 193, 118–129. [Google Scholar] [CrossRef]
- Shabbir, S.; Kulyar, M.F.; Bhutta, Z.A.; Boruah, P.; Asif, M. Toxicological Consequences of Titanium Dioxide Nanoparticles (TiO(2)NPs) and Their Jeopardy to Human Population. Bionanoscience 2021, 11, 621–632. [Google Scholar] [CrossRef]
- Chen, Z.; Zhou, D.; Han, S.; Zhou, S.; Jia, G. Hepatotoxicity and the role of the gut-liver axis in rats after oral administration of titanium dioxide nanoparticles. Part. Fibre Toxicol. 2019, 16, 48. [Google Scholar] [CrossRef]
- Talamini, L.; Gimondi, S.; Violatto, M.B.; Fiordaliso, F.; Pedica, F.; Tran, N.L.; Sitia, G.; Aureli, F.; Raggi, A.; Nelissen, I.; et al. Repeated administration of the food additive E171 to mice results in accumulation in intestine and liver and promotes an inflammatory status. Nanotoxicology 2019, 13, 1087–1101. [Google Scholar] [CrossRef]
- Bahadar, H.; Maqbool, F.; Niaz, K.; Abdollahi, M. Toxicity of Nanoparticles and an Overview of Current Experimental Models. Iran. Biomed. J. 2016, 20, 1–11. [Google Scholar] [CrossRef] [PubMed]
- Faddah, L.M.; Baky, N.A.A.; Al-Rasheed, N.M.; Al-Rasheed, N.M. Biochemical responses of nanosize titanium dioxide in the heart of rats following administration of idepenone and quercetin. Afr. J. Pharm. Pharmacol. 2013, 7, 2639–2651. [Google Scholar] [CrossRef]
- Shi, J.; Han, S.; Zhang, J.; Liu, Y.; Chen, Z.; Jia, G. Advances in genotoxicity of titanium dioxide nanoparticles in vivo and in vitro. NanoImpact 2022, 25, 100377. [Google Scholar] [CrossRef] [PubMed]
- Ling, C.; An, H.; Li, L.; Wang, J.; Lu, T.; Wang, H.; Hu, Y.; Song, G.; Liu, S. Genotoxicity Evaluation of Titanium Dioxide Nanoparticles In Vitro: A Systematic Review of the Literature and Meta-analysis. Biol. Trace Elem. Res. 2021, 199, 2057–2076. [Google Scholar] [CrossRef]
- Cao, Y.; Chen, J.; Bian, Q.; Ning, J.; Yong, L.; Ou, T.; Song, Y.; Wei, S. Genotoxicity Evaluation of Titanium Dioxide Nanoparticles In Vivo and In Vitro: A Meta-Analysis. Toxics 2023, 11, 882. [Google Scholar] [CrossRef]
- Ferrante, M.; Grasso, A.; Salemi, R.; Libra, M.; Tomasello, B.; Fiore, M.; Copat, C. DNA Damage and Apoptosis as In-Vitro Effect Biomarkers of Titanium Dioxide Nanoparticles (TiO(2)-NPs) and the Food Additive E171 Toxicity in Colon Cancer Cells: HCT-116 and Caco-2. Int. J. Environ. Res. Public Health 2023, 20, 2002. [Google Scholar] [CrossRef]
- Hou, J.; Wang, L.; Wang, C.; Zhang, S.; Liu, H.; Li, S.; Wang, X. Toxicity and mechanisms of action of titanium dioxide nanoparticles in living organisms. J. Environ. Sci. 2019, 75, 40–53. [Google Scholar] [CrossRef]
- Ghanbary, F.; Seydi, E.; Naserzadeh, P.; Salimi, A. Toxicity of nanotitanium dioxide (TiO(2)-NP) on human monocytes and their mitochondria. Environ. Sci. Pollut. Res. Int. 2018, 25, 6739–6750. [Google Scholar] [CrossRef]
- Jain, A.K.; Senapati, V.A.; Singh, D.; Dubey, K.; Maurya, R.; Pandey, A.K. Impact of anatase titanium dioxide nanoparticles on mutagenic and genotoxic response in Chinese hamster lung fibroblast cells (V-79): The role of cellular uptake. Food Chem. Toxicol. 2017, 105, 127–139. [Google Scholar] [CrossRef]
- Proquin, H.; Rodriguez-Ibarra, C.; Moonen, C.G.; Urrutia Ortega, I.M.; Briede, J.J.; de Kok, T.M.; van Loveren, H.; Chirino, Y.I. Titanium dioxide food additive (E171) induces ROS formation and genotoxicity: Contribution of micro and nano-sized fractions. Mutagenesis 2017, 32, 139–149. [Google Scholar] [CrossRef]
- EFSA Panel on Food Additives and Flavourings (FAF); Younes, M.; Aquilina, G.; Castle, L.; Engel, K.H.; Fowler, P.; Frutos Fernandez, M.J.; Furst, P.; Gundert-Remy, U.; Gürtler, R.; et al. Safety assessment of titanium dioxide (E171) as a food additive. EFSA J. 2021, 19, e06585. [Google Scholar] [CrossRef] [PubMed]
- Health Canada. Titanium Dioxide (TiO2) as a Food Additive: Current Science Report; Health Canada: Ottawa, CA, Canada, 2022; Available online: https://www.canada.ca/en/health-canada/services/food-nutrition/reports-publications/titanium-dioxide-food-additive-science-report.html (accessed on 1 June 2023).
- Committee on Toxicity (COT). Interim Position Paper on Titanium Dioxide. 2021. Available online: https://cot.food.gov.uk/sites/default/files/2022-01/TiO2%20COT%20Interim%20position%20paper.pdf (accessed on 1 June 2023).
- Verleysen, E.; Waegeneers, N.; Vos, S.; Brassinne, F.; Ledecq, M.; Steen, F.; Andjelkovic, M.; Janssens, R.; Mathioudaki, S.; Delfosse, L.; et al. Physicochemical characterization of nanoparticles in food additives in the context of risk identification. EFSA Support. Publ. 2021, 18, 6678E. [Google Scholar] [CrossRef]
- FSA Panel on Food Contact Material, Enzymes, Flavourings and Processing Aids (CEF). Statement on the Safety Evaluation of Smoke Flavourings Primary Products: Interpretation of the Margin of Safety. EFSA J. 2010, 8, 1325. [Google Scholar] [CrossRef]
- Sungur, S.; Kaya, P.; Koroglu, M. Determination of titanium dioxide nanoparticles used in various foods. Food Addit. Contam. Part. B Surveill. 2020, 13, 260–267. [Google Scholar] [CrossRef] [PubMed]
- Warheit, D.B.; Boatman, R.; Brown, S.C. Developmental toxicity studies with 6 forms of titanium dioxide test materials (3 pigment-different grade & 3 nanoscale) demonstrate an absence of effects in orally-exposed rats. Regul. Toxicol. Pharmacol. 2015, 73, 887–896. [Google Scholar] [CrossRef] [PubMed]
- GEMS/Food-EUROS. Reliable Evaluation of Low-Level Contamination of Food. In Proceedings of the Second Workshop, GEM/Food-EUROS, Kulmbach, Germany, 26–27 May 1995. [Google Scholar]
- EFSA Panel on Food Contact Material, Enzymes, Flavourings and Processing Aids. Management of left-censored data in dietary exposure assessment of chemical substances. EFSA J. 2010, 8, 1–1325. [Google Scholar]
- He, L.; Wang, H.; Duan, S.; Gao, Y.; Lyu, L.; Ou, X.; Yu, N.; Zhang, Y.; Zheng, L.; Wang, Y. Characterization of titanium dioxide nanoparticles in confectionary products and estimation of dietary exposure level among the Chinese population. NanoImpact 2022, 28, 100435. [Google Scholar] [CrossRef]
- Kim, N.; Kim, C.; Jung, S.; Park, Y.; Lee, Y.; Jo, J.; Hong, M.; Lee, S.; Oh, Y.; Jung, K. Determination and identification of titanium dioxide nanoparticles in confectionery foods, marketed in South Korea, using inductively coupled plasma optical emission spectrometry and transmission electron microscopy. Food Addit. Contam. Part A Chem. Anal. Control Expo. Risk Assess. 2018, 35, 1238–1246. [Google Scholar] [CrossRef]
- Espada-Bernabe, E.; Moreno-Martin, G.; Gomez-Gomez, B.; Madrid, Y. Assesing the behaviour of particulate/nanoparticulate form of E171 (TiO(2)) food additive in colored chocolate candies before and after in vitro oral ingestion by spICP-MS, TEM and cellular in vitro models. Food Chem. 2023, 432, 137201. [Google Scholar] [CrossRef]
- EFSA Panel on Food Additives and Nutrient Sources added to Food. Re-evaluation of titanium dioxide (E 171) as a food additive. EFSA J. 2016, 14, 1–4545. [Google Scholar]
- Food Standards Australia New Zealand (FSANZ). Titanium Dioxide as a Food Additive; Food Standards Australia New Zealand: Canberra, Australia, 2022; pp. 1–30. [Google Scholar]
- Meena, R.; Kajal, K.; R, P. Cytotoxic and genotoxic effects of titanium dioxide nanoparticles in testicular cells of male wistar rat. Appl. Biochem. Biotechnol. 2015, 175, 825–840. [Google Scholar] [CrossRef]
- Kreyling, W.G.; Holzwarth, U.; Schleh, C.; Kozempel, J.; Wenk, A.; Haberl, N.; Hirn, S.; Schaffler, M.; Lipka, J.; Semmler-Behnke, M.; et al. Quantitative biokinetics of titanium dioxide nanoparticles after oral application in rats: Part 2. Nanotoxicology 2017, 11, 443–453. [Google Scholar] [CrossRef] [PubMed]
- Hendrickson, O.; Pridvorova, S.; Zherdev, A.; Klochkov, S.; Novikova, O.; Shevtsova, E.; Bachurin, S.; Dzantiev, B. Size-Dependent Differences in Biodistribution of Titanium Dioxide Nanoparticles After Sub-Acute Intragastric Administrations to Rats. Curr. Nanosci. 2016, 12, 228–236. [Google Scholar] [CrossRef][Green Version]
- Arnout, F.; Frewer, L.; Bennett, D.; Morris, V.; Smolander, M.; Kampers, F.; Bouwmeester, H.; Gergely, A.; Bowman, D.; Tran, L. Nanotechnologies in Food; Chaudhry, Q., Castle, L., Watkins, R., O’Brien, P., Craighead, H., Kroto, H., Eds.; Royal Society of Chemistry: Cambridge, UK, 2010; p. 244. [Google Scholar] [CrossRef]
- Rompelberg, C.; Heringa, M.B.; van Donkersgoed, G.; Drijvers, J.; Roos, A.; Westenbrink, S.; Peters, R.; van Bemmel, G.; Brand, W.; Oomen, A.G. Oral intake of added titanium dioxide and its nanofraction from food products, food supplements and toothpaste by the Dutch population. Nanotoxicology 2016, 10, 1404–1414. [Google Scholar] [CrossRef] [PubMed]
- Fiordaliso, F.; Foray, C.; Salio, M.; Salmona, M.; Diomede, L. Realistic Evaluation of Titanium Dioxide Nanoparticle Exposure in Chewing Gum. J. Agric. Food Chem. 2018, 66, 6860–6868. [Google Scholar] [CrossRef] [PubMed]
- Cornu, R.; Beduneau, A.; Martin, H. Ingestion of titanium dioxide nanoparticles: A definite health risk for consumers and their progeny. Arch. Toxicol. 2022, 96, 2655–2686. [Google Scholar] [CrossRef]
- Bi, X.; Li, L.; Yang, T.; Xu, P.; Cao, W.; Xu, J.; Gan, Q.; Pan, H.; Hu, X.; Zhang, Q. Snack consumption and the infuencing factors of students participation in the Nutrition lmprovement Program for Rural Compulsory Education in 2019. Chin. J. Sch. Health 2021, 42, 329–333. (In Chinese) [Google Scholar] [CrossRef]


Disclaimer/Publisher’s Note: The statements, opinions and data contained in all publications are solely those of the individual author(s) and contributor(s) and not of MDPI and/or the editor(s). MDPI and/or the editor(s) disclaim responsibility for any injury to people or property resulting from any ideas, methods, instructions or products referred to in the content. |
© 2024 by the authors. Licensee MDPI, Basel, Switzerland. This article is an open access article distributed under the terms and conditions of the Creative Commons Attribution (CC BY) license (https://creativecommons.org/licenses/by/4.0/).