
Conversion of Ultrasmall Glutathione-Coated Silver Nanoparticles during Dispersion in Water into Ultrasmall Silver Sulfide Nanoparticles

 , , , ,
  , and
, and
Abstract
1. Introduction
2. Materials and Methods
2.1. Chemicals and Reagents
2.2. Methods
2.3. Synthesis of Silver Nanoparticles
2.4. MTT Tests of Nanoparticles with HeLa Cells
2.5. Antibacterial Tests of Nanoparticles with Staphylococcus xylosus and Escherichia coli
3. Results
4. Conclusions
Supplementary Materials
Author Contributions
Funding
Data Availability Statement
Acknowledgments
Conflicts of Interest
References
- Du, X.S.; Jin, R.C. Atomic-precision engineering of metal nanoclusters. Dalton Trans. 2020, 49, 10701–10707. [Google Scholar] [CrossRef] [PubMed]
- Yang, J.; Jin, R.C. New advances in atomically precise silver nanoclusters. ACS Mater. Lett. 2019, 1, 482–489. [Google Scholar] [CrossRef]
- Perala, S.R.K.; Kumar, S. On the mechanism of metal nanoparticle synthesis in the Brust–Schiffrin method. Langmuir 2013, 29, 9863–9873. [Google Scholar] [CrossRef] [PubMed]
- Liz-Marzan, L.M. Gold nanoparticle research before and after the Brust–Schiffrin method. Chem. Commun. 2013, 49, 16–18. [Google Scholar] [CrossRef]
- Epple, M.; Rotello, V.M.; Dawson, K. The why and how of ultrasmall nanoparticles. Acc. Chem. Res. 2023, 56, 3369–3378. [Google Scholar] [CrossRef]
- Zarschler, K.; Rocks, L.; Licciardello, N.; Boselli, L.; Polo, E.; Garcia, K.P.; De Cola, L.; Stephan, H.; Dawson, K.A. Ultrasmall inorganic nanoparticles: State-of-the-art and perspectives for biomedical applications. Nanomedicine 2016, 12, 1663–1701. [Google Scholar] [CrossRef]
- Wagner, L.S.; Prymak, O.; Schaller, T.; Beuck, C.; Loza, K.; Niemeyer, F.; Gumbiowski, N.; Kostka, K.; Bayer, P.; Heggen, M.; et al. The molecular footprint of peptides on the surface of ultrasmall gold nanoparticles (2 nm) is governed by steric demand. J. Phys. Chem. B 2024, 128, 4266–4281. [Google Scholar] [CrossRef]
- Liu, Z.H.; Wu, Z.N.; Yao, Q.F.; Cao, Y.T.; Chai, O.J.H.; Xie, J.P. Correlations between the fundamentals and applications of ultrasmall metal nanoclusters: Recent advances in catalysis and biomedical applications. Nano Today 2021, 36, 101053. [Google Scholar] [CrossRef]
- Du, Y.; Sheng, H.; Astruc, D.; Zhu, M. Atomically precise noble metal nanoclusters as efficient catalysts: A bridge between structure and properties. Chem. Rev. 2020, 120, 526–622. [Google Scholar] [CrossRef]
- Rodrigues, T.S.; da Silva, A.G.M.; Camargo, P.H.C. Nanocatalysis by noble metal nanoparticles: Controlled synthesis for the optimization and understanding of activities. J. Mater. Chem. A 2019, 7, 5857–5874. [Google Scholar] [CrossRef]
- Zhao, J.B.; Jin, R.C. Heterogeneous catalysis by gold and gold-based bimetal nanoclusters. Nano Today 2018, 18, 86–102. [Google Scholar] [CrossRef]
- Draviana, H.T.; Fitriannisa, I.; Khafid, M.; Krisnawati, D.I.; Widodo; Lai, C.H.; Fan, Y.J.; Kuo, T.R. Size and charge effects of metal nanoclusters on antibacterial mechanisms. J. Nanobiotechnol. 2023, 21, 428. [Google Scholar] [CrossRef]
- Zheng, K.Y.; Yuan, X.; Goswami, N.; Zhang, Q.B.; Xie, J.P. Recent advances in the synthesis, characterization, and biomedical applications of ultrasmall thiolated silver nanoclusters. RSC Adv. 2014, 4, 60581–60596. [Google Scholar] [CrossRef]
- Jin, J.C.; Wu, X.J.; Xu, J.; Wang, B.B.; Jiang, F.L.; Liu, Y. Ultrasmall silver nanoclusters: Highly efficient antibacterial activity and their mechanisms. Biomater. Sci. 2017, 5, 247–257. [Google Scholar] [CrossRef] [PubMed]
- Lopez, P.; Lara, H.H.; Mullins, S.M.; Black, D.M.; Ramsower, H.M.; Alvarez, M.M.; Williams, T.L.; Lopez-Lozano, X.; Weissker, H.C.; Garcia, A.P.; et al. Tetrahedral (T) closed-shell cluster of 29 silver atoms & 12 lipoate ligands, Ag29[R-alpha-LA)12](3-): Antibacterial and antifungal activity. ACS Appl. Nano Mater. 2018, 1, 1595–1602. [Google Scholar]
- Wolff, N.; Loza, K.; Heggen, M.; Schaller, T.; Niemeyer, F.; Bayer, P.; Beuck, C.; Oliveira, C.L.P.; Prymak, O.; Weidenthaler, C.; et al. Ultrastructure and surface composition of glutathione-terminated ultrasmall silver, gold, platinum, and alloyed silver–platinum nanoparticles (2 nm). Inorg. Chem. 2023, 62, 17470–17485. [Google Scholar] [CrossRef] [PubMed]
- Wetzel, O.; Prymak, O.; Loza, K.; Gumbiowski, N.; Heggen, M.; Bayer, P.; Beuck, C.; Weidenthaler, C.; Epple, M. Water-based synthesis of ultrasmall nanoparticles of platinum group metal oxides (1.8 nm). Inorg. Chem. 2022, 61, 5133–5147. [Google Scholar] [CrossRef]
- Wolff, N.; Beuck, C.; Schaller, T.; Epple, M. Possibilities and limitations of solution-state NMR spectroscopy to analyze the ligand shell of ultrasmall metal nanoparticles. Nanoscale Adv. 2024, 6, 3285–3298. [Google Scholar] [CrossRef]
- Marbella, L.E.; Millstone, J.E. NMR techniques for noble metal nanoparticles. Chem. Mater. 2015, 27, 2721–2739. [Google Scholar] [CrossRef]
- Salassa, G.; Burgi, T. NMR spectroscopy: A potent tool for studying monolayer-protected metal nanoclusters. Nanoscale Horiz. 2018, 3, 457–463. [Google Scholar] [CrossRef]
- Fan, M.; Han, Y.; Gao, S.T.; Yan, H.Y.; Cao, L.Z.; Li, Z.H.; Liang, X.J.; Zhang, J.C. Ultrasmall gold nanoparticles in cancer diagnosis and therapy. Theranostics 2020, 10, 4944–4957. [Google Scholar] [CrossRef] [PubMed]
- Zeng, C.J. Precision at the nanoscale: On the structure and property evolution of gold nanoclusters. Pure Appl. Chem. 2018, 90, 1409–1427. [Google Scholar] [CrossRef]
- Jin, R.; Zeng, C.; Zhou, M.; Chen, Y. Atomically precise colloidal metal nanoclusters and nanoparticles: Fundamentals and opportunities. Chem. Rev. 2016, 116, 10346–10413. [Google Scholar] [CrossRef]
- Kim, N.H.; Hackett, M.J.; Park, J.; Hyeon, T. Synthesis, characterization, and application of ultrasmall nanoparticles. Chem. Mater. 2014, 26, 59–71. [Google Scholar] [CrossRef]
- Zhou, M.; Du, X.; Wang, H.; Jin, R. The critical number of gold atoms for a metallic state nanocluster: Resolving a decades-long question. ACS Nano 2021, 15, 13980–13992. [Google Scholar] [CrossRef]
- Srinivasulu, Y.G.; Yao, Q.F.; Goswami, N.; Xie, J.P. Interfacial engineering of gold nanoclusters for biomedical applications. Mater. Horiz. 2020, 7, 2596–2618. [Google Scholar] [CrossRef]
- Sakthivel, N.A.; Dass, A. Aromatic thiolate-protected series of gold nanomolecules and a contrary structural trend in size evolution. Acc. Chem. Res. 2018, 51, 1774–1783. [Google Scholar] [CrossRef]
- Häkkinen, H. The gold–sulfur interface at the nanoscale. Nat. Chem. 2012, 4, 443–455. [Google Scholar] [CrossRef]
- Egerton, R.F.; Li, P.; Malac, M. Radiation damage in the TEM and SEM. Micron 2004, 35, 399–409. [Google Scholar] [CrossRef]
- Vogt, C.; Meirer, F.; Monai, M.; Groeneveld, E.; Ferri, D.; van Santen, R.A.; Nachtegaal, M.; Unocic, R.R.; Frenkel, A.I.; Weckhuysen, B.M. Dynamic restructuring of supported metal nanoparticles and its implications for structure insensitive catalysis. Nat. Commun. 2021, 12, 7096. [Google Scholar] [CrossRef]
- Zhang, J.; My Pham, T.H.; Gao, Z.; Li, M.; Ko, Y.; Lombardo, L.; Zhao, W.; Luo, W.; Züttel, A. Electrochemical CO2 reduction over copper phthalocyanine derived catalysts with enhanced selectivity for multicarbon products. ACS Catal. 2023, 13, 9326–9335. [Google Scholar] [CrossRef]
- Hammersley, A.P. FIT2D: A multi-purpose data reduction, analysis and visualization program. J. Appl. Crystallogr. 2016, 49, 646–652. [Google Scholar] [CrossRef]
- Oliveira, C.L.P.; Vorup-Jensen, T.; Andersen, C.B.F.; Andersen, G.R.; Pedersen, J.S. Discovering new features of protein complexes structures by small-angle X-ray scattering. In Applications of Synchrotron Light to Scattering and Diffraction in Materials and Life Sciences; Gomez, M., Nogales, A., Garcia-Gutierrez, M.C., Ezquerra, T.A., Eds.; Springer: Berlin/Heidelberg, Germany, 2009; pp. 231–244. [Google Scholar]
- Teixeira, J. Small-angle scattering by fractal systems. J. Appl. Crystallogr. 1988, 21, 781–785. [Google Scholar] [CrossRef]
- Brust, M.; Fink, J.; Bethell, D.; Schiffrin, D.J.; Kiely, C. Synthesis and reactions of functionalised gold nanoparticles. Chem. Commun. 1995, 16, 1655–1656. [Google Scholar] [CrossRef]
- Brust, M.; Walker, M.; Bethell, D.; Schiffrin, D.J.; Whyman, R. Synthesis of thiol-derivatised gold nanoparticles in a two-phase liquid-liquid system. Chem. Commun. 1994, 7, 801–802. [Google Scholar] [CrossRef]
- Wolff, N.; Białas, N.; Loza, K.; Heggen, M.; Schaller, T.; Niemeyer, F.; Weidenthaler, C.; Beuck, C.; Bayer, P.; Prymak, O.; et al. Increased cytotoxicity of bimetallic ultrasmall silver–platinum nanoparticles (2 nm) on cells and bacteria in comparison to silver nanoparticles of the same size. Materials 2024, 17, 3702. [Google Scholar] [CrossRef]
- Yang, T.Q.; Peng, B.; Shan, B.Q.; Zong, Y.X.; Jiang, J.G.; Wu, P.; Zhang, K. Origin of the photoluminescence of metal nanoclusters: From metal-centered emission to ligand-centered emission. Nanomaterials 2020, 10, 261. [Google Scholar] [CrossRef]
- Zheng, J.; Nicovich, P.R.; Dickson, R.M. Highly fluorescent noble-metal quantum dots. Ann. Rev. Phys. Chem. 2007, 58, 409–431. [Google Scholar] [CrossRef]
- Udaya Bhaskara Rao, T.; Pradeep, T. Luminescent Ag7 and Ag8 clusters by interfacial synthesis. Angew. Chem. Int. Ed. 2010, 49, 3925–3929. [Google Scholar] [CrossRef]
- Richards, C.I.; Choi, S.; Hsiang, J.C.; Antoku, Y.; Vosch, T.; Bongiorno, A.; Tzeng, Y.L.; Dickson, R.M. Oligonucleotide-stabilized Ag nanocluster fluorophores. J. Am. Chem. Soc. 2008, 130, 5038–5039. [Google Scholar] [CrossRef]
- Wang, Z.; Gupta, R.K.; Luo, G.G.; Sun, D. Recent progress in inorganic anions templated silver nanoclusters: Synthesis, structures and properties. Chem. Record 2020, 20, 389–402. [Google Scholar] [CrossRef] [PubMed]
- Udayabhaskararao, T.; Bootharaju, M.S.; Pradeep, T. Thiolate-protected Ag32 clusters: Mass spectral studies of composition and insights into the Ag–thiolate structure from NMR. Nanoscale 2013, 5, 9404–9411. [Google Scholar] [CrossRef] [PubMed]
- Bertorelle, F.; Hamouda, R.; Rayane, D.; Broyer, M.; Antoine, R.; Dugourd, P.; Gell, L.; Kulesza, A.; Mitric, R.; Bonacic-Koutecky, V. Synthesis, characterization and optical properties of low nuclearity liganded silver clusters: Ag31(SG)19 and Ag15(SG)11. Nanoscale 2013, 5, 5637–5643. [Google Scholar] [CrossRef]
- Ramsay, H.; Simon, D.; Steele, E.; Hebert, A.; Oleschuk, R.D.; Stamplecoskie, K.G. The power of fluorescence excitation–emission matrix (EEM) spectroscopy in the identification and characterization of complex mixtures of fluorescent silver clusters. RSC Adv. 2018, 8, 42080–42086. [Google Scholar] [CrossRef] [PubMed]
- Desireddy, A.; Kumar, S.; Guo, J.S.; Bolan, M.D.; Griffith, W.P.; Bigioni, T.P. Temporal stability of magic-number metal clusters: Beyond the shell closing model. Nanoscale 2013, 5, 2036–2044. [Google Scholar] [CrossRef] [PubMed]
- Ashenfelter, B.A.; Desireddy, A.; Yau, S.H.; Goodson, T.; Bigioni, T.P. Fluorescence from molecular silver nanoparticles. J. Phys. Chem. C 2015, 119, 20728–20734. [Google Scholar] [CrossRef]
- Zaker, Y.; Ashenfelter, B.A.; Bhattarai, B.; Diemler, N.A.; Brewer, T.R.; Bigioni, T.P. Sequential growth as a mechanism of silver-glutathione monolayer-protected cluster formation. Small 2021, 17, 2002238. [Google Scholar] [CrossRef]
- Zaker, Y.; Bhattarai, B.; Brewer, T.R.; Bigioni, T.P. The role of oxidation during the synthesis of silver-glutathione monolayer-protected clusters. Small 2021, 17, 2005663. [Google Scholar] [CrossRef]
- Remya, K.P.; Udayabhaskararao, T.; Pradeep, T. Low-Temperature thermal dissociation of Ag quantum clusters in solution and formation of monodisperse Ag2S nanoparticles. J. Phys. Chem. C 2012, 116, 26019–26026. [Google Scholar] [CrossRef]
- Xu, H.; Suslick, K.S. Water-soluble fluorescent silver nanoclusters. Adv. Mater. 2010, 22, 1078–1082. [Google Scholar] [CrossRef]
- Kästner, C.; Saloga, P.E.J.; Thünemann, A.F. Kinetic monitoring of glutathione-induced silver nanoparticle disintegration. Nanoscale 2018, 10, 11485–11490. [Google Scholar] [CrossRef] [PubMed]
- Qiao, Y.; Yu, G.; Leeuwon, S.Z.; Liu, W.R. Site-specific conversion of cysteine in a protein to dehydroalanine using 2-nitro-5-thiocyanatobenzoic acid. Molecules 2021, 26, 2619. [Google Scholar] [CrossRef]
- Chalker, J.M.; Gunnoo, S.B.; Boutureira, O.; Gerstberger, S.C.; Fernandez-Gonzalez, M.; Bernardes, G.J.L.; Griffin, L.; Hailu, H.; Schofield, C.J.; Davis, B.G. Methods for converting cysteine to dehydroalanine on peptides and proteins. Chem. Sci. 2011, 2, 1666–1676. [Google Scholar] [CrossRef]
- Younis, I.R.; Elliott, M.; Peer, C.J.; Cooper, A.J.; Pinto, J.T.; Konat, G.W.; Kraszpulski, M.; Petros, W.P.; Callery, P.S. Dehydroalanine analog of glutathione: An electrophilic busulfan metabolite that binds to human glutathione S-transferase A1-1. J. Pharmacol. Exp. Ther. 2008, 327, 770–776. [Google Scholar] [CrossRef] [PubMed]
- Wu, Z.; Gayathri, C.; Gil, R.R.; Jin, R. Probing the structure and charge state of glutathione-capped Au25(SG)18 clusters by NMR and mass spectrometry. J. Am. Chem. Soc. 2009, 131, 6535–6542. [Google Scholar] [CrossRef] [PubMed]
- Wu, Z.; Jin, R. Stability of the two Au−S binding modes in Au25(SG)18 nanoclusters probed by NMR and optical spectroscopy. ACS Nano 2009, 3, 2036–2042. [Google Scholar] [CrossRef]
- Mingos, D.M.P. (Ed.) Gold Clusters, Colloids and Nanoparticles I; Springer: Berlin/Heidelberg, Germany, 2014; Volume 161. [Google Scholar]
- Wetzel, O.; Hosseini, S.; Loza, K.; Heggen, M.; Prymak, O.; Bayer, P.; Beuck, C.; Schaller, T.; Niemeyer, F.; Weidenthaler, C.; et al. Metal–ligand interface and internal structure of ultrasmall silver nanoparticles (2 nm). J. Phys. Chem. B 2021, 125, 5645–5659. [Google Scholar] [CrossRef]
- Ferraria, A.M.; Carapeto, A.P.; do Rego, A.M.B. X-ray photoelectron spectroscopy: Silver salts revisited. Vacuum 2012, 86, 1988–1991. [Google Scholar] [CrossRef]
- Levard, C.; Hotze, E.M.; Lowry, G.V.; Brown, G.E., Jr. Environmental transformations of silver nanoparticles: Impact on stability and toxicity. Environ. Sci. Toxicol. 2012, 46, 6900–6914. [Google Scholar] [CrossRef]
- Fletcher, N.D.; Lieb, H.C.; Mullaugh, K.M. Stability of silver nanoparticle sulfidation products. Sci. Total Environ. 2019, 648, 854–860. [Google Scholar] [CrossRef]
- Sadovnikov, S.I.; Gusev, A.I. Recent progress in nanostructured silver sulfide: From synthesis and nonstoichiometry to properties. J. Mater. Chem. A 2017, 5, 17676–17704. [Google Scholar] [CrossRef]
- Ibrahim, M.; Camarero, P.; Ming, L.Y.; Haouari, M.; Amamou, N.; Haro-Gonzalez, P.; Hassen, F. Wet chemical synthesis of TGA capped Ag2S nanoparticles and their use for fluorescence imaging and temperature sensing in living cells. RSC Adv. 2023, 13, 35065–35077. [Google Scholar] [CrossRef] [PubMed]
- Lu, F.; Gong, Y.; Ju, W.W.; Cheng, F.; Zhang, K.W.; Wang, Q.; Wang, W.J.; Zhong, J.B.; Fan, Q.L.; Huang, W. Facile one-pot synthesis of monodispersed NIR-II emissive silver sulfide quantum dots. Inorg. Chem. Commun. 2019, 106, 233–239. [Google Scholar] [CrossRef]
- Manju, C.K.; Mohanty, J.S.; Sarkar, D.; Chennu, S.; Pradeep, T. Towards atomically precise luminescent Ag2S clusters separable by thin layer chromatography. J. Mater. Chem. C 2018, 6, 5754–5759. [Google Scholar] [CrossRef]
- Bestgen, S.; Fuhr, O.; Breitung, B.; Chakravadhanula, V.S.K.; Guthausen, G.; Hennrich, F.; Yu, W.; Kappes, M.M.; Roesky, P.W.; Fenske, D. [Ag115S34(SCH2C6H4 tBu)47(dpph)6]: Synthesis, crystal structure and NMR investigations of a soluble silver chalcogenide nanocluster. Chem. Sci. 2017, 8, 2235–2240. [Google Scholar] [CrossRef] [PubMed]
- Tian, Z.M.; Song, C.F.; Wang, C.; Xu, H.J.; Guan, Q.M. Structures and properties of [Ag(Ag2S)n]+clusters with n = 1–9: A density functional theory study. J. Nanoparticle Res. 2020, 22, 161. [Google Scholar] [CrossRef]
- Song, C.F.; Tian, Z.M. Systematic study on the structures and properties of (Ag2S)n (n = 1–8) clusters. J. Mol. Model. 2019, 25, 310. [Google Scholar] [CrossRef]
- Hsu, J.C.; Barragan, D.; Tward, A.E.; Hajfathalian, M.; Amirshaghaghi, A.; Mossburg, K.J.; Rosario-Berríos, D.N.; Bouché, M.; Andrianov, A.K.; Delikatny, E.J.; et al. A biodegradable “one-for-all” nanoparticle for multimodality imaging and enhanced photothermal treatment of breast cancer. Adv. Healthc. Mater. 2024, 13, 2303018. [Google Scholar] [CrossRef]
- Yang, G.; Wang, Z.P.; Du, F.L.; Jiang, F.Y.; Yuan, X.; Ying, J.Y. Ultrasmall coinage metal nanoclusters as promising theranostic probes for biomedical applications. J. Am. Chem. Soc. 2023, 145, 11879–11898. [Google Scholar] [CrossRef]
- Hsu, J.C.; Cruz, E.D.; Lau, K.C.; Bouché, M.; Kim, J.; Maidment, A.D.A.; Cormode, D.P. Renally excretable and size-tunable silver sulfide nanoparticles for dual-energy mammography or computed tomography. Chem. Mater. 2019, 31, 7845–7854. [Google Scholar] [CrossRef]


| Nanoparticle Type | Silver Nanoparticles (Freshly Prepared) | Silver Nanoparticles (Aged) |
|---|---|---|
| Hydrodynamic diameter by DCS/nm | 1.5 ± 0.3 | 1.7 ± 0.6 |
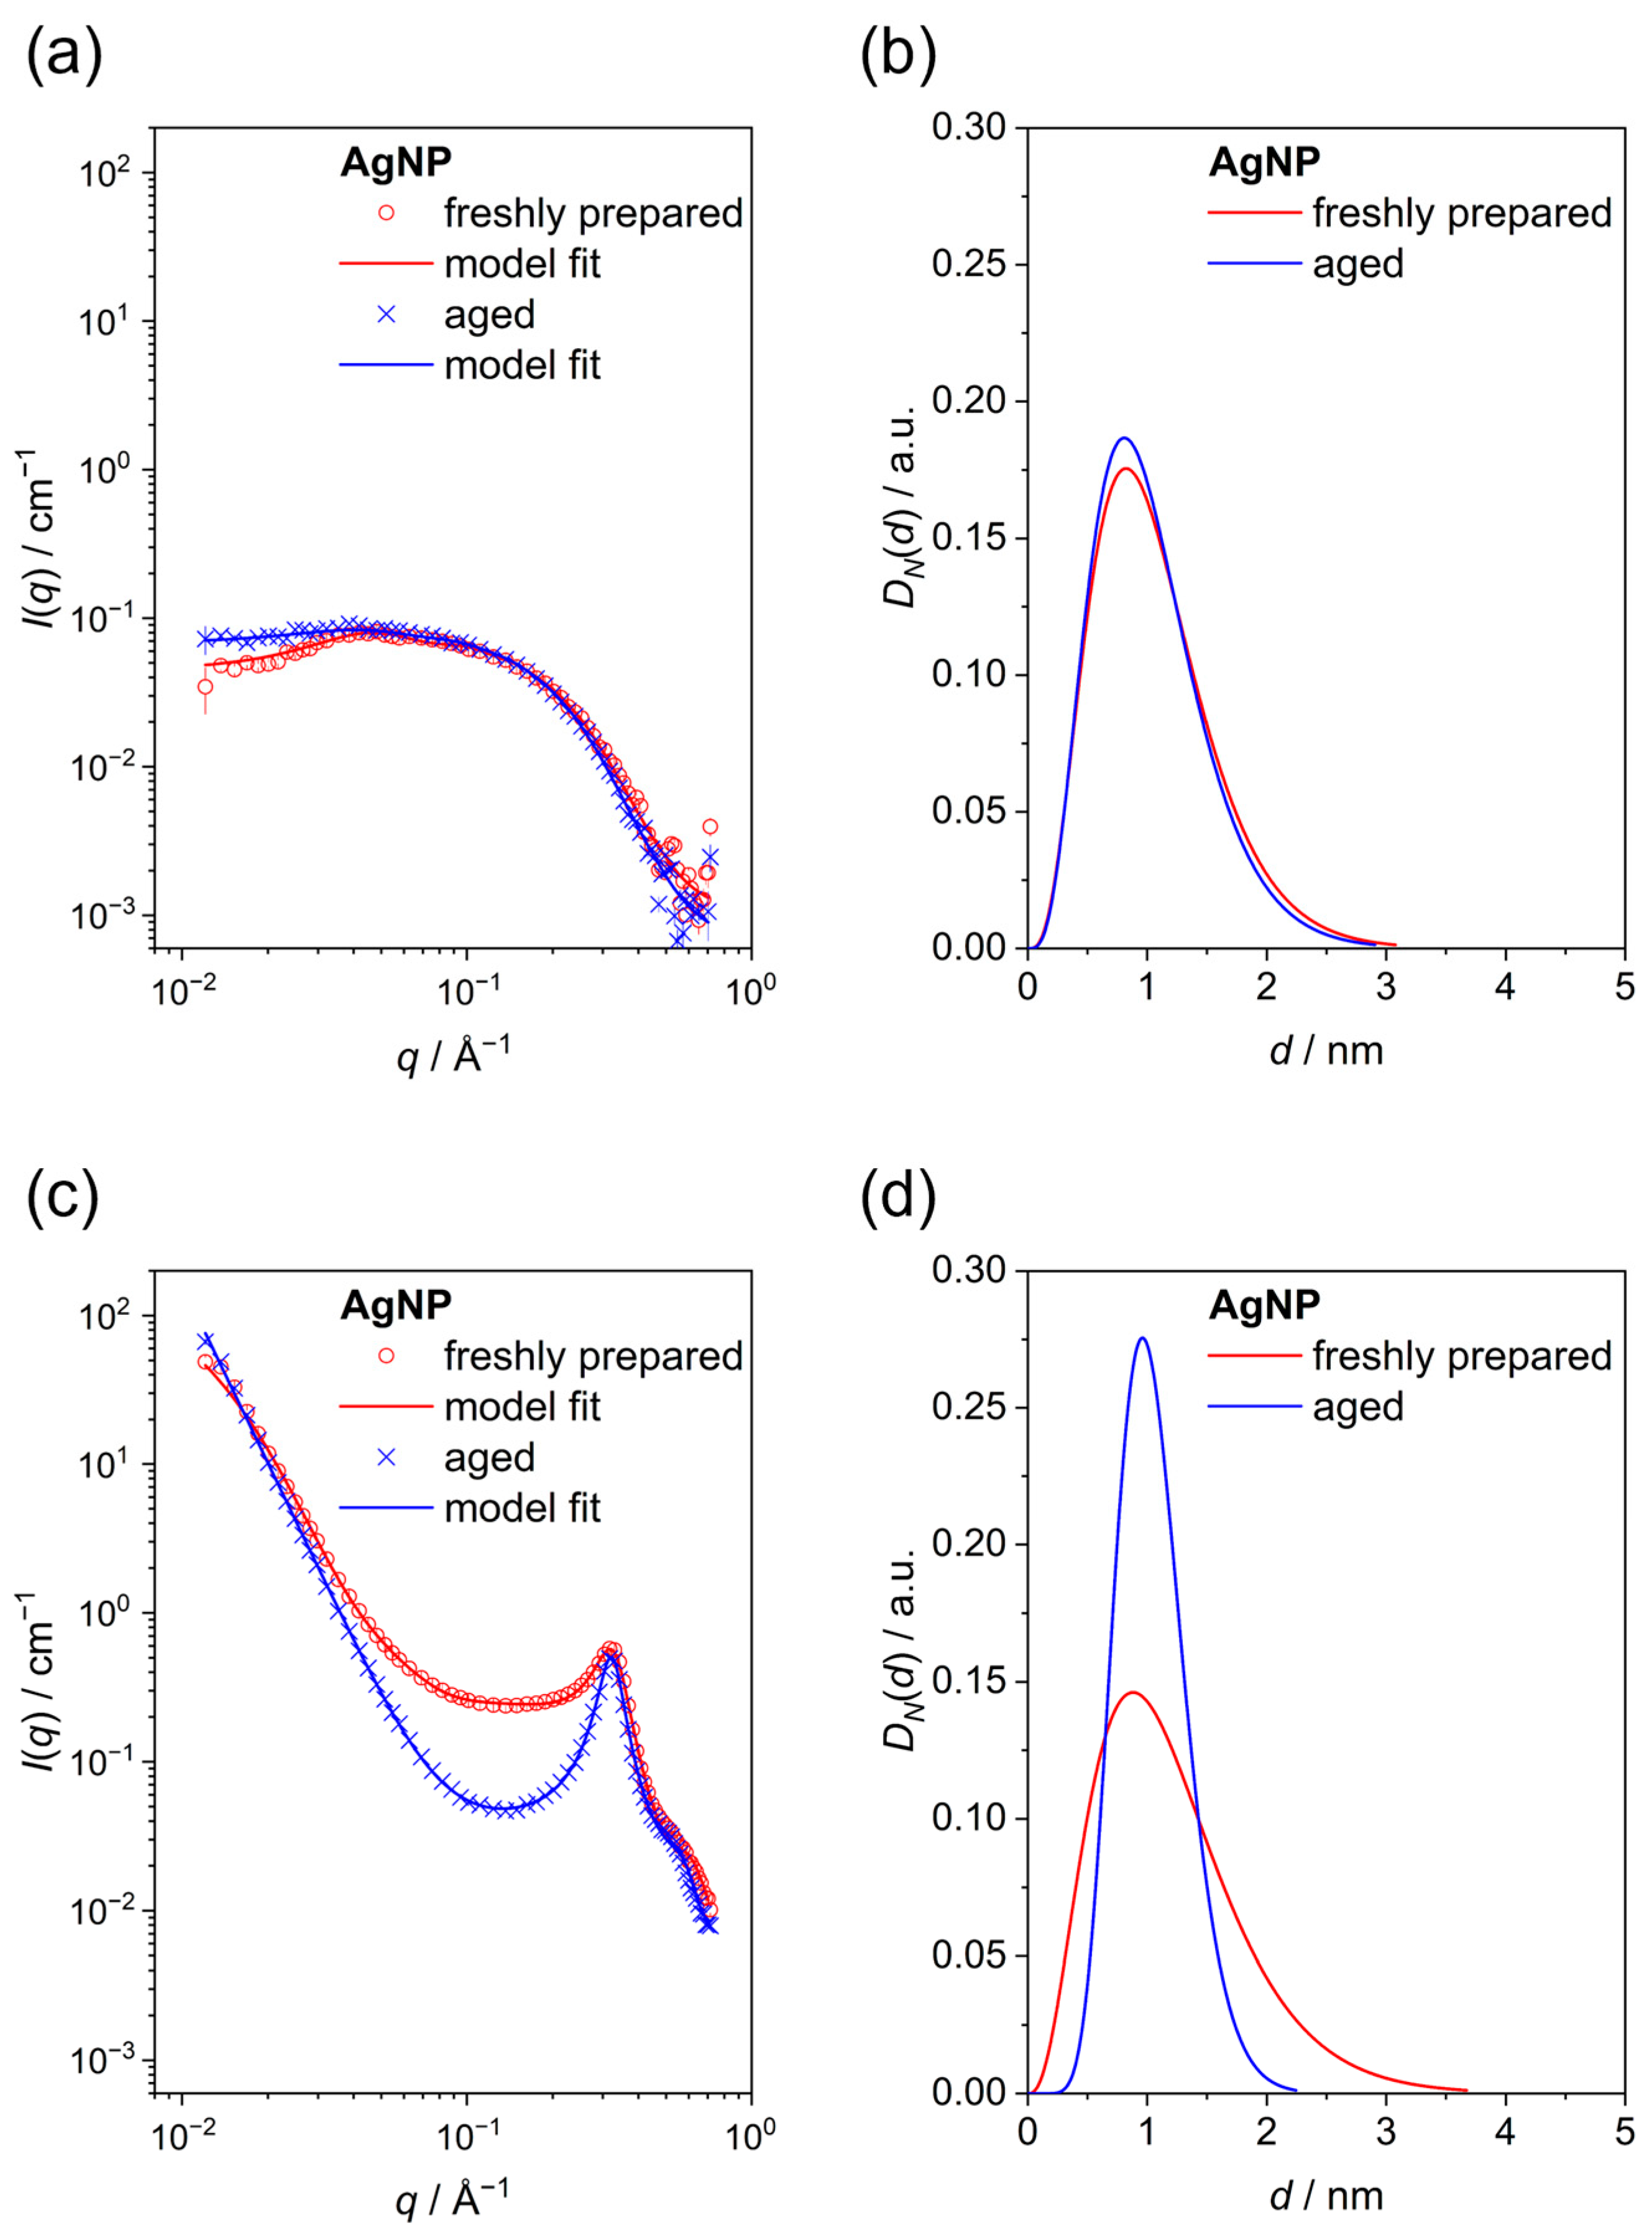
| Core diameter by SAXS (dispersed particles)/nm | 1.0 ± 0.4 | 1.2 ± 0.2 |
| Core diameter by SAXS (powder)/nm | 1.1 ± 0.3 | 1.1 ± 0.15 |
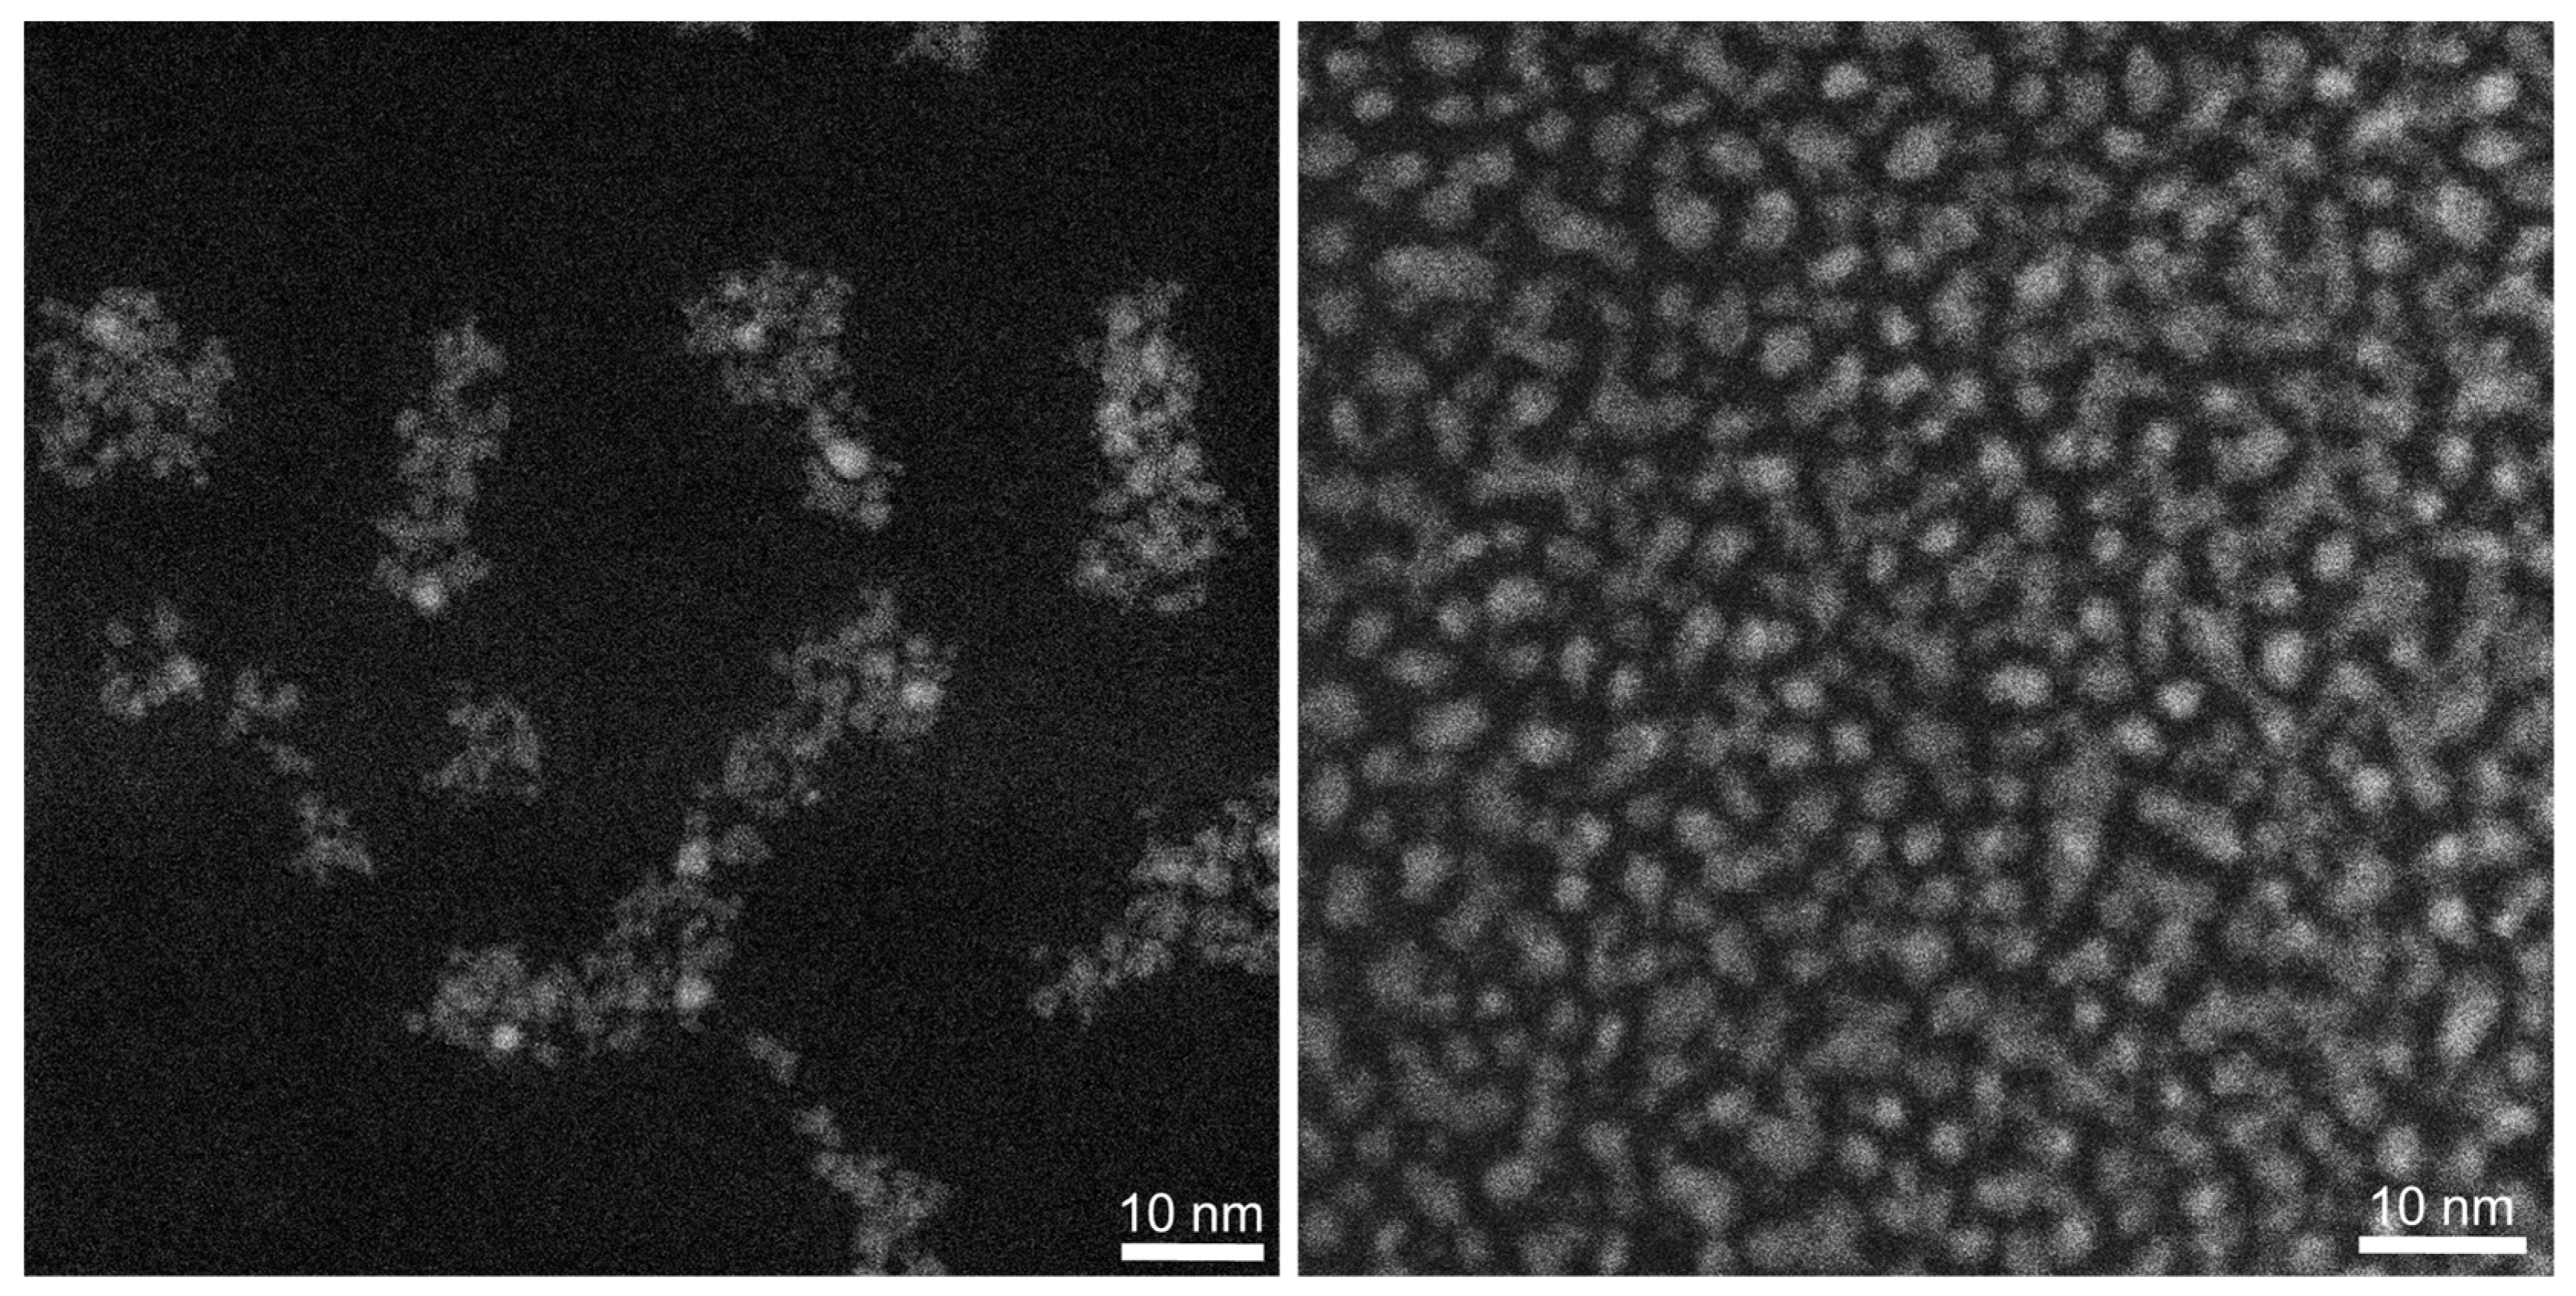
| Core diameter by HAADF-STEM/nm | 2.2 ± 0.5 | 2.3 ± 0.7 |
| Sample | E. coli (Gram-Negative) | S. xylosus (Gram-Positive) |
|---|---|---|
| AgNO3 | 6 to 10 | 15 to 25 |
| Freshly prepared silver nanoparticles | 6 to 10 | 1 to 5 |
| Aged silver nanoparticles | >100 | >100 |
Disclaimer/Publisher’s Note: The statements, opinions and data contained in all publications are solely those of the individual author(s) and contributor(s) and not of MDPI and/or the editor(s). MDPI and/or the editor(s) disclaim responsibility for any injury to people or property resulting from any ideas, methods, instructions or products referred to in the content. |
© 2024 by the authors. Licensee MDPI, Basel, Switzerland. This article is an open access article distributed under the terms and conditions of the Creative Commons Attribution (CC BY) license (https://creativecommons.org/licenses/by/4.0/).
Share and Cite
Wolff, N.; Prymak, O.; Białas, N.; Schaller, T.; Loza, K.; Niemeyer, F.; Heggen, M.; Weidenthaler, C.; Oliveira, C.L.P.; Epple, M. Conversion of Ultrasmall Glutathione-Coated Silver Nanoparticles during Dispersion in Water into Ultrasmall Silver Sulfide Nanoparticles. Nanomaterials 2024, 14, 1449. https://doi.org/10.3390/nano14171449
Wolff N, Prymak O, Białas N, Schaller T, Loza K, Niemeyer F, Heggen M, Weidenthaler C, Oliveira CLP, Epple M. Conversion of Ultrasmall Glutathione-Coated Silver Nanoparticles during Dispersion in Water into Ultrasmall Silver Sulfide Nanoparticles. Nanomaterials. 2024; 14(17):1449. https://doi.org/10.3390/nano14171449
Chicago/Turabian StyleWolff, Natalie, Oleg Prymak, Nataniel Białas, Torsten Schaller, Kateryna Loza, Felix Niemeyer, Marc Heggen, Claudia Weidenthaler, Cristiano L. P. Oliveira, and Matthias Epple. 2024. "Conversion of Ultrasmall Glutathione-Coated Silver Nanoparticles during Dispersion in Water into Ultrasmall Silver Sulfide Nanoparticles" Nanomaterials 14, no. 17: 1449. https://doi.org/10.3390/nano14171449
APA StyleWolff, N., Prymak, O., Białas, N., Schaller, T., Loza, K., Niemeyer, F., Heggen, M., Weidenthaler, C., Oliveira, C. L. P., & Epple, M. (2024). Conversion of Ultrasmall Glutathione-Coated Silver Nanoparticles during Dispersion in Water into Ultrasmall Silver Sulfide Nanoparticles. Nanomaterials, 14(17), 1449. https://doi.org/10.3390/nano14171449