Article

Comprehensive Utilization of Formation Water Scale to Prepare Controllable Size CaCO3 Nanoparticles: A New Method to Improve Oil Recovery

1
State Key Laboratory of Offshore Oil and Gas Exploitation, Beijing 102209, China
2
CNOOC Research Institute Co., Ltd., Beijing 100028, China
3
School of Chemistry and Environmental Engineering, Yangtze University, Jingzhou 434020, China
*
Authors to whom correspondence should be addressed.
Nanomaterials 2024, 14(17), 1452; https://doi.org/10.3390/nano14171452
Submission received: 22 July 2024 / Revised: 4 September 2024 / Accepted: 4 September 2024 / Published: 6 September 2024
(This article belongs to the Special Issue Nanomaterials in Water Applications)

Abstract

:
Formation water scale blocks pipelines and results in oil/gas production decreasing and energy consumption increasing. Many methods have been developed to inhibit scale formation. However, these previous methods are limited by their complications and low efficiency. A new method is proposed in this paper that uses the scale in formation water as a nanomaterial to improve oil recovery via controlling particle size. A series of ligands were synthesized and characterized. Micrometer-CaCO3 was formed and accumulated to form scale of a large size under uncontrolled conditions. The tetradentate ligands (L4) exhibited an excellent capturing yield of Ca2+ (87%). The particle size was very small, but they accumulated to form large particles (approximately 1300 nm) in the presence of Na2CO3. The size of the CaCO3 could be further controlled by poly(aspartic acid) to form sizes of about 700 nm. The flooding test showed that this material effectively improved oil recovery from 55.2% without nano CaCO3 to 61.5% with nano CaCO3. This paves a new pathway for the utilization of Ca2+ in formation water.

1. Introduction

With the continuous development of modern society, the demand for oil and gas resources is gradually increasing [1,2,3]. Upon entering the middle and later stages of oilfield maturity, the composition of formation water becomes complicated. High-valent metal ions in formation water, such as Ca2+ and Mg2+, can form scale on the surface of pipelines and facilities and lead to blockages [4,5,6]. Moreover, these high-valent ions can also react with pipelines, which leads to severe corrosion in water injection systems [7,8,9]. The formation of scale is very complex, involving thermodynamics, dynamics, fluid dynamics, etc. The scale can block the pipelines, resulting in oil and gas production decreasing, energy consumption increasing, unnormal continuous production, or even the stopping of production. In order to inhibit scale formation in oilfields, many methods have been developed, including chemical anti-scaling agents and physical anti-scaling methods [10,11]. However, owing to their complications, the effect of these methods on inhibiting scale formation is limited [12].
In addition, in different oilfields, the types and contents of ions are also different, leading to many uncertain factors and unsatisfactory results when using traditional chemical methods for anti-scaling [12]. Normally, one needs to add much more agent to achieve the anticipated aim. Physical methods, such as ultrasound method for anti-scaling, are as of now immature and easily affected by on-site conditions [13,14]. Most importantly, physical methods must be coupled with chemical methods to treat scale formation. Therefore, although chemical methods are not universally applicable, their low cost, mature technology, fast effectiveness, and good results make them the main means of removing scale [15,16,17,18]. However, chemical agents may remain in formation water after removing scale and gradually accumulate, leading to more serious side effects [19]. Therefore, new methods need to be developed to remove or treat scale.
Owing to their decreasing interfacial tension, changing wetting, enhancing the stability of emulsions, and decreasing injection pressure, many nanomaterials have been extensively utilized in oilfields to enhance oil recovery [20,21,22]. Polyacrylamide (PAM) microsphere and its emulsions have been demonstrated in some oilfields, such as the Changqing Oilfield in China, not only to have excellent dispersion performance, but also to be capable of increasing flow resistance and forcing flow steering to increase swept volume in deep or large channels when the nanospheres flow into the reservoir [23]. Scale formation is a slow process in formation water that involves crystal growth, including homogeneous and heterogeneous crystallization [24]. Therefore, it suggests the probability of controlling the size of scale particles during scale formation in nanometers or micrometers as an inorganic material to enhance oil recovery. This can not only solve the scale problem, but also achieve Ca2+ and Mg2+ sustainability in formation water [25,26].
Normally, CaCO3 and MgCO3 are precipitated to form scale in formation water owing to their relatively high content of Ca2+ and Mg2+. To prevent the rapid precipitation of CaCO3 and MgCO3, the fast capture of the above ions in formation water is a critical step. For instance, chelated agents such as ethylenediamine tetra-acetic acid (EDTA) can be used to capture Ca2+ and Mg2+ ions and form a very stable complex [27,28], which would be beneficial to the formation of nano- or micrometer CaCO3 and MgCO3. Moreover, the stability of the chelation should not be too strong, so as to facilitate the fast release metal ions and the in situ formation of nano- or micro-nanoparticles of CaCO3 and MgCO3 [29,30,31]. Therefore, a suitable ligand is a key factor in the formation of micro-nanoparticles of CaCO3 and MgCO3. To this end, different kinds of compounds have been designed and synthesized (Figure 1) to capture Ca2+ and Mg2+. The objectives of this paper include: (1) preparing compounds to capture Ca2+ and Mg2+; (2) forming micro-nanoparticles of CaCO3 and enhancing oil recovery; and (3) elucidating a possible mechanism under present conditions.

2. Experimental Section

2.1. Materials

Chloroacetic acid (moderate toxicity); sodium hydroxide (NaOH); benzylamine; hydrochloric acid; sodium carbonate; butanediamine; p-xylylenediamine; ammonium chloride (low toxicity); iminodiacetic acid (low toxicity); absolute ethanol; 2-picolyl chloride-HCl (low toxicity); methanol (trace toxicity); poly (aspartic acid) (PASP) (trace toxicity); CaCl2; and NaHCO3 were purchased from Acros Organic Chemical Company (Waltham, MA, USA). They are analytical grade and without further purification.

2.2. Instruments

Fourier-transform infrared spectroscopy (FTIR): VERTEX 70 FT-IR spectrometer Thermo Fisher Technologies (Waltham, MA, USA); 1H nuclear magnetic resonance spectroscopy: 400 MHz AVANCE III 600 M (Bruker, Berlin, Germany); X-ray diffraction (XRD): D8 Advance (Dutch Panaco, Almelo, The Netherlands); S3500 laser particle size analyzer(Microtrac, Montgomeryville, PA, USA); Nano ZS Malvern laser particle sizer (Masterizer, Micro, Buckinghamshire, UK); scanning electron microscopy (SEM-EDS): Merlin (Zeiss, Jena, Germany); mass spectrometer: Agilent 6520 Q-TOF LC/MS (Agilent Technologies, Santa Clara, CA, USA); atomic absorption spectrophotometer: AA-7003 (East-west Analytical Instruments Co., Ltd., Beijing, China).

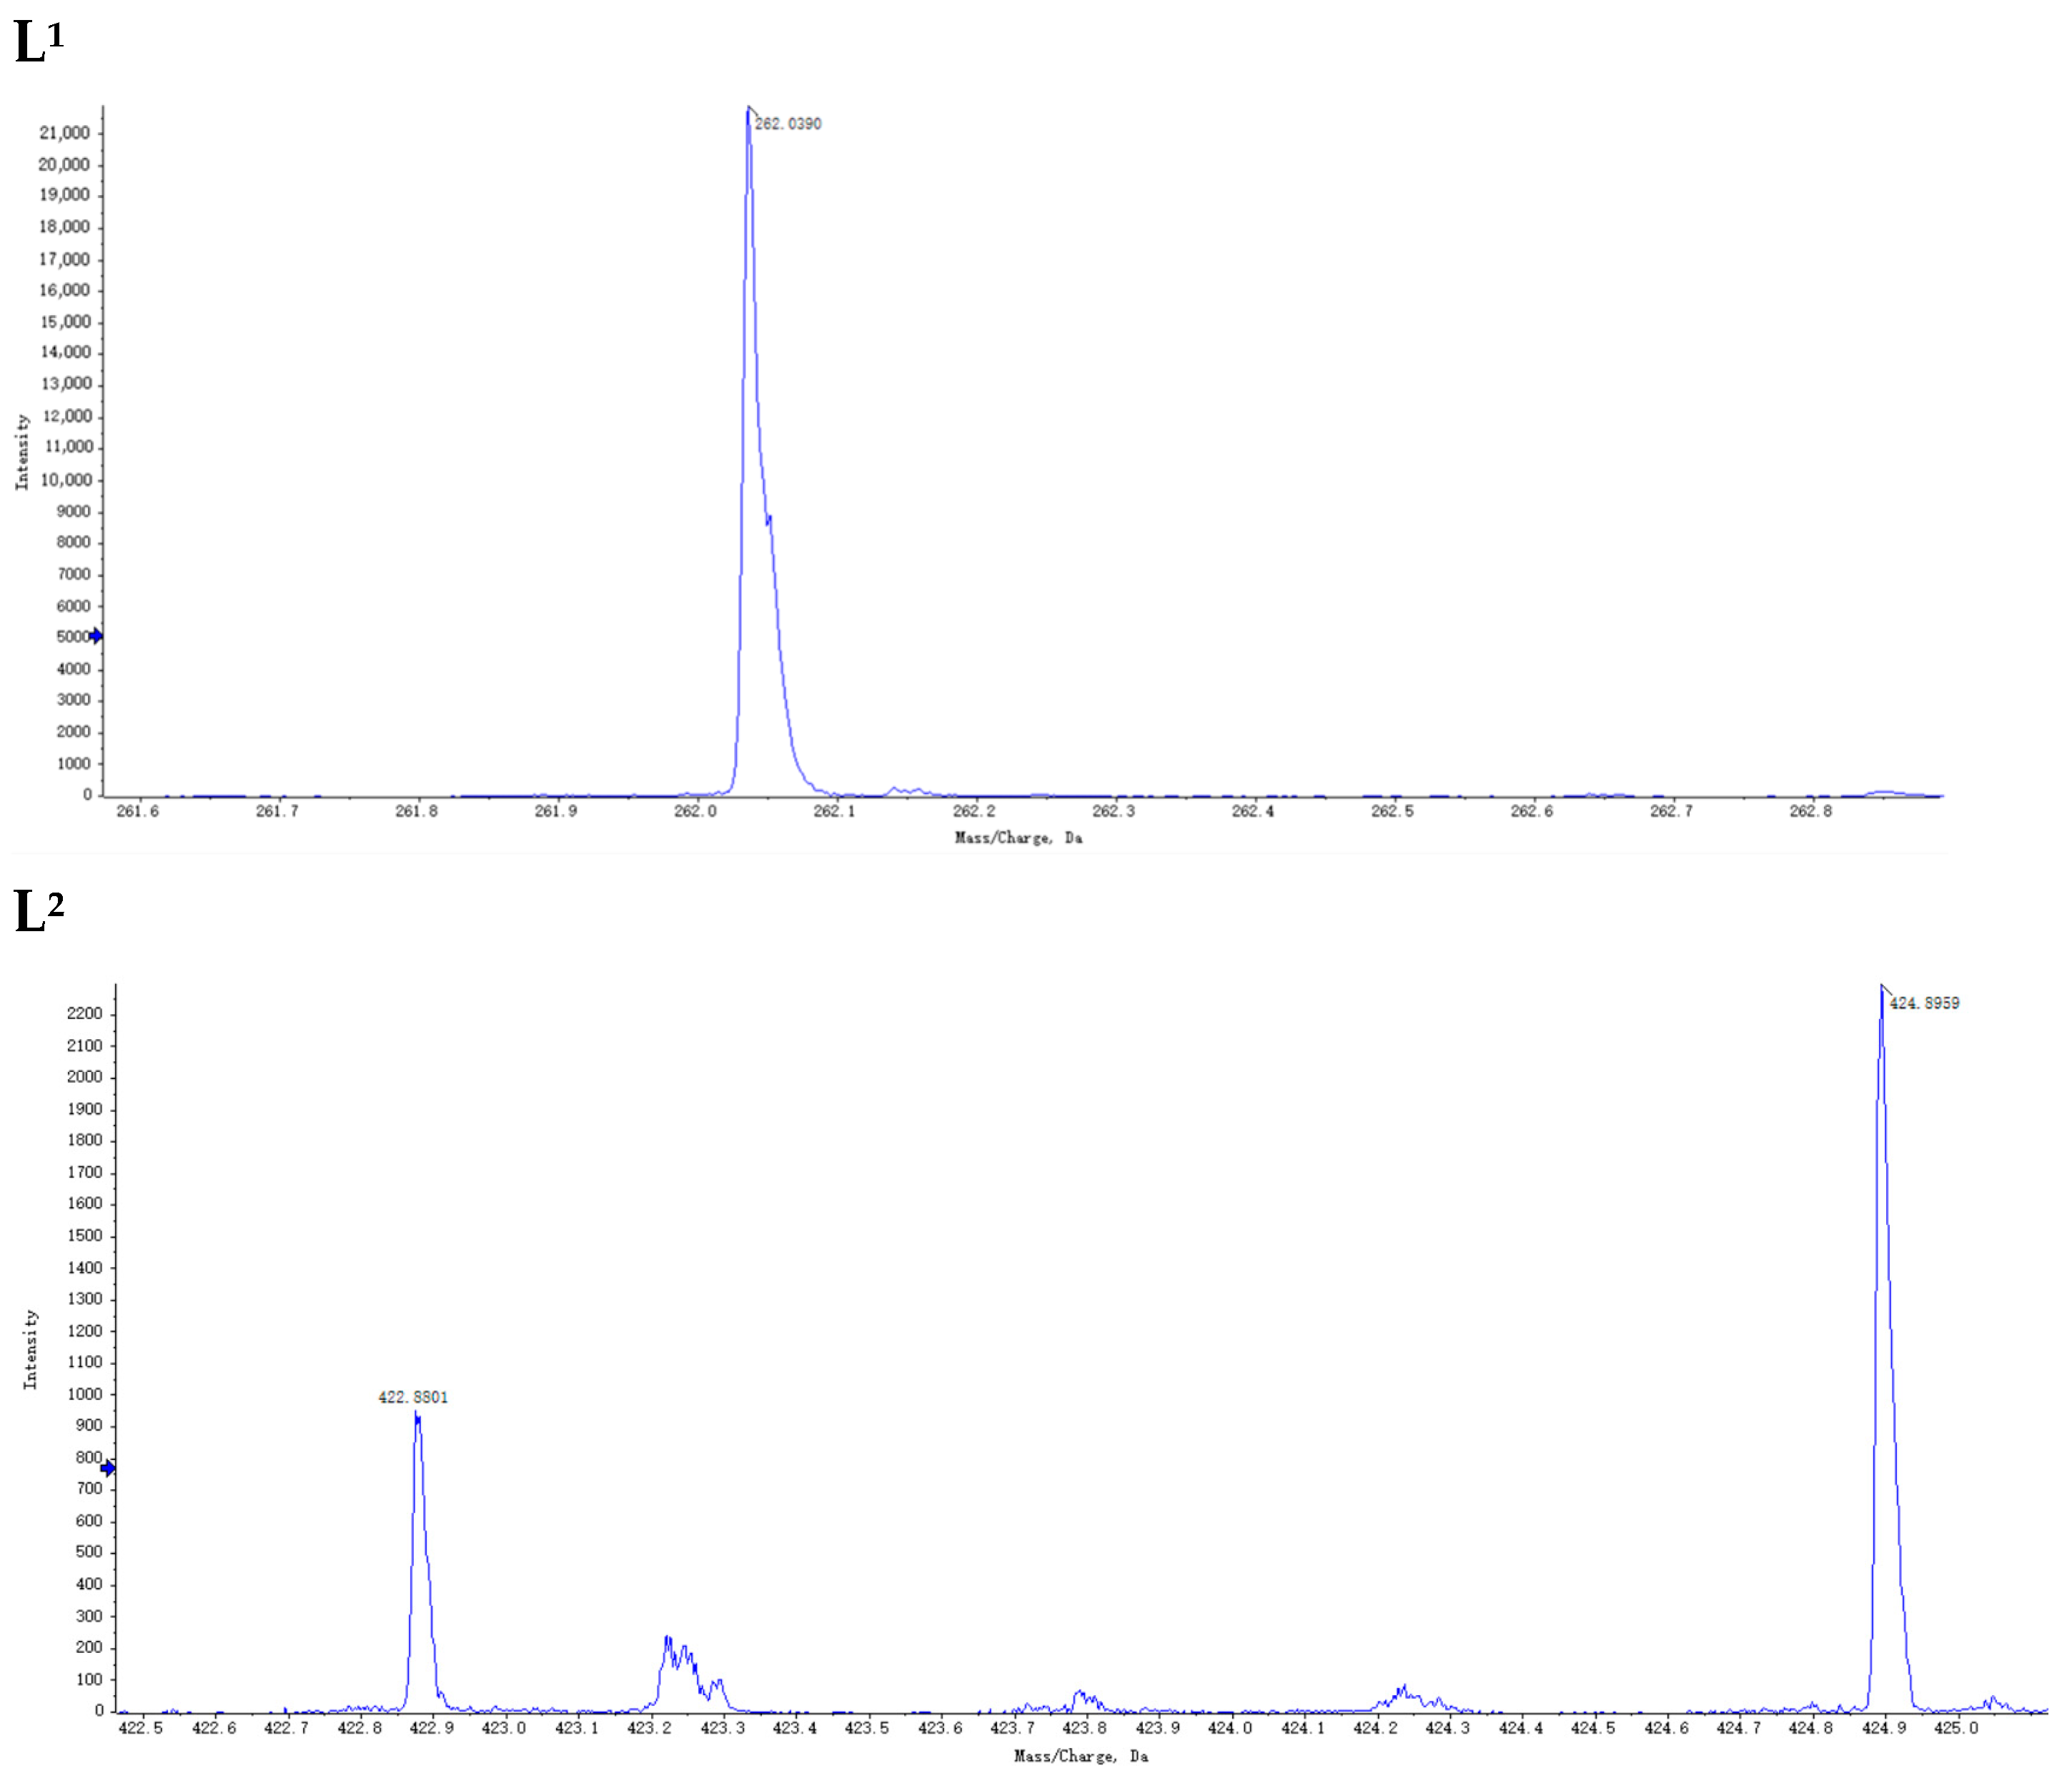
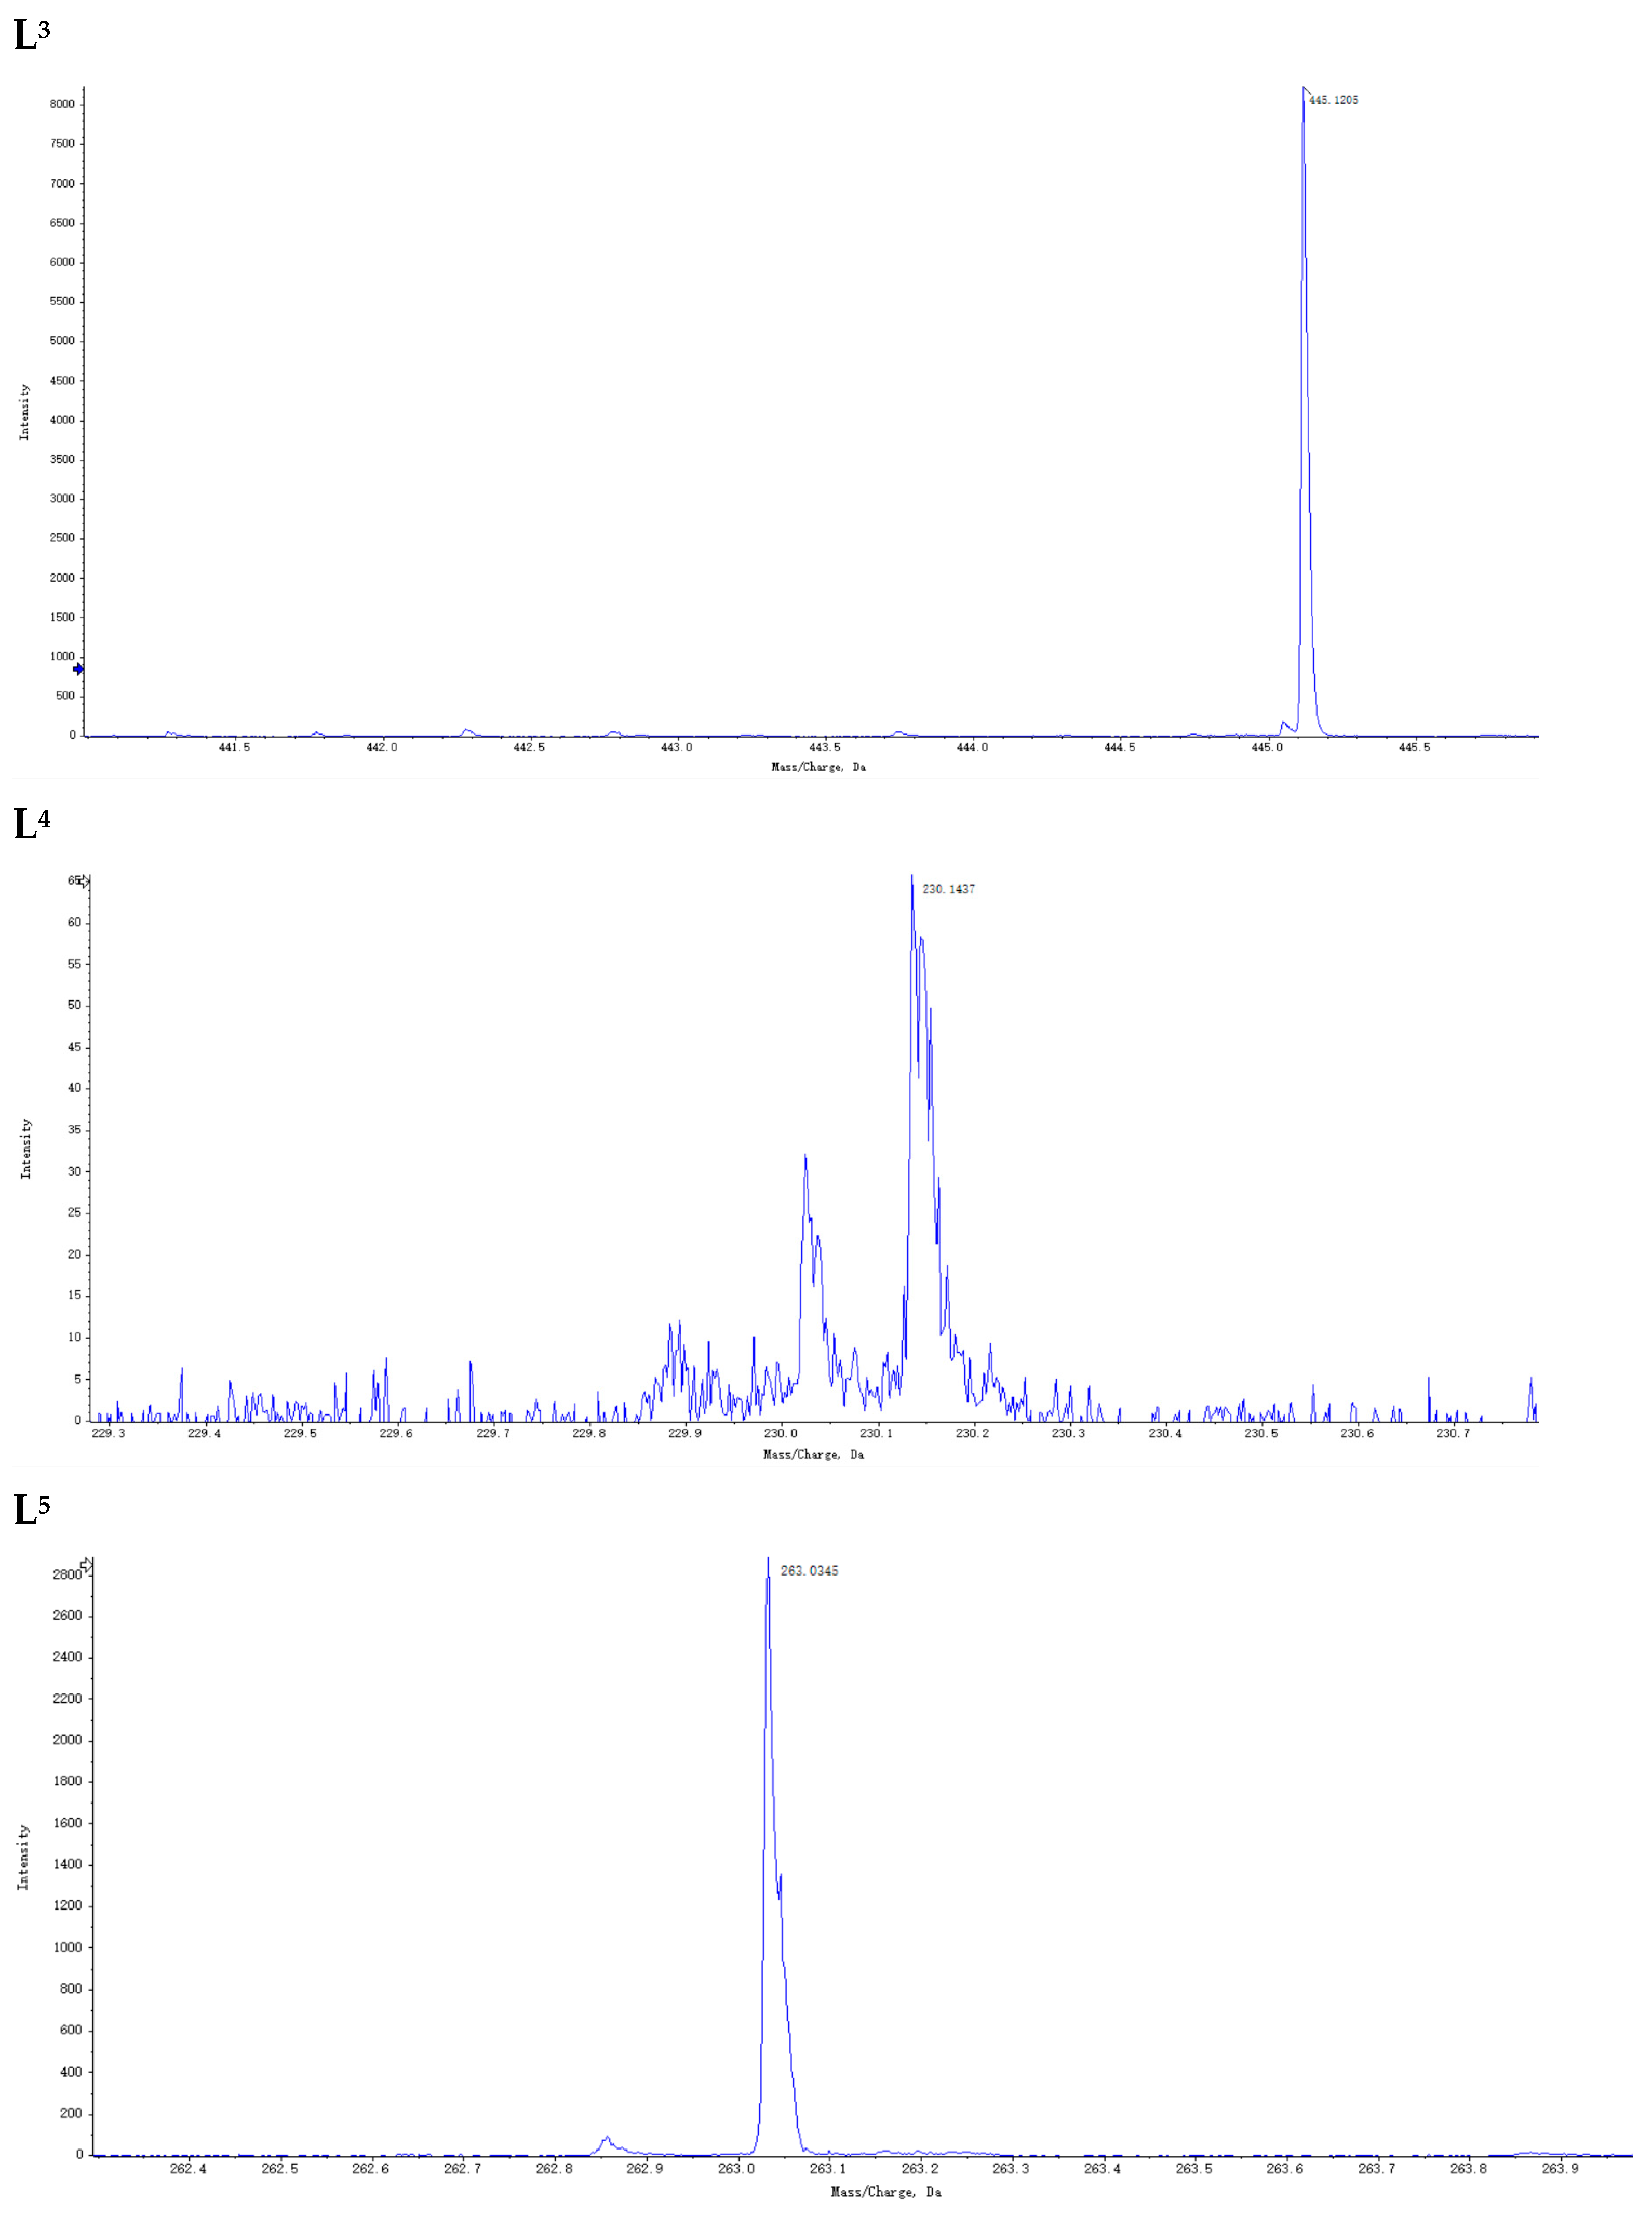
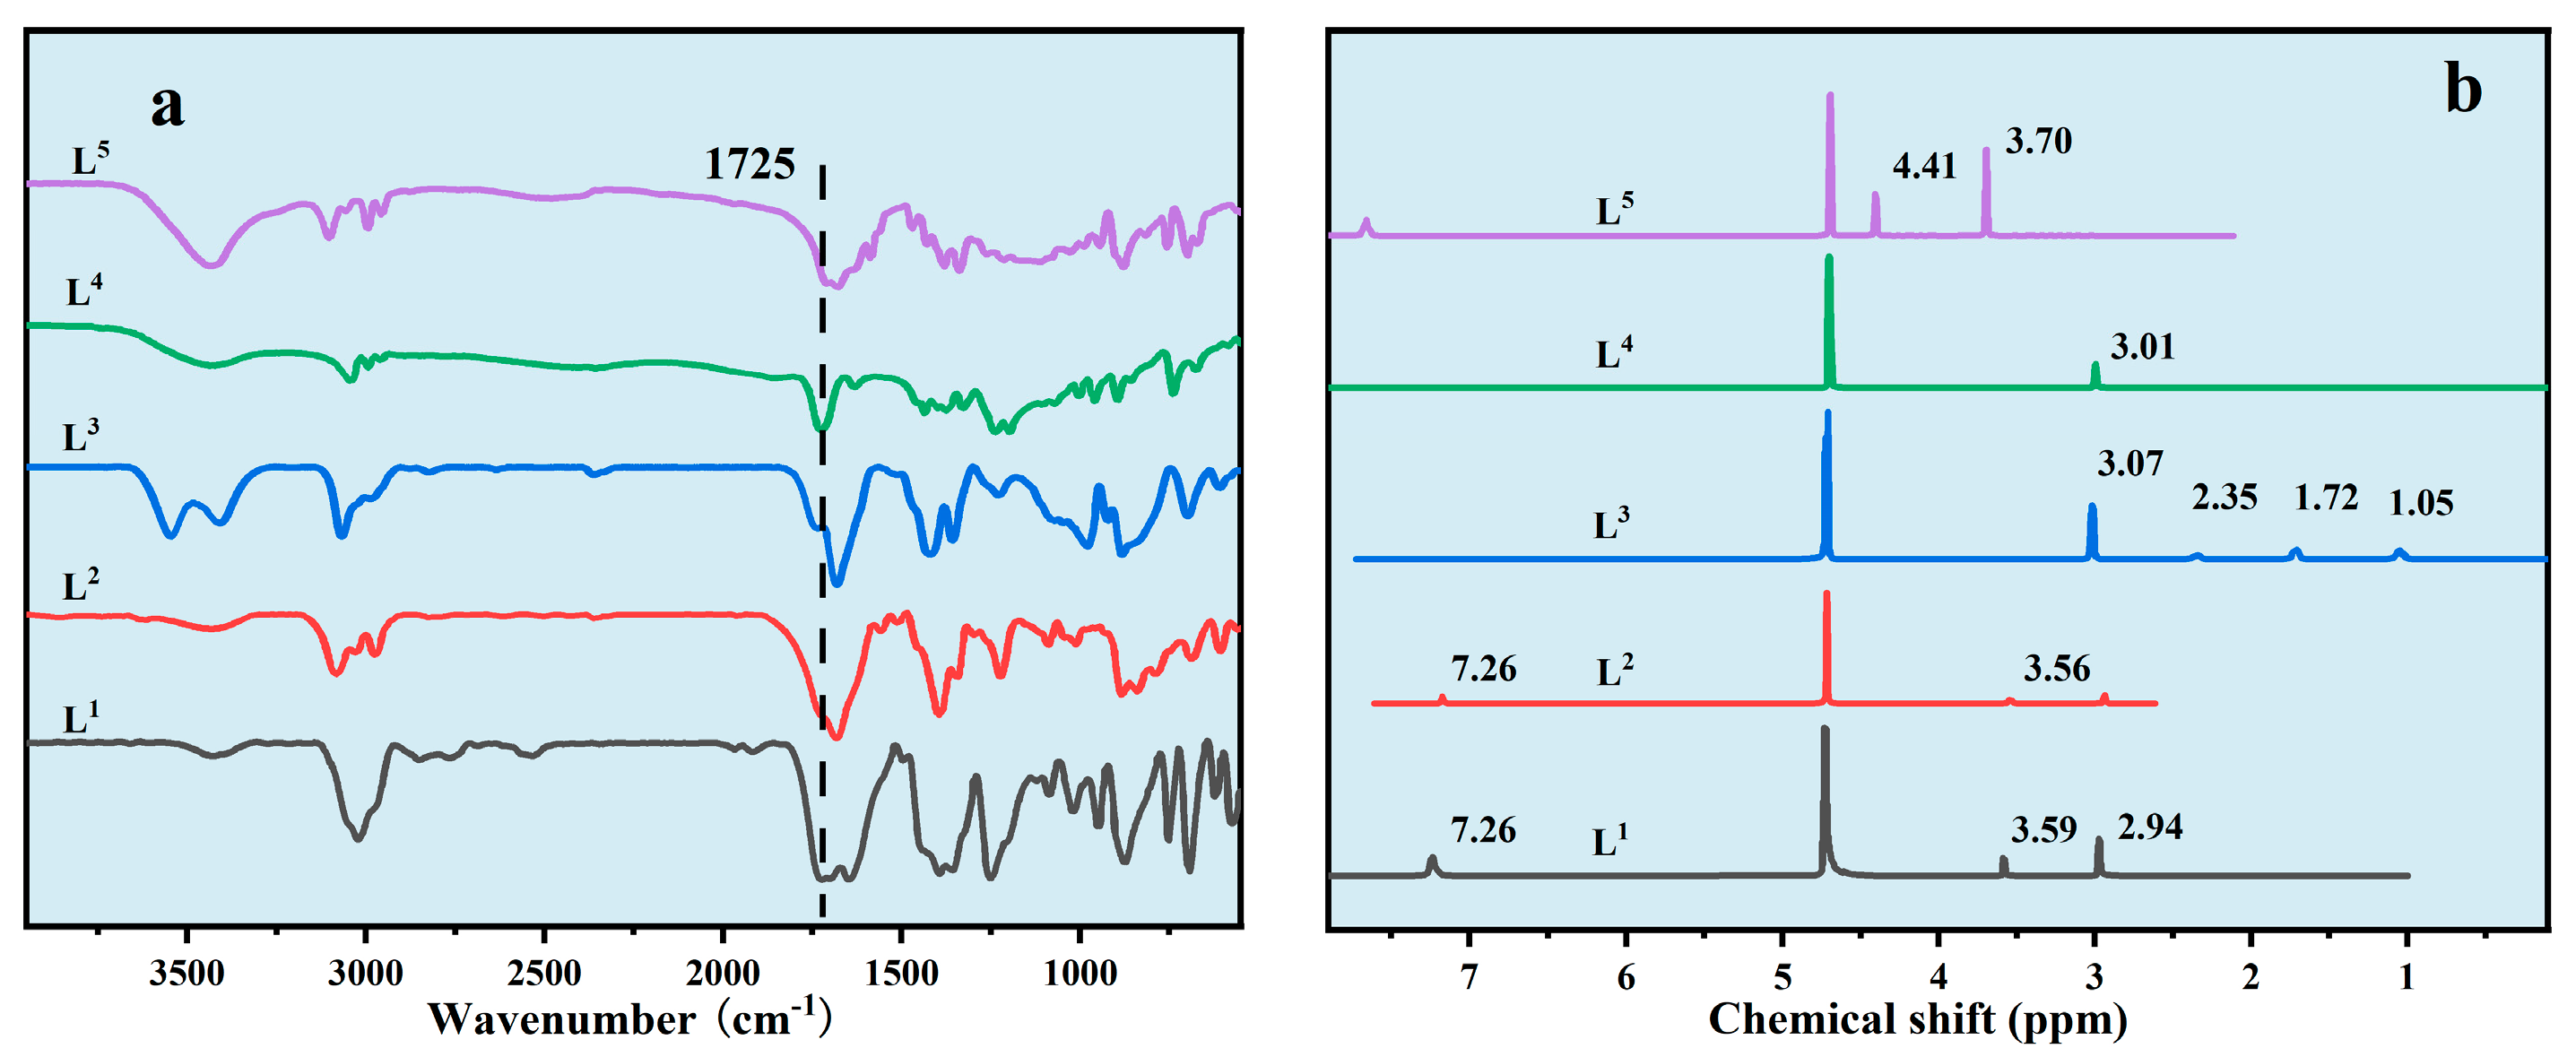
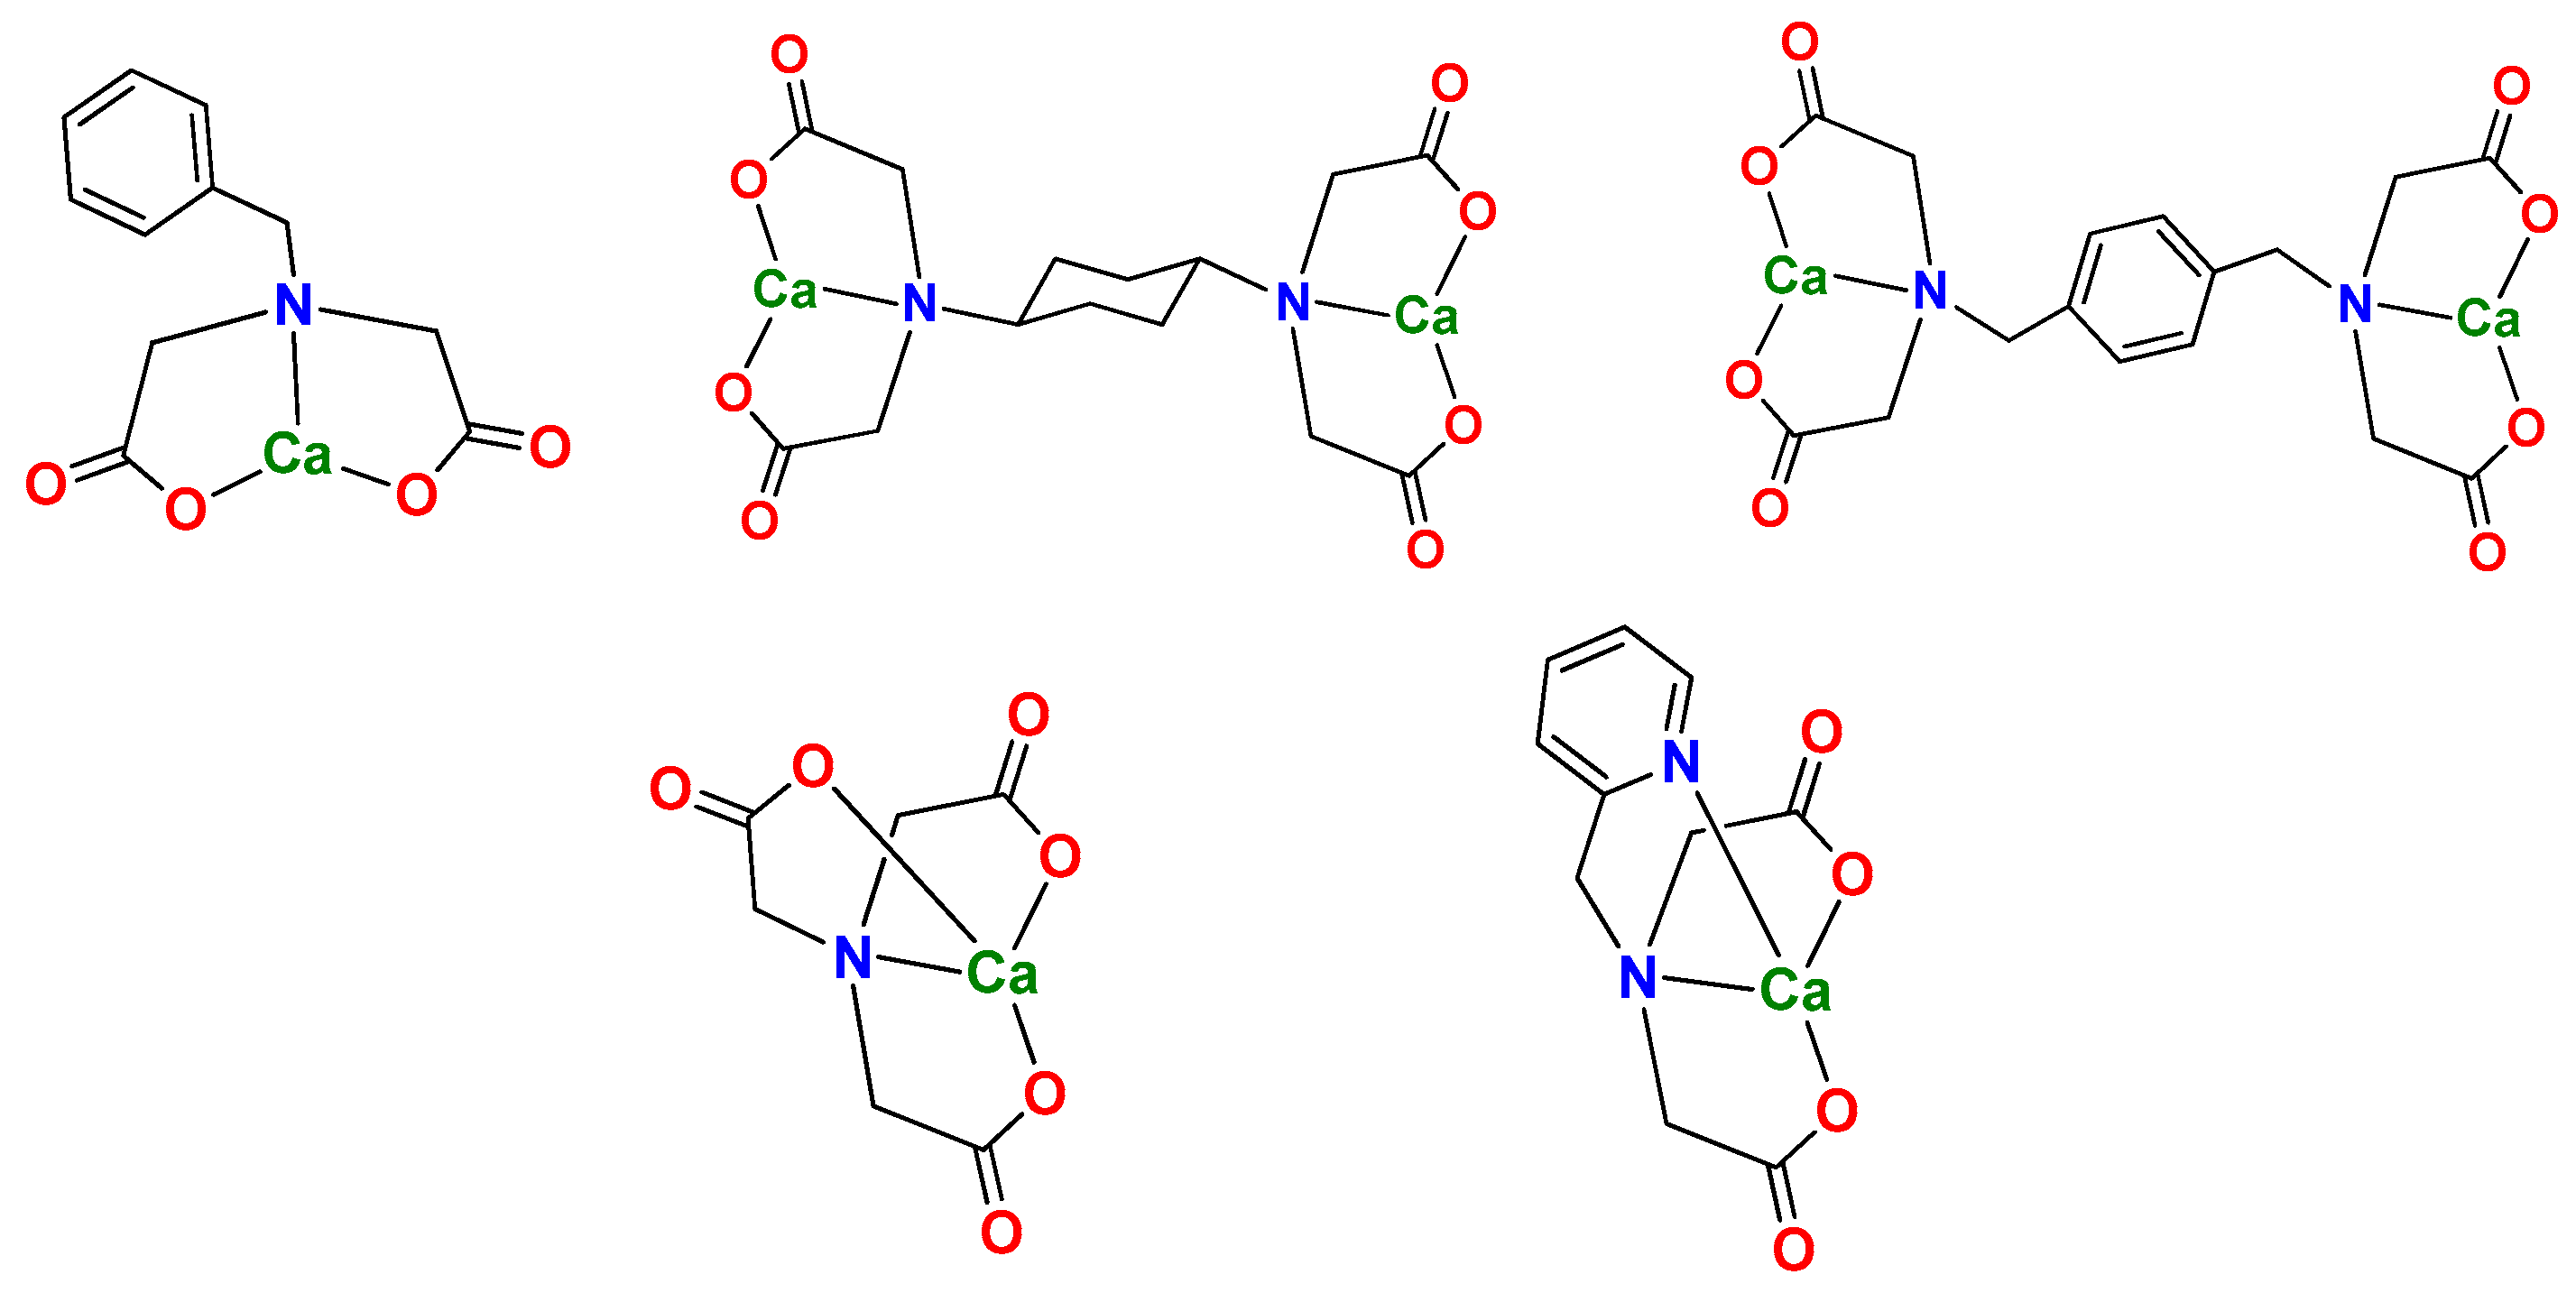
2.3. Preparation of Ion Regulators

N-Benzyl iminodiacetic acid (L1): Chloroacetic acid (9.5 g, 100 μmol) in H2O (35 mL) was cooled to 50 °C and neutralized with NaOH solution (0.17 g/mL). The alkali was added slowly to avoid the solution temperature exceeding 20 °C. Then, benzylamine (50 μmol, 5.5 mL) was added and the mixture was heated at reflux for one hour. The NaOH solution was added to mixture dropwise, and the mixture was further heated under reflux for one hour. After stopping heating, the mixture’s pH value was adjusted to neutral with hydrochloric acid. The precipitation was formed and collected with a 64% yield.
2,2′,2″,2′′′-((1,4-phenylenebis(methylene))bis(azanetriyl))tetraacetic acid (L2): 5.25 g of chloroacetic acid was weighed and dissolved in water. The mixture was stirred and neutralized with sodium carbonate until the pH was 6.8–7. According to the ratio of chloroacetic acid:butanediamine = 6.7:1 (mass ratio), the sodium chloroacetate solution was first transferred into a three-necked flask, then stirred. Next, 906 μL (0.78 g) of butanediamine and 25% NaOH mixture was slowly added to the three-necked flask using a drip funnel. After addition, the pH was adjusted to 9–9.5 using a 25% NaOH solution, and the reaction temperature was maintained at 90–95 °C until the pH value of the solution did not decrease (at the end of the reaction, the pH was maintained at around 9). The reaction solution was cooled down to 40–45 °C, then continuously stirred while 1:1 hydrochloric acid was added for acidification. When the pH of the solution reached 1, no more acid was added and the solution was stirred until precipitation formed. The yield was 64%.
Trans-2,2′,2″,2′′′-(cyclohexane-1,4-diylbis(azanetriyl))tetraacetic acid (L3): An aqueous solution of chloroacetic acid (4.75 g; 50 μmol in 17.5 mL) was cooled in an ice bath to 5 °C and neutralized with an aqueous sodium hydroxide solution (2.0 g; 50 μmol in 10 mL). The alkali was added at such a rate that the temperature of the reaction mixture never reached 20 °C. Then, 3.40 g (25 μmol) of p-xylylenediamine was added. The reaction mixture was refluxed and a solution of 2.0 g NaOH in 10 mL of water was added dropwise to it over one hour. A clear colorless solution was formed, and the refluxing was continued for one additional hour. The reaction mixture was poured into a large beaker, acidified to pH = 2 with diluted hydrochloric acid (1:1 v/v), and cooled to room temperature. The bottom of the beaker was scratched with a sharp glass rod to induce precipitation and stirred until the mixture solidified. After standing overnight in a refrigerator, the product was filtered off by suction, washed with ice water, and dried. The yield was 57%.
Nitrilotriacetic acid (L4): 8.85 g monochloroacetic acid was put into the flask, stirred and heated until molten, and then an aqueous solution of NaOH was added (3.70 g in 10 mL). The solution was maintained at 80–90 °C for 5–6 h. Then, it was concentrated under vacuum, heated to 60 °C, and adjusted to a pH of 7–8 with saturated sodium carbonate solution. Under 80 °C, 4.0 g saturated solution of ammonium chloride was slowly added. Then the pH was adjusted to 9–10 with 1 M NaOH. After standing for 4 h at the room temperature, the mother liquors were then acidified (pH = 1) by the addition of HCl (6 M) and the product was removed by filtration, washed (cool water) and air-dried. The yield was 66%.
[Carboxymethyl(pyridin-2-ylmethyl)amino]acetic acid (L5): Iminodiacetic acid (6.55 g, 50 mmol) was added to a solution of 4.0 g (100 mmol) of NaOH in 20 mL of H2O and 60 mL of absolute ethanol. The solution was stirred vigorously. Solutions of 8.2 g (50 mmol) of 2-picolyl chloride-HCl in 17 mL of H2O and 4.0 g (100 mmol) of NaOH in 7 mL of H2O in separate addition funnels were then added over a period of 8 min. The reaction mixture was warmed to 70 °C and left to stir for 4 h. Then, an additional 4.0 g of NaOH was added, and the reaction mixture was stirred for another hour, after which the amber solution was evaporated, leaving a yellow solid. 50 mL of H2O was added, and the solution was acidified with concentrated HCl to pH 1.5. The white solid obtained was recrystallized from methanol. The yield was 35.7%.
The five ligands were characterized by FTIR and 1HNMR. The samples were characterized by FTIR using the potassium bromide compression method with a scanning range of 4000–500 cm−1 and 32 scans. The solvent choice for 1H NMR characterization was water.

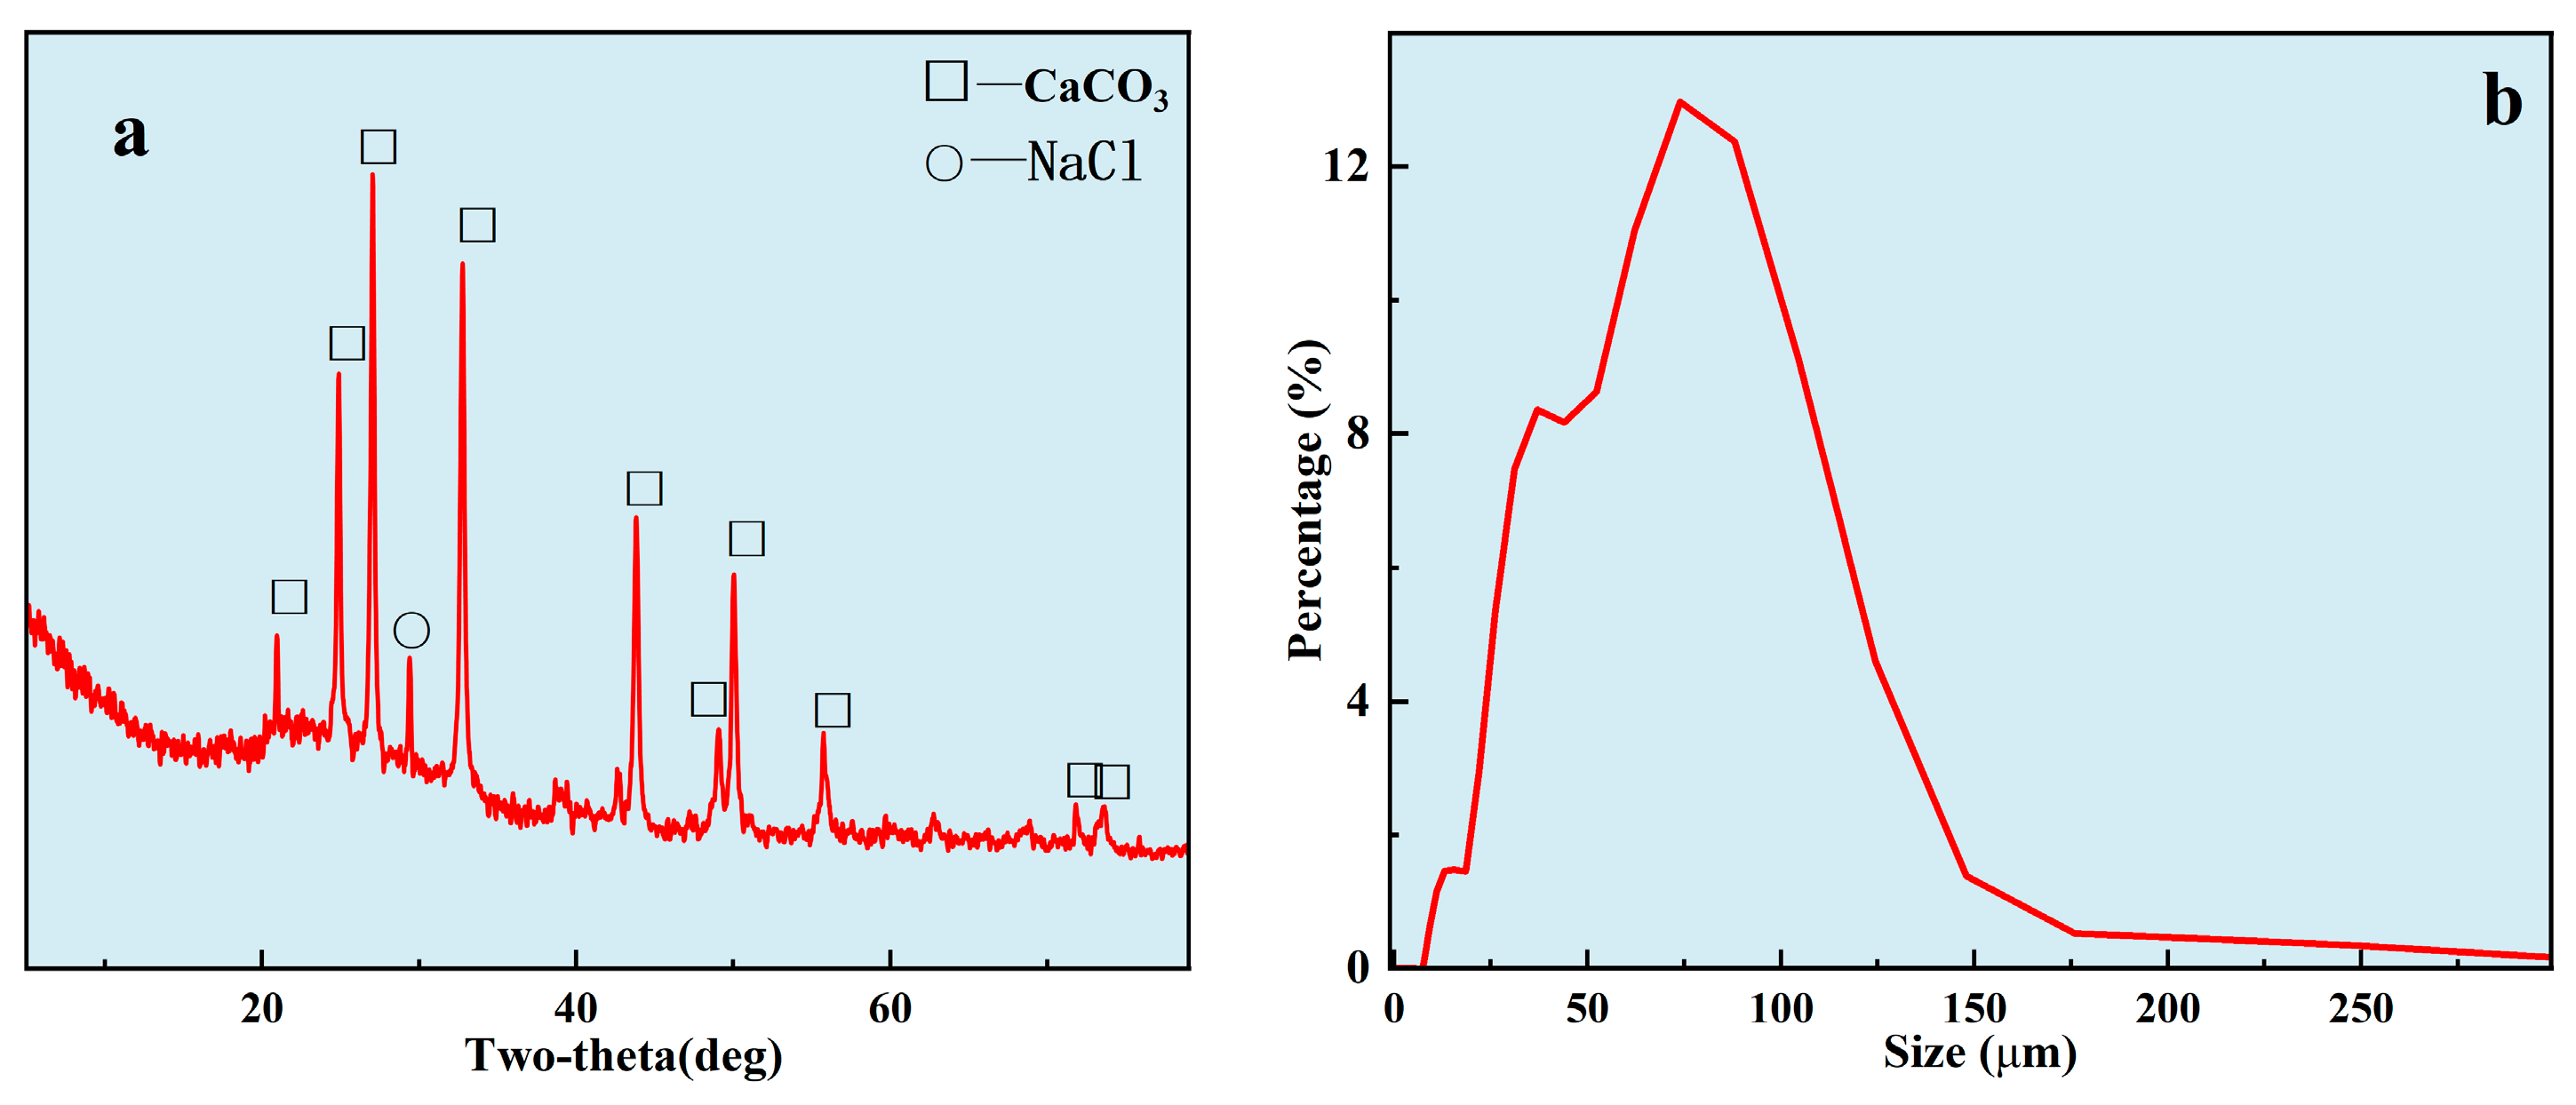
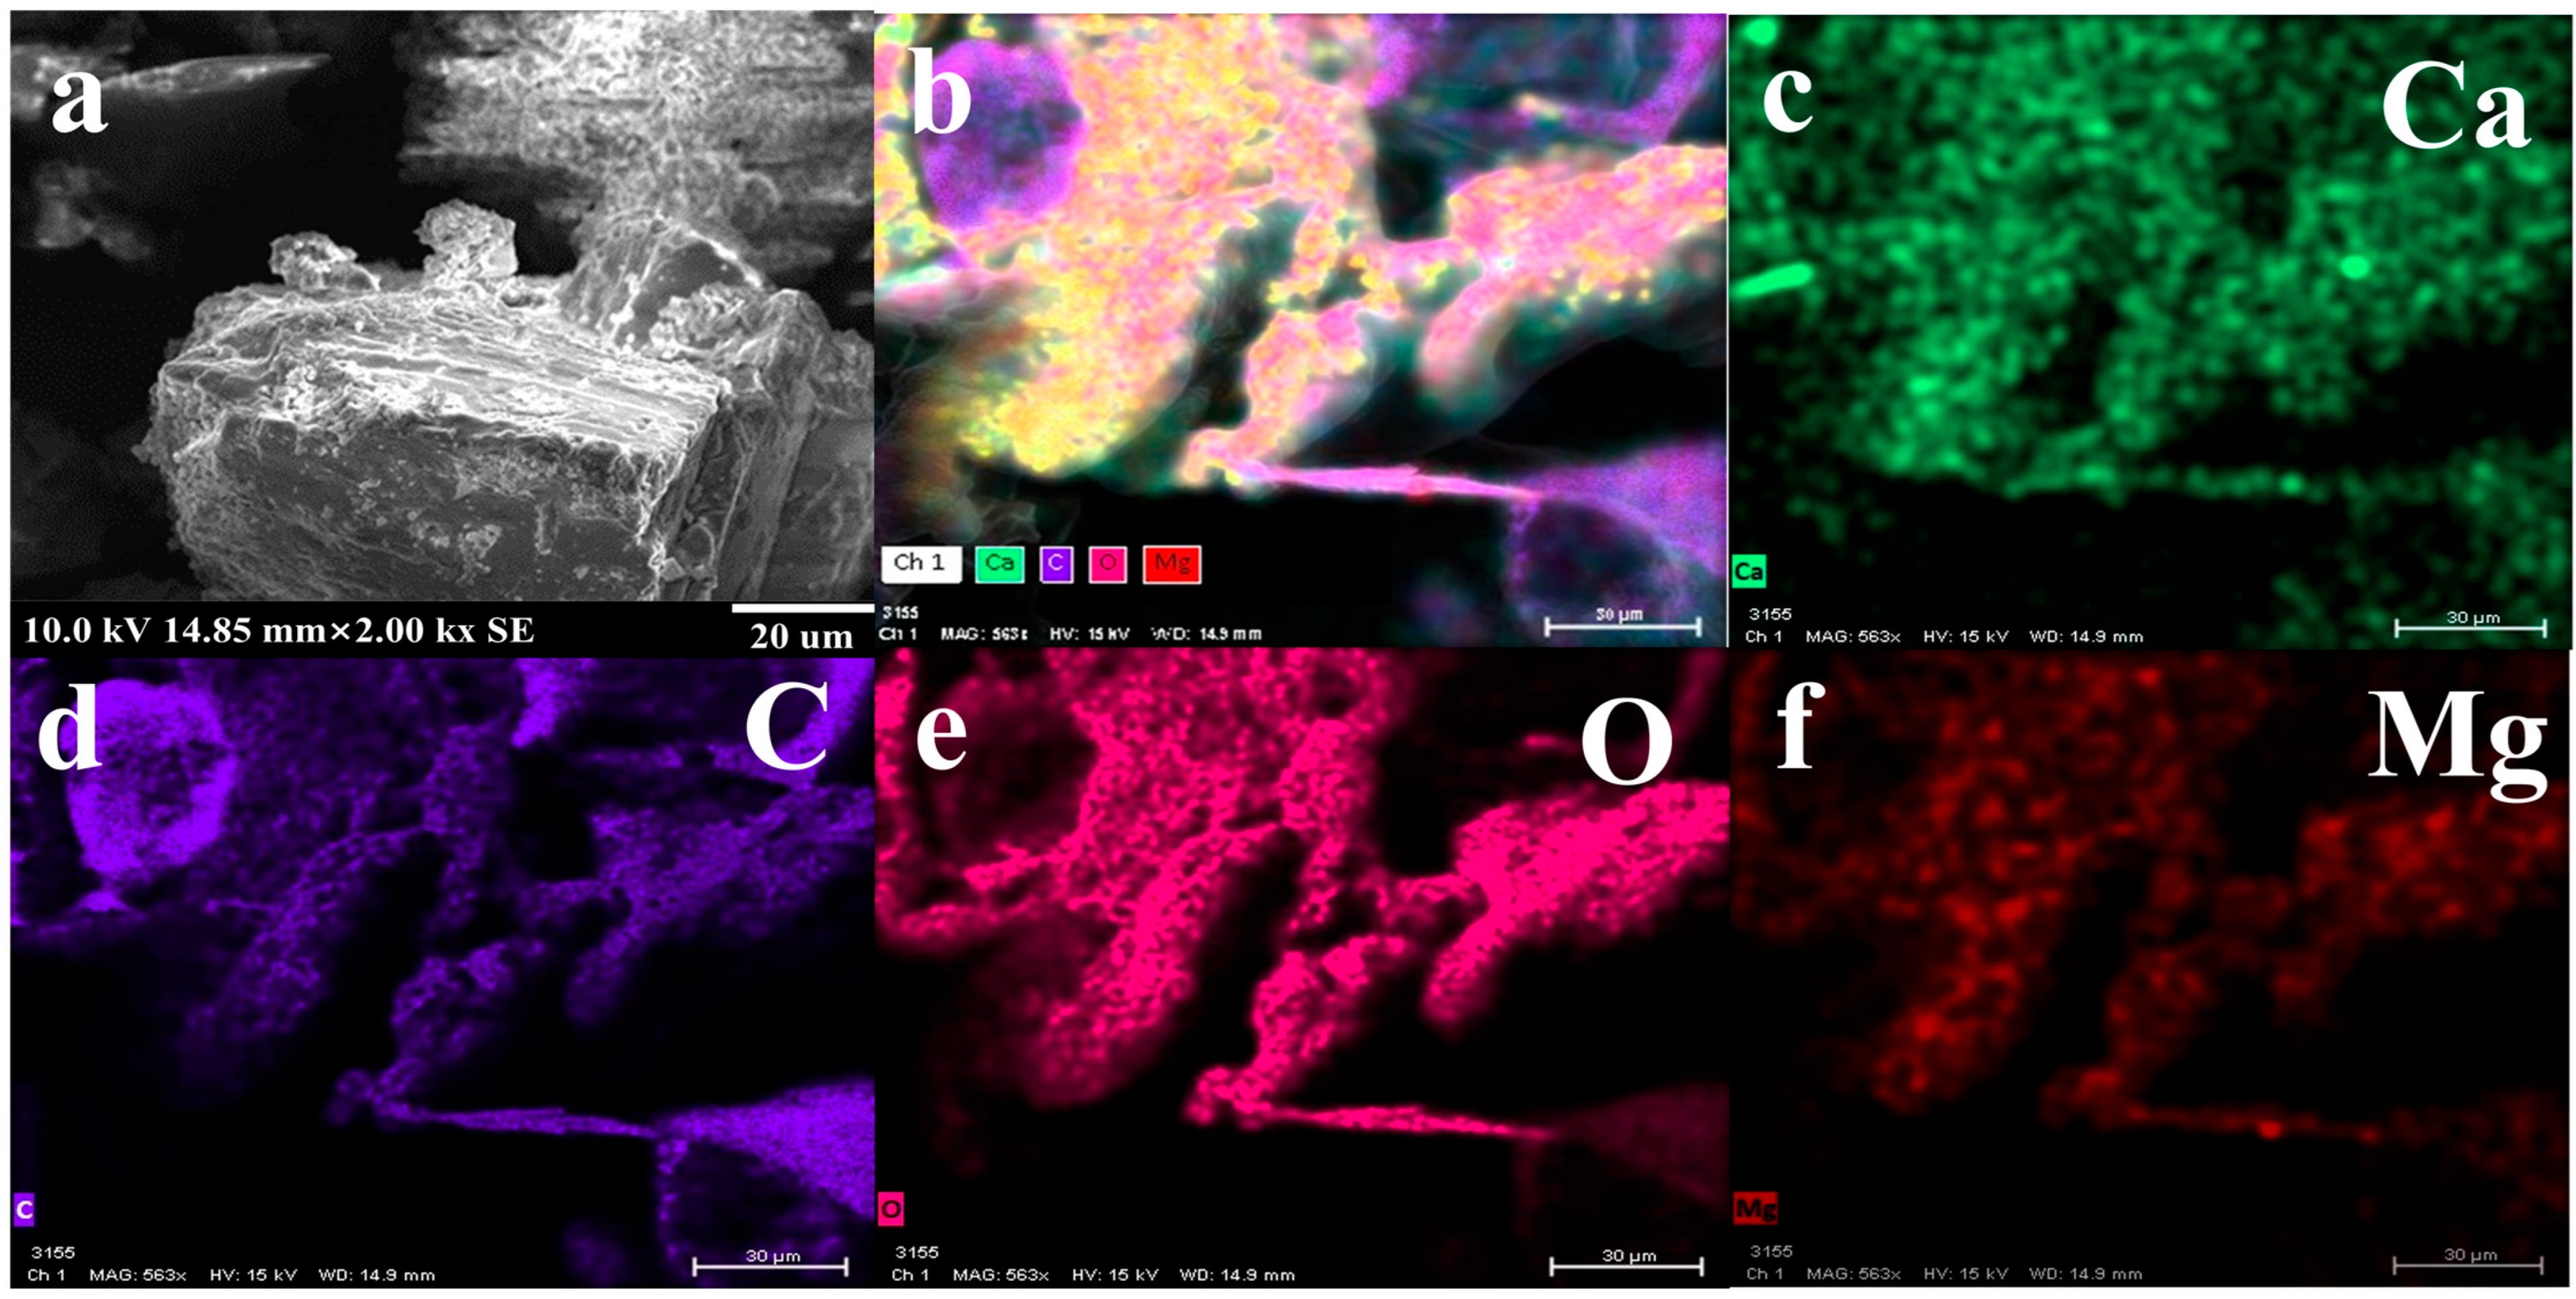
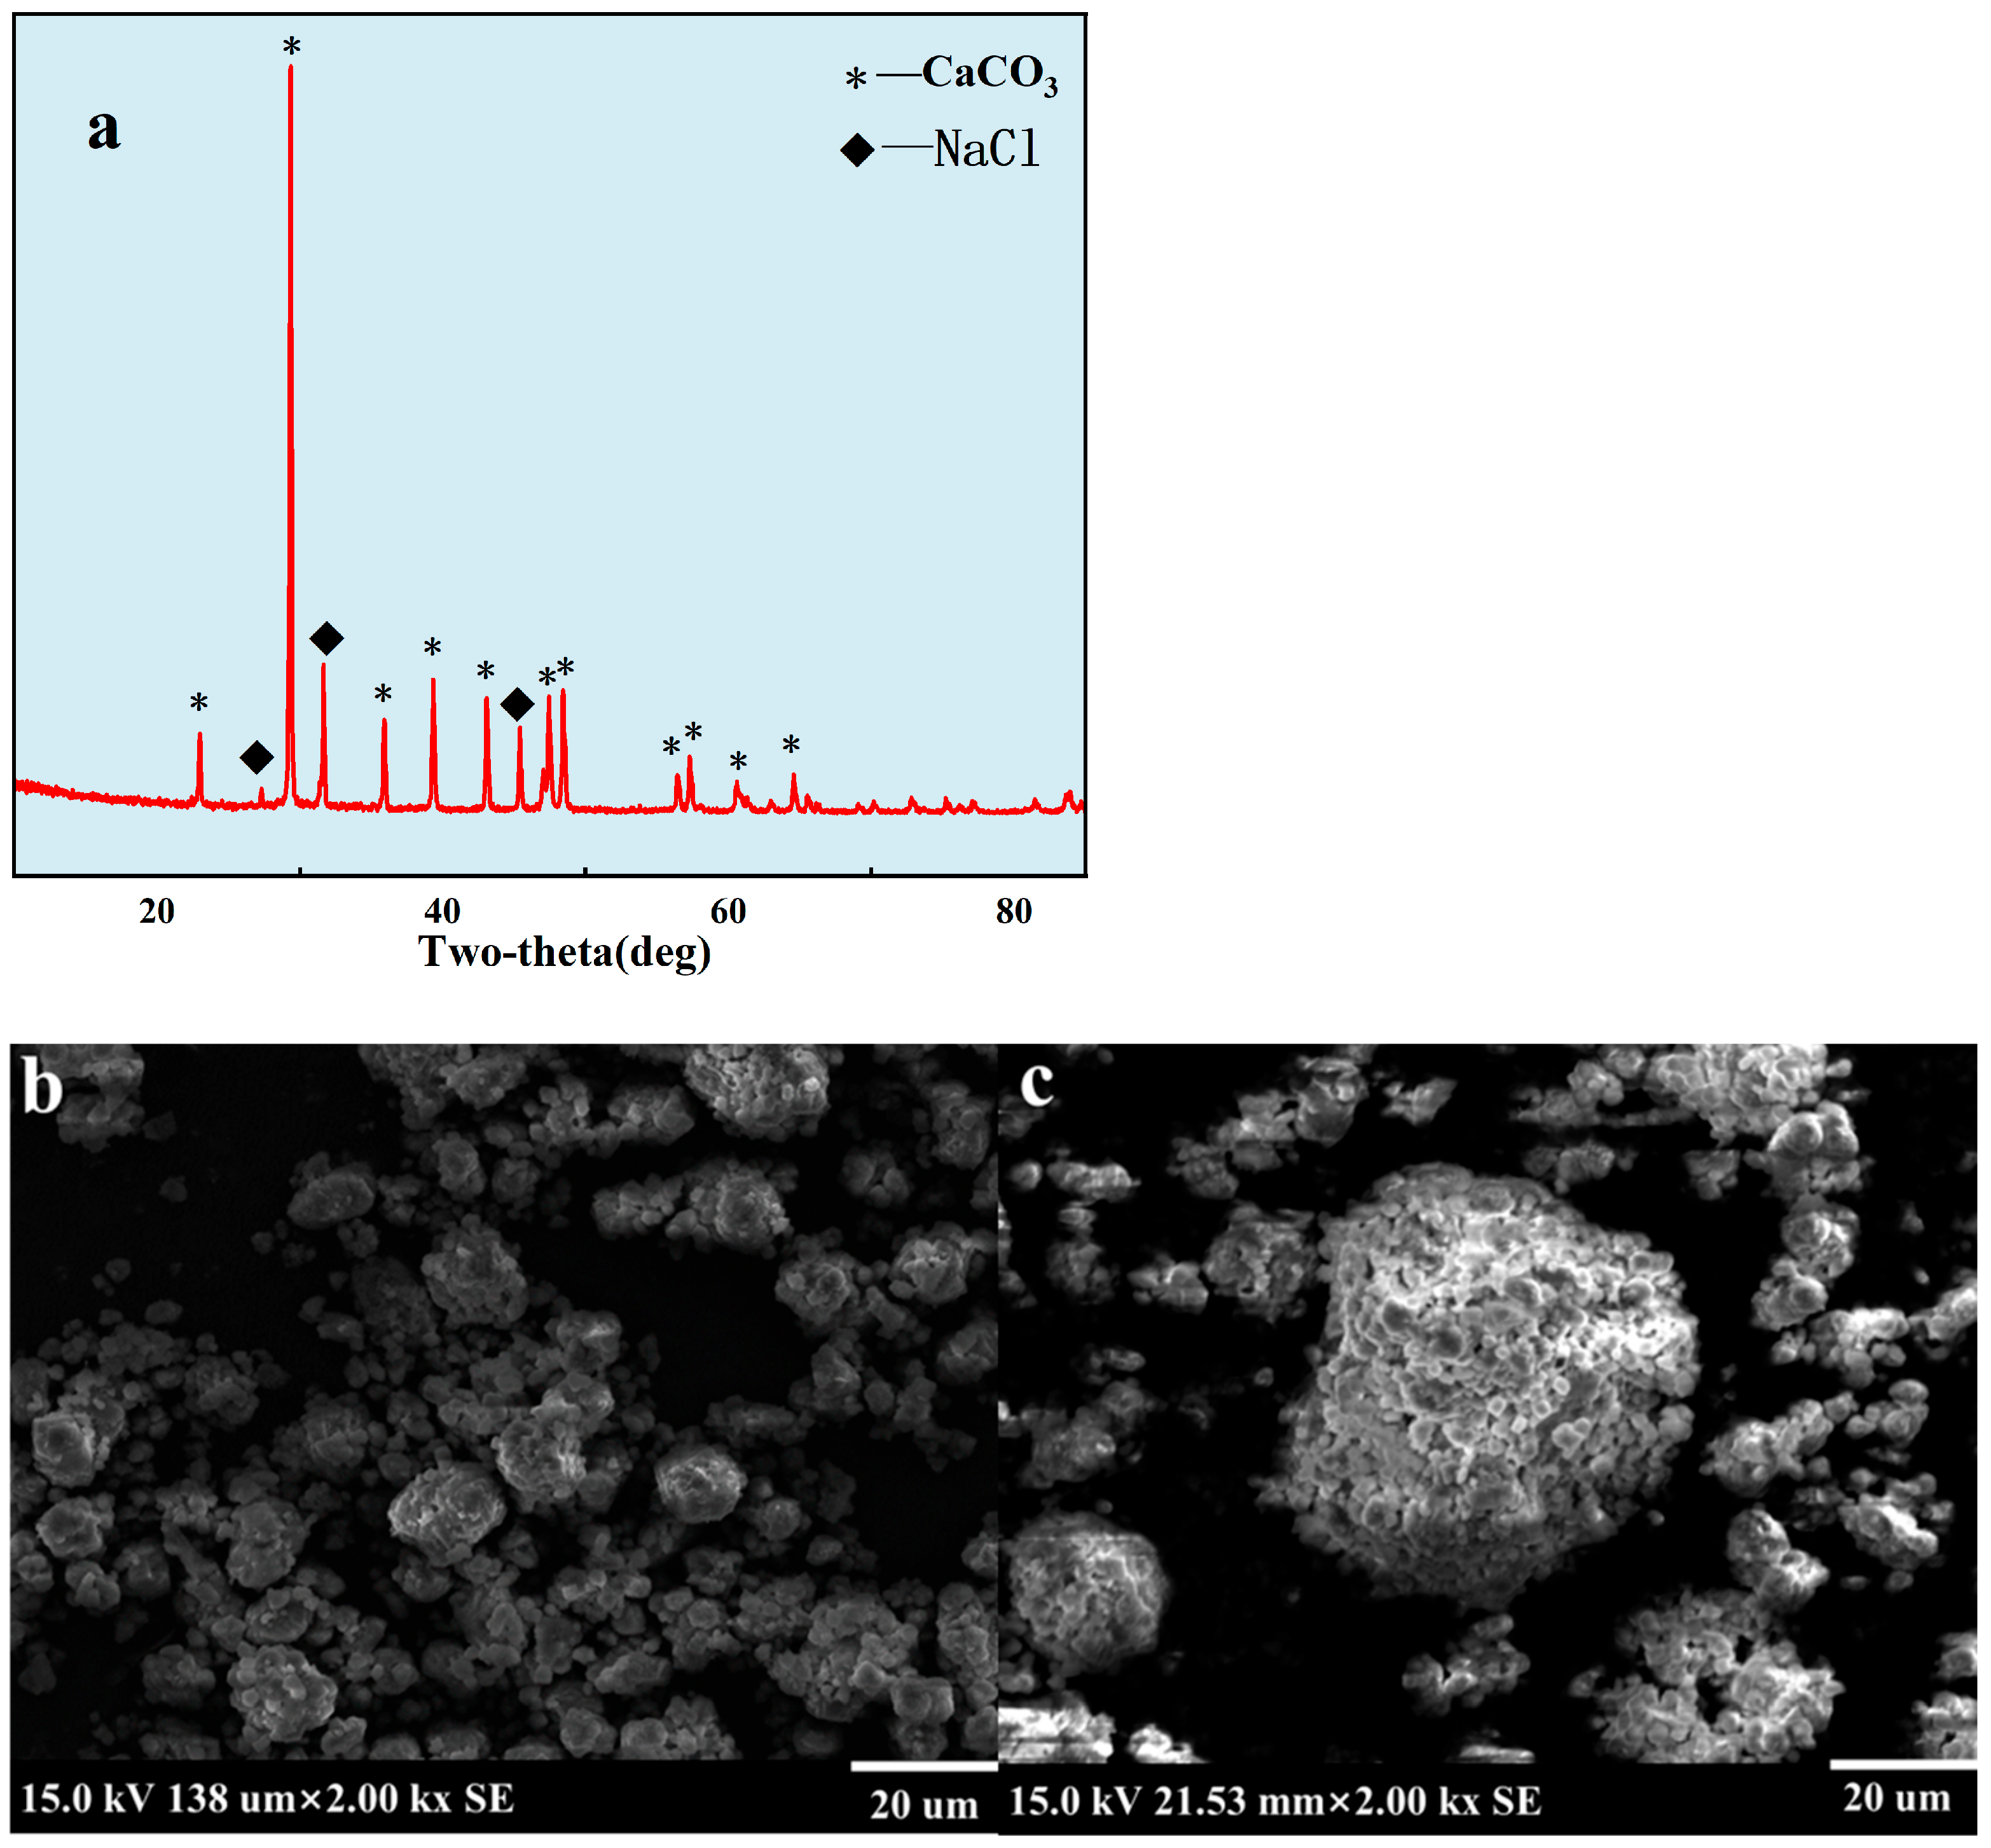
2.4. Properties of Scale under Uncontrolled Condition

In order to explore the effect of ligands on the size and morphology of coalesced particles, the coalesced particles without ligand control were first analyzed. After the simulated formation water had sat for 30 d, the scale in the water was filtered, dried in an oven, and then characterized by powder X-ray diffraction (XRD). The test conditions were as follows: operating voltage, 40 kV; operating current, 40 mA; scanning range, 5° to 40°; scanning speed, 2°/min. Scale particle size was analyzed with a S3500 laser particle size analyzer. The simulated formation water scale was treated ultrasonically for 20 min to test the particle size. The surface morphology of the particles was characterized by field emission scanning electron microscopy (SEM). A small amount of the sample was taken and pasted on a conductive adhesive and tested after gold spraying. The composition of the scale samples was determined by energy dispersive spectrometer (EDS). The sample was placed in an SEM sample chamber equipped with an EDS detector, which was used to analyze the chemical composition of the sample by converting its X-ray signal into energy spectrum data.

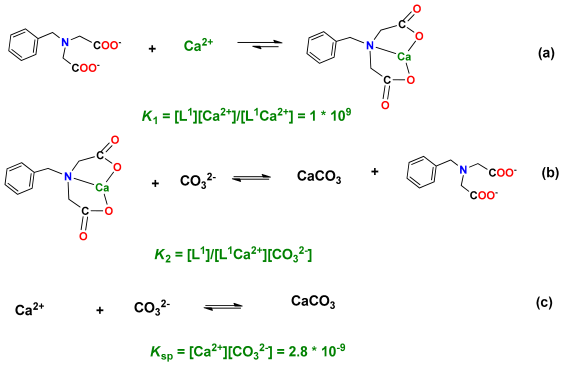
2.5. The Capturing of Ca2+ by L1–L5

In order to study the reaction of these ligands with Ca2+, ESI/MS was used to characterize them. The atomizer flow rate was 3 L/min, the drying gas flow rate was 10 L/min, and the heater flow rate was 10 L/min.

2.6. CaCO3 Particle Formation by Na2CO3 or NaHCO3

There is a dynamic equilibrium between ligands, CaCl2, and Na2CO3. This section mainly studies the reaction mechanism of ligands and Na2CO3 to generate CaCO3 particles. The stability constant is calculated as follows:
K = A X n c A c X c n
where (AXn)c represents the concentration of the complex, (A)c represents the concentration of the core substance, (X)c represents the concentration of the ligand, and n represents the number of ligands.
To determine the presence of micro-nanoparticles, excess Na2CO3 solution was gradually dripped in and kept at room temperature for at least 4 d to produce a white precipitate. The CaCO3 particles under the control of the ligands were characterized by XRD and SEM. The test method was the same as in Section 2.4.

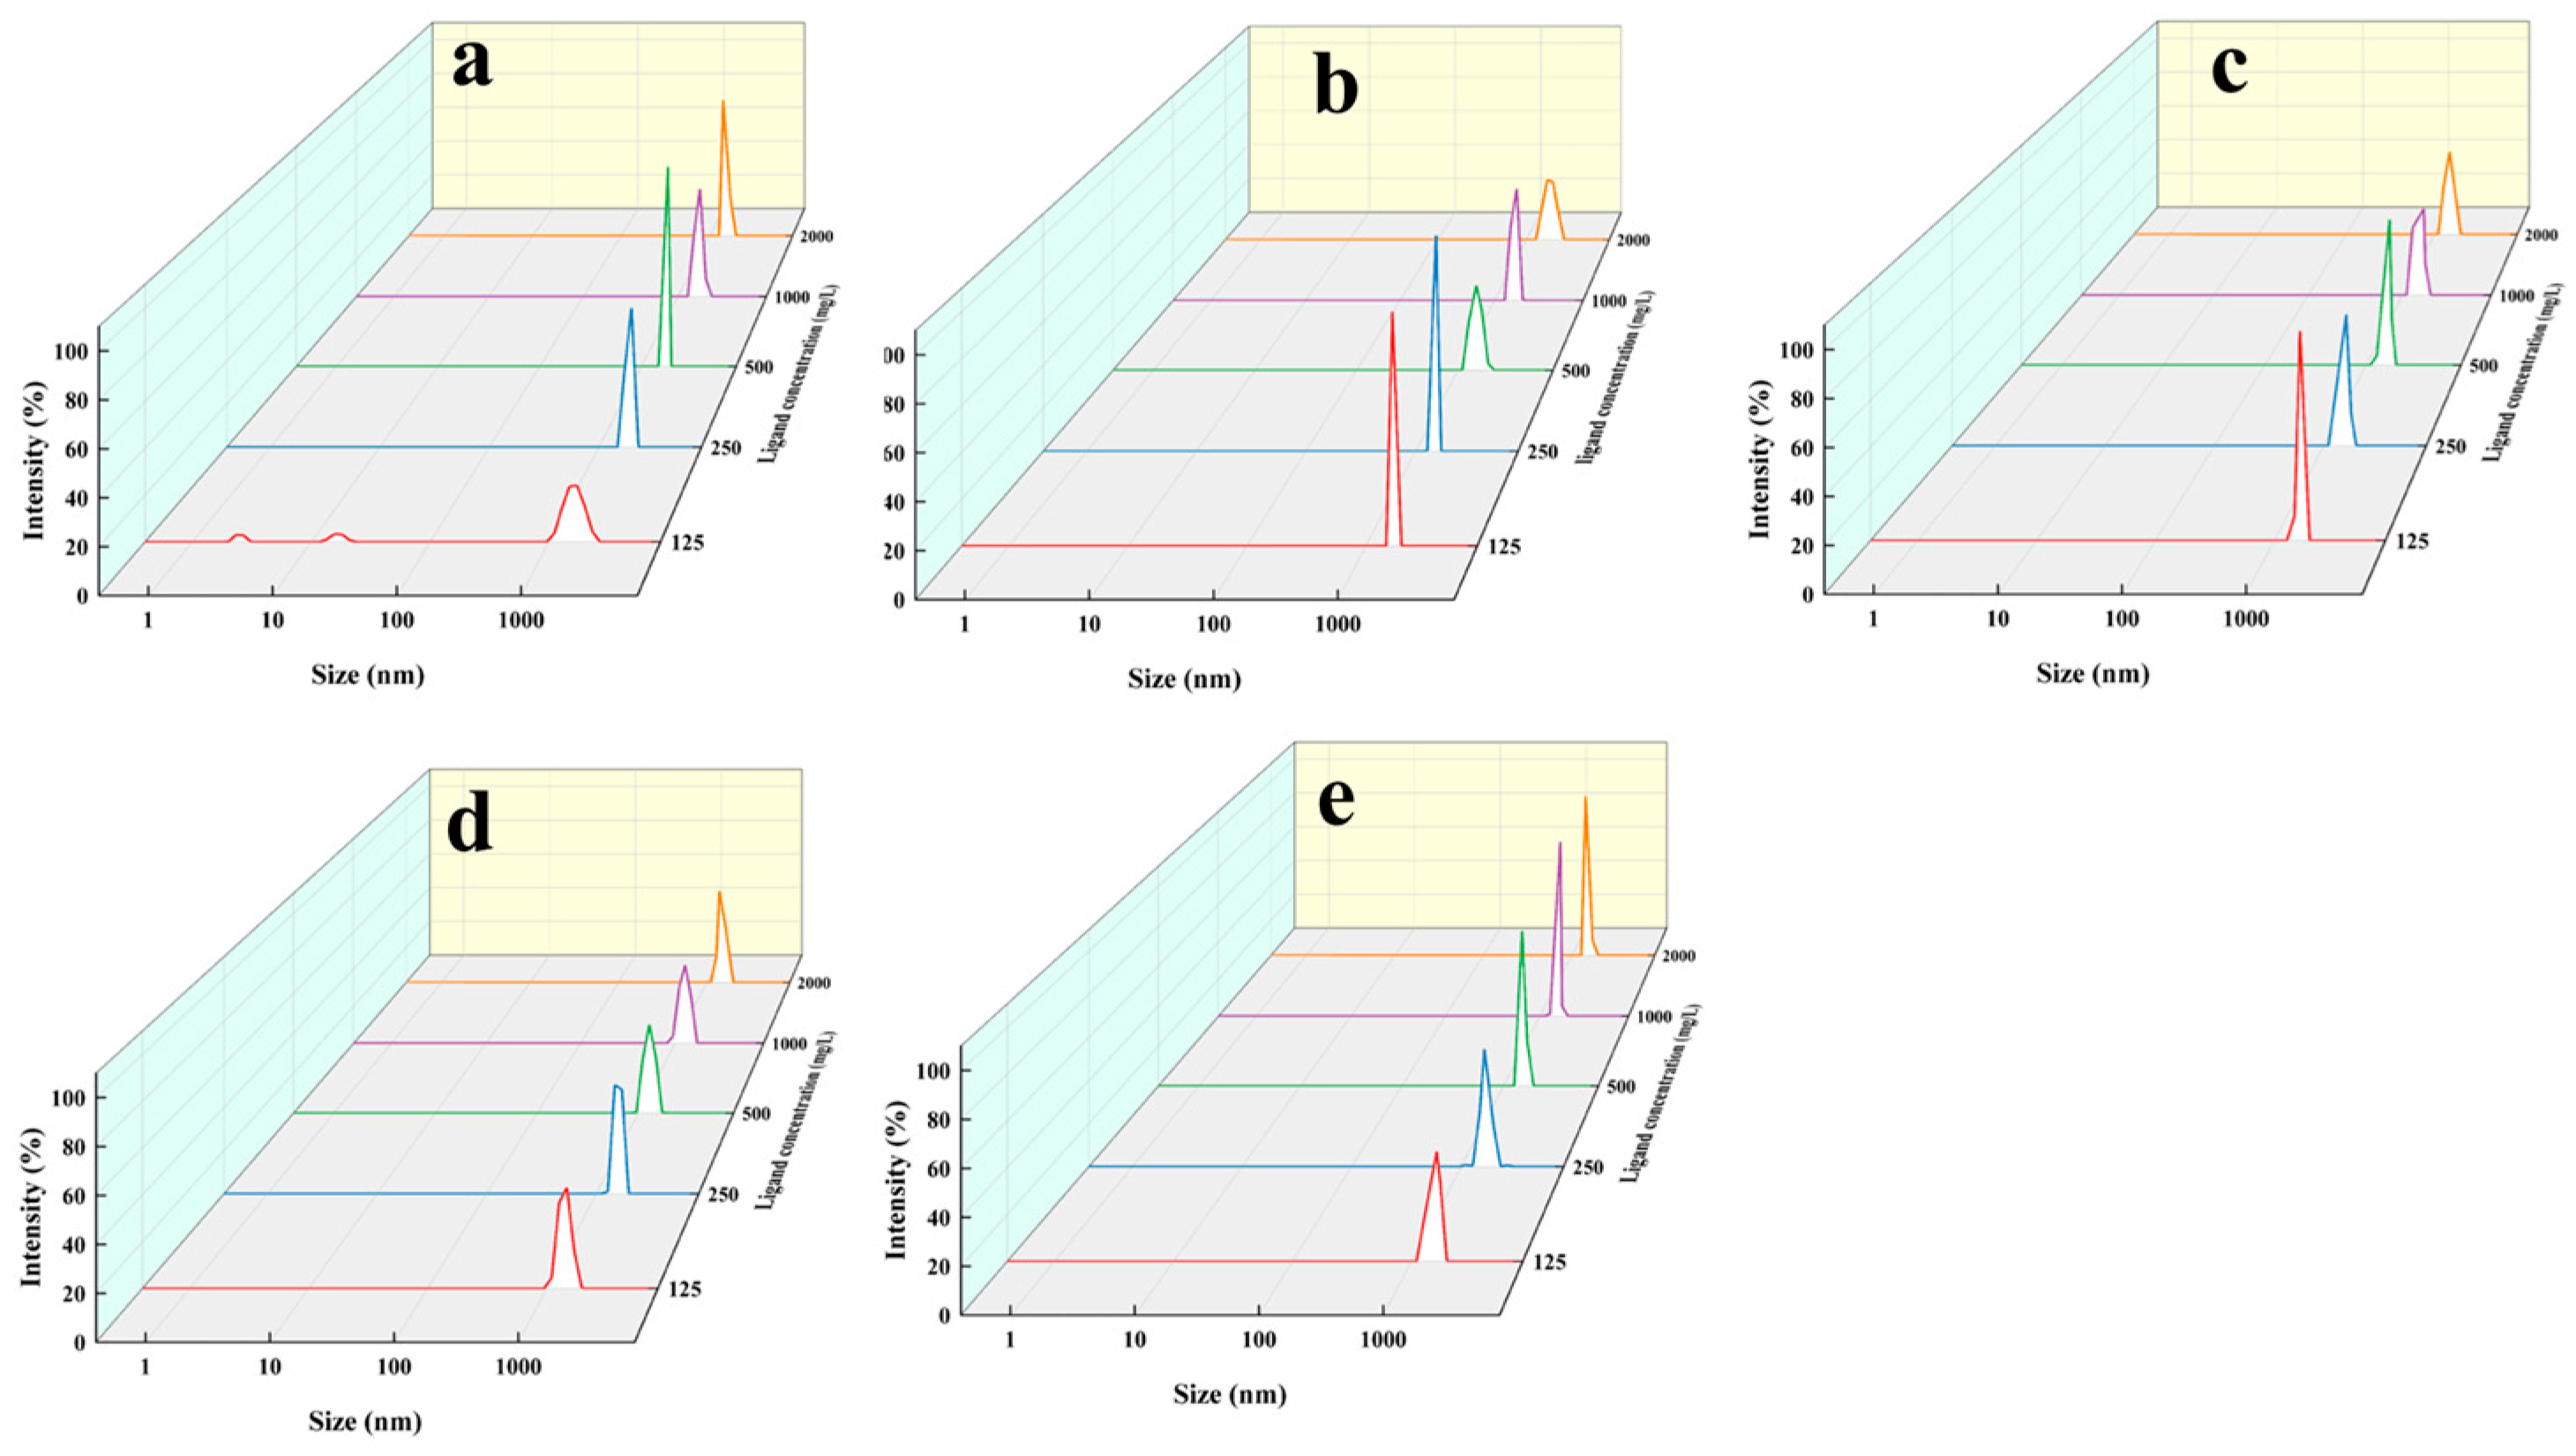
2.7. CaCO3 Nanoparticles Formation and Capturing Yield via L1–L5

In order to analyze the effects of L1–L5 on Ca2+ ion capture rate and CaCO3 particle size in the presence of NaHCO3 solution, the different ligands (L) were added, nCa2+/nL was changed, and the concentration of free Ca2+ ions was determined by atomic absorption spectrometry after sitting for 72 h. Plasma gas flow was 12 L/min, nebulizer flow was 0.7 L/min, and auxiliary gas flow was 0.4 L/min. After 20 min of sonication, the was placed in a cuvette and the particle size of the CaCO3 produced by the different ligands at different concentrations was measured using a Malvern laser particle size analyzer.
It was found that the ratio of nCa2+/nNaHCO3 also had an effect on the formation of CaCO3, but there was no obvious rule among the different ligands. In this paper, the L4 ligand was selected to set different proportions of nCa2+/nNaHCO3. The concentration of free Ca2+ ions and the particle size of the CaCO3 produced under different ratios of nCa2+/nNaHCO3 were determined by atomic absorption spectrometry and Malvern laser particle size analyzer, respectively, to determine the best ratio of nCa2+/nNaHCO3.
Since the particle size of CaCO3 particles is still large, it is necessary to further adjust the particle size by adding appropriate chemical reagents. According to previous studies, charged polymers such as polyaspartate (PASP) [31] and polyacrylic acid (PAA) [32] can stabilize amorphous calcium carbonate and may have mineralizing activity. In this paper, PASP was used to further control the size of CaCO3 particles. The amount of added polyaspartic acid (PASP) was changed, and the particle size under different PASP dosages was tested by Marvin laser particle size analyzer to explore the effect of the addition amount on the particle size of CaCO3.

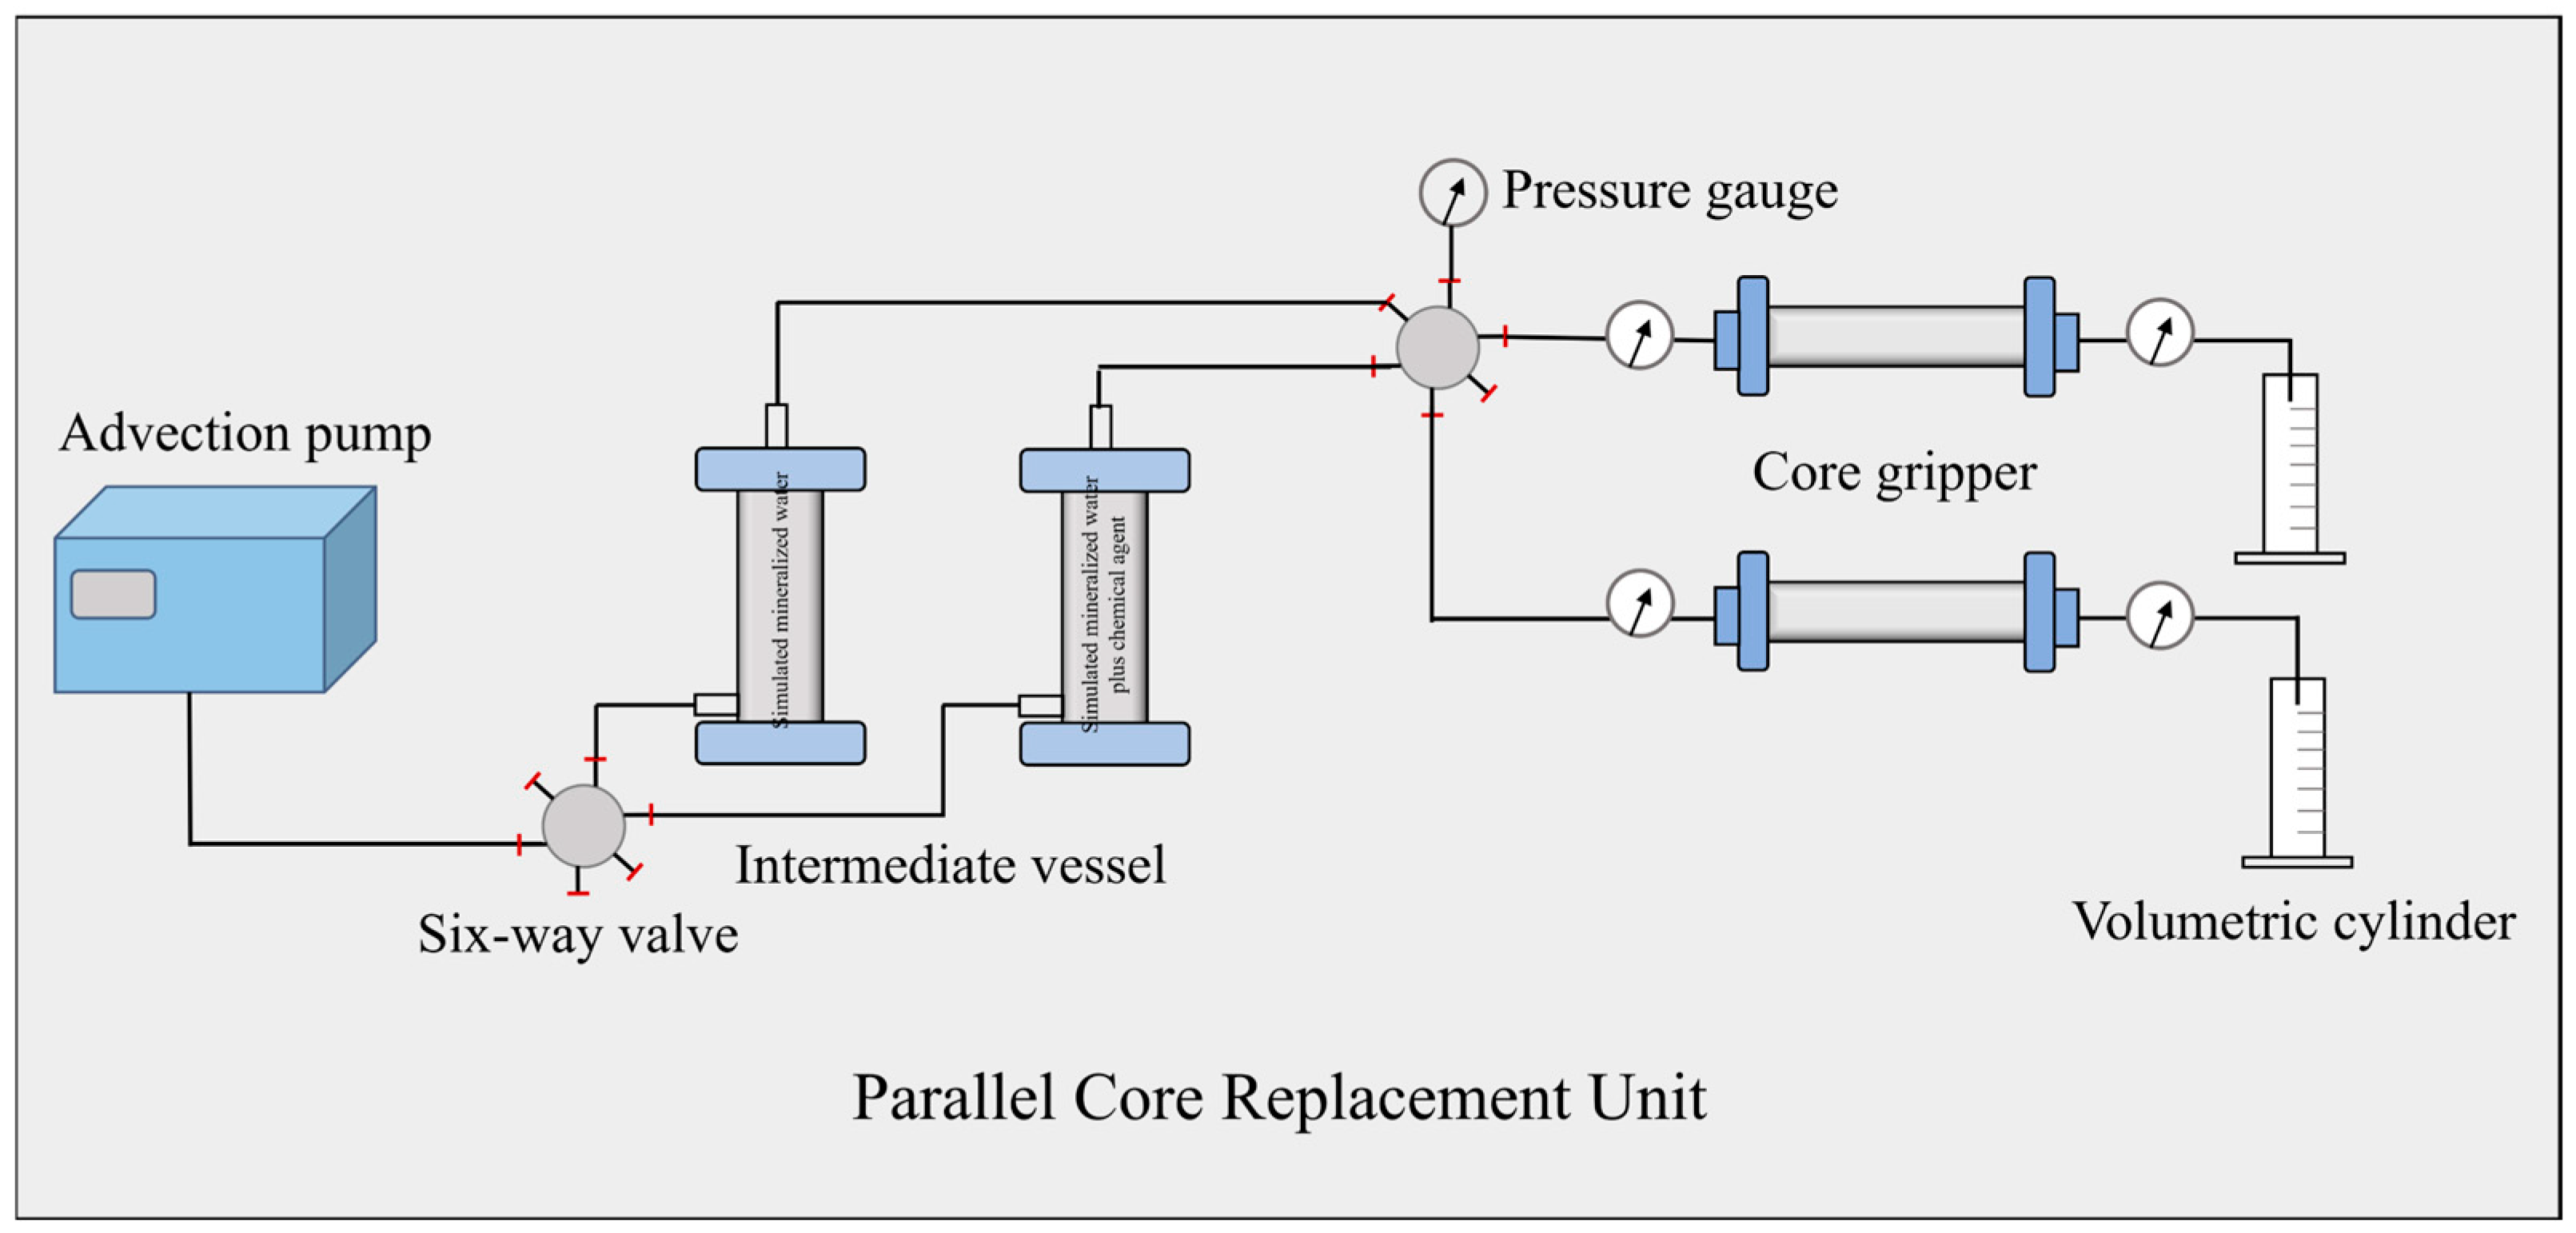
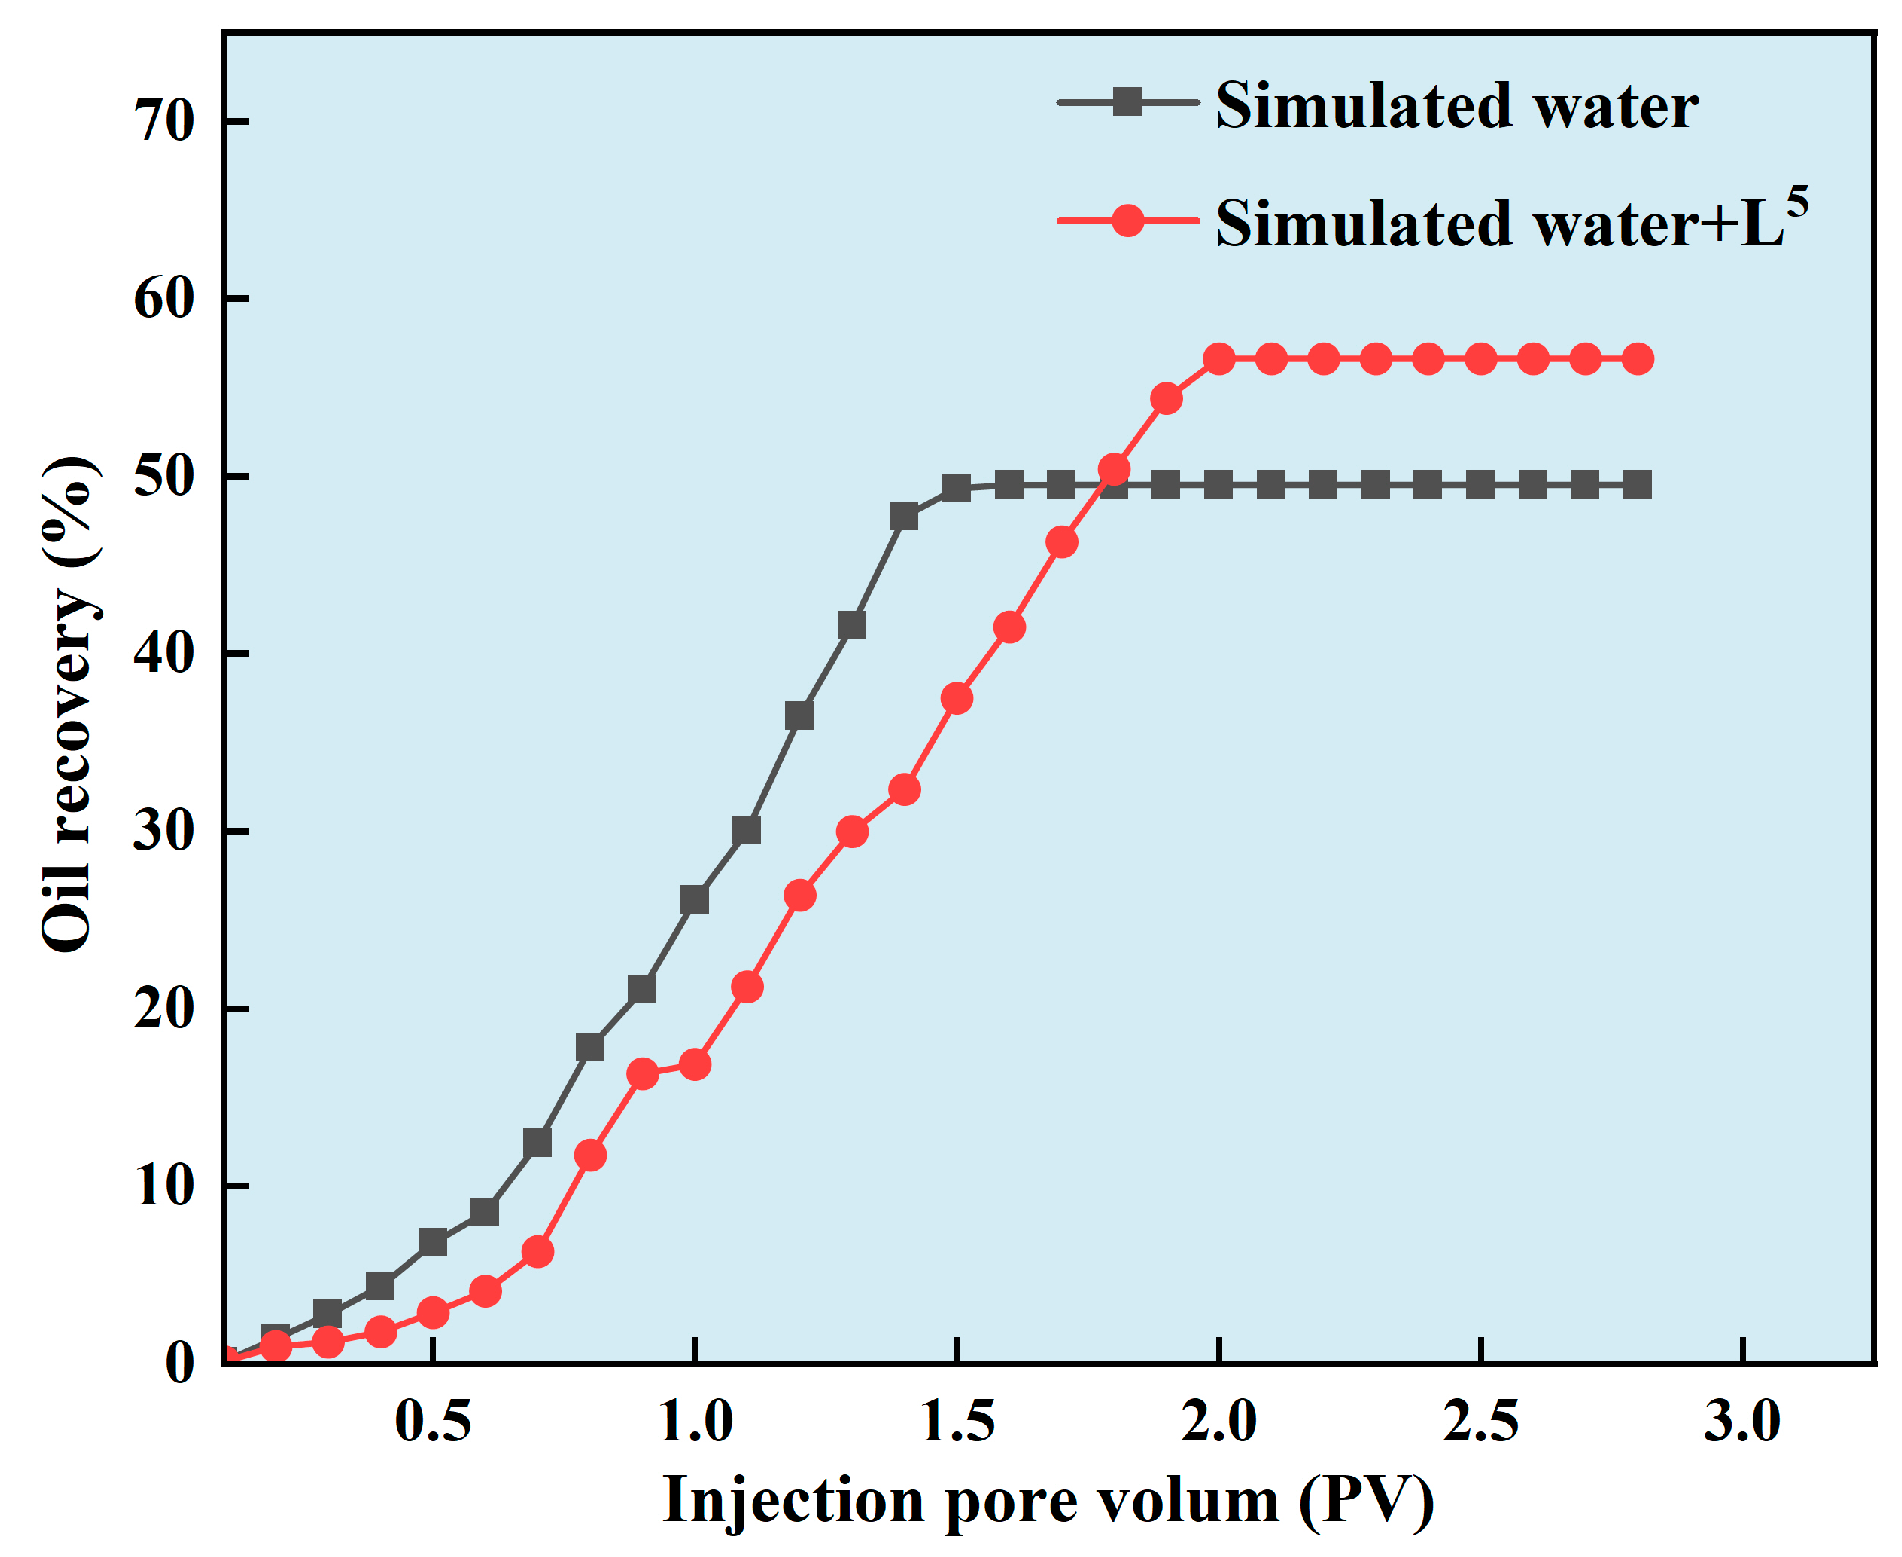
2.8. The Flooding Experiment

A single core replacement experiment was used to simulate the oil flooding of agglomerated particles. The water used in the experiment was simulated formation water, with a salinity of 107,216 mg/L; its main components and concentration are listed in the Table 1. The simulated formation water refers to the formation water of an offshore oil field in China, which is highly mineralised and can reflect the effect of an agent well. The oil used in the experiment was simulated oil, which was obtained by mixing crude oil and aviation paraffin in a ratio of 1:1 (density: 0.8893 g/cm3, viscosity: 17.5 mPa·s (50 °C)). An artificially homogeneous cylindrical core with a size of Ø2.5 × 10 cm was used for the experiment. The detailed experimental procedure was as follows:
  • Firstly, simulated formation water was placed in an intermediate container and injected into the core at a flow rate of 1 mL/min to establish the original water saturation. Core dry weight m1 and core wet weight m2 after water injection were recorded, respectively.
  • Simulated oil was then injected into the core to establish the original oil saturation. The simulated formation water was then injected into the core at a flow rate of 1 mL/min until no oil was produced. The injection volume and differential pressure were recorded, respectively, and the permeability was calculated via Darcy’s equation to get the recovery rate of the water flooding.
  • The simulated formation water with and without additive were placed in an intermediate container, respectively. The water drive recovery rate was calculated by injecting the core at a flow rate of 1 mL/min when the pressure was stable and no oil was produced. The experiment was repeated for each solution to avoid error. The detailed information can be seen in Figure 2.
The relevant calculation formula is as follows:
V = m 2 m 1 ρ
where V represents the effective pore volume in mL, m1 represents the dry weight of the core in kg, m2 represents the wet weight of the core in kg, and ρ represents the simulated formation water density in g/cm3.
n = V V 1
where n represents effective porosity, dimensionless; V represents effective pore volume in mL; and V1 represents core volume in mL.
K = Q μ l P A
where K represents the permeability of the aqueous phase in units of 10−3 μm2; Q represents the fluid flow rate through the core per unit time in units of cm3/s; µ represents the viscosity of the fluid in units of mPa·s; L represents the length of the core in units of cm; ΔP represents the difference in pressure between the inlet and outlet in units of MPa; and A represents the cross-sectional area of the core in units of cm2.

3. Results and Discussion

3.1. Preparation of Ion Regulator

N-Benzyl iminodiacetic acid (L1): The elemental analysis of calculation result for C11H13NO4 was C:H:N = 59.19%:5.87%:6.27% and the test results were C:H:N = 59.17%:5.89%:6.28%. The typical chemical shifts were δ 2.94 (s, 4H), 3.59 (s, 2H) and 7.26 (m, 5H).
2,2′,2″,2′′′-((1,4-phenylenebis(methylene))bis(azanetriyl))tetraacetic acid (L2): Figure 3 shows the FTIR result as υ(C=O) in 1732 and 1720 cm−1. The elemental analysis of calculation result for C16H20N2O8 was C:H:N = 52.17%:5.47%:7.61% and the test results were C:H:N = 52.15%:5.49%:7.64. The typical chemical shifts were δ 3.56 (s, 4H) and 7.26 (s, 4H).
Trans-2,2′,2″,2′′′-(cyclohexane-1,4-diylbis(azanetriyl))tetraacetic acid (L3): Figure 3 showed the FTIR result as υ(C=O) 1729 and 1714 cm−1. The elemental analysis of calculation result for C11H13NO4 was C:H:N = 48.55%:6.40%:8.09% and the test results were C:H:N = 48.47%: 6.35%: 8.14%. The typical chemical shifts were δ 1.05 (q, 4H), 1.72 (q, 4H), 2.35 (s, 2H), 3.07 (s, 8H).
Nitrilotriacetic acid (L4): Figure 3 shows the FTIR result as υ(C=O) 1740 and 1725 cm−1. The elemental analysis of calculation result for C6H9NO6 was C:H:N = 37.70%:4.75%:7.33% and the test results were C:H:N = 37.72%:4.71%:7.36%. The typical chemical shift was δ 3.01 (s, 6H).
[Carboxymethyl(pyridin-2-ylmethyl)amino]acetic acid (L5): Figure 3 shows the FTIR as υ(C=O) 1727 and 1718 cm−1. The elemental analysis of calculation result for C10H12N2O4 was C:H:N = 53.57%:5.39%:12.49% and the test results were C:H:N = 53.58%:5.37%:12.51%. The typical chemical shifts were δ 3.70 (s, 4 H), 4.41 (s, 2 H).

3.2. Properties of Scale under Uncontrolled Condition

First, the scale samples without ligand control were analyzed, as shown in Figure 4. This simulated real scale formation, and especially the size distribution. The XRD of the scale was consistent with the standard diffraction pattern of CaCO3 (Figure 4a). The typical peaks were 21.00°, 24. 90°, 27.05°, 32.78°, 43.85°, 50.07°, 55.80°, 71.97°, and 73.59°. It was a typical calcite. The particle size of the scale was analyzed by S3500 laser particle size analyzer (Figure 4b). The median particle diameter (D50) was 56.02 μm. The mean volume diameter, mean number diameter, and mean area diameter were 78.08 μm, 26.64 μm, and 59.02 μm, respectively. It had a high particles size under the uncontrolled condition. The surface morphology of the particles was also characterized by SEM in Figure 5a. The surface of the particles was very rough and irregular under the uncontrolled condition. This indicated that the rough surface improved the specific surface of the particles, resulting in the micro-particles easily adsorbing onto the surface particles to form scale. In other words, it was also necessary to modify the surface of the particles to inhibit the adsorbing of the particles. Furthermore, the surface of composition was initially determined by EDS (Figure 5b–f). This revealed that it was mainly composed of O (38.3%), Ca (36.7%), C (14.3%), and Mg (8.2%). Combined with the results of EDS, the scale was mainly composed of CaCO3 (~95.3%). Combining this with Figure 4a,b, it can be confirmed that, under normal conditions, the CaCO3 precipitate formed easily and its particle size was big, which means it can block the pipeline easily and cannot be utilized directly. Hence, it is necessary to control the size of the particles and modify the surface of the particles such that they can flow with the formation water, thus realizing the sustainable utilization of Ca2+ in formation water.

3.3. The Capturing of Ca2+ by L1–L5

All multi-dentate O-containing chelated ligands in this paper could form stable complexes with Ca2+ and Mg2+. Therein, the reactions of these ligands with Ca2+ were investigated. L1 was a typical tri-dentate ligand, which could easily chelate Ca2+ in H2O. The ESI/MS results (Figure A1) showed a predominant peak appearing at m/z = 262, which was assigned to the species of [L1 + Ca2+ − H]+ (Figure 6). The result indicated that the mole ratio of L1 and Ca2+ was 1:1. L2 and L3 were also used to react with Ca2+. ESI/MS results showed two peaks appearing at the m/z = 423, and 445, respectively, which were assigned to [L2 + 2Ca2+ − 3H]+ and [L3 + 2Ca2+ − 3H]+. The mononuclear species were not found due to the steric effect. To tune the solubility in H2O, the different cyclohexyl and phenyl groups in L2 and L3 were used. L4 and L5 were typical of tetra-dentate ligands and had a stronger ‘chelated effect’ [25] than those of L1–L3. ESI/MS results showed the predominant peaks appearing at m/z = 230 and 263, respectively, which were assigned to [L4 + Ca2+ − H]+ and [L4 + Ca2+ − H]+ (Figure 6). From the above analysis, it can be confirmed that Ca2+ can be effectively captured by L1–L5 because more carboxyl functional groups can chelate more Ca2+.

3.4. CaCO3 Particle Formation by Na2CO3 or NaHCO3

Based on the ESI/MS investigation, these additives can quickly form stable complexes with Ca2+ when the mole ratio of ligand and Ca2+ is 1. The addition of excess Na2CO3 did not generate any obvious white precipitation, even when the mixture was left standing for over 3 days, with the presence of the previously described complexes, while the white CaCO3 precipitation was immediately observed in the absence of these ligands. Although the white CaCO3 precipitation could not be observed in the presence of these ligands, micro-nanoparticles were gradually formed. This result revealed the presence of a dynamic equilibrium between the ligand, CaCl2, and Na2CO3. Taking L1 as an example, L1 can form a complex with Ca2+ with the stability constant K1 (~1 × 10⁹) (a). The large stability constant indicated that the Ca2+ in aqueous phase was nearly completely captured by L1. When Na2CO3 was added, Ca2+ would combine with CO32− to generate the micro-nanoparticle of CaCO3 (Ksp ~ 2.8 × 10⁻⁹) (b). Thus, the total reaction was (a) + (b) → (c). According to K1 × K2 = 1/Ksp, K2 = 1/(Ksp × K1) = 0.36. On the other hand, the formation rate (R) of CaCO3 was significantly lowered due to the formation of a stable complex [L·Ca2+]. The CaCO3 precipitation was not formed in the presence of L1 mainly due to the very low concentration of Ca2+ in the reaction system.
Nanomaterials 14 01452 i001
The XRD pattern was very consistent with that of the standard CaCO3 sample. The typical peaks were 23°, 29°, 36°, 39°, 43°, 47.5°, and 48.5°. It was a typical calcite characteristic peak (Figure 7a). SEM showed that a spherical shape could be clearly observed (Figure 7b,c). It also can be observed that the particles were relatively dispersed and showed a size of about 800 nm (Figure 7c), which was a smaller size compared to that of the uncontrolled CaCO3 particles. Generally, high specific surface energy with more micro-nanoparticles coalescence to form micrometer-sized particles, and more smaller nanoparticles are expected to be formed under controlled conditions. This provided the possibility of enhanced oil recovery with micro-nanomaterials.
The above experiments demonstrated that synthetic ligands could capture Ca2+ effectively in the aqueous phase when mole ratio of L and Ca2+ exceeded 1. Thus, when Na2CO3 was added, the CaCO3 precipitate was not formed immediately. However, CaCO3 precipitate rapidly formed when mole ratio of ligand and Ca2+ was lower than 1. To simulate the real situation in the oilfield, NaHCO3 was used instead of Na2CO3 due to HCO3 needing to dissociate to CO32−, resulting in a CaCO3 precipitate that was relatively slow. Three possible equilibration reactions of NaHCO3 occurred.
HCO3 + H2O = H2CO3 + OH
HCO3 + H2O = CO32− + H3O+
H3O+ + OH = 2H2O
In a typical 0.1 M NaHCO3 aqueous solution, the pH value was close to 8.34. c(HCO3), c(CO32−) and c(H2CO3) was close to 9.8 × 10⁻² M, 9.8 × 10⁻⁴ M, and 9.8 × 10⁻⁴ M, respectively, (Ka1(H2CO3) = 4.5 × 10⁻⁷ and Ka2(H2CO3) = 4.7 × 10⁻¹¹). Thus, c(CO32−) was much lower than that of Na2CO3 and no obvious precipitate was found when NaHCO3 was used instead of Na2CO3 in CaCl2 solution.

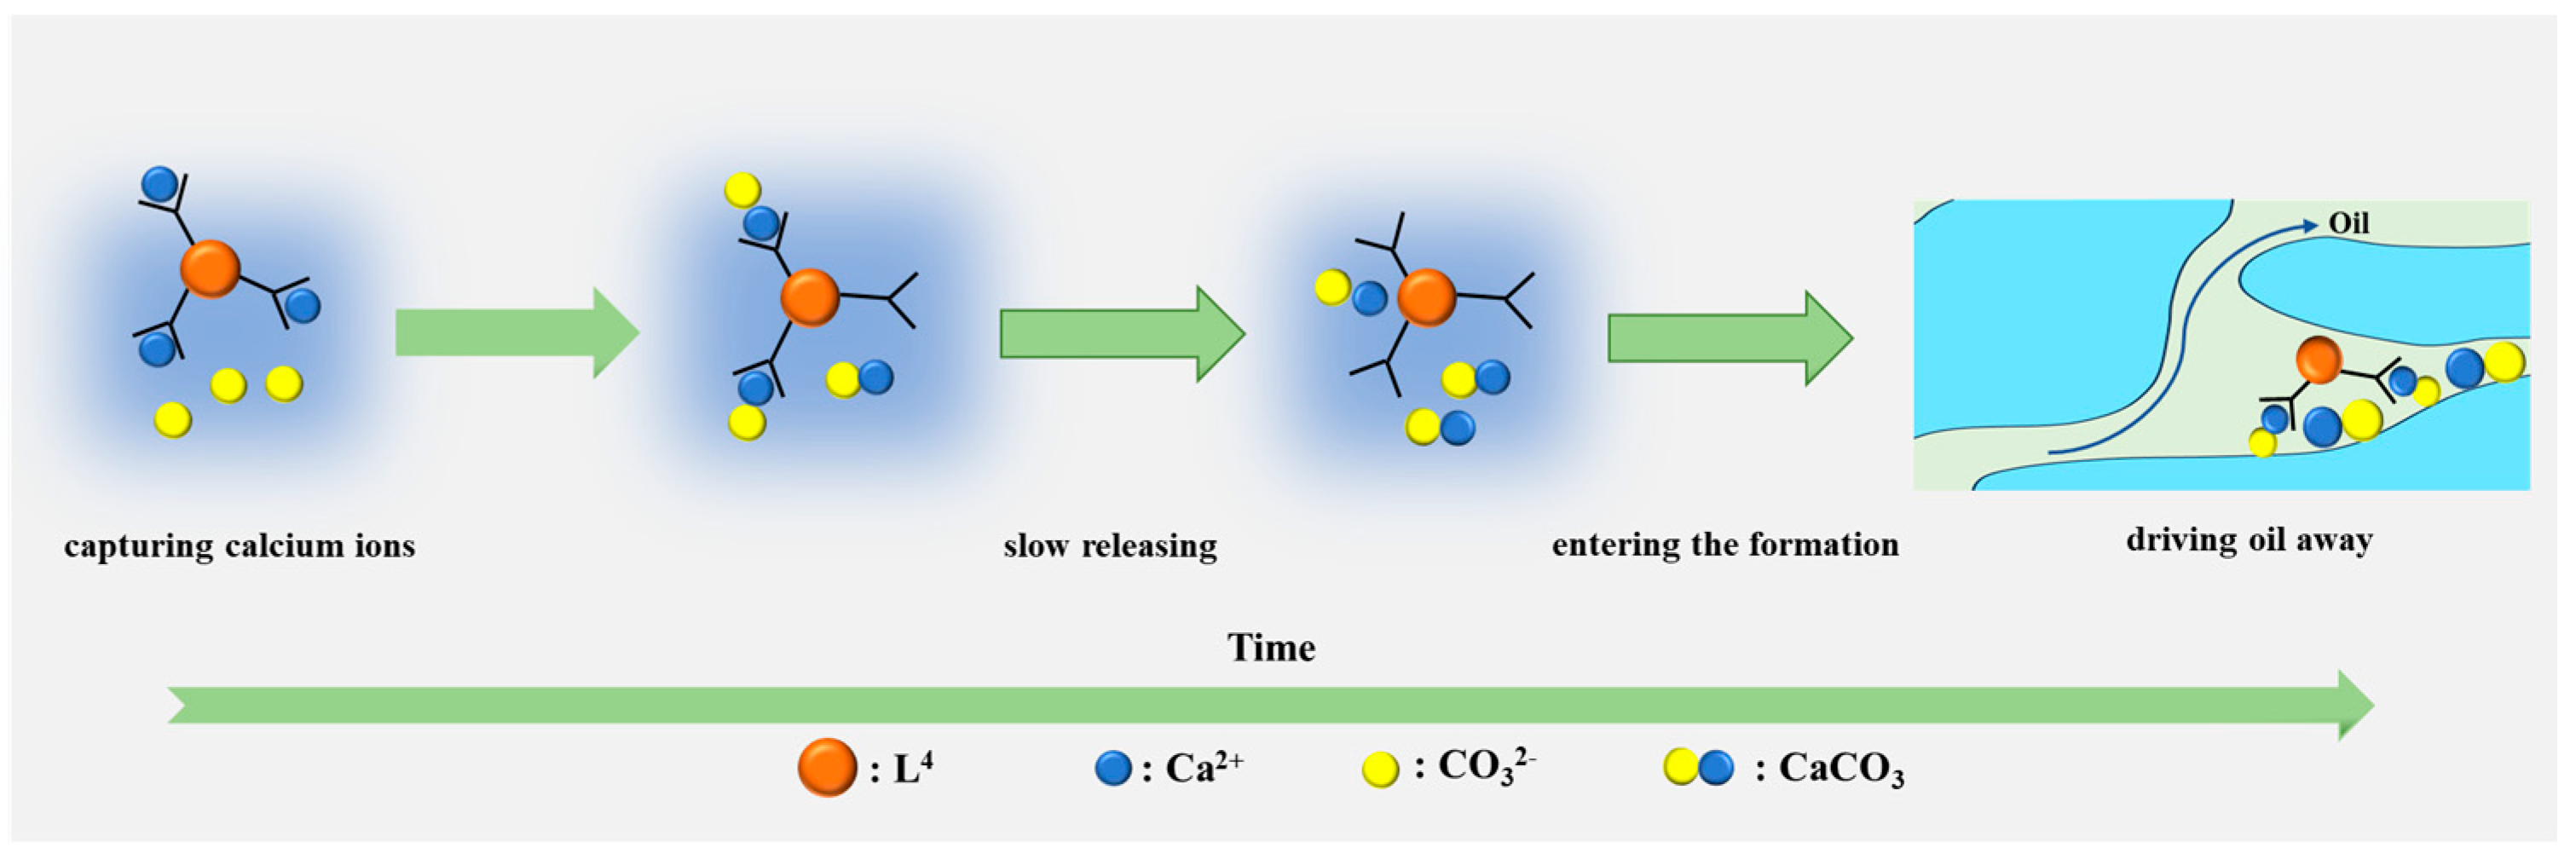
3.5. CaCO3 Nanoparticles Formation and Capturing Yield via L1–L5

The initial concentration of c(Ca2+) was 460 mg/L. From Figure 6, it can be found that L2 and L3 could capture more Ca2+, but the capturing yield was not higher in Table 2. Complexes formed with ligands stronger than L4 are likely to release less Ca2+. The Ca2+ in solution can be fixed via two possible pathways: One was the formation of CaCO3, and another was the formation of stable complexes with ligands. As shown in Table 2, among the six ligands (L1 to L5), L4 exhibits the max Ca2+ capturing yield. When c(L4) increased from 125 mg/L to 250 mg/L (nCa2+/nL4 16.5:1 to 8.22:1), the free c(Ca2+) in aqueous solution was significantly reduced, and the capturing rate increased from 73.0% to 87%. While the c(L4) further increased from 250 mg/L [(nCa2+/nL4~8:1)] to 2000 mg/L [(nCa2+/nL4~1:1)], the Ca2+ capturing yield did not increase significantly. Therefore, the optimal ratio of nCa2+/nL4 was ~8:1. The mean area diameter of particle size was near 1300 nm using L4. It was lowest among the ligands. In other words, when L4 was used, it had highest capturing yield and smallest particle size.
L1 was a tridentate ligand and its complex with Ca2+ had relatively smaller stability constants than those of L4 and L5. As shown in Table 2, the capturing yield of Ca2+ for L1 was in the range of 64.1–69.0%, which was essentially identical to those of the bis(tridentate) ligands L2 and L3 (61.4–69.0%). The particle sizes of CaCO3 for L1 (1451 nm~1896 nm) were also similar to those for L2–L3 (1380–1843 nm). These results indicated that no obvious ‘cooperation effect’ for these bis(tridentate) ligands existed. Actually, the tridentate units of L1–L3 at the same mass concentration were very close. These ligands, in theory, have similar stability constants. Based on the above results, Ca2+ in solutions was mainly bound via the formation of CaCO3 rather than Ca2+ complexes.
Among these ligands, L4 and L5 are tetradentate ligands. As compared with L1, L5 has an additional pyridyl ring. The capturing yield of L5 (65.4–69.0%) was slightly increased as compared with those of L1/L3. The particle sizes of CaCO3 for L5 (1469 nm to 1654 nm) were also smaller than those of L1 and L3. These results revealed that tetra-dentate ligand (L5) exhibited a better performance than those of the tridentate ligands (L1–L3). In L4, a carboxyl group was used instead of the pyridyl ring in L. The capturing yield of L4 (73.0–87.0%) were higher than that of L5. However, the capturing yield of Ca2+ did not increase with the increase of the stability constants of the ligands. As the Ca2+ needed to be captured and released in a dynamic equilibrium, the suitable stability constant of the ligands to Ca2+ was one of the important factors. It was also noteworthy that a complex with an extremely large stability constant was not beneficial to the formation of CaCO3 nanoparticles. It was also noted that the particle sizes of CaCO3 for L4 (1362 to 1467 nm) were the smallest among these ligands. Thus, L4 exhibited the best performance on the ion capturing yield and particle size. Although the size of the nanoparticles may be influenced by many factors including the temperature, stirring rate, liquid flow rate, solubility, etc., the stability of the complex that controls the concentration of Ca2+ released from the complex was one of the most important factors that then further controlled the formation rate and size of the CaCO3 particles (Figure 8).
Different ratios of nCa2+/nNaHCO3 were also investigated. Among these, L4 has been selected to investigate the best ratio of nCa2+/nNaHCO3 as it showed a max capturing yield when nCa2+/nL4 was 8:1. As shown in Table 3, it was clearly observed that the max capturing yield was 87.0% when the nCa2+/nNaHCO3 ratio was 0.363 under same conditions.
In Figure 7, it can be found that smaller particles accumulated to form large particles. L4 was chosen to demonstrate this. As shown in Table 4, the experiments were conducted with different concentrations of PASP under the optimal ratio (nCa2+/nL4 8:1, nCa2+/nNaHCO3 0.363). The results indicated that the PASP mainly affected the particle size of CaCO3, while the capturing yield of Ca2+ remained almost unchanged. The particle size of CaCO3 in the system without PASP addition was in the range of 1266–1467 nm, while after addition of PASP, the particle size of CaCO3 decreased to the range of 764.8–1011 nm. The results showed that the optimal amount of PASP was 500 mg/L in the present system. The results also indicated that PASP probably could react with CaCO3. As we all know, hydroxyl can be found on the surface of inorganic matter surfaces. Aspartic acid contains two carboxyl functional groups, which can react with the hydroxyl group on the surface of the CaCO3 particle to form more hydrogen bonds. It would inhibit the particles accumulating to form large particles, leading to small particle formation. A high content of additives could form more hydrogen bonds and show relatively small particles of CaCO3.

3.6. Controllable CaCO3 Particles Improved Oil Recovery

To investigate the role of particles to enchained oil recovery (EOR), L4 was selected for a simulated flooding experiment. As shown in Table 5, oil recovery reached 61.5% when the simulated formation water with L4 and PASP was injected, while it was 55.2% when the simulated formation water without additive was injected. In other words, L4 was an effective additive to improve EOR. It also demonstrated that the sustainability of Ca2+ in formation water was feasible. The results could be attributed to the interaction between L4 and the Ca2+ present in the formation water, resulting in the micro- or nano-sized agglomerated particles formation during presence of PASP. Once these particles entered the reservoir, they would flow and deposit in the pores, effectively pushing oil droplets forward to improve EOR. On the other hand, the surface of nano CaCO3 has more active functional groups like -OH, which would react with oil via hydrogen bond to change the interfacial tension [33,34]. It would benefit to improve EOR. Normally, it has a relatively high interfacial tension under high salinity condition. Hence, it needs to decrease the interfacial tension to improve EOR in formation water due to its high salinity. Normally, the rock surface properties would change from hydrophilic to lipophilic after long-term immersion in crude oil. It needed to change the wettability to enhance the oil film on the rock surface washing away. Tian et al. found that nanofluid changed the contact angle of oil film to improve EOR [34]. Therefore, micro- and nano-sized CaCO3 particles had a excellent performance to improve EOR (Figure 9).
The key process in this paper was controlled micro- and nano-sized CaCO3 particle formation. Then, when the particles entered the reservoir pores, they exhibited an affinity for oil droplets, which facilitated the displacement of oil droplets within the reservoir. In addition, the presence of these particles could improve pore structure and reduce oil entrapment (Figure 10). Therefore, the efficiency of oil recovery was improved.

4. Conclusions

The paper reported the resource utilization of Ca2+ in formation water. The resource utilization of Ca2+ in formation water was investigated by organic ligands. The synthetic multi-dentate ligands can effectively capture Ca2+ in formation water. Then, Ca2+ slowly released to form CaCO3 nanoparticles. Among the six ligands (L1 to L5), L4 had highest capturing yield and smallest particle size. And it was clearly observed that the max capturing yield was 87.0% when nCa2+/nNaHCO3 ration was 0.363 under same conditions. The particle size can be further controlled by PASP. Therefore, adding the ligands studied in this paper to highly mineralized formation water can make calcium ions form calcium carbonate particles of controllable size, thus improving the recovery rate. The flooding test demonstrated it was an effective method, improving the EOR from 55.2% to 61.5%. The results in this study gives a new pathway to utilize the Ca2+ in formation water and provides a new method for scale treatment in petrochemical industry.

Author Contributions

Conceptualization, B.H. and S.H.; methodology, Z.H.; validation, J.Z. and Z.H.; formal analysis, H.Y.; investigation, Y.T.; data curation, B.W.; writing—original draft preparation, H.Y.; writing—review and editing, Y.Z.; project administration, S.H. All authors have read and agreed to the published version of the manuscript.

Funding

This research was funded by the Sixth Batch of Open Fund Projects of the State Key Laboratory of Offshore Oil and Gas Exploitation and grants from the National Natural Science Foundation of China (U22B6005).

Data Availability Statement

Data are contained within the article.

Conflicts of Interest

Authors Bo Huang, Shengzhen Hou, Zhao Hua, Jian Zhang, Yuejun Zhu were employed by the company CNOOC Research Institute Co., Ltd. The remaining authors declare that the research was conducted in the absence of any commercial or financial relationships that could be construed as a potential conflict of interest.

Appendix A

Figure A1. MS results of complexes of Ca2+.
Nanomaterials 14 01452 g0a1aNanomaterials 14 01452 g0a1b

References

  1. Suleimanov, B.A.; Abbasov, H.F.; Ismayilov, R.H. Enhanced oil recovery with nanofluid injection. Pet. Sci. Technol. 2023, 41, 1734–1751. [Google Scholar] [CrossRef]
  2. Liang, T.; Hou, J.-R.; Qu, M.; Xi, J.-X.; Raj, I. Application of nanomaterial for enhanced oil recovery. Pet. Sci. 2022, 19, 882–899. [Google Scholar] [CrossRef]
  3. Pourabdollah, K. Matrix acidizing: A fouling mitigation process in oil and gas wells. Rev. Chem. Eng. 2020, 36, 311–331. [Google Scholar] [CrossRef]
  4. Mahmoodi, L.; Malayeri, M.R.; Tabrizi, F.F. Abatement of scale precipitation in oilfields using green scale inhibitors. J. Pet. Sci. Eng. 2022, 208, 109237. [Google Scholar] [CrossRef]
  5. Sun, H.; Liu, Y.; Liu, D.; Li, S.; Li, X.; Chen, H.; Han, Z.; Li, L.; Li, X. Enhanced removal of scaling cations from oilfield produced water by carrier mineral floatation. Water Sci. Technol. 2021, 84, 3629–3640. [Google Scholar] [CrossRef]
  6. Ituen, E.; Singh, A.; Li, R.; Yuanhua, L.; Guo, C. Nanostructure, surface and anticorrosion properties of phyto-fabricated copper nanocomposite in simulated oilfield descaling fluid. Surf. Interfaces 2020, 19, 100514. [Google Scholar] [CrossRef]
  7. Kamal, M.S.; Hussein, I.; Mahmoud, M.; Sultan, A.S.; Saad, M.A.S. Oilfield scale formation and chemical removal: A review. J. Pet. Sci. Eng. 2018, 171, 127–139. [Google Scholar] [CrossRef]
  8. Shafer-Peltier, K.; Kenner, C.; Albertson, E.; Chen, M.; Randtke, S.; Peltier, E. Removing scale-forming cations from produced waters. Environ. Sci. 2020, 6, 132–143. [Google Scholar] [CrossRef]
  9. Zhang, N.; Wang, X.; Zhang, J.; He, X.; Kang, S.; Pu, J.; Fan, S.; Li, X. Experimental and statistical study on wellbore scaling mechanisms and characteristics for Huanjiang oilfield. Geofluids 2022, 2022, 9068440. [Google Scholar] [CrossRef]
  10. Wang, H.; Dong, H.; Liu, X.; Zhang, P. Preparation and laboratory testing of polymeric scale Inhibitor colloidal materials for oilfield mineral scale control. Polymers 2022, 14, 4240. [Google Scholar] [CrossRef]
  11. Samimi, A.; Bagheri, A.; Dokhani, S. Solousion for corrosion reducing gas pipe line with inspection for preventing fouling in oil exchangers. Int. J. Basic Appl. Sci. 2013, 2, 291–301. [Google Scholar]
  12. Shen, C.; Zhao, Y.; Li, W.; Yang, Y.; Liu, R.; Morgen, D. Global profile of heavy metals and semimetals adsorption using drinking water treatment residual. Chem. Eng. J. 2019, 372, 1019–1027. [Google Scholar] [CrossRef]
  13. Liu, Y.; Wang, J.; Xu, Y.; Wu, B. A deep desalination and anti-scaling electrodeionization (EDI) process for high purity water preparation. Desalination 2019, 468, 114075. [Google Scholar] [CrossRef]
  14. Liu, Q.; Ren, J.; Lu, Y.; Zhang, X.; Roddick, F.A.; Fan, L.; Wang, Y.; Yu, H.; Yao, P. A review of the current in-situ fouling control strategies in MBR: Biological versus physicochemical. J. Ind. Eng. Chem. 2021, 98, 42–59. [Google Scholar] [CrossRef]
  15. Malaeb, L.; Le-Clech, P.; Vrouwenvelder, J.S.; Ayoub, G.M.; Saikaly, P.E. Do biological-based strategies hold promise to biofouling control in MBRs? Water Res. 2013, 47, 5447–5463. [Google Scholar] [CrossRef]
  16. Belattar, M.; Hadfi, A.; Ben-Aazza, S.; Karmal, I.; Mohareb, S.; El Housse, M.; Hafid, N.; Driouiche, A. Efficiency of one scale inhibitor on calcium carbonate precipitation from hot water sanitary: Effect of temperature and concentration. Heliyon 2021, 7, e06152. [Google Scholar] [CrossRef]
  17. Zhang, P.; Kan, A.T.; Tomson, M.B. Oil Field Mineral Scale Control. In Mineral Scales and Deposits; Elsevier: Amsterdam, The Netherlands, 2015; pp. 603–617. [Google Scholar] [CrossRef]
  18. Demadis, K.D.; Stavgianoudaki, N.; Grossmann, G.; Gruner, M.; Schwartz, J.L. Calcium-Phosphonate Interactions: Solution Behavior and Ca2+ Binding by 2-Hydroxyethylimino- bis (methylenephosphonate) Studied by Multinuclear NMR Spectroscopy. Inorg. Chem. 2009, 48, 4154–4164. [Google Scholar] [CrossRef] [PubMed]
  19. Mady, M.F.; Rehman, A.; Kelland, M.A. Synthesis and Antiscaling Evaluation of Novel Hydroxybisphosphonates for Oilfield Applications. ACS Omega 2021, 6, 6488–6497. [Google Scholar] [CrossRef] [PubMed]
  20. Jordan, M.M.; Williams, H.; Linares-Samaniego, S.; Frigo, D.M. New Insights on the Impact of High Temperature Conditions (176 °C) on Carbonate and Sulphate Scale Dissolver Performance. In Proceedings of the SPE International Oilfield Scale Conference and Exhibition, Aberdeen, UK, 14–15 May 2014. [Google Scholar] [CrossRef]
  21. Zhou, Y.; Luo, Z.; Xu, M.; Zhao, T.; Ma, X.; Zhou, S.; Wen, B.; Yang, D. Preparation and Properties of Temperature-Sensitive P(NIPAM-AM) Nano–Microspheres in Enhanced Oil Recovery. Energy Fuels 2023, 37, 204–213. [Google Scholar] [CrossRef]
  22. Wang, S.; Tang, Z.; Qu, J.; Wu, T.; Liu, Y.; Wang, J.; Liu, X.; Ju, Y.; Liu, F. Research on the mechanisms of polyacrylamide nanospheres with different size distributions in enhanced oil recovery. RSC Adv. 2021, 11, 5763–5772. [Google Scholar] [CrossRef]
  23. Shagymgereyeva, S.; Sarsenbekuly, B.; Kang, W.; Yang, H.; Turtabayev, S. Advances of polymer microspheres and its applications for enhanced oil recovery. Colloids. Surf. B 2024, 233, 113622. [Google Scholar] [CrossRef]
  24. Bu, X.; Jiang, K.; Wang, X.; Liu, X.; Tan, X.; Kong, Y.; Wang, L. Analysis of calcium carbonate scaling and antiscaling field experiment. Geothermics 2022, 104, 102433. [Google Scholar] [CrossRef]
  25. Kumar, T.; Vishwanatham, S.; Kundu, S.S. A laboratory study on pteroyl-l-glutamic acid as a scale prevention inhibitor of calcium carbonate in aqueous solution of synthetic produced water. J. Pet. Sci. Eng. 2010, 71, 1–7. [Google Scholar] [CrossRef]
  26. Duong, H.C.; Duke, M.; Gray, S.; Cooper, P.; Nghiem, L.D. Membrane scaling and prevention techniques during seawater desalination by air gap membrane distillation. Desalination 2016, 397, 92–100. [Google Scholar] [CrossRef]
  27. Chen, T.; Neville, A.; Yuan, M. Assessing the effect of on scale formation–bulk precipitation and surface deposition. J. Cryst. Growth 2005, 275, e1341–e1347. [Google Scholar] [CrossRef]
  28. Wang, Y.; Tian, J.; Han, H.; Sun, W.; Zhang, X. The enhanced flotation separation of magnesite and dolomite by introducing chelating reagent EDTA. Colloids. Surf. A 2024, 682, 132969. [Google Scholar] [CrossRef]
  29. Mahmoud, M.; Attia, M.; Al-Hashim, H. EDTA chelating agent/seawater solution as enhanced oil recovery fluid for sandstone reservoirs. J. Pet. Sci. Eng. 2017, 152, 275–283. [Google Scholar] [CrossRef]
  30. Sengupta, A.; Seitz, A.; Merz, K.M. Simulating the Chelate Effect. J. Am. Chem. Soc. 2018, 140, 15166–15169. [Google Scholar] [CrossRef]
  31. Larsen, T.; Randhol, P.; Lioliou, M.; Jøsang, L.O.; Østvold, T. Kinetics of CaCO3 Scale Formation During Core Flooding. In Proceedings of the SPE International Oilfield Scale Conference and Exhibition, Aberdeen, UK, 28–29 May 2008. [Google Scholar] [CrossRef]
  32. Gower, L.B.; Odom, D.J. Deposition of calcium carbonate films by a polymer-induced liquid-precursor (PILP) process. J. Cryst. Growth 2000, 210, 719–734. [Google Scholar] [CrossRef]
  33. Feng, S.J.; Zhao, J.F.; Gao, Y.L.; Yun, J.X. Polydopamine-CaCO3 modified superhydrophilic nanocomposite membrane used for highly efficient separation of oil-in-water emulsions. Colloids Surf. A 2022, 639, 128355. [Google Scholar] [CrossRef]
  34. Tian, K.P.; Pu, W.F.; Wang, Q.L.; Xie, M.K.; Wang, D.D.; Wang, M.M.; Liu, S. A Feasibility study on enhanced oil recovery of modified Janus nano calcium carbonate-assisted alkyl polyglycoside to form nanofluids in emulsification flooding. Langmuir 2024, 40, 4174–4185. [Google Scholar] [CrossRef] [PubMed]
Figure 1. The structures of different ligands.
Nanomaterials 14 01452 g001
Figure 2. The core displacement device.
Nanomaterials 14 01452 g002
Figure 3. Spectra of compounds, (a): FTIR results of ligands; (b): 1H NMR results of ligands.
Nanomaterials 14 01452 g003
Figure 4. The properties of uncontrolled scale. (a): XRD of Simulated scale; (b): scale size analysis.
Nanomaterials 14 01452 g004
Figure 5. The SEM-EDS of particles, (a): SEM result; (b): EDS result; (cf): C, Ca, O and Mg elements.
Nanomaterials 14 01452 g005
Figure 6. The possible coordination modes for L1–L5 with Ca2+ in H2O.
Nanomaterials 14 01452 g006
Figure 7. XRD and SEM for CaCO3 particles. (a): XRD of nano-CaCO3 under ligand control; (b,c): SEM of nano-CaCO3 under ligand control.
Nanomaterials 14 01452 g007
Figure 8. Particle size distribution plots, (a): different concentrations of L1; (b): different concentrations of L2; (c): different concentrations of L3; (d): different concentrations of L4; (e): different concentrations of L5.
Nanomaterials 14 01452 g008
Figure 9. Plot of injection pore volume versus oil recovery.
Nanomaterials 14 01452 g009
Figure 10. L4 displacement mechanism diagram.
Nanomaterials 14 01452 g010
Table 1. The composition of simulated formation water (mg/L).
Na+K+Ca2+Mg2+ClSO42HCO3Total
Mineralization
11,97713369526921,9391537035,397
Table 2. Ca2+ capturing yield and particle size by adding different additives.
Ligandsc(L) (mg/L)nCa2+/nLc(Ca2+) (mg/L)Capturing Yield (%)Particle Size (nm)
L112538.4:115067.41652
25019.2:114468.71896
5009.6:114269.01841
10004.8:115865.61653
20002.4:116564.11451
L212531.8:115267.01668
25015.9:115067.41539
5007.95:114368.91519
10003.98:116364.51698
20001.99:117761.41843
L312560:116364.51651
25030:116165.01614
50015:115765.81756
10007.5:115666.01687
20003.74:116564.11563
L412516.5:112473.01362
2508.22:16087.01467
5004.12:18082.61324
10002.06:17483.81266
20001.03:18082.51385
L512538.7:115765.81652
25019.4:115067.41632
5009.7:114369.01534
10004.84:115566.21654
20002.42:116065.41469
Table 3. Ca2+ capturing yield of L4 by using different nCa2+/nNaHCO3 rations.
EntrynCa2+/nL4nCa2+/nNaHCO3Capturing Yield (%)
18:10.726:172.3
28:10.363:187.0
38:10.181:181.2
48:10.09:178.4
58:10.045:161.2
Table 4. Effect of addition of PASP on Ca2+ capturing yield and particle size.
c(L4) mg/Lc(PASP) mg/LnCa2+/nnCa2+/nNaHCO3Capturing Yield (%)Particle Size (nm) without PASPParticle Size (nm) with (PASP)
2501258:10.363:183.21362997.6
2502508:10.363:184.01467929.6
2505008:10.363:185.11324764.8
25010008:10.363:184.612661011
25020008:10.363:185.21385943.2
Table 5. Experimental data of core displacement experiment.
Core Flooding SetupCore Length/cmCore
Diameter/cm
Effective
Porosity/%
Permeability
/mD
Porosity/%Oil
Recovery/%
Simulated
water
102.520.419.5220.554.6
102.520.619.6921.655.2
Simulated
Water + L4
102.520.919.8921.360.3
102.521.520.0122.561.5
Disclaimer/Publisher’s Note: The statements, opinions and data contained in all publications are solely those of the individual author(s) and contributor(s) and not of MDPI and/or the editor(s). MDPI and/or the editor(s) disclaim responsibility for any injury to people or property resulting from any ideas, methods, instructions or products referred to in the content.

